
Abstract
Social prejudice, family nonacceptance, and lack of marriage or adoption rights often restrict the formation of conventional social ties among LGBT older adults. As a result, they often rely on families of choice constituted by other LGBT/age peers for support. Using a series of regression analyses with a national sample of LGBT older Americans, this study investigated how characteristics of social network structure (size and composition - LGBT vs. non-LGBT identity and age ≥50 vs. < 50) were related to LGBT older adults’ social network function (perceived social support). Larger social networks, especially those composed of LGBT members and older adults, were associated with more perceived social support. In subgroup analyses, larger social networks composed of more LGBT members and older adults were associated with more perceived social support among lesbian and gay respondents. For bisexual + older adults, larger social network size was associated with more perceived social support, but social network composition was not related to more perceived social support. For transgender older adults, neither social network size nor network composition were significantly associated with perceived social support. This study demonstrated that having more people with similar characteristics in their social networks cues LGBT older adults about the availability of social support. Findings may inform strategies for tailoring programs intended to maintain and strengthen LGBT older adults’ social support networks.
As social beings, humans are dependent on each other at all stages of the life course. There is a well-developed scientific literature documenting the beneficial effects of social relationships for health and longevity (Holt-Lunstad et al., 2010; Santini et al., 2015). According to the Convoy Model of Social Relationships, the network of social relationships surrounding an individual is characterized by its structure and function (Antonucci et al., 2009; Kafetsios & Sideridis, 2006). The number (size) and type (composition) of people in one’s social network are structural aspects of social networks; the expectation and flow of support between individuals are functional aspects of social networks. Social and cultural factors determine the formation of social networks and the perception of social support available to network members.
The social network characteristics of the present generation of Lesbian, Gay, Bisexual+, and Transgender (LGBT) older adults is not well-understood. LGBT older adults spent a significant portion of their lives during a time when homosexuality was ostracized, criminalized, and pathologized. As a consequence, their social networks were likely conditioned by these contextual factors. This study contributes to the scientific literature by examining how the structural (size and composition) and functional (perceived social support) characteristics of LGBT older adults’ social networks are related to each other.
LGBT older adults’ social network structure - size and composition
Human beings organize and govern themselves through social norms, conventions, and commonly agreed upon rules that, in turn, condition many aspects of their lives, including their social networks. The family is the basic unit of social organization in society (Waite, 2000). Marriage, sanctioned by the state and religious organizations, is a formative force behind family units. A network of multigenerational social relationships, beginning from the family of origin and then often followed by marriage and procreation, accompanies most individuals throughout their lives. Until recently, many LGBT older Americans were denied the right to marriage and children, impacting their ability to establish families in ways that heterosexual individuals take for granted. LGBT older adults continue to be at risk of estrangement from their families of origin due to stigmatization and non-acceptance (Knauer, 2016).
As the saying goes, “birds of a feather flock together,” and the social networks of human beings tend to be relatively homogenous (McPherson et al., 2001). Unlike other marginalized groups, such as women, racial and ethnic minorities, and religious minorities, LGBT people, especially children, may not have other LGBT individuals in their families of origin or their immediate social circles to look up to or receive guidance from on how to manage their identity. Furthermore, societal and internalized homophobia may interfere with their identity development (D’Augelli, 1994), delaying opportunities to experience social integration. Overcoming hurdles due to homophobia and coming to terms with one’s identity is a significant milestone for LGBT persons, including older adults. Being open about their sexuality and gender identity provides opportunities to meet people with similar experiences and become part of the LGBT community.
LGBT older adults may substitute the absence of conventional ties with families of choice created by queer friendship, love, and community and, in the process, increasing the presence of similar others in their social networks (Breder & Bockting, 2022). Two studies involving national samples report that 50 to 60% of LGB older adults’ networks were composed of other LGBT individuals (Grossman et al., 2000; Masini & Barrett, 2008). Also, because societies are generally age segregated and people are drawn together by shared cohort experiences, LGBT older adults’ families of choice may also be age homogenous. In Grossman et al. (2000) study, nearly half of LGBT older adults’ social network members were older than 60 years of age and three-quarters of these network members were older than 50 years of age. However, both studies asked LGBT older adults to report up to eight or ten members in their social networks, which may underestimate the true size and composition of their social networks, many of these relationships may be characterized as weaker peripheral ties. In a study of LGBT older adults’ social network typologies, social networks that are friend-focused and contain no children were more common than family-focused social networks, pointing to the potential selection of LGBT friends and age peers into their social networks observed in the earlier studies (Kim et al., 2017).
Association between LGBT older adults’ social network structure and function
Individuals are linked to their network members through a web of interpersonal ties. At the core, these social ties are formed and reinforced by the exchange of tangible and intangible resources that take the form of emotional, informational, and instrumental support (Antonucci et al., 2011). The feeling that one can turn to someone for help when needed may itself bring a sense of security and help a person cope with challenges more effectively. Thus the perceived availability of social support, a functional domain of social networks, need not always be associated with the actualization of support; this is reflected in the moderate correlation (.35) between the two constructs as observed in a meta-analytic review (Haber et al., 2007). The perception of support may assume heightened importance in later life when the need for social support may increase due to greater risk of health decline, disability, and dependence (Gurung et al., 2003).
Social support is harnessed from members of one’s social network, so the size and composition of social networks may determine the level and expectations of social support. In the general population, people with larger and more diverse social networks tend to perceive significantly more social support (Harasemiw et al., 2018; Peirce et al., 2000). However, social ties do not always necessarily translate into social support, and there is extensive variation in the strength of the associations between social network size, composition, and perceived social support. For example, African Americans perceive less social support from smaller social networks than White Americans (Flores et al., 2020). However, Black Americans’ network ties tend to be more familial and stronger, whereas White Americans have more friend-focused weak ties in their social networks (Hedegard, 2018).
Grossman et al. (2000) observed that LGB older adults’ satisfaction with social support was positively correlated with social network size. Some qualitative studies indicate that LGBT older adults may feel more supported by chosen family members and friends, usually constituted by LGBT members, than family of origin network members (Boggs et al., 2017). Due to the generational divide, LGBT older adults may also not be as reliant on younger network members as their age peers (Boggs et al., 2017). Thus, having both more LGBT persons and older people in their social networks may help them to feel more supported. However, in Grossman et al. (2000) study, network members’ sexual orientation and age had no effect on LGBT older adults’ social support. It should be noted that the authors did not control for other variables that may potentially confound the relationship, a limitation overcome in the present study.
LGBT subgroup differences
The LGBT community is diverse and demonstrates significant subgroup differences in multiple aspects conditioned by their unique life experiences. Due to the gendered nature of socialization, women generally are more advantaged than men in their social support networks, which is also observed in the LGBT community (Erosheva et al., 2016; Grossman et al., 2000; McLaughlin et al., 2010). Compared to lesbian women, gay men have smaller social networks, probably because they are less likely to be married or have children and are disproportionately affected by the loss of network members due to HIV/AIDS (Kittle et al., 2022). Lesbian women thus tend to feel more supported than gay men, given their relatively larger social networks (Fredriksen-Goldsen et al., 2012). Compared to gay and lesbian older adults, bisexual+ and transgender individuals experience greater health disparities (Fredriksen-Goldsen et al., 2013) that may also be reflected in their social resources. Indeed, bisexual + older adults seem to perceive less social support than their lesbian and gay counterparts (Fredriksen-Goldsen et al., 2011, 2012), whereas transgender individuals perceive significantly less social support than cisgender LGB members even though they have larger social networks (Erosheva et al., 2016; Fredriksen-Goldsen, Cook-Daniels, et al., 2014). Bisexual+ and transgender individuals may perceive less social support from their network members because they are less accepted by heterosexual, gay, and lesbian individuals (Mulick & Wright, 2002; Weiss, 2011). However, studies that observed subgroup differences regarding social network size and perceived social support are based on descriptive research designs that did not consider other potential explanatory variables driven by existing theory.
Theoretical perspectives
According to the Convoy Model of Social Relations, a set or convoy of social ties that includes family, friends, and other relationships accompanies individuals across the life course (Antonucci & Akiyama, 1995). One of the premises of the theory is that individuals’ personal (gender, race, socio-economic status) and situational (role expectations, cultural norms) characteristics determine the size, composition and function of their convoy of social relationships (Antonucci et al., 2013). For example, women tend to have larger social networks than men, and Black Americans may have smaller, more family-focused social networks than White Americans (Ajrouch et al., 2001; McLaughlin et al., 2010).
The Health Equity Promotion Model, a framework developed for understanding LGBT older adults’ health over the life course, also argues that historical and environmental forces associated with LGBT older adults’ social position as a minority group shape their family structures and social support networks (Fredriksen-Goldsen, Simoni, et al., 2014). Factors, such as social taboos and lack of marriage equality, may have uniquely shaped the social networks of LGBT older adults, while driving subgroup differences within the LGBT community.
The Convoy Model also postulates that the structure of social networks may act as a conduit through which social support flows, when needed (Antonucci et al., 2009). This theoretical proposition is supported by empirical evidence, which shows a statistically significant positive association between social network size, composition, and perceived social support (Harasemiw et al., 2018; Peirce et al., 2000).
According to the Theory of Homophily, people tend to connect and associate with other persons who have similar characteristics (McPherson et al., 2001). The similarity of identity and life experience enhances group cohesion, along with providing a sense of belonging and feeling supported. Research shows that among members of religious and racial/ethnic minority groups, the higher the degree of homophily in their social networks, the stronger the perceived sense of social support (McGaskey et al., 2016; Merino, 2014). Sexual minority individuals may also feel more supported by LGBT network members, and that is probably why their social support providers tend to be of the same sexual orientation as themselves (Frost, 2016).
Current study
Based on these theories and the empirical evidence discussed above, it is expected that larger social networks composed of more LGBT persons and composed of older network members are associated with more perceived social support among LGBT older adults. The following hypotheses are addressed in this study (see Figure 1): Conceptual model for the association between social network size, composition and perceived social support with differences between LGBT subgroups. Note. L: cisgender lesbian women; G: cisgender gay men; B: cisgender bisexual + individuals; T: transgender individuals.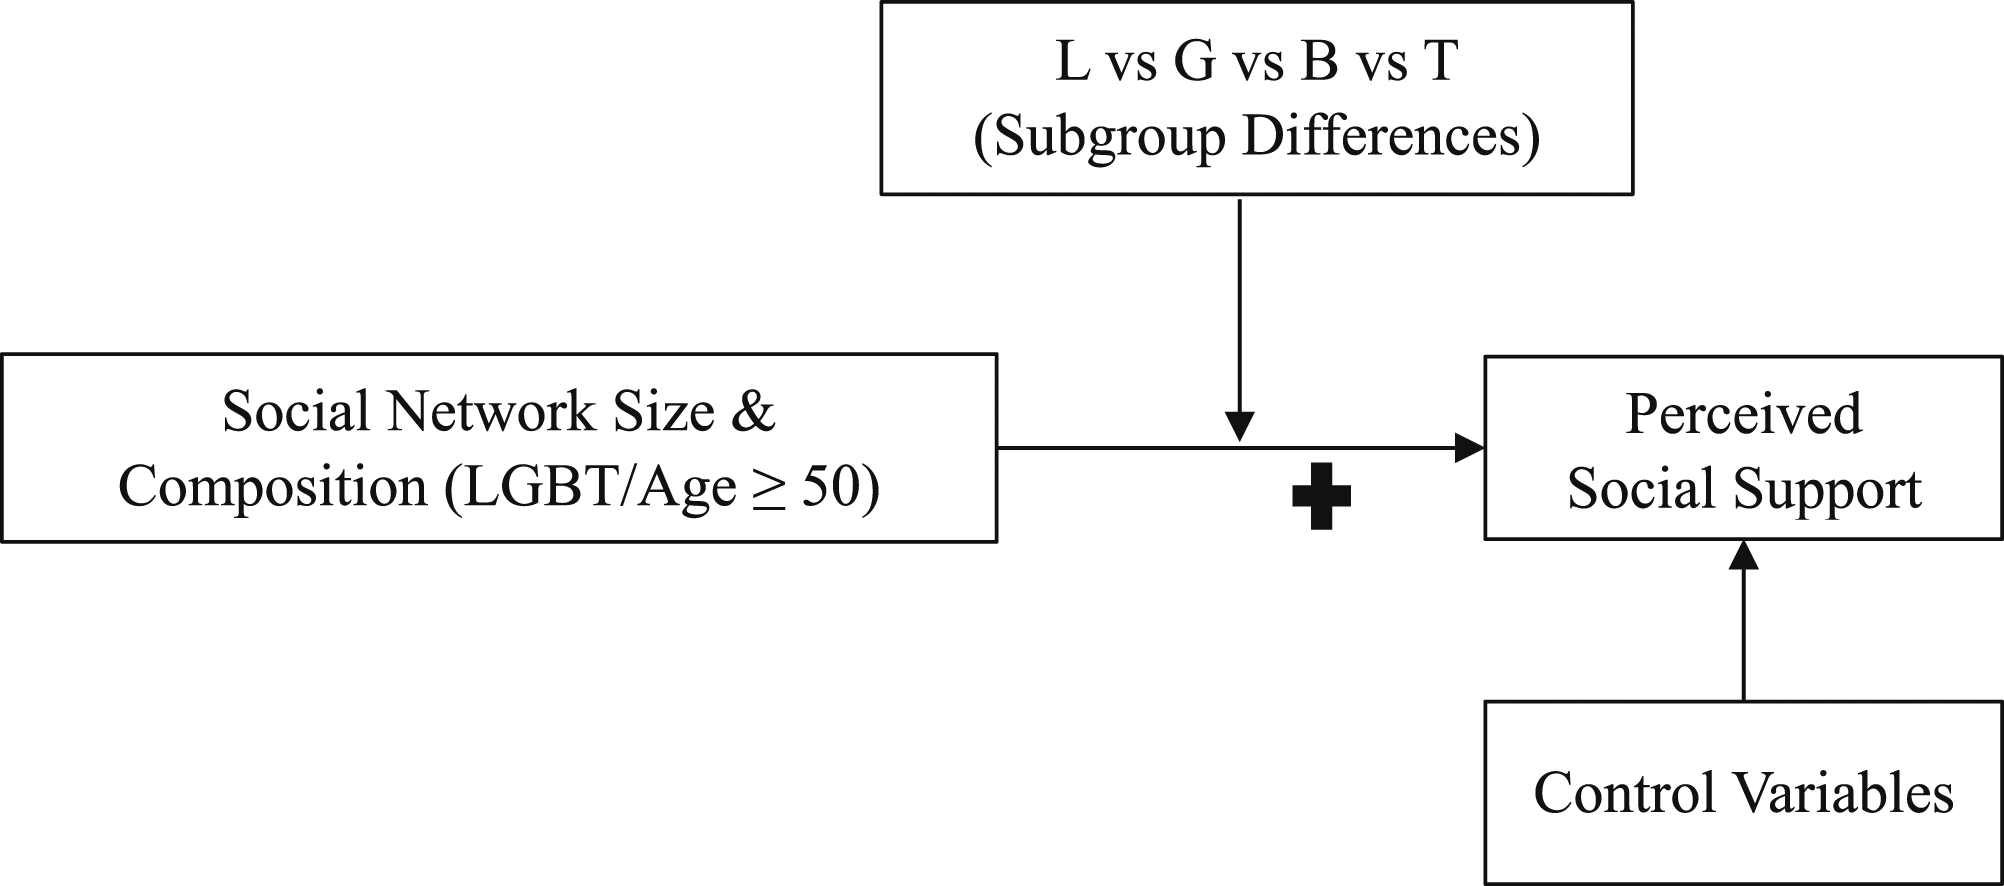
Larger social networks are associated with more perceived social support among LGBT older adults.
LGBT older adults perceive more social support from LGBT social network members than non-LGBT social network members.
LGBT older adults perceive more social support from older than younger social network members. In supplementary analyses, we explore if the strength of the associations varies among lesbian, gay, bisexual+, and transgender individuals. Since bisexual+ and transgender may experience bias within the LGBT community, in addition to the bias that lesbian and gay individuals experience from the heteronormative society (Mulick & Wright, 2002), we hypothesize that the strength of the association between social network size and composition and perceived social support is weaker among bisexual+ and transgender individuals compared to lesbian and gay older adults. Potential confounder and control variables for the association between social network size and social network composition and perceived social support are included in the model specifications (below). Although findings from empirical studies are often equivocal, some studies show that demographic factors are associated with social network characteristics (Adamczyk, 2016; Ajrouch et al., 2001, 2005; Prezza & Giuseppina Pacilli, 2002). Therefore, age, race/ethnic group identity, education, employment status, and income are included in the models. In addition, being married or partnered and having children may be associated with social support network characteristics (Adamczyk, 2016). Finally, older adults’ self-rated health is included because health status may impact individuals’ social abilities, self-reliance, and need for support.
Methods
Data source and study sample
To test our hypotheses, we examined data from the Aging with Pride: National Health, Aging, and Sexuality/Gender Study (NHAS), a survey of LGBT Americans aged 50 years and older. The NHAS is based on a purposive sample design with respondents recruited from 11 community-based agencies from across the United States, with some agencies serving older adults, in general, and some agencies specifically serving LGBT older adults (Fredriksen-Goldsen & Kim, 2017). Between June and November 2010, the survey questionnaire was either mailed or sent electronically by the participating agency to their clientele along with an invitation letter. A reminder was sent two weeks after the initial contact and a second reminder was sent two weeks after the first reminder. About 63% of the mailed surveys were returned, meeting the inclusion criteria. The number of returned paper and electronic questionnaires from LGBT responders was 2,201 and 359, respectively (N = 2,560). After applying listwise deletion to handle missing data, the final study sample size was 2,099.
Descriptive statistics for the study sample and bivariate associations between perceived social support and social network size, LGBT-age composition, and the control variables.
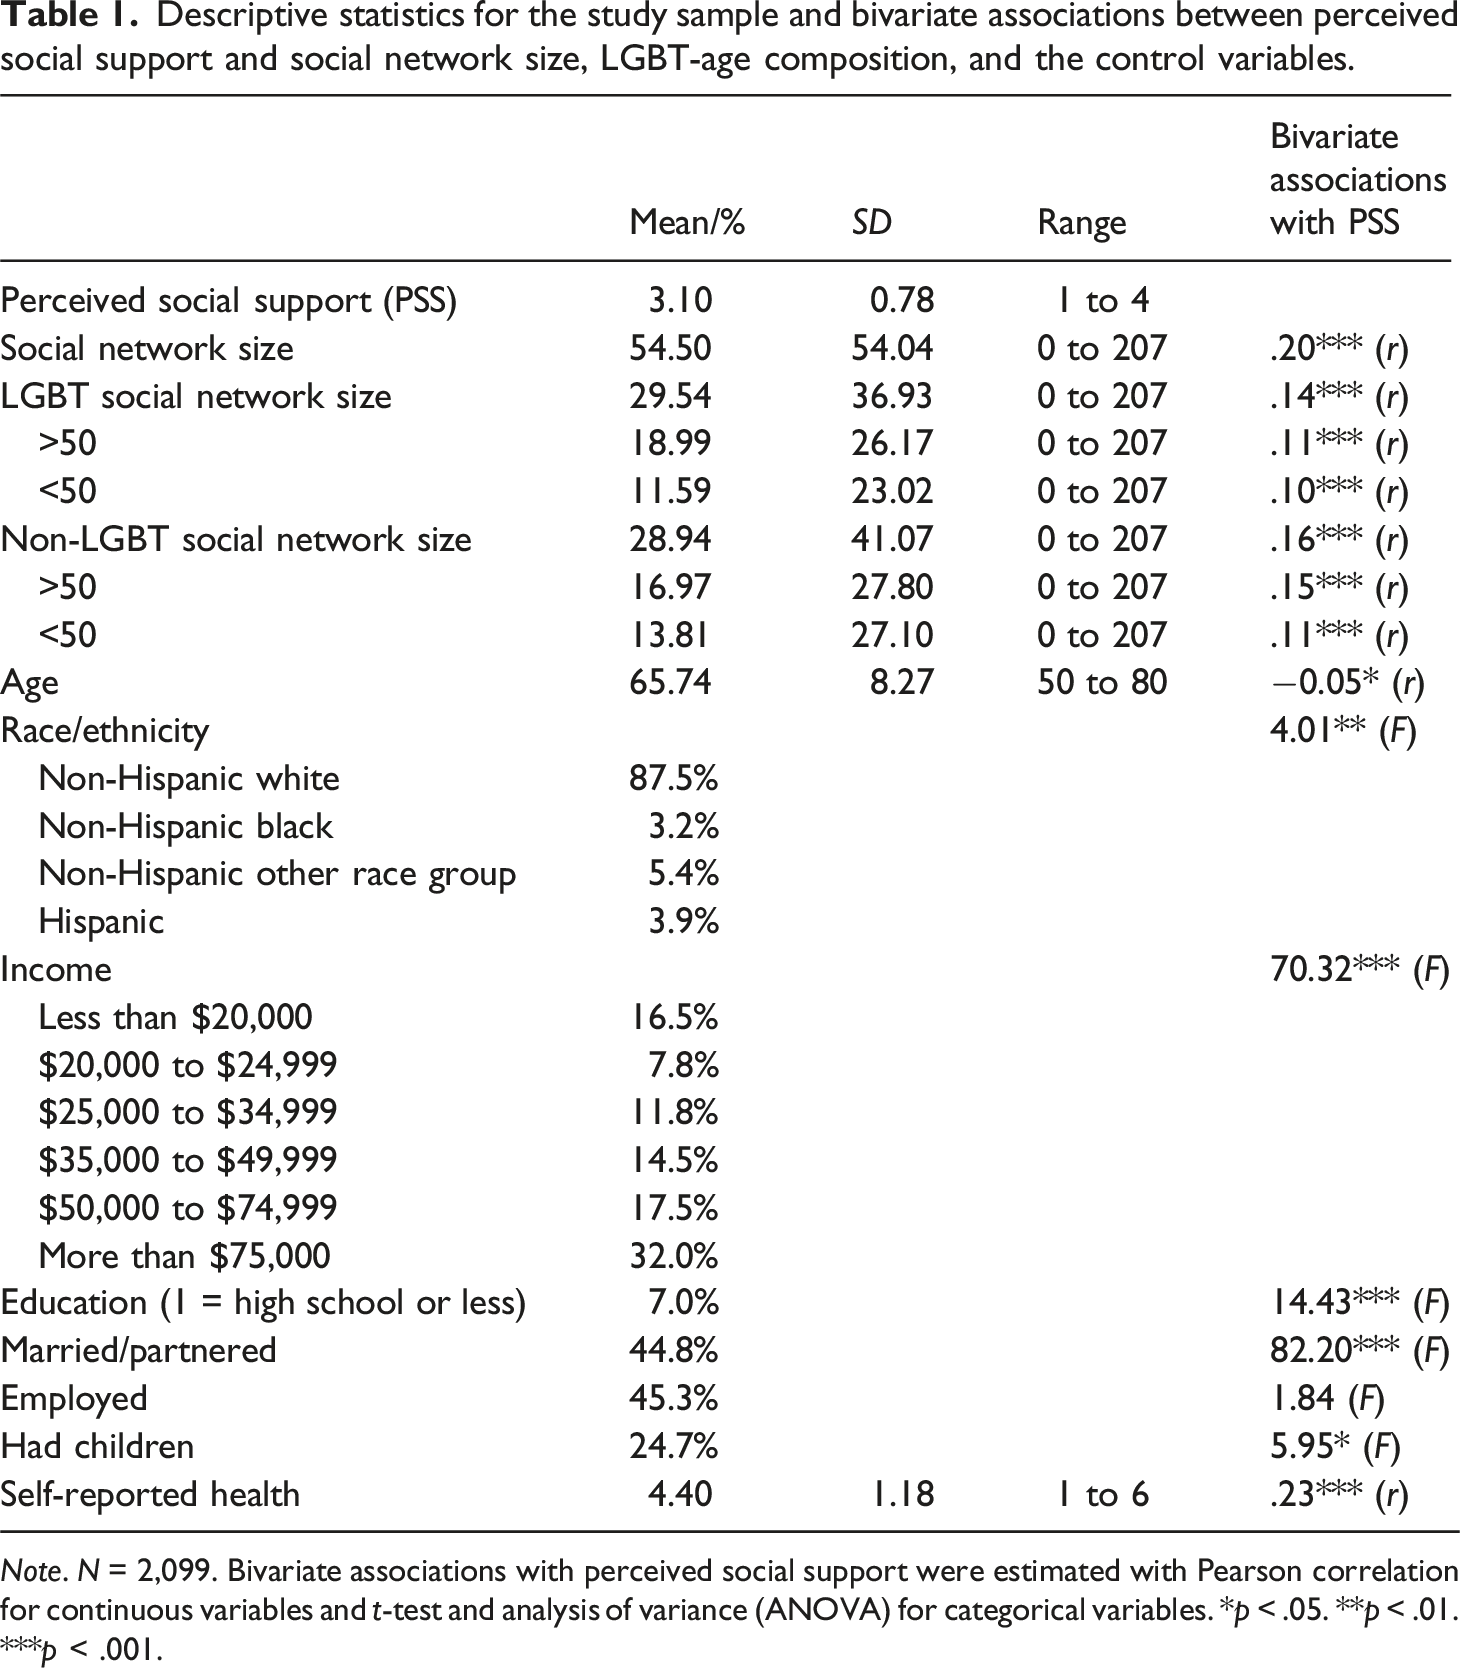
Note. N = 2,099. Bivariate associations with perceived social support were estimated with Pearson correlation for continuous variables and t-test and analysis of variance (ANOVA) for categorical variables. *p < .05. **p < .01. ***p < .001.
Measures
Perceived Social Support is the dependent variable and is measured with the mean of four items that assess respondents’ perception of how frequently someone would be available to provide them with various forms of social support. The four items were: “Someone to help with daily chores if you were sick,” “Someone to turn to for suggestions about how to deal with a personal problem,” “Someone to do something enjoyable with,” and “Someone to love and make you feel wanted.” Each item was scored on a four-point scale (1 = never, 2 = seldom, 3 = usually, 4 = always). The measure was set to missing if a respondent was missing data on more than two items.
Social network size and LGBT/age composition
Respondents were asked to report the number of people (e.g., friends, family members, colleagues, and neighbors) with whom they interacted in a typical month (including talking, visiting, and exchanging phone calls or emails) for each of five categories – gay men, lesbian women, bisexual individuals, transgender individuals, heterosexual individuals; these were further grouped into two age groups - age 50 years or older and younger than age 50 years for a total of ten categories. The overall social network size was calculated by summing across all ten categories. To account for potential bias due to extreme outliers, the overall social network size was top-coded at three times the median. In a sensitivity analysis, social network size was also measured as quartiles (results discussed below).
Further, social network composition was measured by dividing overall social network size into two groups based on network members’ LGBT identity: 1) LGBT social network size and 2) non-LGBT social network size. The LGBT and non-LGBT social network sizes were further grouped by age: 1) 50 years or older and 2) younger than 50 years. Social network size measured by LGBT identity and age were top-coded, using the same strategy as for the total social network size, to account for the possibility that some respondents may have network members disproportionately concentrated in one of the subgroups. In another sensitivity analysis, respondents’ LGBT social network composition was also assessed by an alternative measure obtained by dividing LGBT social network size by the overall social network size (results discussed below).
LGBT identity
Respondents were asked to report their sexual orientation by selecting from a list of options that included – gay, lesbian, bisexual, heterosexual or straight, and “other.” Respondents were also asked if their sex was male, female, or “other,” and if they identified as transgender. For subgroup analyses, sexual orientation, sex, and transgender responses were used to stratify the respondents into four subgroups – cisgender gay men (N = 1,207), cisgender lesbian women (N = 624), cisgender bisexual + individuals (N = 112), and transgender individuals (N = 145). Respondents who identified their sexuality as “other” were classified under the bisexual + category, a broader non-monosexual category. Respondents who identified their sex as “other” or those who identified as transgender were classified under the transgender category. Due to small sample sizes, bisexual + respondents were not categorized as bisexual + men and bisexual + women, and similarly, transgender respondents could not be categorized as transgender men or transgender women. Eleven respondents had missing information on sexuality and gender questions and they were excluded from the stratified sample subgroup analyses.
Control variables
Age is measured in years; however, to ensure confidentiality respondents who were 80 years and older were top-coded at 80 years or older (range = 50–80+). Race and ethnic status are coded as a set of dichotomous variables for the regression analyses - non-Hispanic White (reference); non-Hispanic Black; non-Hispanic other race groups; and Hispanic (any race). Education is coded as a dichotomous variable (1 = high school or less, 0 = some college or more). Income is specified as a set of dichotomous variables: less than $20,000, (reference); $20,000 to $24,999; $25,000 to $34,999; $35,000 to $49,999; $50,000 to $74,999; more than $75,000). Employment status is measured as a dichotomous variable (1 = employed, 0 = not employed). Marital/partnership status is measured as a dichotomous variable (1 = married or partnered; 0 = not married or not partnered). Whether respondents reported any children is also coded as a dichotomous variable (1 = had at least one child, 0 = had no children). Self-rated health is measured on a scale from one to six, with higher scores indicating better health.
Analytic strategy
Descriptive statistics for the study sample followed by bivariate analyses for perceived social support, social network size and composition and the control variables are provided. A series of linear regression models were estimated with perceived social support as the outcome variable. In model 1, the independent variable was the overall social network size (Hypothesis 1); in model 2, the overall social network size was characterized by LGBT composition, i.e., as the number of LGBT and non-LGBT members (Hypothesis 2); in model 3, the number of LGBT and non-LGBT network members was further disaggregated into two age groups: 50 years old or older and younger than 50 years of age (Hypothesis 3). All models included the full set of control variables. Standardized beta coefficients are reported to show the relative strength of the associations between perceived social support and social network size, composition, and the control variables. Data preparation and all analyses (descriptive statistics, and bivariate comparisons, and regression analyses) were performed using SPSS Version 27.
Results
Descriptive analyses
Descriptive characteristics for the full study sample are reported in Table 1. Based on a scale ranging from never to always, respondents, on average, perceived that social support is usually available, when needed. On average, respondents indicated they had 54 members in their social network, composed almost equally of LGBT and non-LGBT network members. Among the LGBT and non-LGBT social network categories, on average, there were more network members in the 50 years and older age group than in the under 50 years old group. Bivariate associations with perceived social support are also reported in Table 1. Social network size - total and categorized by LGBT identity and age composition - all showed a significant positive correlation with perceived social support. All control variables, except employment status, showed a statistically significant bivariate association with perceived social support.
Linear regression analyses
Liner regression results for the association (β) between perceived social support and social network size along with LGBT-age composition among LGBT older adults.
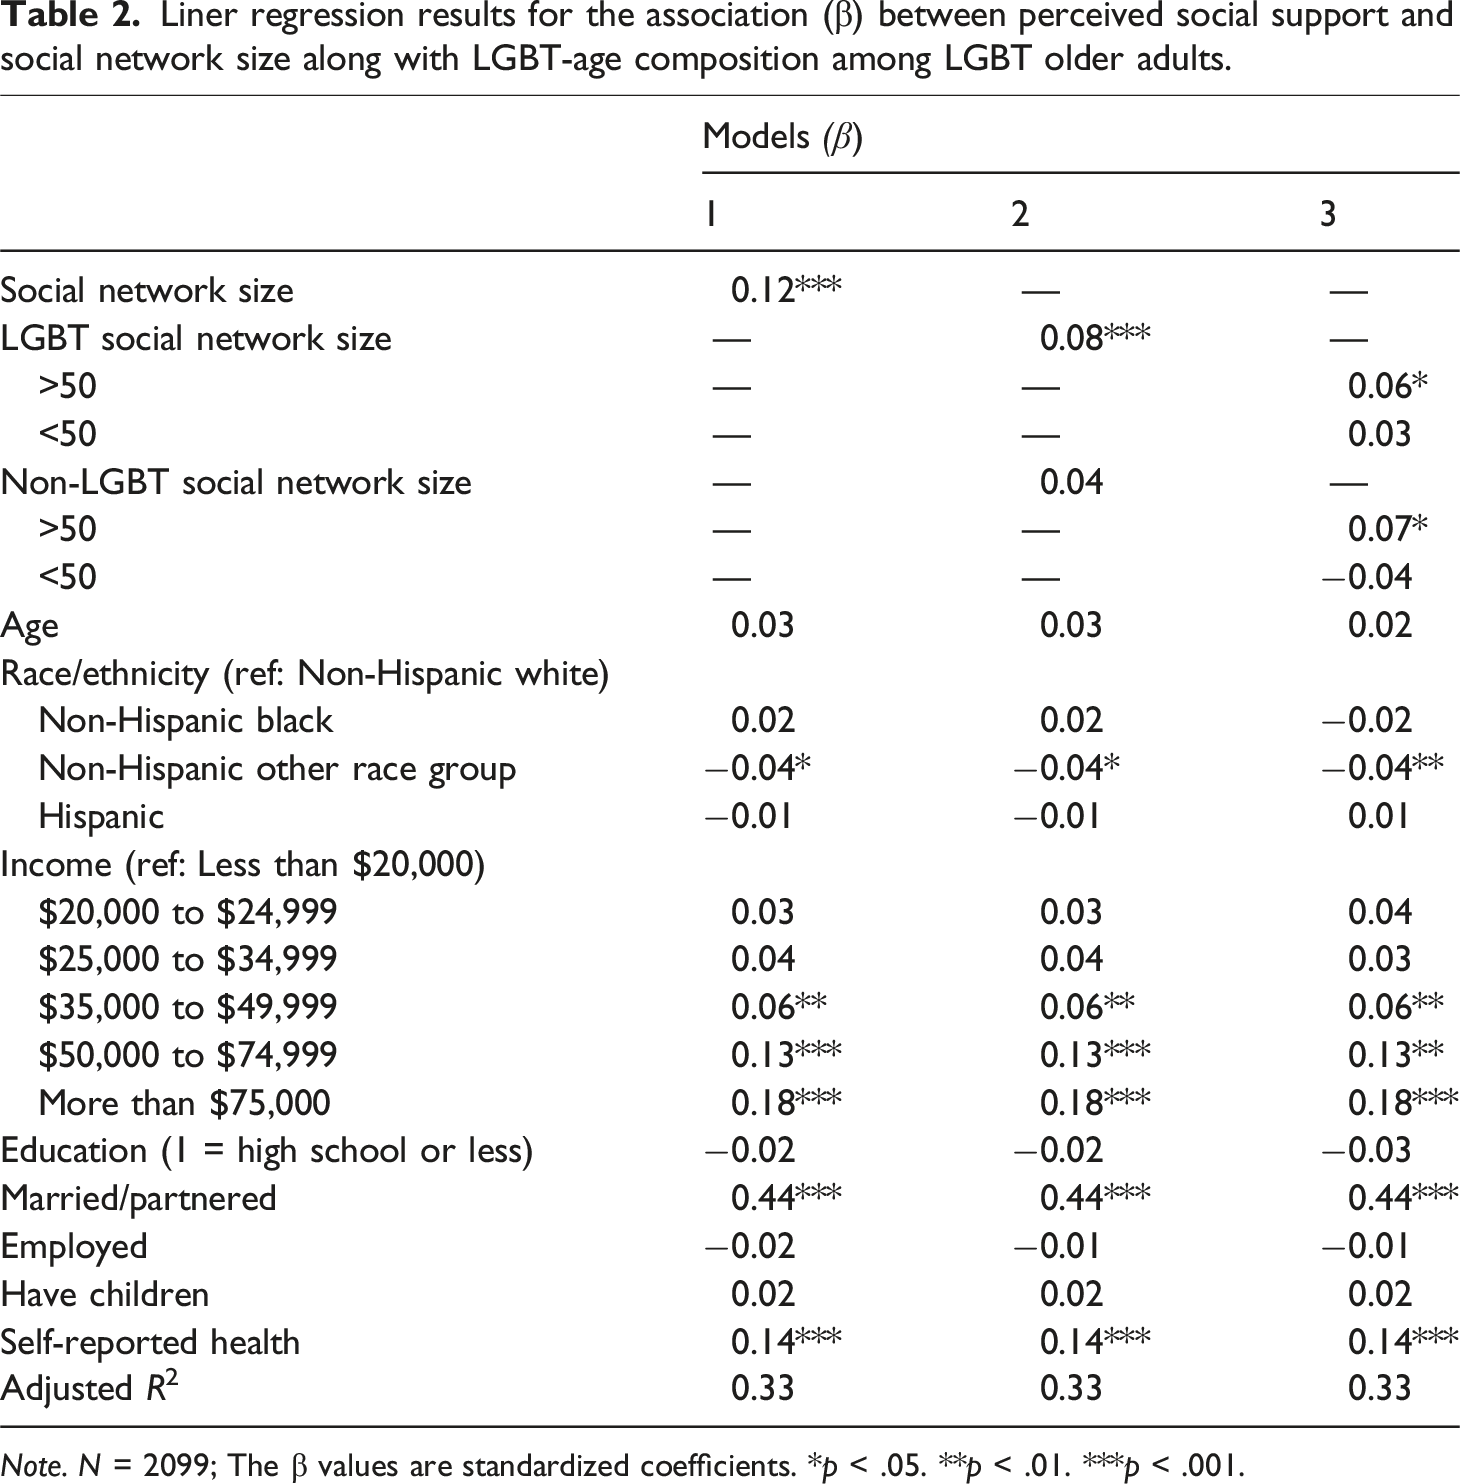
Note. N = 2099; The β values are standardized coefficients. *p < .05. **p < .01. ***p < .001.
Regarding the relationship between the covariates and perceived social support (from Model 1), LGBT older adults in the non-Hispanic other race group perceived significantly less social support (β = −0.04, p = .03) compared to their non-Hispanic White counterparts. Compared to respondents in the lowest income group, those in the highest three income groups perceived significantly more social support (β = 0.06, p = 08; β = 0.13, p < .001; β = 0.18, p < .001, respectively). Married and partnered respondents reported more perceived social support than those who were not married or partnered (β = 0.44, p < .001). Also, higher self-rated health was related to more perceived social support (β = 0.14, p < .001). Based on the adjusted R-square values, approximately 33% of the variation in perceived social support was accounted for across the models.
Sensitivity analyses
As noted above, we performed two sensitivity analyses for the main model 2: Supplementary model 1 included overall social network size and the proportion of social network members who were LGBT; Supplementary model 2 contained overall social network size specified as a set of quartiles and the proportion of social network members who were LGBT. The significance of the proportion of respondents’ social networks who were LGBT in supplementary model 1 (β = 0.06, p = .002) and 2 (β = 0.08, p < .001) and LGBT older adults in higher quartiles of social network size perceiving significantly more social support compared to those in first quartile in supplementary model 2 (p < .001) showed that the results from our main analyses (Table 2) are robust against alternate forms of measuring social network size and composition (Supplemental Table 2).
The distribution of perceived social support is slightly skewed (skew = −0.62); therefore, sensitivity analyses were performed with perceived social support transformed into a quadratic term (skew = −0.19). The direction and significance of the beta coefficients were relatively stable when perceived social support was specified in its quadratic form (results for the quadratic form of perceived support are available upon request). These findings show that the regression results are not biased due to non-normal distribution.
Supplementary LGBT subgroup analyses
The supplementary subgroup analyses provided descriptive (Supplemental Table 3) and bivariate statistics (Supplemental Table 4) stratified for cisgender gay men, cisgender lesbian women, cisgender bisexual+, and transgender respondents. For cisgender gay, cisgender lesbian, and transgender respondents, there were more people like them in their social networks than any other subgroup members of the LGBT community and the members were also more likely to be older than younger. Cisgender bisexual + respondents had more gay and lesbian members in their social networks than bisexual members, but they were also likely to be older. Transgender respondents had the largest social networks followed by lesbian, bisexual+, and gay respondents. Compared to gay and lesbian respondents, bisexual+ and transgender respondents perceived less social support. Social network size and most forms of social network composition had significant positive bivariate associations with perceived social support among cisgender gay, lesbian, and bisexual + respondents but no significant associations were found for transgender older adults.
Three models from the main analyses were estimated separately for the four LGBT subgroups (Supplemental Table 5). For cisgender gay men (Panel A) and lesbian women (Panel B), larger social network size and having more LGBT and older people in their social networks were associated with more perceived social support. Cisgender bisexual+ (Panel C) respondents’ social network size was positively associated with perceived social support, but the LGBT and age composition of the social networks showed no significant association. For transgender individuals (Panel D), there were no significant positive relationships between any of the social network measures and perceived social support.
To further examine the hypotheses regarding homophily, additional models were estimated, where each subgroup of LGBT older adults’ social networks were structured as their own subgroup and the remaining network members were placed into a residual group. For example, cisgender gay men’s social networks were categorized into gay and non-gay social networks further categorized by age group. The other LGBT groups’ social networks were categorized similarly. These additional models showed no consistent pattern of associations with perceived social support as was the case for overall LGBT and age compositions.
Discussion
This study is among the first to have systematically examined the association between social network size, social network composition and perceived social support among LGBT older adults. The results from this study demonstrated that LGBT older adults had extensive social networks constituted of LGBT and heterosexual members with diverse age group representation. However, as predicted by the Theory of Homophily (McPherson et al., 2001), LGBT older adults’ networks were somewhat more likely to contain members who were like them in terms of their sexuality, gender identity, and age group. As hypothesized by the Convoy Model of Social Relationships, and as documented for studies of the general population, as well (Peirce et al., 2000), LGBT older adults with larger social networks reported more perceived social support. As derived from the Theory of Homophily, LGBT older adults reported they perceived more support from LGBT network members compared to heterosexual network members. Perceiving more support from LGBT and heterosexual network members was more likely to be expected from older as compared to younger network members.
Human beings are often faced with various health, financial, and social challenges as they age. Different types of support may be needed to face these varied challenges. For example, a health issue may require hands-on caregiving, informational support may be necessary for resolving an issue less-often faced when people are younger, and emotional support may be needed when grieving the loss of a loved one. Being embedded in a larger social network may increase the chances that there are members who are capable of providing the types of social support needed. Since it is less normative, receiving support from family of choice and age peers, which is typically seen among LGBT older adults (Boggs et al., 2017), can feel burdensome to the supporting member. But if the support responsibility is shared across members from a larger social network, LGBT older adults may continue to feel supported. It may not be practical to maintain strong bonds with all the members in a large social network. However, weaker and peripheral ties in large social networks are documented to be beneficial, possibly contributing to stronger perceived social support (Granovetter, 2003).
As framed by the Health Equity Promotion Model (Fredriksen-Goldsen, Simoni, et al., 2014), LGBT older adults, by virtue of their identity, may encounter unique challenges but also develop resilience and resources that may enable them to approach aging-related challenges from a different perspective. Having other LGBT individuals in their social networks may promote the exchange of information necessary for navigating their unique life circumstances. LGBT older adults may hesitate to seek support from family members due to fear of nonacceptance (Barker, 2006). Even if family of origin members accept the sexuality or gender identity of LGBT older adults, they may not be able to extend the kind of support needed that comes only from experiential understanding. In addition, a shared identity may make it easier for LGBT older adults to trust and bond with LGBT community members. Therefore, social networks that contain more LGBT individuals may help older LGBT adults feel more supported. However, LGBT older adults may still value the support they receive from other non-LGBT family and friends. Unlike network members from younger generations, older network members have first-hand insight into how LGBT older adults had to endure a more hostile social environment in the past. With this insight, older network members may be better equipped to support LGBT older adults; this may be one explanation for why LGBT older adults feel more supported by older network members than younger network members.
Unlike gay and lesbian respondents who perceived more social support from social networks that were larger and more homophilous with their sexuality and age, bisexual + respondents’ social network size, but not composition, was associated with perceived support. Despite being a majority group in the LGBT community, bisexual + individuals are often less visible than their gay and lesbian counterparts, which is also reflected in their smaller size in our sample (Dworkin, 2006; Gates, 2011). In part, this veil of invisibility may explain why there were fewer bisexual members than gay and lesbian members in bisexual + respondents’ social networks (see Supplemental Table 3). Both the LG community and heterosexual community find it more challenging to understand bisexual + individuals (Mulick & Wright, 2002). Being invisible or camouflaging as heterosexual or gay, depending on who they are with or with whom they are partnered, may be a coping strategy for bisexual + individuals to maintain social ties. Hence, bisexual + respondents seem to perceive less social support than their gay and lesbian counterparts; in this study, it did not matter whether the support came from LGBT or heterosexual network members.
Despite having larger social networks, transgender respondents seem to perceive the least social support compared to the other subgroups and the only group with no significant association between social network size and perceived social support. The proposition that homophily of social networks fosters a sense of cohesion and potentially feeling more supported did not apply to transgender respondents. Sexuality being relatively private and gender expression being a more public matter may be at the root of the differences observed between LGB and transgender respondents. Some cisgender LGB individuals may be able to conceal their identity for safety but without “passing” privilege, transgender individuals may be more visible and vulnerable to discrimination and resource deprivation (Anderson, 2020). Hypervigilance and perceived threat as a result of discriminatory laws and unwelcoming communities, workplaces, or care settings may shadow transgender older adults’ perception of available social support from their network members, potentially explaining the null findings of this study.
Limitations
This study had limitations. Given the sample was recruited through contact lists, there could be potential selection bias, and therefore, the findings may not be generalizable to the entire LGBT older adult population in the United States (Andrade, 2021). The cross-sectional nature of the study also limited our ability to comment on the causal direction of the associations between social network structure and function because it is possible that people with greater perceived social support may be more proactive in socializing and expanding their social networks. Our measure of LGBT older adults’ social network size may be subject to recall bias, including double counting. For example, survey respondents may have double counted a transgender lesbian network member under lesbian and transgender subgroups.
Since the data source is about fifteen years old, the experiences of newer cohorts of LGBT older adults may be different from those respondents in our study. The survey measures also fall short in terms of representing diversity within the LGBT community. For example, respondents were not given the option of enumerating their network members who were neither straight, gay, lesbian, nor bisexual. The survey also did not allow us to identify nonbinary respondents and network members, restricting our ability to examine their unique life experiences.
Conclusion
We contributed to the scientific literature by investigating LGBT social network characteristics with a large national survey. This study showed that LGBT older adults perceived more social support when their social networks were larger and when they were composed of similar others in terms of sexuality, gender identity and age. Traditional approaches to strengthening social support among older adults are usually focused on familial ties. However, LGBT older adults may benefit more from other LGBT older peer network members. Efforts should be channeled towards supporting bisexual+ and transgender older adults as they are likely to feel less supported. Future research should use a mixed method approach to help us better understand whether and how bisexual+ and transgender older adults can feel supported by their social networks. Further research should also focus on how the association between social network size, composition, and social support influences health and wellbeing outcomes.
Supplemental Material
Supplemental Material - The relationship between LGBT older adults’ social network structure and function
Supplemental Material for The relationship between LGBT older adults’ social network structure and function by Anyah Prasad, Jeffrey A. Burr, Edward Alan Miller and Karen Fredriksen-Goldsen in Journal of Social and Personal Relationships
Footnotes
Declaration of conflicting interests
The author(s) declared no potential conflicts of interest with respect to the research, authorship, and/or publication of this article.
Funding
The author(s) disclosed receipt of the following financial support for the research, authorship, and/or publication of this article: The data used in this study were collected with funding from the National Institute on Aging of the National Institutes of Health under Award Number R01AG026526, Fredriksen-Goldsen, K. I. (PI).
Open research statement
As part of IARR’s encouragement of open research practices, the authors have provided the following information: This research was not pre-registered. The data used in the research cannot be publicly shared but are available upon request. The data can be obtained by emailing:
Supplemental Material
Supplemental material for this article is available online.
References
Supplementary Material
Please find the following supplemental material available below.
For Open Access articles published under a Creative Commons License, all supplemental material carries the same license as the article it is associated with.
For non-Open Access articles published, all supplemental material carries a non-exclusive license, and permission requests for re-use of supplemental material or any part of supplemental material shall be sent directly to the copyright owner as specified in the copyright notice associated with the article.