
Abstract
Phenolic compounds are hazardous pollutants that threaten aquatic ecosystems and human health, necessitating effective removal from industrial effluents. This study evaluates phenol adsorption using raw Jacaranda biomass (BJ) and phosphoric acid-activated biochar (H-BJ). Activation at 600 °C produced a highly porous adsorbent with a Brunauer–Emmett–Teller (BET) surface area of 791 m2/g and enriched surface functionalities, as confirmed by Fourier transform infrared (FTIR) spectroscopy, scanning electron microscopy, X-ray diffraction analysis, pH point of zero charge (pHpzc), and BET analyses. FTIR indicated the formation of additional hydroxyl groups that enhanced phenol interaction. Adsorption behavior followed Langmuir and Freundlich isotherms and pseudo-second-order kinetics, indicating uniform and predominantly physical adsorption. Maximum capacities reached 40.127 mg/g for BJ and 61.732 mg/g for H-BJ at 600 °C. Thermodynamic parameters confirmed a spontaneous, exothermic process with increased entropy. Application of H-BJ600 (2% dosage) to olive mill wastewater achieved 74% phenolic removal with a qe of 45.42 g/g. These findings demonstrate the potential of Jacaranda-derived activated biochar as an efficient adsorbent for phenol remediation and wastewater treatment.
Introduction
Phenol (C6H5OH), the simplest aromatic compound containing a hydroxyl group, is an essential precursor in numerous industrial processes. Its release into soil and water, however, represents a major global environmental concern, exacerbated by increasing water scarcity, climate change, and rapid population growth. Phenolic contamination primarily arises from the discharge of industrial, agricultural, and municipal effluents. Olive mill wastewater (OMWW), or Zibar, is a particularly hazardous effluent characterized by high levels of organic matter, fatty acids, recalcitrant compounds, and phenolic substances. Its untreated disposal severely harms crops, soil microbiota, and aquatic ecosystems (Mohammed et al., 2018).
Adsorption consistently outperforms many physicochemical and oxidative techniques for phenol removal due to its operational simplicity, low cost, and absence of harmful by-products. Chemical degradation (Wang et al., 2024) often requires hazardous reagents and tight control of reaction conditions, with risks of incomplete mineralization and secondary pollutants. Anodic oxidation (Ahmed and Salman, 2023) suffers from high energy demand, electrode degradation, and formation of chlorinated by-products in chloride-rich waters. Liquid–liquid extraction (Saien et al., 2023) relies on large volumes of organic solvents and becomes inefficient at dilute phenol concentrations, where adsorption remains highly effective. Coagulation–flocculation (Abu-Dalo et al., 2022a) removes suspended solids rather than dissolved phenolics and generates substantial sludge requiring disposal. Chemical oxidation (Alrousan, 2021) using ozone or hydrogen peroxide is costly, sensitive to water chemistry, and may produce toxic intermediates. Photocatalysis (Al Bawab et al., 2022), although promising, is limited by catalyst deactivation, recovery challenges, and slow degradation at high phenol loads. In contrast, adsorption particularly with low-cost biochar and biomass-derived materials achieves high removal efficiencies even at low concentrations, is easily scalable, and enables adsorbent regeneration with minimal environmental impact. Different adsorbents were used to treat wastewater like minerals, activated carbon (Mesquita et al., 2024), industrial by-products, zeolite (Odeh et al., 2022), agriculture waste (Jabar et al., 2020), and polymer materials (Abu-Dalo et al., 2022b).
Biochar is a carbon-rich solid produced via thermochemical decomposition of organic matter under oxygen-limited conditions at 300–700 °C (Hamadneh et al., 2020). Feedstocks include agricultural residues, animal manure, lignocellulosic biomass, and municipal or industrial wastes (Monga and Shetti, 2022). Its production stabilizes organic carbon, mitigating greenhouse gas emissions, while co-generating bio-oil and syngas suitable for fuel or chemical synthesis. Biochar is extensively applied in wastewater treatment (Hairuddin et al., 2019), soil remediation (Boorboori and Lackóová, 2023), and catalytic processes (Cao et al., 2018). High surface area, hierarchical porosity, chemical stability, and lower cost relative to activated carbon, combined with tuneable physicochemical properties through physical or chemical modification, underpin its broad utility.
Chemical modification carried through treatment of biomass or biochar by acids (Baharim et al., 2023; Jabar et al., 2021) or bases (Zhang et al., 2022), oxidizing agents (Huang et al., 2023), surfactants (Zhao et al., 2024), magnetizing agent (Noraini et al., 2016), and so on. H3PO4 is widely used for biochar activation due to its low cost, mild corrosivity, and ability to enhance surface area and porosity (Chu et al., 2018).
Jacaranda is an ornamental tree that thrives in tropical regions and is steadily spreading to new areas. Its fruits are woody shells that encase the seeds. Numerous studies have utilized Jacaranda fruits and seeds as precursors for carbon-based adsorbents, demonstrating their effectiveness in removing both organic and inorganic pollutants such as ketoprofen (Georgin et al., 2021), lead ions and organic dyes (Treviño-Cordero et al., 2013), and mercury ions (Morales-Herrera et al., 2024). However, despite the growing interest in biochar-based adsorbents, no prior research has investigated the potential of Jacaranda fruit-derived biochar for phenol removal from either synthetic solutions or real industrial wastewater.
This study evaluates Jacaranda fruit-derived biochar, modified with orthophosphoric acid (H3PO4), for phenol removal from synthetic solutions and OMWW. Adsorption performance was tested under varying pyrolysis temperatures and modification methods using batch experiments. The mechanism was further analyzed through kinetic, isothermal, and thermodynamic models to clarify phenol–biochar interactions.
Materials and methods
Materials
Jacaranda fruits were collected from public parks in Amman, Jordan. The chemicals used in this study included phosphoric acid (85%, H3PO4) obtained from EUROSTAR Scientific Ltd; hydrochloric acid (37%, HCl) from VWR Chemicals Co.; sulfuric acid (98%, H₂SO4) from S&C Chemicals; sodium hydroxide (99%, NaOH) from AZ Chem for Chemicals; and sodium chloride (99%, NaCl) from Laboratory Rasayan Co.
Preparation of biochar
Three biomass samples of Jacaranda fruit pods were wrapped in two layers of aluminum foil and weighed. They were then heated in a muffle furnace (Naber, model H3/A, Germany) at temperatures of 400, 500, and 600 °C for 5 h. The resulting samples were designated as BJ400, BJ500, and BJ600, respectively. After heating, the samples were removed from the furnace and placed in a desiccator for approximately 0.25 h before measuring the biochar yield. Each sample was then finely ground using a mortar, sieved through a 45-micron mesh, and stored in small containers inside a desiccator until further use.
Preparation of activated biochar with phosphoric acid
The activated biochar was prepared as follows: Jacaranda fruits pods were crushed with a hammer, then washed and soaked in water for 2 h before being dried in an oven at 80 °C. Subsequently, the material was soaked in diluted H3PO4 at three different dilution ratios (1:2, 1:4, and 1:8) and heated for 3 h at 80 °C. It was then filtered and dried in an oven at 80 °C for 24 h. The dried, modified Jacaranda fruits pods were pyrolyzed at 400, 500, and 600 °C for 5 h in a muffle furnace. The resulting biochar was designated as H-BJ400, H-BJ500, and H-BJ600. After cooling to room temperature, the samples were thoroughly washed with distilled water several times until the filtrate showed no absorbance at 270 nm (λmax of phenol), confirming the removal of residual phenol.
Characterization of biochar
The surface chemistry of biochar was identified using Fourier transform infrared (FTIR) spectrometer (Thermo Nicolet, model no. NEXUS 670, USA), the surface morphology clarified by scanning electron microscopy (SEM) (VERSA-3D, model no. FEI, Netherlands), whereas the X-ray diffraction (XRD) carried out by XRD instrument (Netzsch, model no. 409, Germany), the thermal gravimetric analysis was conducted using thermogravimetry (Mettler Toledo, model no. TGA/DSC 2, Switzerland), while the pH point of zero charge (pHpzc) was determined by pH-meter (Eutech, model no. 2700, Singapore). The solid addition method, as described by Mall et al. (2016), was used to determine the pHpzc of the BJ and H-BJ adsorbents.
Batch experiments
Dosage effect
Optimum adsorbent dosage was determined by mixing different adsorbent masses ranging from 0.01 to 0.15 g in 10.0 mL of phenol (50 mg/L), at pH 6.9, and agitated in thermostat-equipped shaker (GFL model no. 1083, Germany) at 30 °C for 24 h to reach equilibrium then filtered the solution by micro syringe (0.45 μm) to remove biochar and determine the concentration of residual phenol at 270 nm.
The equilibrium capacity of adsorption qe is calculated as follows:

The percentage of removal can be calculated from

Ionic strengths
Ionic strengths effect was investigated by preparing 50 mg/L of phenol solution in NaCl solution concentrations of 0.01, 0.05, 0.10, 0.15, and 0.20 M at pH 6.9, 30 °C and 0.02 g of adsorbent. The experiments were conducted following the same procedure described in the previous section.
Kinetic study and contact time
The effect of contact time was examined by shaking a phenol solution (50 mg/L) with 0.02 g/10 mL phenol solution at pH 6.9, and 30 °C. At predetermined time intervals ranging from 5 to 300 min, an amount of solution was withdrawn, filtered, and their absorbance measured. The resulting data were analyzed according to the following three kinetic models:
The pseudo-first-order model is

The pseudo-second-order model is

The intra-particular diffusion equation is

pH effect
The effect of pH was explored by utilizing phenol solution (50 mg/L) prepared in (0.01 M) NaCl at different pH range (2–10). The pH was adjusted by using 0.01 M NaOH and 0.01 M HCl. Each solution was then mixed with 0.02 g/10 mL of phenol solution and shaken for 24 h at 30 °C. After filtration, the absorbance of each sample was measured.
Isothermal and thermodynamic study
The isothermal study was conducted using phenol concentrations ranging from 10 to 100 mg/L, prepared from 100 mg/L stock solution. Each solution was mixed with 0.02 g of adsorbent at pH = 6.9. The equilibrium data were then fitted to three models, which are
Langmuir isotherm model:

Freundlich isotherm model:

Dubinin−Radushkevich (D–R) isotherm model:


A non-linear regression technique was used to determine which modifiable parameters of the kinetic and isotherm models best fit the observed adsorption data. Specifically, the linear correlation coefficient (R2) is used to determine the model parameters for adsorption kinetics and isotherms. Marquardt's percent standard deviation (MPSD) and the corresponding adsorption scheme chi-square square (χ2), which quantify the differences between the amount of phenol adsorbed by the adsorbent as predicted by the models (qe.cal) and the actual amount that was measured experimentally (qe,exp) (Hamadneh et al., 2026).
To determine the thermodynamic parameters, the isothermal adsorption experiments were conducted at three different temperatures 30, 40, and 50 °C. The mixtures were shaken for 24 h, and the absorbance of the filters was measured.
The Kd constant can be calculated depending on Langmuir constant KL as follows:

The Gibbs free energy is related to the distribution coefficient through the equation

The Gibbs free energy is also related to the change in enthalpy and change in entropy via relation

so,
By plotting ln Kd versus 1/T (K−1), a straight line with a slope = −ΔH/R and the intercept = ΔS/R is obtained.
Results and discussion
Characterization
The properties of the produced biochar are summarized in Table 1. The decomposition increases the loss of volatile matter and enhances the pore development, which rises the available surface area. Both pyrolysis temperature and treatment method had a clear impact on the physicochemical characteristics of the biochar. As expected, the %yield of biochar decreased with increasing pyrolysis temperature due to the rising of dehydration, decarboxylation, cracking, and lignin decomposition to volatile gases, which decreases the %yield (Ouyang et al., 2023). Also, the moisture content (%) of the biochar was inversely affected by pyrolysis temperature. As the temperature increased, the biochar became more aromatic and hydrophobic which minimize water adsorption. Additionally, the formation of larger pores at higher temperatures allowed the escape of water during pyrolysis, which reduces the moisture content (Hanandeh et al., 2016).
Physio-chemical properties and textural parameters of biochar.

The results in Table 1 showed that BJ biochar have higher pHpzc than initial pH, which means the surface of BJ is positively charged. Pyrolysis increases metal oxides and reduces carbon content, and the higher metal oxide levels lead to a more alkaline solution. Whereas the pHpzc for activated biochar H-BJ is lower than initial pH, which means the biochar surface is negative charge. These values agree with Ouyang et al.’s (2023) findings. This may be due to the formation of metal phosphates instead of metal oxides and carbonates which eliminates the basic effect source.
The ash content (%) in activated biochar was directly correlated with pyrolysis temperature as the calcination temperature increased, the carbon content decreased, due to thermal degradation, while the mass of metal phosphates remained constant. This led to an increase in ash content.
Table 1 summarizes the apparent Brunauer–Emmett–Teller (BET) surface area (SABET), total pore volume (Vtotal), and average pore width (Dap) obtained from N₂ adsorption measurements at near saturation pressure (P/P₀ = 0.99) for the BJ and H BJ materials. The results show that H3PO4 activation induces partial pore blockage and narrowing, which is reflected in the reduced average pore width. At the same time, activation promotes the development of additional microporosity, leading to higher apparent surface area and total pore volume, consistent with previous observations for acid activated carbons (Tan et al., 2010).
According to the IUPAC classification (Thommes et al., 2015), the pore widths of the H-BJ samples fall predominantly within the microporous range (apparent surface areas), representing monolayer adsorption capacity rather than true geometric surface area. The increase in SABET with rising pyrolysis temperature is attributed to enhanced devolatilization and structural rearrangement, which collectively promote pore formation and widening of existing micropores.
The influence of treatment sequence was also evident: biochar activated prior to pyrolysis (H-BJ) exhibited substantially improved textural properties compared with their non-activated counterparts. This confirms that chemical activation of the biomass precursor is more effective in generating a well-developed porous structure than post pyrolysis modification, resulting in higher surface area and pore volume in the final biochar.
Surface chemistry
The surface chemistry of biochar is a key factor influencing its adsorption capacity for phenolic compounds, such as phenol. As shown in the FTIR spectrum in Supplemental Figure 1S, a weak absorption band observed at 3671 cm−1 is likely attributed to the stretching vibration of free hydroxyl (–OH) groups. The stretching vibration band at 2336 cm−1 was due to CO2 adsorption onto the biochar surface. The band at 1572 and 1395 cm−1 was due to C=C and C=O stretching, respectively. The peak at 1158 and 1156 cm−1 due to C–O stretching of C–OH groups, and that at 1384 and 1385 cm−1 due to stretching vibration of C–C in the aromatic ring (Shi et al., 2019).
A comparison between BJ and H-BJ biochar reveals that the characteristic peaks of H-BJ are more pronounced and exhibit higher intensity, suggesting a greater abundance of surface functional groups. However, new peaks appearing at 1158, 1064, and 475 cm−1 for H-BJ were due to P–OH, P–O, and P=O stretching vibration modes, respectively. The peaks at 805 and 872 cm−1 that appeared for BJ sample were due to carbonate and metal oxides, while they disappeared for H-BJ sample, due to metal leaching by H3PO4 (Supplemental Figure 2S) (Sahin et al., 2017). This observation suggests that H3PO4 treatment promotes dehydration and depolymerization reactions during pyrolysis, thereby reducing surface functional groups and enhancing aromatic condensation (Jagtoyen and Derbyshire, 1998; Palomo et al., 2017). As a result, the treated biochar structure becomes more graphitic in nature. Similar findings have been reported in previous studies by Chu et al. (2018), corroborating the impact of chemical activation on biochar surface functionality and structure.
Figure 1 shows the XRD of BJ and H-BJ biochar in which the H-BJ consists of two broad peaks appeared like hump at 2θ = 24.5 and 42.6 indicating predominance of amorphous carbon presence, where in BJ the peak at 24.5 is shifted to lower 2θ around 21.5 and become more sharp which might refer to the formation of crystalline graphite sheets (Kukułka et al., 2018), and this is in line with the biochar FTIR.
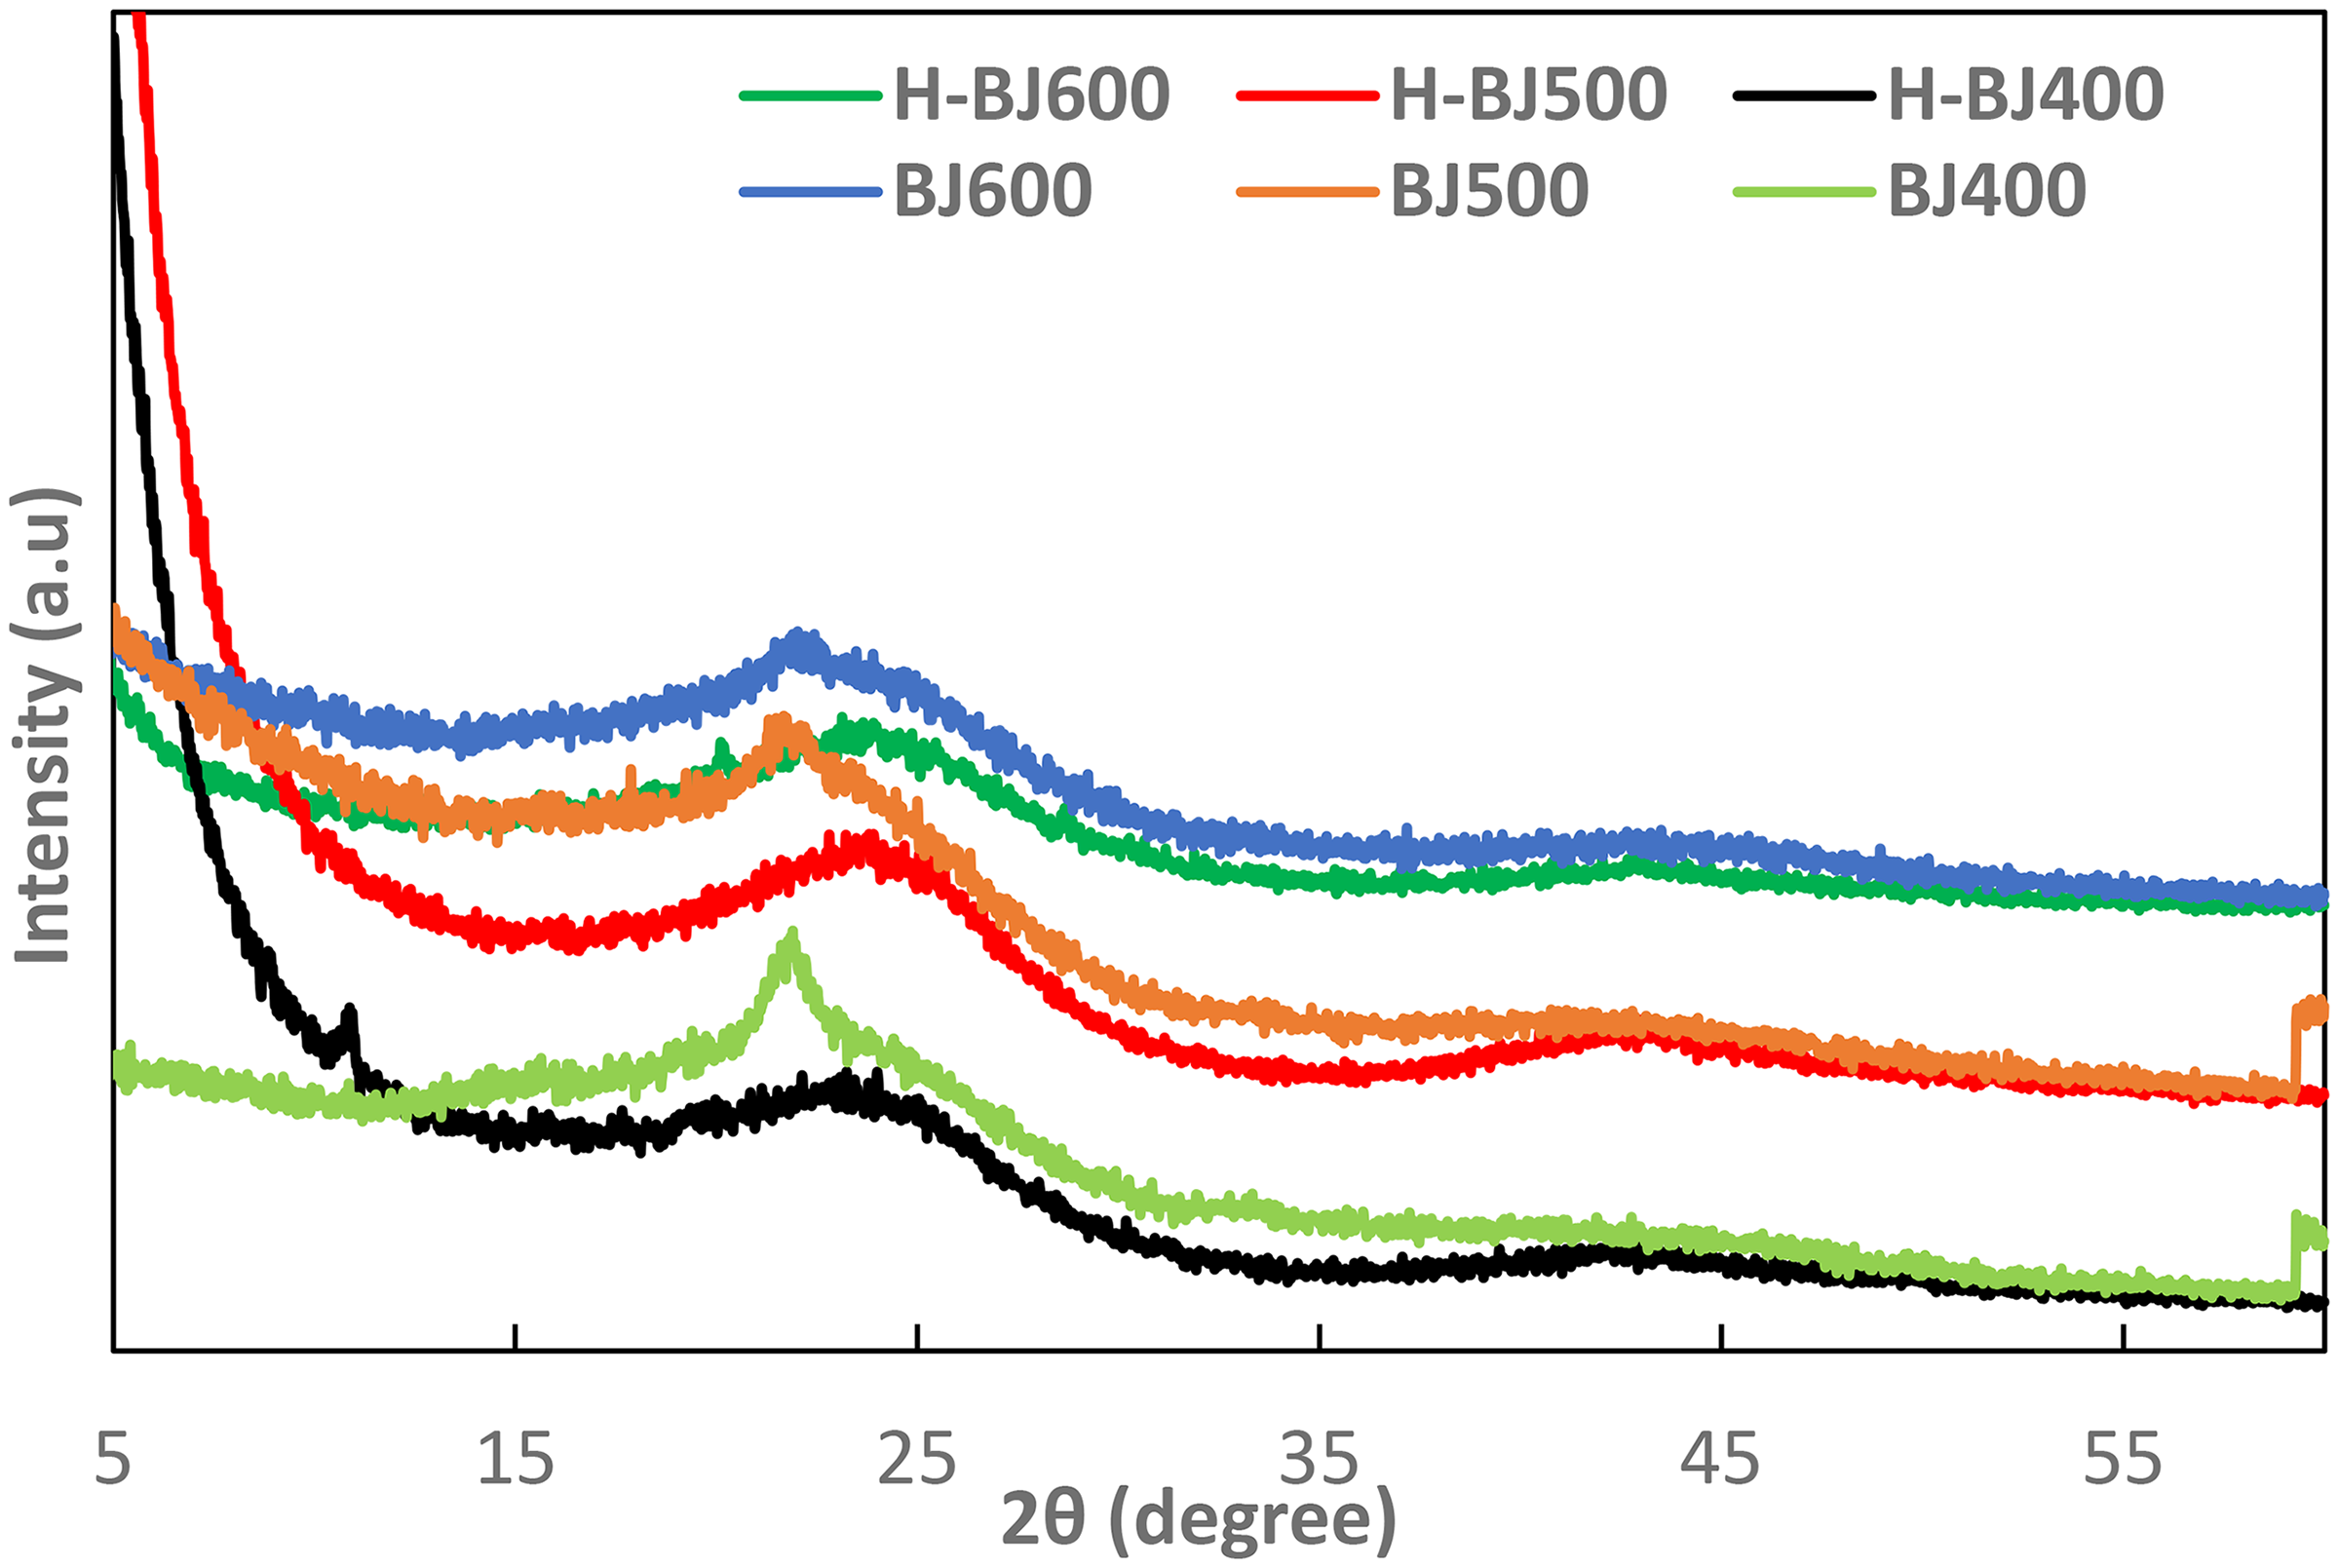
X-ray diffraction pattern of BJ and H-BJ biochar.
SEM analysis provides critical insight into the surface morphology, pore structure, and heterogeneity of biochar, all of which significantly influence its adsorption performance. As illustrated in Figure 2, the SEM micrographs reveal distinct differences in surface characteristics among the prepared biochar. The H-BJ600 sample exhibits a well-developed porous, rougher structure, with uniformly distributed pores. In contrast, the BJ biochar samples display a lower pore density, irregular pore distribution, indicating less structural uniformity.

SEM images for (a) BJ600 and (b) H-BJ600 biochar (magnification: 800×).
These morphological observations are consistent with the measured specific surface area values, further confirming the enhanced porosity and surface accessibility of H-BJ600. The improved textural properties of H-BJ600 are likely to enhance its adsorption capacity by providing more active sites and greater surface area for interaction with phenol molecules.
Dosage effect
Supplemental Figure 3S illustrates the percentage removal of phenol as a function of biochar dosage for all biochar. The adsorption efficiency increases markedly as the dosage increases from 0.01 to 0.02 g, with an approximate enhancement of 15%. Beyond this point, the rate of increase in phenol removal becomes progressively smaller, approaching a plateau around 0.06 g for most biochar. This trend suggests that at higher dosages, the available phenol molecules become insufficient relative to the increasing number of active sites, leading to a saturation effect.
Pyrolysis temperature significantly influences the adsorption efficiency of biochar, particularly at lower dosages, likely due to its effect on the development of surface area and porosity. Additionally, the duration and method of biochar modification appear to exert a substantial impact on phenol removal efficiency. Biochar subjected to pretreatment exhibit superior performance, which correlates well with improvements in surface area and pore structure observed in previous analyses. These findings underscore the importance of optimizing both thermal processing conditions and chemical treatments to enhance the adsorptive capacity of biochar for organic pollutants such as phenol.
Ionic effect
The presence of background ions can influence the adsorption behavior of adsorbate either positively or negatively, depending on the nature of the interactions involved. Competing ions may inhibit adsorption by occupying active sites or by forming a diffuse layer that screens the adsorbent surface. Conversely, certain ions may reduce the hydration shell surrounding the adsorbate, thereby enhancing its interaction with the adsorbent surface.
Supplemental Figure 4S presents the effect of varying NaCl concentrations (0.01–0.2 M) on the adsorption efficiency of phenol by biochar. The results indicate a minimal impact of NaCl concentration on phenol removal, suggesting that the adsorption process is not significantly influenced by ionic strength within the tested range. This observation implies that electrostatic interactions are not the dominant mechanism governing phenol adsorption onto biochar, and that other mechanisms, such as π–π interactions or hydrogen bonding, may play a more critical role (Mohammed et al., 2018).
pH effect
The pH of the solution is a critical parameter in the adsorption process, as it influences both the surface charge of the biochar and the degree of ionization of the adsorbate. These factors, in turn, determine the nature and strength of interactions between the adsorbent and the adsorbate. Figure 3 illustrates the effect of initial solution pH on the adsorption of phenol by different biochar.

Effect of pH on adsorption of phenol onto adsorbents BJ and H-BJ biochar. The initial concentration of phenol = 50 mg/L; dosage 0.02 g of adsorbents; agitation speed 150 rpm; contact time 24 h and temperature 30 °C.
Across all biochar samples, the adsorption capacity (qe) decreases sharply at pH values above 10. This behavior can be attributed to changes in surface charge relative to the point of zero charge (pHₚzc) of the biochar. At pH 10, the solution pH exceeds the pHpzc values of both BJ biochar (7.1, 7.2, and 7.2) and H-BJ biochar (2.6, 3.0, and 3.2), rendering the biochar surfaces negatively charged. Simultaneously, the ionization of phenol is governed by its pKa value (9.98), indicating that at pH ≈ pKa, approximately 50% of phenol molecules exist in the ionized form as phenoxide anions. Under these conditions, electrostatic repulsion occurs between the negatively charged biochar surfaces and the phenoxide ions, thereby inhibiting adsorption. Consequently, phenol removal becomes significantly less efficient at alkaline pH due to the dominance of repulsive electrostatic interact, also the phenoxide solubility is higher than phenol solubility in water which discourage the adsorption process (Mohammed et al., 2018).
Kinetic study and contact time
Kinetic studies are essential in adsorption research, as they provide valuable information regarding the rate of adsorption, the time required to reach equilibrium, and the underlying adsorption mechanisms. This information is crucial for both academic research and industrial applications, enabling the selection of appropriate adsorbents and operational conditions for specific treatment goals.
Supplemental Figure 5S illustrates the adsorption capacity of phenol as a function of contact time for the biochar. The adsorption process exhibited a rapid initial phase, with over 40% of phenol removed within the first 0.08 h. This rapid uptake can be attributed to the high availability of accessible active sites on the biochar surface and enhanced mass transfer due to the initially high concentration gradient of phenol (Hassan et al., 2024). Following this, the adsorption rate gradually slowed, reaching approximately 65–72% removal after 1.5 h. Beyond this point, the rate of phenol uptake continued to increase slowly, approaching a maximum removal efficiency of around 76%, 82%, and 88% for H-BJ400, H-BJ500, and H-BJ600, respectively, at 24 h.
The deceleration in adsorption rate over time is likely due to the progressive occupation of available active sites and the concomitant decrease in phenol concentration, which reduces the driving force for mass transfer. This kinetic behavior is characteristic of a multi-stage adsorption process, typically involving external surface adsorption followed by slower intraparticle diffusion or pore-filling mechanisms (Bazan-Wozniak et al., 2022).
The kinetic data were analyzed using nonlinear pseudo-first-order, pseudo-second-order, and intra-particles diffusion models to investigate the adsorption mechanism and rate-controlling steps. As presented in Figure 4 and Table 2, kinetic parameters for adsorption of phenol onto all biochar samples showed a significantly better fit with the pseudo-second-order model. This is evidenced by the high correlation coefficients (R2) which reached up to >0.99 and lower values of (χ2) and MPSD. In addition, the close agreement between the calculated equilibrium adsorption capacities (qe,cal) and the experimentally determined values (qe,exp).

Kinetic models for phenol adsorption by BJ and H-BJ biochar using nonlinear regression method. The initial concentration of phenol = 50 mg/L; dosage 0.02 g; agitation speed 150 rpm; pH = 6.9; contact time 24 h and temperature 30 °C.
Pseudo-first order, pseudo-second order, and intra-particles diffusion adsorption rate constants, and calculated qe,cal and experimental qe,exp values for the adsorption of phenol onto BJ and H-BJ biochar.

The strong conformity of the data with the pseudo-second-order model suggests that the adsorption process is governed primarily by chemisorption, involving valence forces through the sharing or exchange of electrons between the adsorbate and the biochar surface functional groups. These findings imply that the rate determining step depends on the number of active sites adsorption rate, rather than pore diffusion (Hassan et al., 2024).
Supplemental Figure 6S shows that the plotting of the square root of time against adsorption capacity produces good two portions linearity for the first 120 min confirming intraparticle diffusion in BJ and H-BJ, but then reaches a plateau for the third portion indicating completion of pore diffusion. Since the plots show an intersection, it is reasonable to conclude that there are other processes besides intraparticle diffusion that control the kinetic process of adsorption in all adsorbents.
Isothermal study
Isothermal study is also important in clarifying the hidden knowledge about adsorbent surface homogeneity, nature of adsorption, predicting the adsorbate affinity to adsorbent, favorability of adsorption, the mean energy of adsorption, and determination of maximum capacity of adsorbent for adsorbate. Three models are used to explore the characteristics of adsorption process, the first isothermal adsorption studies are essential for providing insights into various fundamental aspects of the adsorption process, including surface homogeneity of the adsorbent, the nature and mechanism of adsorption, adsorbate–adsorbent affinity, adsorption favorability, mean adsorption energy, and the maximum adsorption capacity. In this study, three commonly used isotherm models were applied to analyze the equilibrium data and characterize the adsorption behavior of phenol onto BJ and H-BJ biochar.
In the present study, the equilibrium data on the adsorption of phenol onto BJ and H-BJ biochar were fitted with the Langmuir, Freundlich, and Dubinin−Radushkevich (D–R) equations (Figure 5). The Langmuir isotherm model assumes monolayer adsorption on a homogeneous surface with uniform adsorption energy and a finite number of identical sites. The Freundlich isotherm model, on the other hand, describes multilayer adsorption on heterogeneous surfaces and accounts for a non-uniform distribution of heat of adsorption. The third model, D–R isotherm, is based on a pore-filling mechanism and is typically used to estimate the mean free energy of adsorption, allowing differentiation between physical and chemical adsorption.

The equilibrium isotherm for phenol adsorption by BJ and H-BJ biochar using nonlinear regression method. The initial concentration of phenol = 10–100 mg/L; dosage 0.02 g; agitation speed 150 rpm; pH = 6.9; contact time 24 h and temperature 30 °C.
Table 3 presents the isotherm parameters for the BJ and H-BJ biochar. The correlation coefficients (R2) for both the Langmuir and Freundlich models were higher than those for the D–R isotherm, also the χ2 and MPSD values were significantly lower for the first two isotherms than the latter one indicating a better fit. This suggests that the adsorption process involves a combination of monolayer adsorption on a homogeneous surface (Langmuir model) and multilayer adsorption on a heterogeneous surface (Freundlich model). The lower R2 value and high χ2 and MPSD values with the D–R isotherm imply that the pore-filling mechanism is less dominant compared to surface adsorption mechanisms. These results are consistent with findings from previous studies (Hamadneh et al., 2020; Palomo et al., 2017; Songjun et al., 2023), which reported that phenol adsorption often conforms to multiple isotherm models simultaneously.
Langmuir, Freundlich, and D–R isotherm constants for the adsorption of phenol on BJ and H-BJ biochar.

The Langmuir constant (KL), which reflects the affinity between the adsorbate and adsorbent, increased with rising pyrolysis temperature. This trend may be attributed to an enhanced degree of graphitization, which facilitates stronger π–π interactions between the aromatic rings of phenol molecules and the graphitic domains on the biochar surface (Mohammed et al., 2018).
Regarding the Freundlich model, the adsorption intensity constant (n) values were all greater than 1 and also increased with pyrolysis temperature, indicating enhanced favorability of phenol adsorption. This also implies a rise in surface heterogeneity at higher carbonization temperatures. Furthermore, an inverse relationship was observed between the adsorption temperature and both KL and n values, suggesting that the phenol adsorption process is exothermic in nature. This temperature dependence confirms that lower temperatures favor the adsorption process. According to the mean adsorption energy values derived from the D–R isotherm (EDR), all values were below 8 kJ/mol, confirming that physisorption is the predominant mechanism in the adsorption process.
Thermodynamic study
The thermodynamic analysis was conducted to evaluate the standard Gibbs free energy change (ΔGo), enthalpy change (ΔHo), and entropy change (ΔSo) by plotting of ln Kd versus 1/T (K−1) (figure not shown).
Table 4 shows that the values of the thermodynamic parameters were derived from the Van’t Hoff equation, the calculated enthalpy change (ΔH°) values ranged from −17 to −22 for BJ biochar and −11 to −29 kJ/mol for H-BJ biochar, indicating that the adsorption process is exothermic in nature. Since these values are below 40 kJ/mol, the adsorption can be classified as physisorption rather than strong chemical bonding. The positive entropy change (ΔSo) values suggest an increase in randomness at the solid–liquid interface during adsorption, likely due to the release of water molecules from the adsorbent surface or reorganization of phenol molecules (Abechi, 2018). Additionally, the negative values of Gibbs free energy change (ΔGo) across all tested temperatures confirm the spontaneity and thermodynamic feasibility of the adsorption process. Furthermore, the ΔGo values, ranging between −30 and −36 kJ/mol, suggest that the adsorption is primarily driven by physisorption mechanisms such as hydrogen bonding and π–π interactions. These interactions can act synergistically to enhance adsorption performance by increasing π-electron density and reducing the spatial distance between aromatic rings (Guo et al., 2023).
Thermodynamic parameters for the adsorption of phenol onto BJ and H-BJ biochar.

OMWW treatment
Given its superior surface area and pore volume (Table 1), H-BJ600 biochar was used to treat real OMWW samples obtained from an olive oil mill in Al-Ramtha, Jordan, which contain elevated levels of phenolic compounds. The total phenolic content was determined to be 1221.7 mg/L using the Folin–Ciocalteu method. To evaluate the adsorption performance of H-BJ600 under realistic conditions, 2% ratio of biochar were used to treat OMWW at an ambient temperature of approximately 20 °C. The phenol removal efficiencies were 74%, with a corresponding adsorption capacity (qe) of 45.42 mg/g, which exceeds the qe predicted by the Langmuir isotherm. This enhanced performance may be attributed to the compositional differences of phenolic compounds present in MOWW, which could promote more favorable adsorption interactions compared to pure phenol, thereby resulting in a higher qe than that observed for synthetic phenol solutions.
Several biochar has been synthesized and investigated in the literature as phenol adsorbents, and some have also been applied to real wastewater samples such as OMWW and palm oil wastewater. Table 5 summarizes selected studies, including the type of biochar, maximum adsorption capacity, and corresponding adsorption times.
Comparison between results recorded for phenol adsorption onto BJ600 and H-BJ600 to the results of previous literatures.

Conclusions
Six biochar samples were prepared from jacaranda fruit biomass using phosphoric acid activation and pyrolyzed at 400, 500, and 600 °C. Activated H-BJ biochar showed superior phenol removal due to preserved functional groups, while higher pyrolysis temperatures enhanced adsorption through improved pore structure, surface area, and aromaticity. Kinetic studies confirmed a pseudo-second-order model, and equilibrium data fit both Langmuir and Freundlich isotherms, reflecting mixed monolayer and heterogeneous adsorption. Thermodynamic analysis (ΔGo < 40 kJ/mol) indicated a spontaneous, exothermic physisorption process driven by π–π interactions. In real OMWW treatment, H-BJ600 achieved 74% phenol removal and 45.4 mg/g capacity at 2% dosage, demonstrating its potential as a cost-effective, durable adsorbent for phenol-rich industrial effluents.
Supplemental Material
sj-docx-1-adt-10.1177_02636174261430388 - Supplemental material for H3PO4-modified biochar derived from jacaranda fruits for phenol removal: Preparation, adsorption kinetics, isotherms, and thermodynamics
Supplemental material, sj-docx-1-adt-10.1177_02636174261430388 for H3PO4-modified biochar derived from jacaranda fruits for phenol removal: Preparation, adsorption kinetics, isotherms, and thermodynamics by Khawla Damer, Imad hamadneh, Muna Abu-Dalo and Ammar H. Al-Dujaili in Adsorption Science & Technology
Footnotes
Funding
The authors received no financial support for the research, authorship, and/or publication of this article.
Declaration of conflicting interests
The authors declared no potential conflicts of interest with respect to the research, authorship, and/or publication of this article.
Supplemental material
Supplemental material for this article is available online.
References
Supplementary Material
Please find the following supplemental material available below.
For Open Access articles published under a Creative Commons License, all supplemental material carries the same license as the article it is associated with.
For non-Open Access articles published, all supplemental material carries a non-exclusive license, and permission requests for re-use of supplemental material or any part of supplemental material shall be sent directly to the copyright owner as specified in the copyright notice associated with the article.