
Abstract
Paraquat (methyl viologen, PQ2+) is a persistent cationic contaminant that remains difficult to remove from water. This study shows that the composition of the synthesis gel, specifically the balance of water and basicity, governs phase purity, crystallinity, and microporosity in zeolite products and, consequently, their adsorption performance. Using as-synthesized Na-form materials, we varied gel composition, characterized the resulting solids (scanning electron microscopy with energy dispersive X-ray spectroscopy, X-ray diffraction, Fourier transform infrared, and N2 sorption), and measured paraquat isotherms in water at room temperature. High-water gels produced phase-pure, highly crystalline NaY (faujasite) that followed Langmuir behavior with strong affinity and high capacity. The best NaY sample, named 210H2O, synthesized from a gel with a molar composition of 6.01Na2O : 1.00Al2O3 : 11.75SiO2 : 210H2O gave the largest surface area (880 m2/g), highest relative crystallinity, and paraquat adsorption capacity (233 mg/g). Lower water content promoted NaP formation, reduced microporosity, and shifted the isotherm to the Freundlich, indicative of weaker and heterogeneous binding. These results establish a clear synthesis–structure–performance relationship and provide practical guidance: controlling gel water and basicity enables preparation of NaY adsorbents with maximized accessible Na+ exchange sites for effective paraquat removal.
Introduction
Paraquat (methyl viologen, PQ²⁺) is a cationic, highly water-soluble herbicide whose persistence and acute toxicity have motivated extensive research into rapid, selective removal from aqueous matrices by adsorption. Paraquat is highly toxic to humans; one small sip of concentrated product can be fatal, and there is no specific antidote (EPA, 2024). Consistent with this hazard profile, Canada sets a maximum acceptable concentration of 0.01 mg/L⁻¹ as the dichloride in drinking water, and Australia applies a guideline value of 0.02 mg/L⁻¹ (Health Canada, 2015; NHMRC, 2011). In the United States, paraquat is a restricted-use pesticide with risk-mitigation measures; the EPA indicates that exposure via finished drinking water is generally not expected under labeled uses (EPA, 2024). These toxicological and regulatory drivers underscore the need for high-affinity adsorbents capable of lowering PQ²⁺ levels under practical conditions.
Among inorganic sorbents, faujasite (FAU) zeolites in sodium form are particularly attractive because their 12-membered-ring windows provide access to supercages hosting exchangeable Na+ sites, and the framework charge can be tuned via Si/Al ratio. Early screening across silica-based adsorbents derived from rice husk silica (RHS) showed that zeolite NaY outperformed NaBEA, MCM-41, and RHS for paraquat uptake, with adsorption proceeding predominantly by cation exchange and fitting the Langmuir isotherm with a maximum capacity of ∼185 mg/g (Rongchapo et al., 2013). Follow-up work expanded the benchmark set: NaX exhibited a maximum capacity of ∼120 mg/g under comparable conditions (Rongchapo et al., 2015). A mechanistic comparison explained why higher-Al FAU (NaX) does not necessarily out-adsorb NaY for a dicationic guest—stronger Na–framework interactions at site III in NaX reduce Na+ exchangeability relative to NaY (Rongchapo et al., 2018).
Beyond pristine FAU, a hybrid design can enhance the performance per mass of NaY. A NaY/SBA-15 composite retained FAU microporosity while adding mesoporosity for dispersion and transport; surface analysis and Na/Si changes confirmed ion exchange with paraquat, and capacity normalized per mass of NaY increased relative to the parent zeolite (Osakoo et al., 2017). Within NaY itself, synthesis–structure control is decisive: varying Si/Al ∼2.15–2.40 showed that crystallinity—and not merely external area—tracks Langmuir capacity, with the most crystalline NaY giving ∼210–240 mg/g; computations located PQ2+ near negatively charged framework fragments (Keawkumay et al., 2019). More recently, gel chemistry has emerged as a practical lever: water content and alkalinity co-determine nucleation kinetics, crystal size, and phase purity, while the aluminum source (e.g. sodium aluminate vs. Al powder/complexes) shifts crystallization pathways and product morphology (Al-Jubouri, 2019; Alipour et al., 2014; Belviso and Cavalcante, 2020; Ibrahim and Al-Jubouri, 2023; Keawkumay et al., 2025; Mu et al., 2019).
Electrostatic sensing studies with FAU support this picture: exchangeable Na+ sites and framework polarity govern selective interactions with cationic analytes, reinforcing the centrality of charge balance and site accessibility for PQ2+ capture (Saiapina et al., 2012). Together, these findings suggest a practical recipe for high paraquat uptake: (i) favor FAU-type NaY over other RHS-derived matrices; (ii) preserve micropore accessibility while ensuring exchangeable Na+; (iii) tune gel composition—especially water and basicity—and select Al sources that yield highly crystalline, phase-pure NaY without driving unwanted phase transitions (Keawkumay et al., 2019, 2025; Osakoo et al., 2017; Rongchapo et al., 2013, 2015, 2018).
Building on these insights, we synthesize template-free, as-synthesized (Na-form) NaY under systematically varied gel water content and basicity to determine how phase purity (FAU vs. NaP), crystallinity, and texture control paraquat adsorption. By co-varying water and basicity within a single experimental framework and evaluating PQ2+ isotherms under identical aqueous conditions, we aim to define a clear synthesis–structure–performance relationship for non-calcined NaY relevant to practical water treatment.
Experimental
Materials
Chemicals for NaY synthesis were fumed silica (99%, SiO2, Carlo Erba), sodium aluminate (NaAlO2, Riedel-de Haën® with 41.383% Na2O, 58.604% Al2O3), sodium hydroxide (98 wt% NaOH, Carlo Erba). Commercial-grade paraquat solution (27.6% w/v, Masda) was employed in the adsorption study, and the solid chemical grade (99.9% w/w, Fluka) was used to verify the actual concentration.
Synthesis of zeolites
Zeolite NaY samples with a Si/Al ratio from 1.8 to 2.0 were synthesized with a procedure modified from the literature (Keawkumay et al., 2019). The name and overall molar ratio aNa2O : 1Al2O3 : bSiO2 : cH2O of each prepared sample is displayed in Table 1. The actual weight of the chemicals in each preparation is in the Supplemental Materials. Firstly, 1.02 g of NaOH was dissolved in the desired amount of deionized (DI) water in a polypropylene (PP) bottle, followed by adding 0.5225 g of anhydrous NaAlO2 to the NaOH solution. The mixture was further stirred for 10 min until the solution became clear. After that, the desired amount of Na2SiO3 solution prepared from fumed silica was added, and the mixture was stirred for 10 min, capped, and aged at room temperature for 24 h.
Gel composition of NaY samples with various water contents.

A feedstock gel was then prepared with a procedure similar to the seed gel, except it was used immediately without ageing. In brief, 0.035 g of NaOH was dissolved in the desired amount of DI water in a PP bottle. Then, 2.62 g of anhydrous NaAlO2 was added and stirred for 10 min. After that, the desired amount of Na2SiO3 solution, prepared from fumed silica, was gradually added. At the end, the overall gel was created by pouring feedstock gel into seed gel, capped, and hydrothermally crystallized at 90 °C for 24 h.
Characterization
Morphology and elemental analysis of zeolite particles were studied by scanning electron microscopy with energy dispersive X-ray spectroscopy (SEM–EDS, Carl Zeiss, Auriga® series, Germany) with an accelerating voltage of 30 kV. The samples were coated with gold by sputtering.
Phases of the zeolite samples were characterized by X-ray diffraction (XRD; Bruker D8 ADVANCE, Germany) with Cu Kα radiation (λ = 1.5406 Å) generated with a voltage and current of 40 kV and 40 mA, respectively. Time per step was 0.2 s/step and the increment was 0.02° 2θ/step. The crystallite size was determined from the Scherrer equation (Adday and Al-Jubouri, 2024; Scherrer, 1918) in equation (1):
Functional groups of zeolite samples were determined by a Fourier transform infrared spectroscopy (FTIR; Bruker Tensor 27 FTIR) using attenuated total reflectance mode with a resolution of 2 cm−1. N2 sorption isotherms of the zeolite samples were acquired by a N2 adsorption–desorption analysis (BELSORP-mini II, Japan) at liquid nitrogen temperature. The samples were degassed at 300 °C for 3 h under vacuum before the measurement. The specific surface areas (SBET) were calculated using the Brunauer–Emmett–Teller (BET) method.
The thermal behavior of the zeolite samples was studied by thermogravimetric analysis (TGA; Mettler Toledo model TGA/DSC1, Switzerland) with air-zero. A gas flow rate was 50 mL/min, and a heating rate was 10 °C/min up to 500 °C.
Adsorption of paraquat
The adsorption procedure was done as described in the literature (Keawkumay et al., 2019). Each adsorbent (0.05 g) was added to 20 mL of paraquat solution with a concentration ranging from 100 to 1000 mg//L in a 125 mL PP bottle. The mixture was stirred for 60 min with a mixing speed of 400 rev/min at room temperature (25 °C). The mixture was separated into zeolite and solution using a 0.45 μm syringe filter. The remaining paraquat concentration was determined using a ultraviolet–visible spectrophotometer (Varian CARY 300) at 257 nm. The amount of paraquat adsorbed at equilibrium (qe) was calculated by equation (2) (Rongchapo et al., 2015):
The maximum adsorption capacity of paraquat on zeolite samples was defined based on the Langmuir isotherm in equation (3) (Rongchapo et al., 2013):

Both KL and qm can be determined from the linear plot of Ce/qe versus Ce.
The Freundlich adsorption isotherm can be defined based on equation (5) (Ibrahim and Al-Jubouri, 2023; Rongchapo et al., 2013):
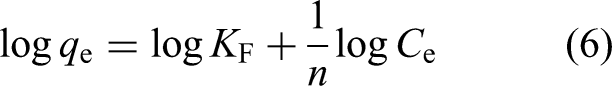
Both n and KF can be determined from the linear plot of
Results and discussion
Characterization
Morphology of zeolite by SEM–EDS
The SEM images of zeolite samples are shown in Figure 1. The samples 210H2O and 189H2O have a single phase with some aggregation; the crystal size decreases with the water content in the gel composition (Figure 1(a) and (b)). Both samples have polyhedral morphology similar to the commercial NaY (Supplemental Figure S1). As the water content in the synthesis gel was further decreased, a mixed phase was observed in 168H2O, 147H2O, and 126H2O (Figure 1(c) to (e), respectively). A few large polyhedral crystals of approximately 5 μm were observed in the sample 168H2O (Figure 1(c)). The number of large crystals increased in the samples 147H2O and 126H2O (Figure 1(d) and (e)). The morphology of these large crystals is similar to zeolite NaP2 in the literature (Tayraukham et al., 2020). At the lowest water content (126H2O), zeolite NaP2 became a dominant phase.
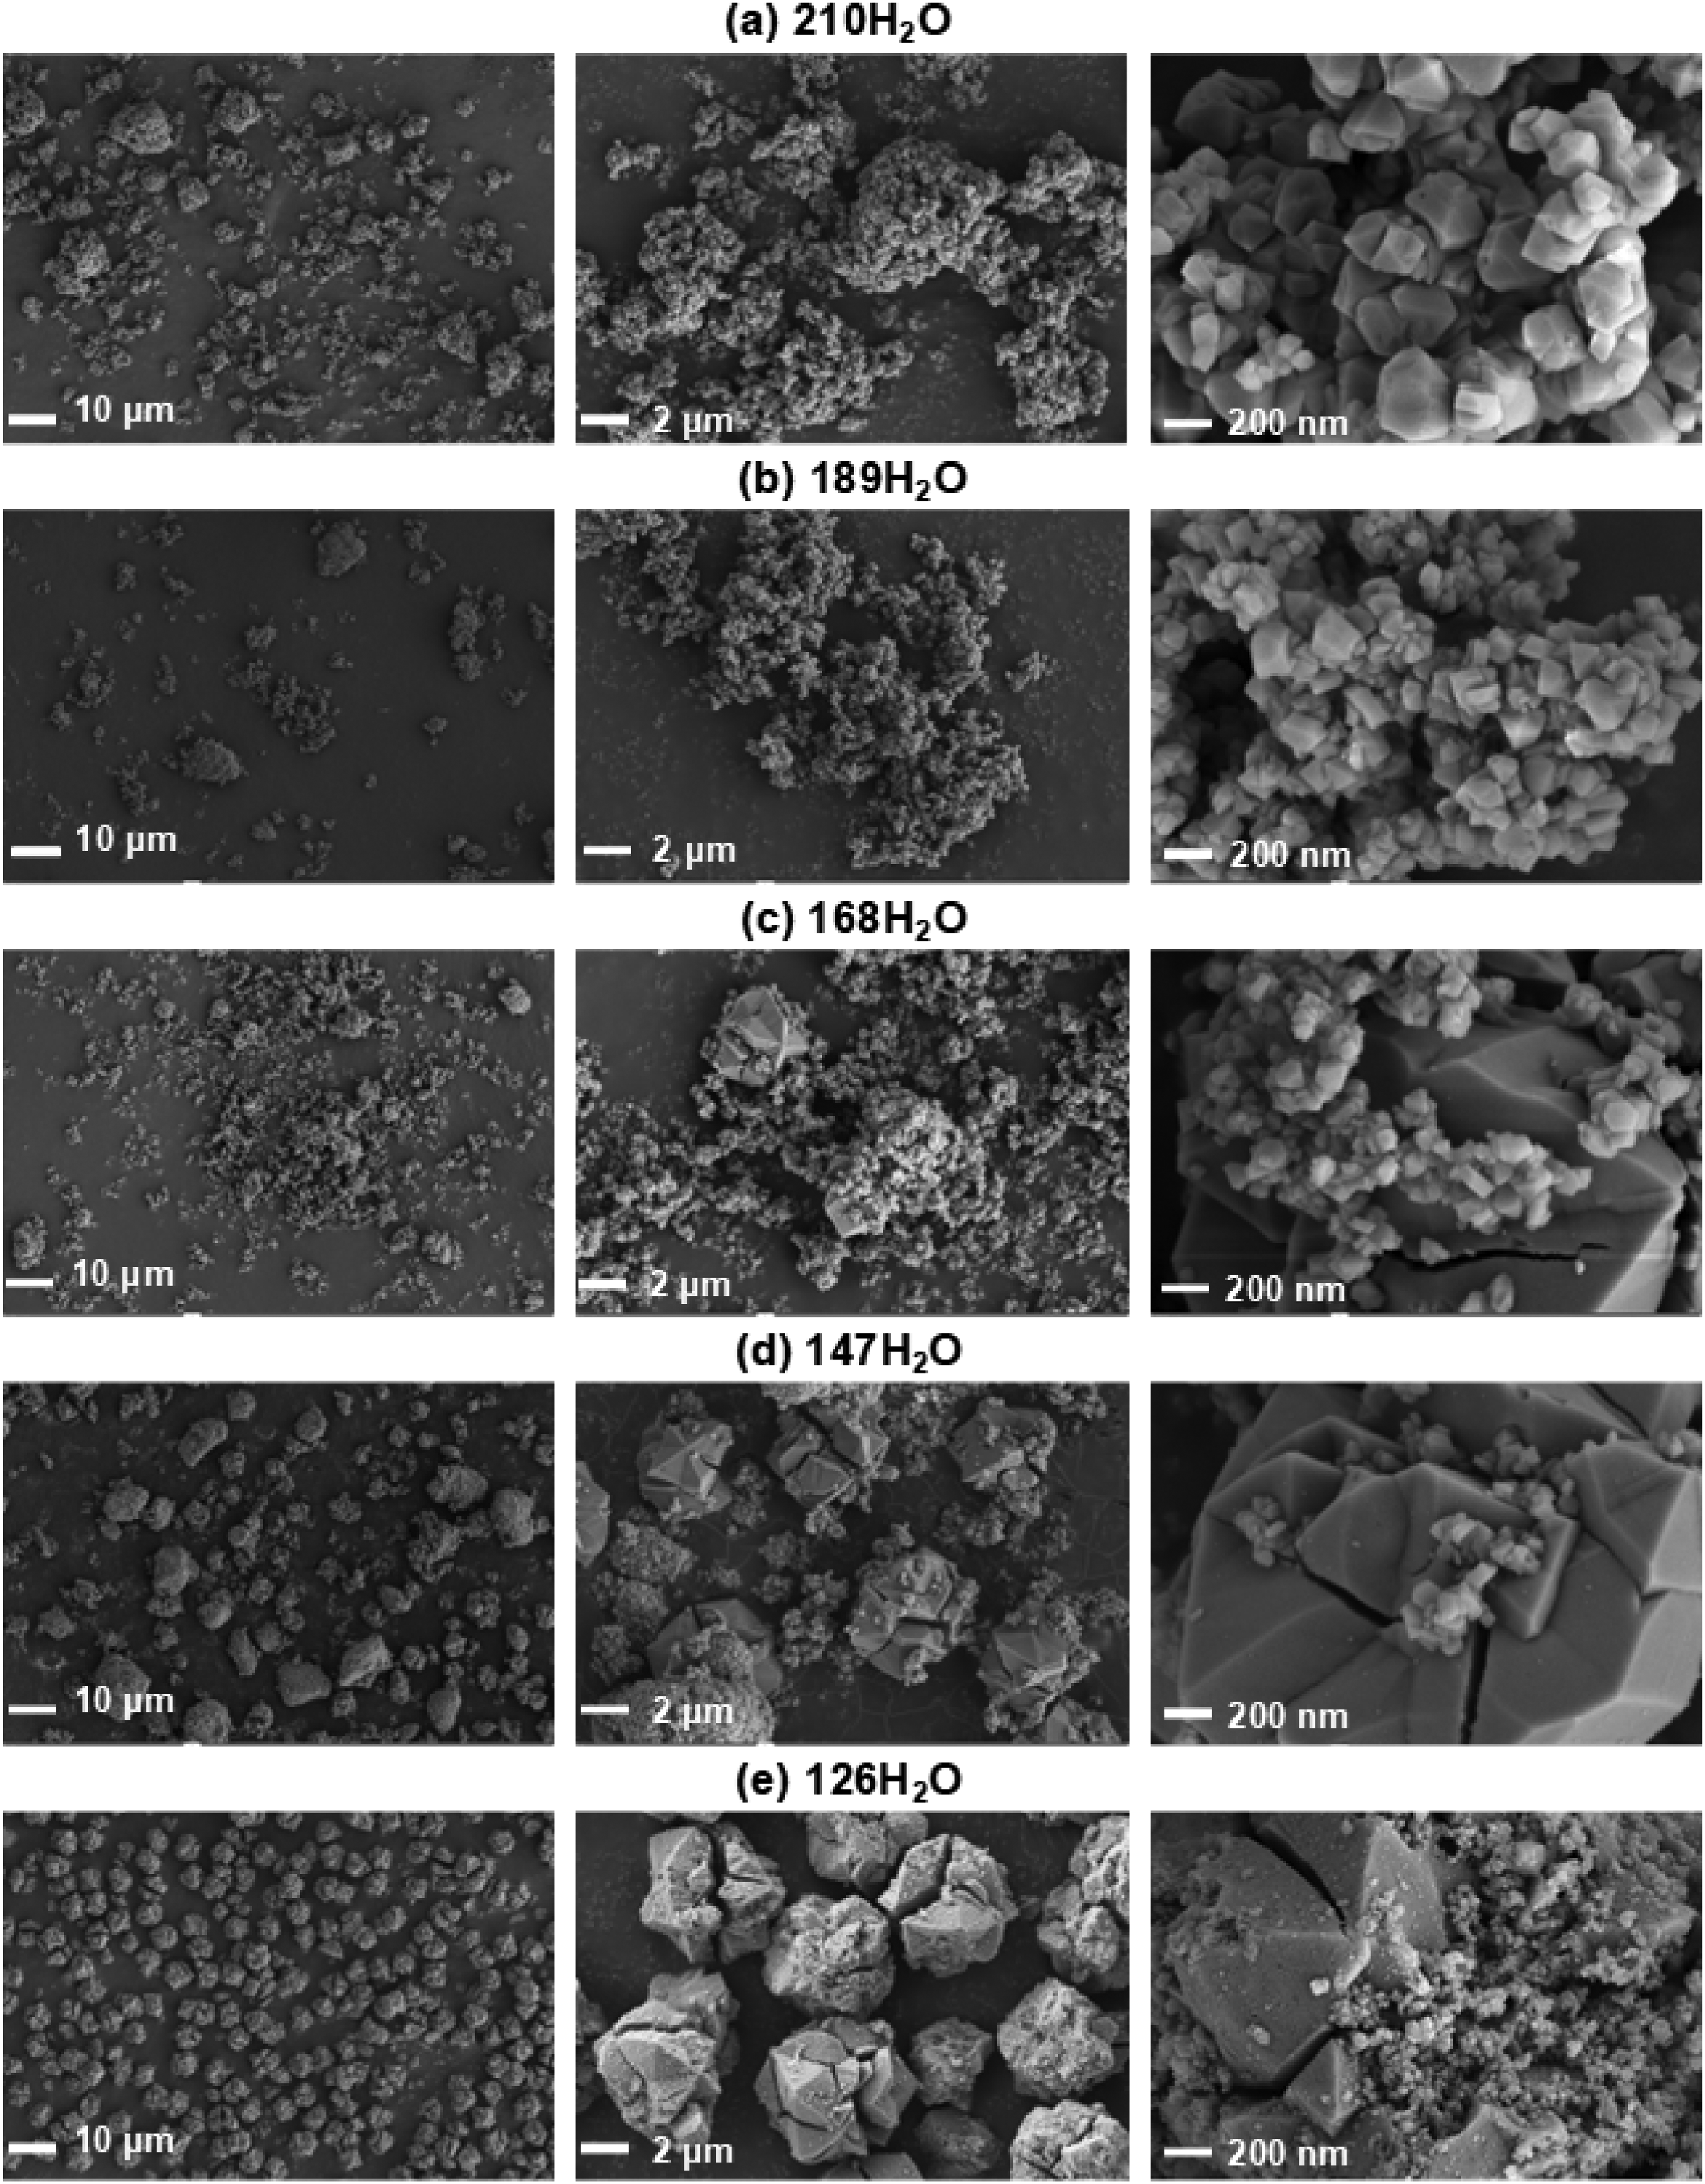
Scanning electron microscopy (SEM) images of zeolite samples synthesized from a gel with water contents of 210, 189, 168, 147, and 126 mol.
The Si/Al ratio of the zeolite samples, determined by SEM–EDS, decreased from 2.06 in 210H2O to 1.80 in 126H2O 1.9–2.0 (Table 2). The Si/Al ratio of the sample (126H2O) was 1.80, which was close to that of NaP2 in the literature (Tayraukham et al., 2020). Moreover, zeolite NaP2 and NaY with Si/Al ratio of 1.67–9.00 and 1.7–3.0 were reported in the literature (Keawkumay et al., 2019; Oleksiak et al., 2016).
Properties of zeolite samples, including Si/Al ratio, crystal size, relative crystallinity, textural property, and Langmuir parameters of paraquat adsorption on NaY samples synthesized from the gel containing 210, 189, 168, 147, and 126 mol of water.
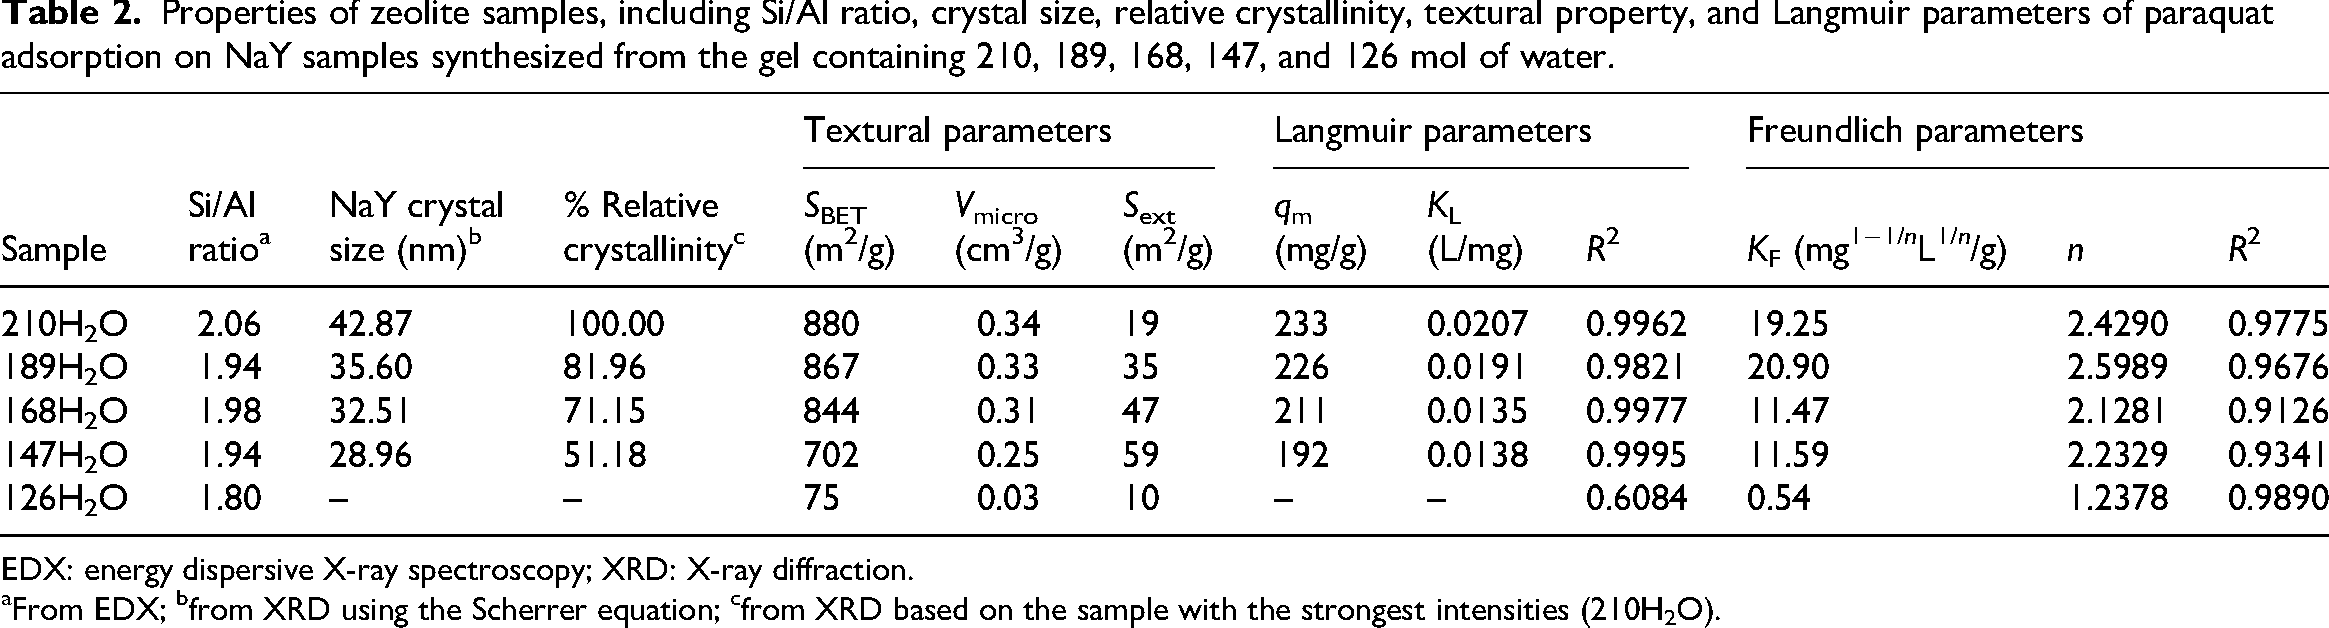
EDX: energy dispersive X-ray spectroscopy; XRD: X-ray diffraction.
From EDX; bfrom XRD using the Scherrer equation; cfrom XRD based on the sample with the strongest intensities (210H2O).
Phase of zeolite by XRD
The XRD patterns of the zeolite samples are presented in Figure 2. The samples 210H2O and 189H2O showed only the characteristic peaks of zeolite NaY. The peak intensities of 210H2O are higher than 189H2O, indicating the higher relative crystallinity and/or larger crystallite size for 210H2O, consistent with their SEM images. The peak intensities of zeolite NaY further decreased in the samples 168H2O and 147H2O, along with additional peaks corresponding to zeolite NaP2 (Oleksiak et al., 2016; Tayraukham et al., 2020). The peaks of NaP2, classified as a nonporous type, were stronger in the samples synthesized from the gel with lower water content. In sample 126H2O, zeolite NaP2 was the dominant phase. The XRD results confirm that the large crystals in the SEM images 168H2O, 147H2O, and 126H2O were zeolite NaP2. The XRD pattern of NaP2 shows more split peaks than that of NaP1 (Huo et al., 2012). The simulated XRD patterns of NaY, NaP1, and NaP2 are in Supplemental Figure S2.

X-ray diffraction (XRD) patterns of zeolite samples synthesized from a gel with water content of 210, 189, 168, 147, and 126 mol.
Crystallite sizes of NaY were calculated using the Scherrer equation and are listed in Table 2. Sample 210H2O exhibited the largest crystal size, which aligns well with the SEM measurements. The NaY crystallite size decreased progressively in the sample synthesized from a gel with decreasing water content. Since the NaY peaks were not observed in the XRD pattern of 126H2O, the NaY crystal size could not be calculated.
Functional group of zeolites by FTIR
The FTIR spectra of the zeolite samples are shown in Figure 3. All samples exhibited similar absorption bands, indicating the presence of common structural features. However, slight shifts in peak positions were observed as the water content decreased, suggesting subtle changes in the zeolite framework.

Fourier transform infrared (FTIR) spectra of zeolite samples synthesized from a gel with water content of 210, 189, 168, 147, and 126 mol.
The major bands include a strong absorption around 972 cm⁻1, attributed to the asymmetric stretching vibrations of internal tetrahedral (T–O) units (T = Si or Al), and a band near 740 cm⁻1 associated with symmetric T–O–T stretching (Bunmai et al., 2020; Keawkumay et al., 2019; Sharma et al., 2013). The band at approximately 595 cm⁻1 corresponds to double ring external linkages (O–T–O), while the bending vibration of the T–O–T framework appears around 424 cm⁻1 (Bunmai et al., 2020; Keawkumay et al., 2019; Sharma et al., 2013).
The observed rightward (blue) shift in some bands with decreasing water content may be related to the phase transformation from NaY to NaP. Although primary building units such as [SiO4] and [AlO4] remain consistent across zeolite types, variations in the arrangement of secondary building units can alter vibrational frequencies. These changes reflect the evolving framework structure due to synthesis conditions, in agreement with the literature (Król et al., 2012; Mozgawa, 2001).
Textural properties of zeolite by N2 adsorption–desorption analysis
The nitrogen adsorption–desorption isotherms of the zeolite samples are shown in Figure 4. Samples 210H2O, 189H2O, 168H2O, and 147H2O exhibited Type I isotherms, which are characteristic of microporous materials, according to the International Union of Pure and Applied Chemistry classification (Thommes et al., 2015). These isotherms show a steep nitrogen uptake at very low relative pressure (P/P 0 < 0.01), indicating the presence of narrow micropores. The samples containing a higher fraction of nonporous NaP have lower adsorbed volume. Thus, 126H2O has the lowest adsorbed volume.
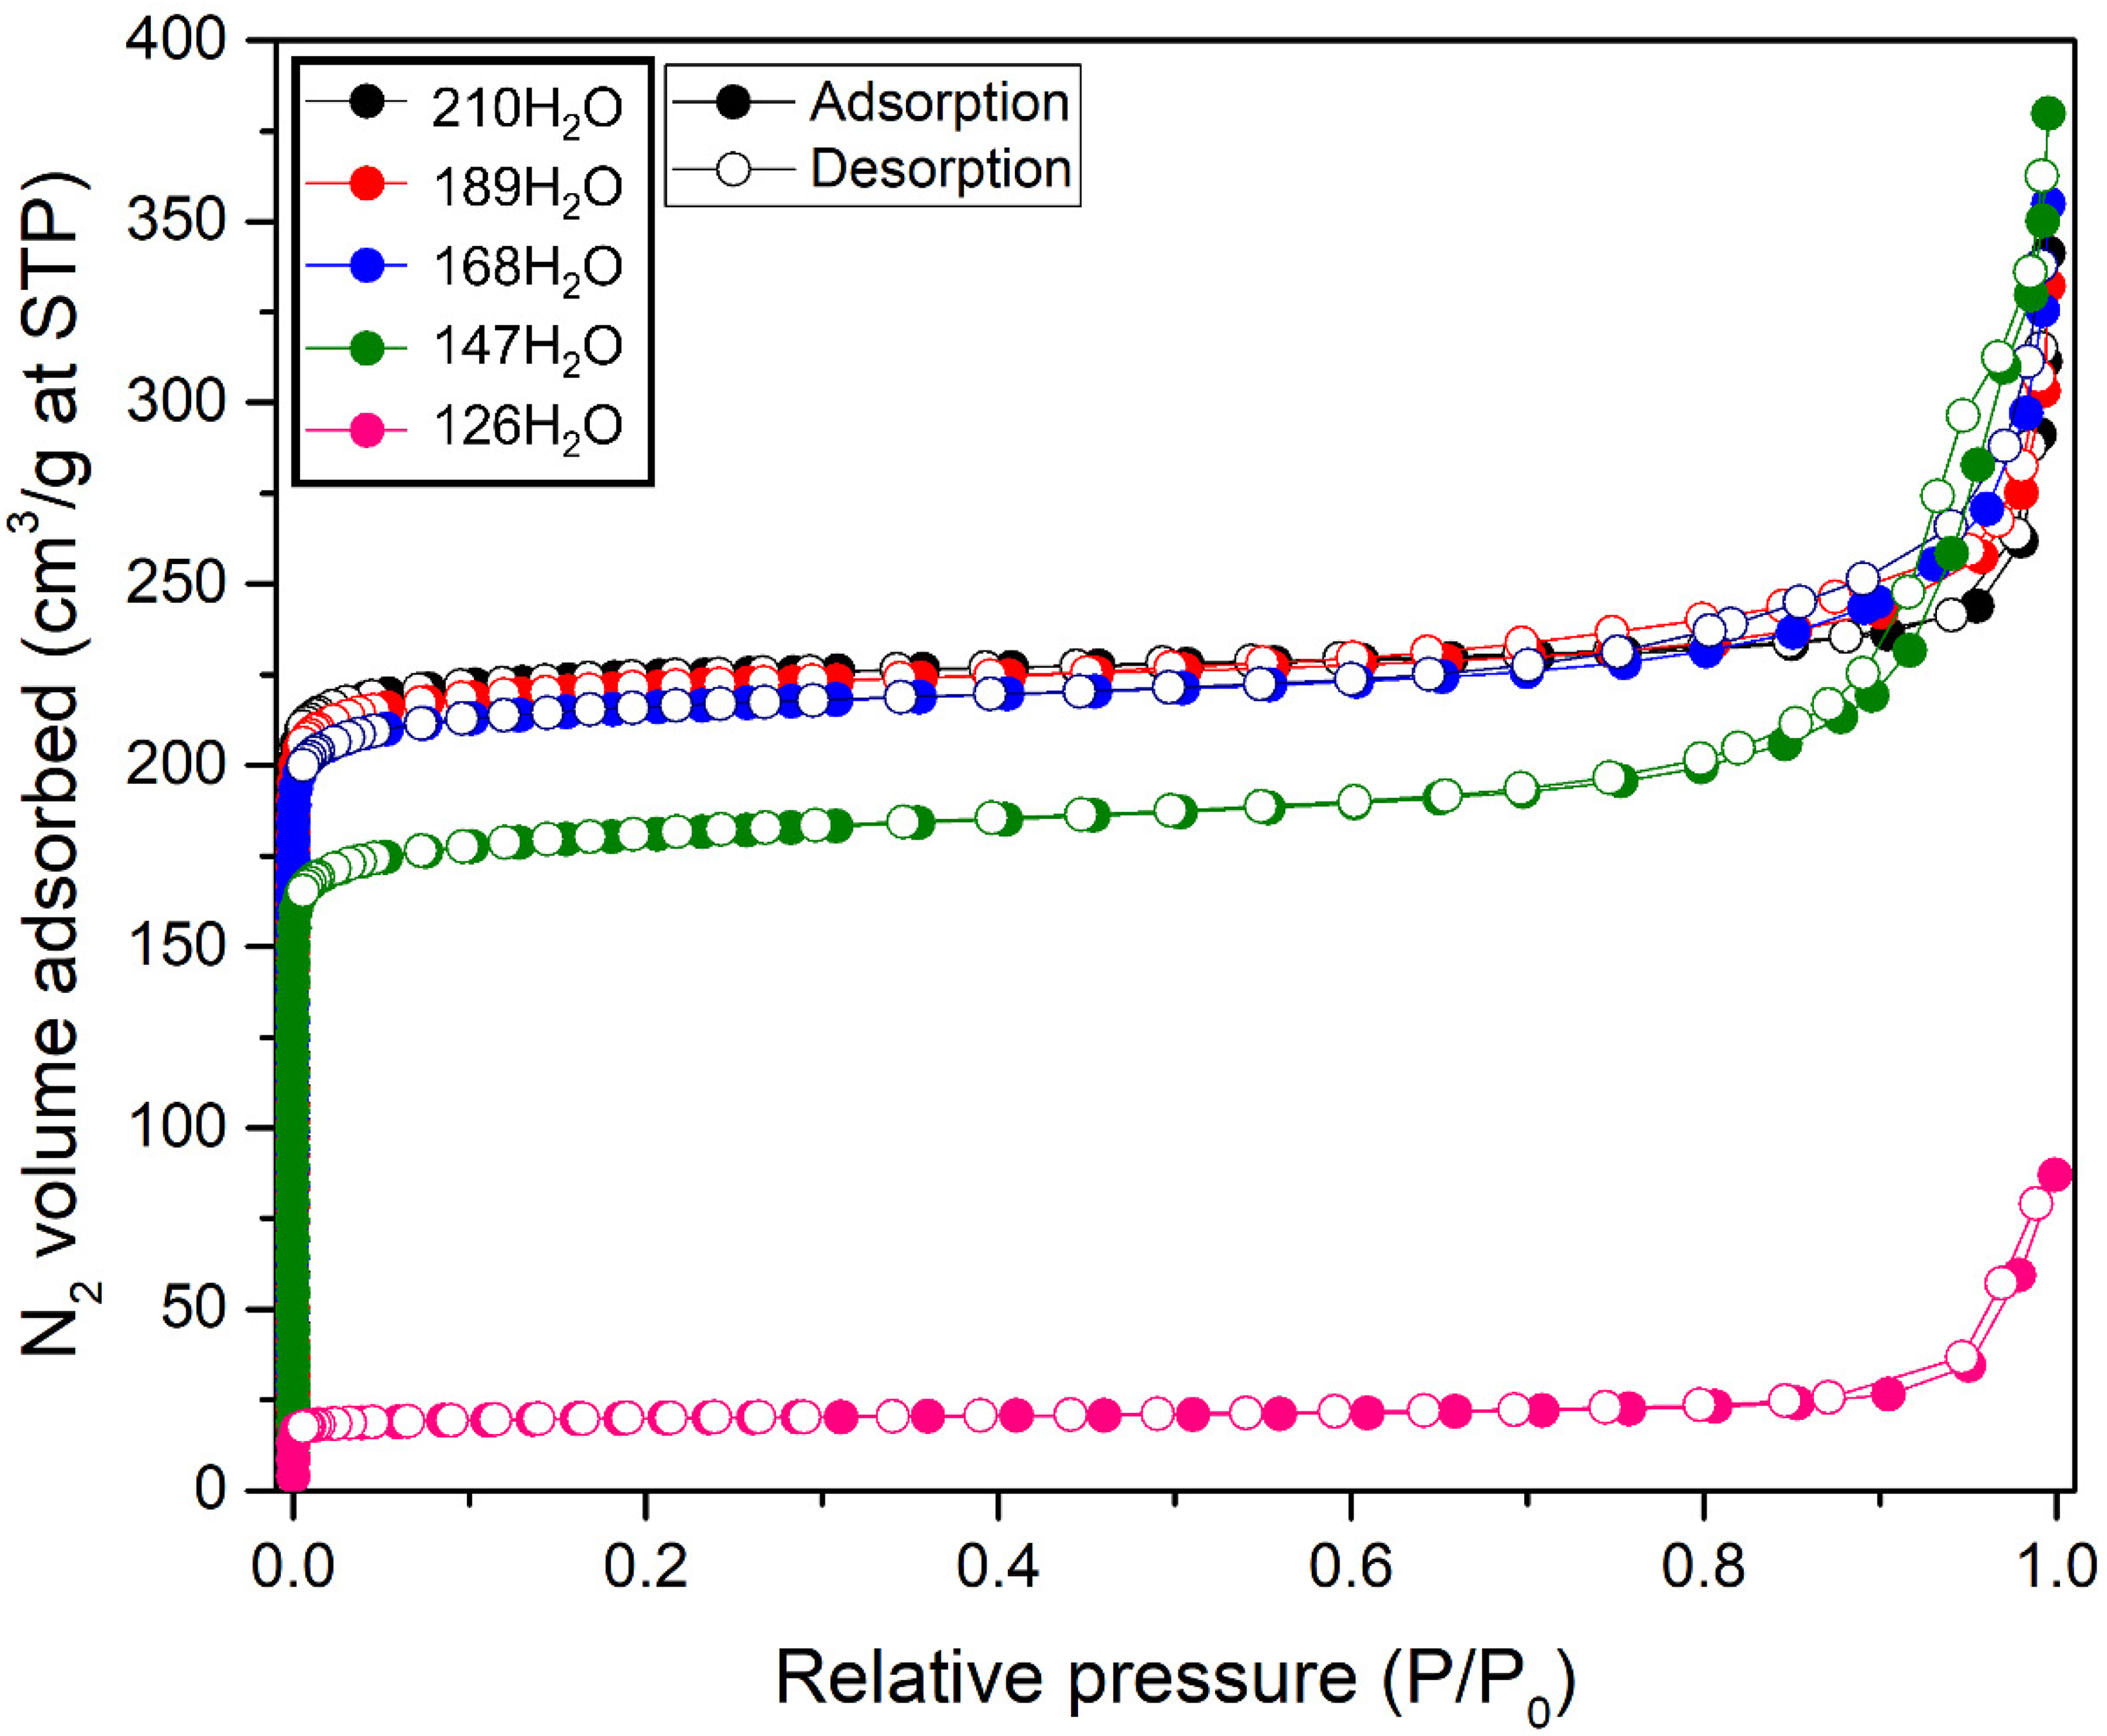
N2 adsorption-desorption isotherms of NaY zeolites synthesized from the gel with water content of 210, 189, 168, 147, and 126 mol.
The BET surface areas and micropore volumes of the samples are summarized in Table 2. The samples synthesized from a gel with decreasing water content had a smaller BET surface area and microporosity. These results are consistent with the phase transformation from NaY to NaP.
Thermogravimetric analysis indicates mass losses attributable to dehydration below ∼200 °C, with a minor additional loss up to ∼250 °C consistent with dehydroxylation; no high-temperature claims are made here (Supplemental Figure S3)
From characterization data, the zeolite synthesis gel composition has an influence on the crystallinity and physicochemical properties of zeolite NaY. Different amounts of water affect the evolution of phase composition and crystallinity, with gel water/basicity providing the structural basis for the adsorption behavior evaluated in the next section.
Paraquat adsorption
The paraquat adsorption isotherms of the zeolite samples synthesized from a gel with different water contents are shown in Figure 5. The corresponding Langmuir and Freundlich parameters, derived from linear fitting (Supplemental Figure S4), are summarized in Table 2.

Paraquat adsorption isotherms on zeolites synthesized from the gel with different water contents.
For zeolites containing the NaY phase, the adsorption data fit well to the Langmuir model, indicating that paraquat molecules adsorbed onto homogeneous binding sites, forming a monolayer. The trend of adsorption capacity and affinity constant conforms with the Si/Al ratio, crystal size, and surface area, namely, 210H2O > 189H2O > 168H2O > 147H2O, consistent with earlier findings (Keawkumay et al., 2019). In FAU, the exposed extraframework cation sites (SII/SIII in the supercages) dominate adsorption of cationic species; their accessibility and distribution govern affinity. Reviews of faujasites identify SII/SIII as key adsorption sites and show how cation distribution affects uptake strength—again explaining higher KL when well-crystallized FAU predominates (Daems et al., 2006).
In contrast, the 126H2O sample, which predominantly contained zeolite NaP, exhibited a better fit to the Freundlich model, suggesting multilayer adsorption on a heterogeneous surface, typical of low-porosity or nonporous materials. Zeolite Y (FAU family) has 12-MR windows with an effective diffusion diameter of ≈7.35 Å, whereas zeolite P (GIS family) is much tighter, ≈3.3 Å along each axis (Baerlocher et al., 2025). Thus, bulky dications such as paraquat with transverse ∼6.3 × 4.6 Å can enter FAU supercages (Han et al., 2025) but are size-excluded from GIS; accessible strong sites in FAU boost 𝐾L, whereas GIS presence lowers it. Overall, these results demonstrate a clear relationship between zeolite phase, textural properties, and paraquat adsorption performance. High-crystallinity NaY with a microporous structure provides superior adsorption capacity, whereas the formation of nonporous NaP under high-basicity/low-water conditions greatly diminishes adsorption efficiency. In terms of kinetics, paraquat adsorption on NaY obeys the pseudo-second order (Pukcothanung et al., 2018).
Conclusions
Gel composition, specifically water content together with basicity, governs the formation of FAU (NaY) versus NaP and the resulting crystallinity and microporosity of the products. High-water gels yield phase-pure, highly crystalline NaY with large microporosity, whereas decreasing water promotes NaP intergrowth and, at the lowest water content, NaP dominance; texture changes track this phase evolution. In aqueous paraquat removal at ambient conditions, NaY-containing samples follow Langmuir behavior with capacities and affinity constants that decline as crystallinity/microporosity decrease, while the NaP-rich material follows Freundlich, consistent with heterogeneous weak adsorption. These results establish a direct synthesis–structure–performance link for non-calcined, Na-form FAU and indicate that tuning gel water/basicity is a practical lever to maximize accessible Na⁺ exchange sites and adsorption performance while avoiding phase drift to NaP. Future work should decouple dilution from basicity and evaluate regeneration and competitive ions.
Supplemental Material
sj-docx-1-adt-10.1177_02636174251382687 - Supplemental material for Gel composition controls phase evolution and paraquat uptake by zeolite NaY
Supplemental material, sj-docx-1-adt-10.1177_02636174251382687 for Gel composition controls phase evolution and paraquat uptake by zeolite NaY by Panot Krukkratoke, Wiraporn Songpakam, Boonyakorn Srisassawatkul, Chalermpan Keawkumay, Nattawut Osakoo, Sanchai Prayoonpokarach and Jatuporn Wittayakun in Adsorption Science & Technology
Footnotes
ORCID iDs
Funding
The authors disclosed receipt of the following financial support for the research, authorship, and/or publication of this article: This work was supported by the (i) Suranaree University of Technology (SUT), (ii) Thailand Science Research and Innovation (TSRI), and (iii) the National Science, Research, and Innovation Fund (NSRF) under NRIIS Project No. 195577.
Declaration of conflicting interests
The authors declared no potential conflicts of interest with respect to the research, authorship, and/or publication of this article.
Supplemental material
Supplemental material for this article is available online.
References
Supplementary Material
Please find the following supplemental material available below.
For Open Access articles published under a Creative Commons License, all supplemental material carries the same license as the article it is associated with.
For non-Open Access articles published, all supplemental material carries a non-exclusive license, and permission requests for re-use of supplemental material or any part of supplemental material shall be sent directly to the copyright owner as specified in the copyright notice associated with the article.