
Abstract
The nature of paraquat adsorption is compared between zeolite NaX and NaY which have the same faujasite structure but different Si/Al ratio, namely 1.2 and 2.2, respectively. The adsorption was proposed to occur via ion exchange and expected to increase with Al content. However, NaX had a lower paraquat adsorption capacity than NaY. The bare and paraquat-containing zeolites (PQX and PQY) were characterized by Fourier transform infrared spectroscopy, X-ray diffraction, N2 adsorption–desorption analysis, magic-angle spinning nuclear magnetic resonance (MAS) NMR, and X-ray photoelectron spectroscopy. The presence of adsorbed paraquat was confirmed by Fourier transform infrared spectroscopy. Paraquat adsorbed in supercages of the zeolites resulting in a decrease of surface area and displacement of sodium cations. Results from 23Na MAS NMR and X-ray photoelectron spectroscopy indicated that interaction of sodium ions in the cavity of NaX was stronger than that in NaY, making it less exchangeable with paraquat.
Introduction
Paraquat is one of the most used herbicides in Nakhon Ratchasima, Thailand. It is a toxic compound to human and animals when exposed via ingestion, skin contact, or splash to eyes. Moreover, it is rapidly distributed in most tissues with the highest concentration found in lungs and kidneys (Suntres, 2002; United States Environmental Protection Agency, 1997). Paraquat is not degradable by light. With a high solubility, paraquat can easily contaminate and accumulate in surface water (Pateiro-Moure et al., 2010). There are several reports on paraquat removal from aqueous solutions by adsorption on various porous materials including silica (SiO2), zeolite NaBEA, NaY, NaX, mesoporous materials MCM41 and Al-MCM-41 (Brigante and Schulz, 2011; Ibrahim and Jbara, 2009; Nur et al., 2005; Rongchapo et al., 2013, 2015).
From our previous work (Rongchapo et al., 2013) zeolite NaY had the maximum paraquat adsorption capacity of 185 mg/g-adsorbent, higher than rice husk silica, zeolite NaBEA, NaZSM-5, and mesoporous MCM-41. The adsorption was proposed to occur via ion exchange and increased with Al content in the adsorbents. A further study reported that an addition of Al to mesoporous MCM-41 raised the maximum adsorption capacity (Rongchapo et al., 2015). However, zeolite NaX which has a higher Al content than NaY had a lower adsorption capacity, namely, 120 mg/g-adsorbent (Rongchapo et al., 2015).
Zeolite X and Y have faujasite structure containing periodic supercages. Each supercage has a diameter of 1.3 nm and four open windows with a diameter of 0.74 nm (Guisnet and Gilson, 2002). The Si/Al ratios of NaX and NaY from our works are 1.2 and 2.2, respectively (Rongchapo et al., 2013, 2015). The presence of an Al atom in the zeolite framework generates a negative charge which requires a charge balancing cation. The cation in the zeolite supercage could exchange with paraquat cation which has a dimension of 1.34 nm × 0.64 nm × 0.34 nm (Zhang et al., 2006).
The goal of this work was to understand the nature of paraquat adsorption on the zeolites NaX and NaY. The bare zeolites and those containing paraquat (PQX and PQY) were analyzed by several techniques.
Experimental
Paraquat, commercial grade (27.6 %w/v, Masda) was used in the adsorption. NaX and NaY were synthesized as described in the literature (Rongchapo et al., 2013, 2015). Zeolites containing paraquat (PQX and PQY) were prepared by adding 1.0 g of adsorbent into 400 mL of 1000 ppm paraquat solution and stirred at room temperature for 60 minutes (Rongchapo et al., 2013), separated, washed with 5 L of distilled water and dried at 90℃ for 24 hours.
PQX and PQY were characterized by Fourier transform infrared spectroscopy (FTIR) using a Bruker Tensor 27 FTIR with ATR mode in the range from 4000 to 300 cm−1 with a resolution of 2 cm−1. Phase and structure of zeolite were confirmed by powder X-ray diffraction (XRD) using a Bruker D8 ADVANCE with Cu Kα radiation at 40 kV and 40 mA. The N2 adsorption–desorption analysis was carried out at a relative pressure from 0.01 to 0.99 on a Micromeritics ASAP 2010 analyzer. The samples were degassed under vacuum at 300℃ for bare adsorbents and 150℃ for the paraquat-containing zeolites for eight hours before the measurement. Surface areas were calculated by Brunauer-Emmett-Teller (BET) method. External surface areas and micropore areas were calculated by the t-plot method.
The bare NaX and NaY zeolites were analyzed by 23Na MAS NMR using Bruker Avance III 500 MHz spectrometer with a 23Na Larmor frequency of 132.36 MHz. Four millimeter zirconia rotors were spun at 6 kHz using a Bruker MAS/BB/1H/19F probe. A one pulse sequence was applied and a recycle delay of 5.00 seconds was used. Spectra were referenced using pure NaCl powder at zero ppm. Software data analysis used was Bruker Topspin 3.2.
Morphology of the bare NaX and NaY was studied by a Carl Zeiss Auriga Field Emission Scanning Electron Microscope at 5.00 kV of working acceleration voltage and secondary electron (SE) detector. Each sample (0.2 mg) was dispersed in 4 mL ethanol, dropped to cover glass and stacked on SEM stub. It was dried at 70℃ overnight and coated with gold with a thickness of 3.5 nm using Leica EM ACE600 instrument.
Finally, the interaction between Na cation and the zeolite was studied by X-ray photoelectron spectroscopy (XPS, ULVAC-PHI, PHI 500 VersaProbe II) using Al Kα radiation from Thailand Synchrotron Light Research Institute. Before the measurement, NaX and NaY were dried at 90℃ for 24 hours on carbon tape. The vacuum in the analysis chamber was controlled at lower than 10−9 mbar during the measurement. The C1s photoelectron line at 284.80 eV was a reference spectrum. The Si2p photoelectron lines were employed to normalize the amount of Na1s in the sample.
Results and discussion
Figure 1 shows FTIR spectra of NaX, NaY, PQX, and PQY. Peaks of paraquat were observed at 1558, 1359, 1278, 1230, 1176, and 850 cm−1 (Dinis-Oliveira et al., 2008; Hennessy et al., 1999; Hsu and Pan, 2007). Those peaks were also observed in the spectra of PQX and PQY indicating the presence of paraquat on the zeolites. However, the peaks of PQ at 1359, 1278, and 850 cm−1 assigned to the vibration of the benzene ring and partial vibration of C–H in methyl group (Hennessy et al., 1999) shifted to 1336, 1269, and 831 cm−1, respectively in PQX and PQY. The result indicated some interactions between aromatic rings, methyl groups, and the zeolite framework. While the characteristic peaks of T-O-T vibration of zeolite NaY around 970 and 561 cm−1 did not change.
FTIR spectra of bare zeolites (NaX and NaY) and paraquat containing zeolites (PQX and PQY).
XRD patterns of NaX, NaY, PQX, and PQY are shown in Figure 2. Main peaks of PQX and PQY were similar to those of the bare zeolites (Rongchapo et al., 2013, 2015). XRD results indicated that paraquat adsorption did not change the zeolite structure. However, intensities of the planes (220) and (311) from the pattern of PQX and PQY were different from those of NaX and NaY. The intensity ratio I(220)/I(311) explains a change in the distribution of sodium ions from their random positions in supercages to specific sites (I′, II) by an incorporation of a large ion (Kozlov et al., 1998; Nakayama et al., 2003), in our case, paraquat dication. The change of I(220)/I(311) after the paraquat adsorption indicating the displacement of sodium ions in supercages. The result suggested that paraquat adsorption occurred through cation exchange (Zhang et al., 2006).
XRD patterns of bare zeolites (NaX and NaY) and paraquat-adsorbed zeolites (PQX and PQY).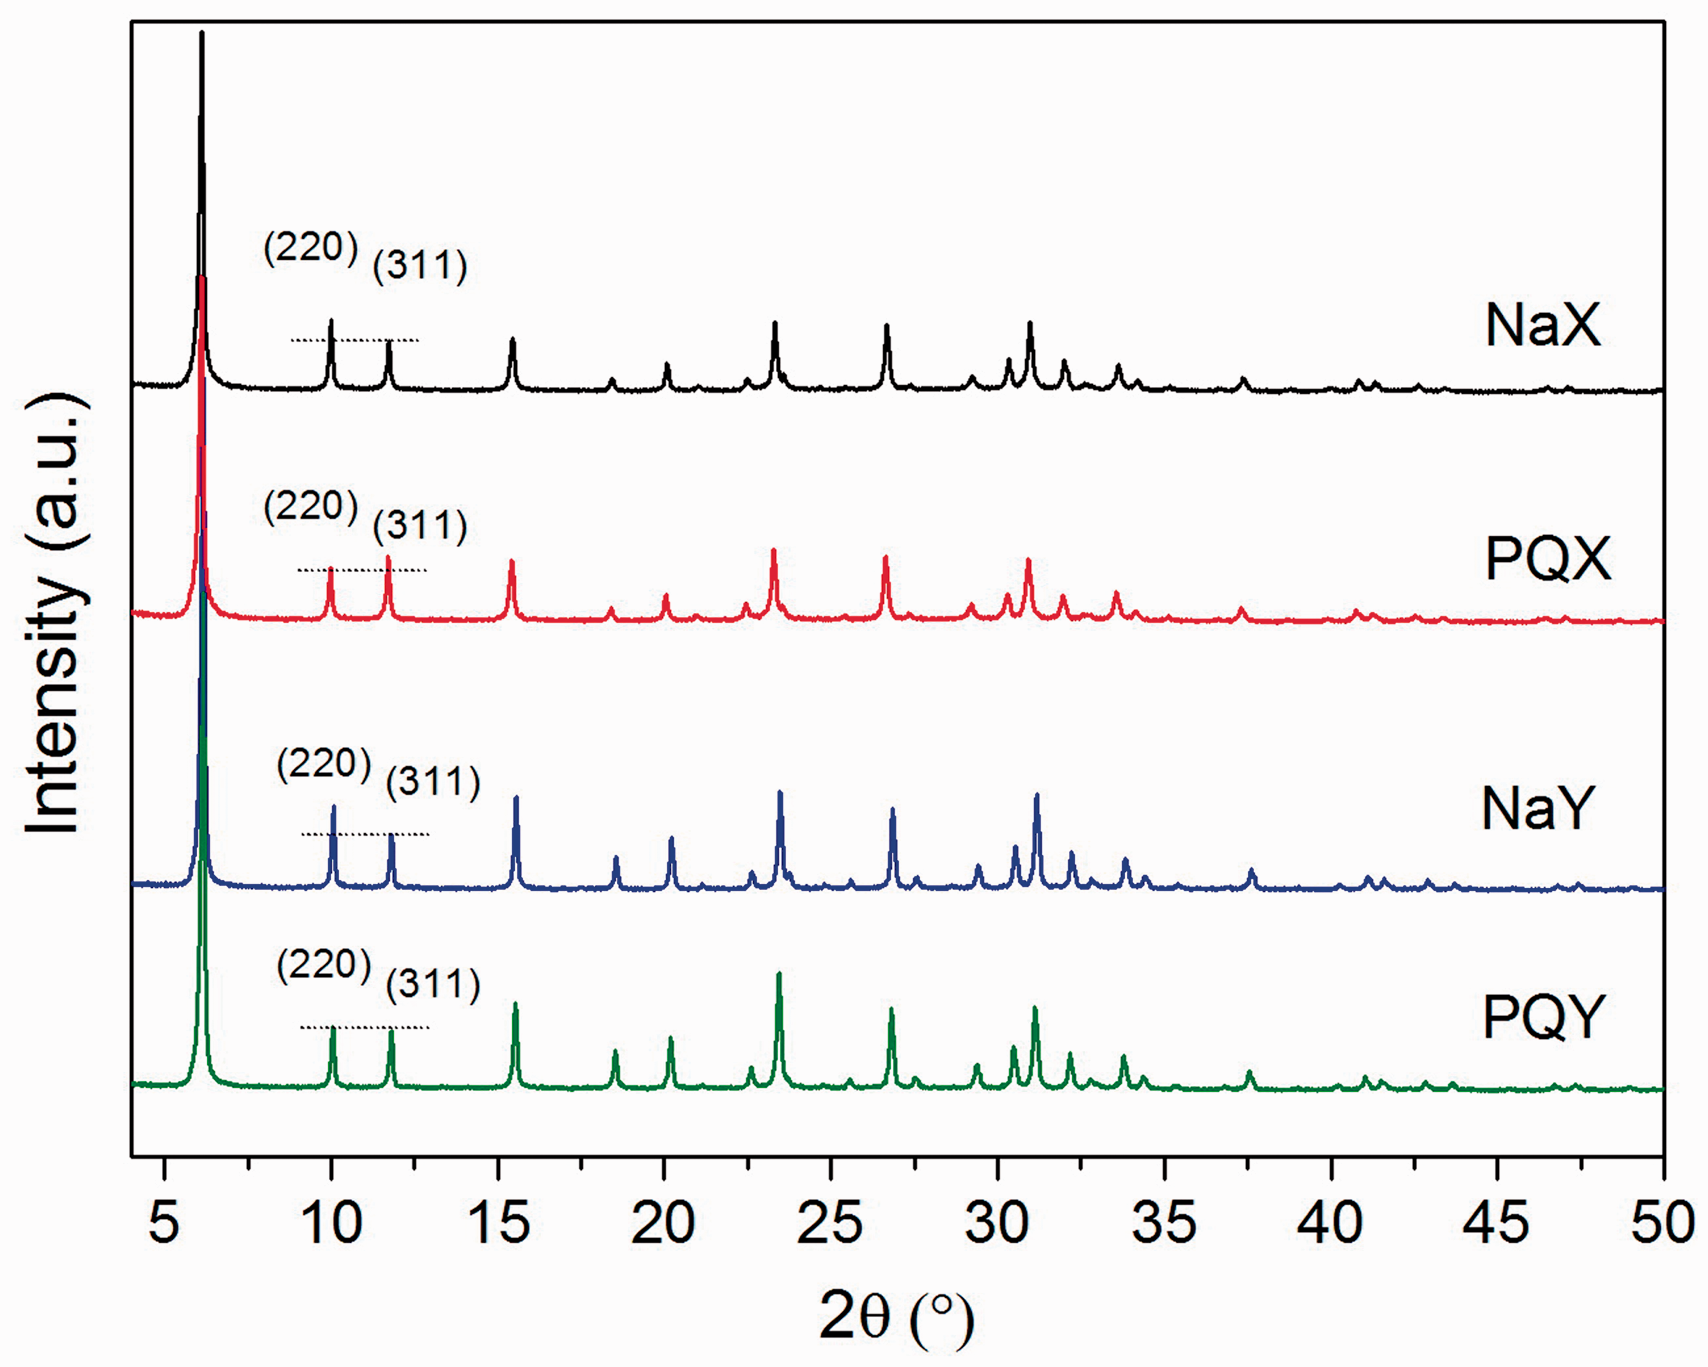
N2 adsorption–desorption isotherms of all samples are shown in Figure 3. As reported in the previous works, the isotherms of bare NaX and NaY were type I which is a characteristic of the microporous material (Rongchapo et al., 2013, 2015). After paraquat adsorption, the isotherms of PQX and PQY were still type I but the micropore volume decreased indicating that paraquat adsorbed mainly in micropores.
Nitrogen adsorption (filled)–desorption (empty) isotherms of bare zeolites (NaX and NaY) and paraquat-adsorbed zeolites (PQX and PQY).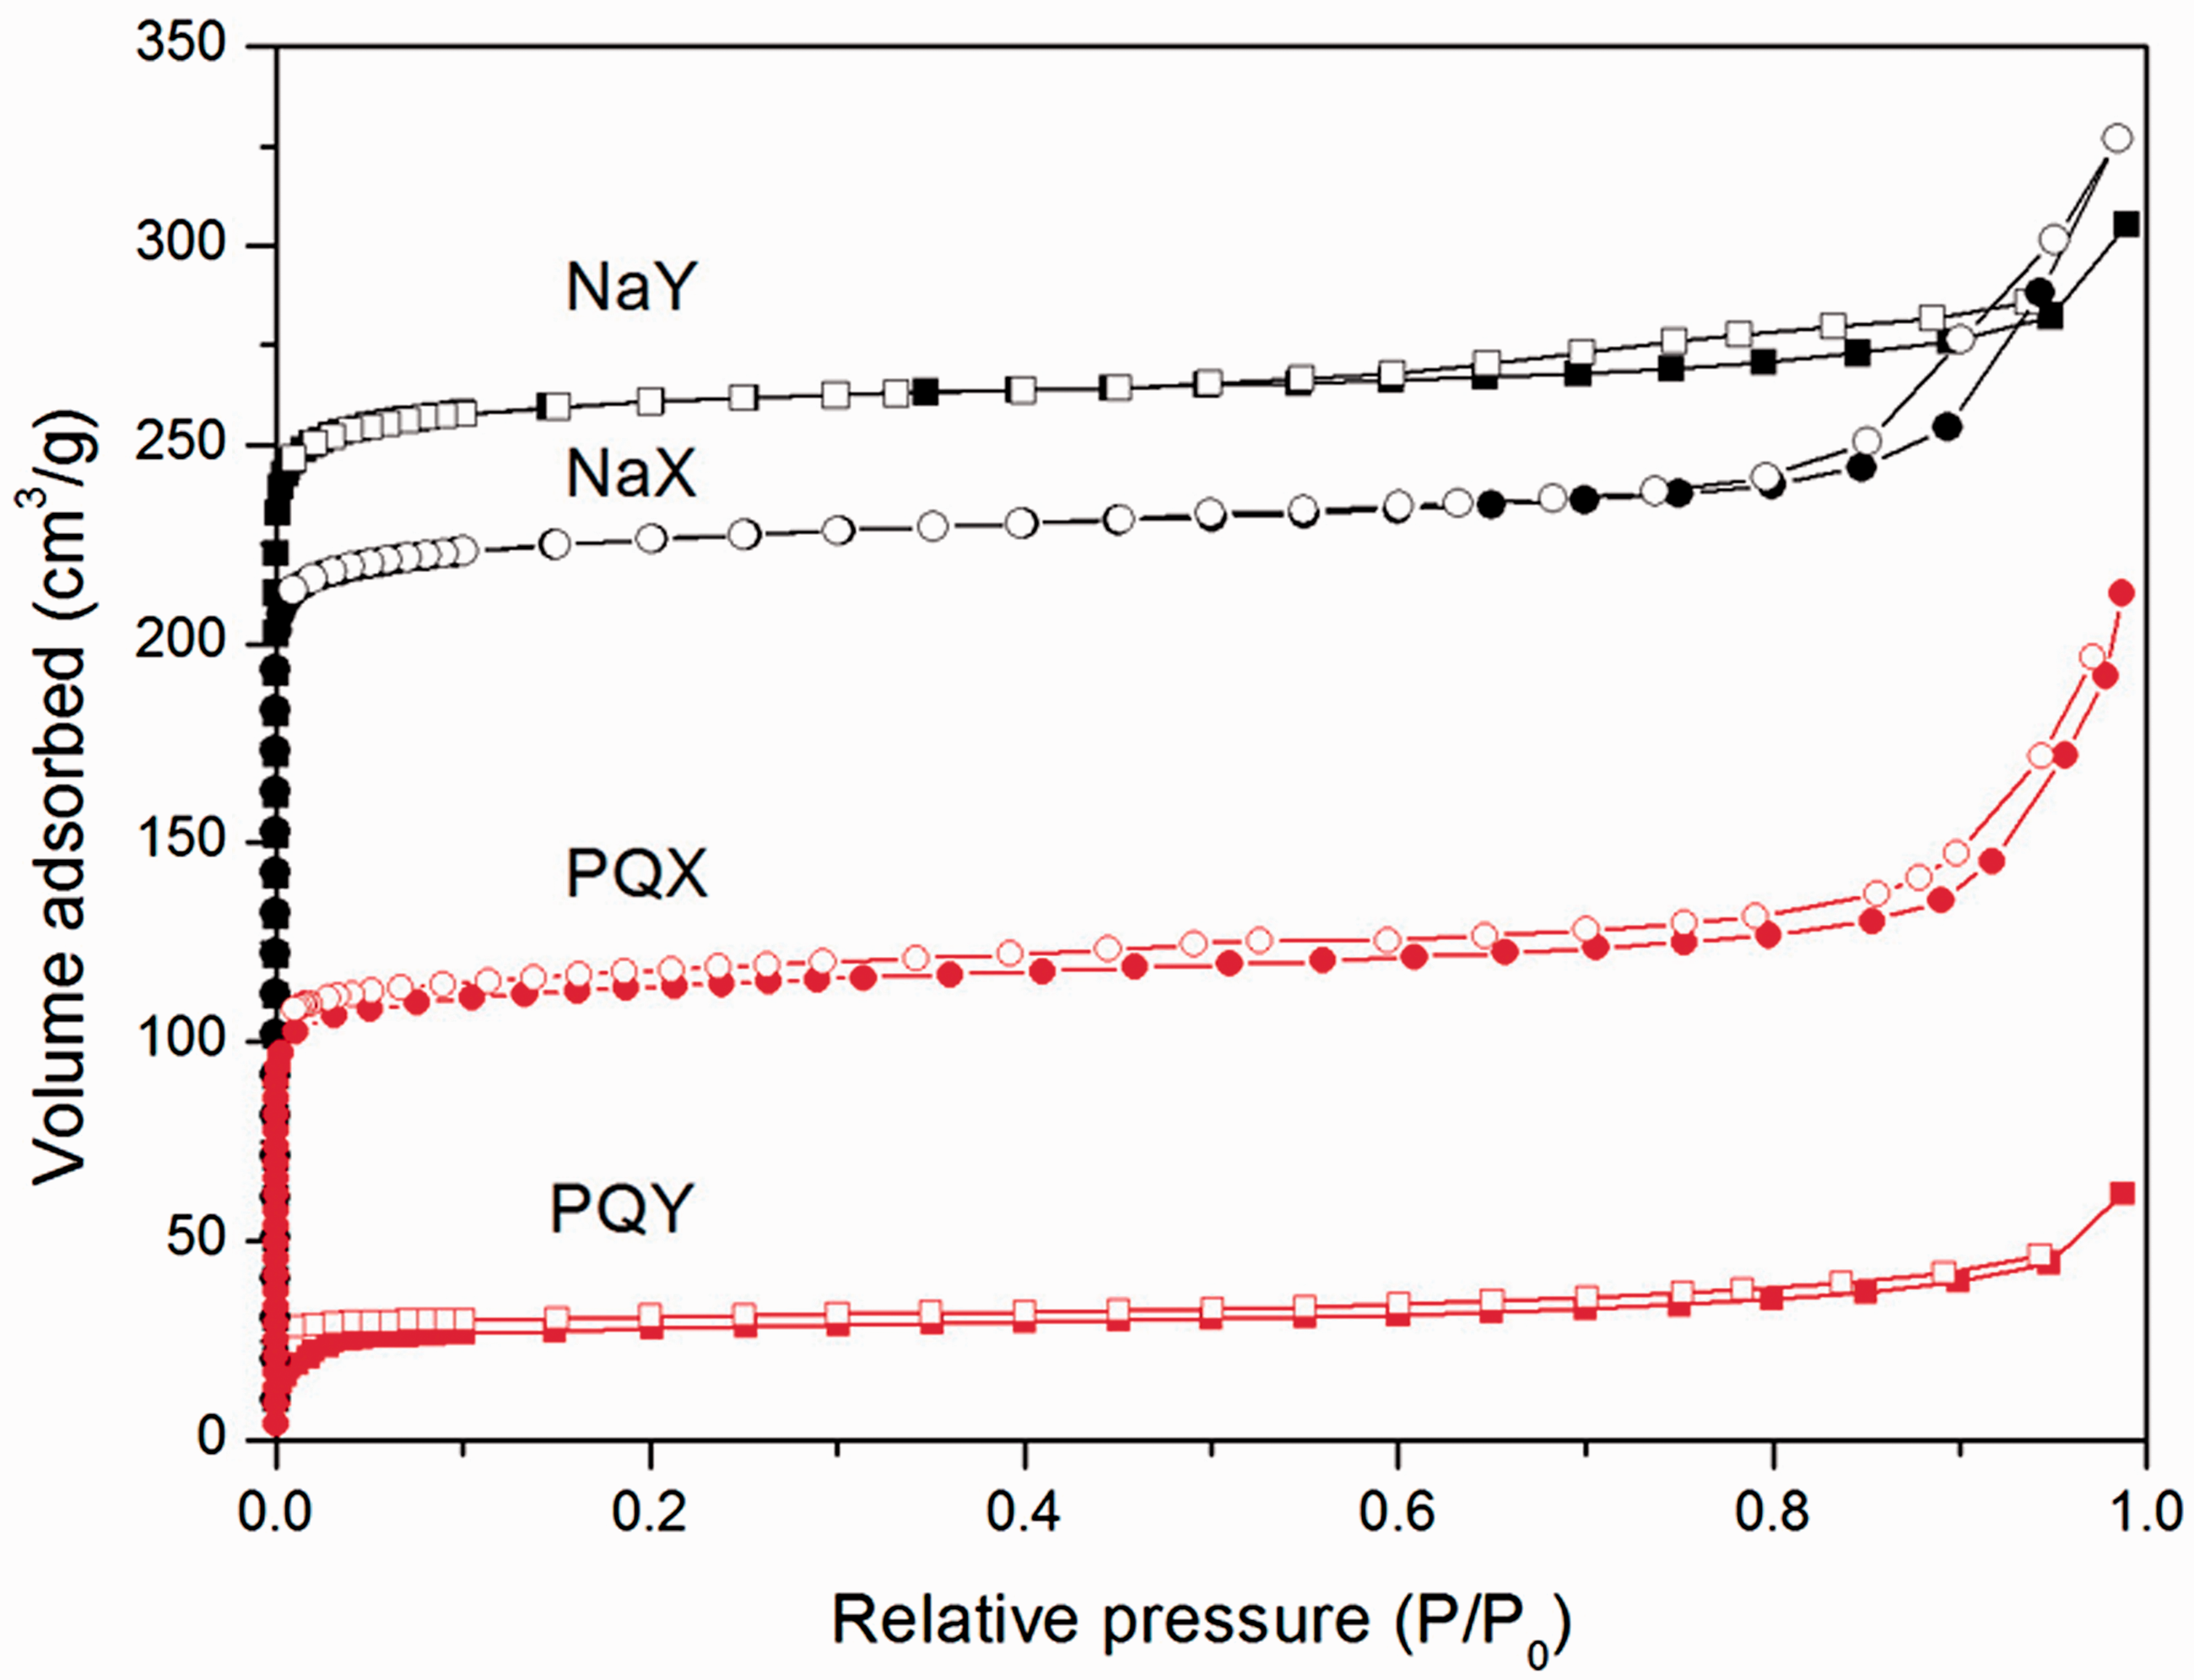
The surface area of NaX and NaY with and without paraquat (PQ) obtained from N2 adsorption–desorption isotherm.

BET method.
t-Plot method.
SEM images of NaX and NaY are shown in Figure 4. Both zeolites are nonuniform polycrystals with different morphology. NaX had long shape crystals binding together to form particles with sizes around 1 µm. NaY had smaller but denser particle composed of cubical crystals growing out from the center.
SEM images of NaX (a) and NaY (b).
Figure 5 displays 23Na MAS NMR spectra of NaX and NaY. They show peaks at −7.07 and −8.32 ppm, respectively. The lower chemical shift from the zeolite with the higher Si/Al ratio, namely NaY, was due to the weaker interaction between sodium ions and O atom in the framework (Lee and Stebbins, 2003). Therefore, sodium ions in NaY had a weaker interaction with the zeolite framework and could be exchanged more easily than that in NaX.
23Na MAS NMR spectra of bare zeolites (NaX and NaY).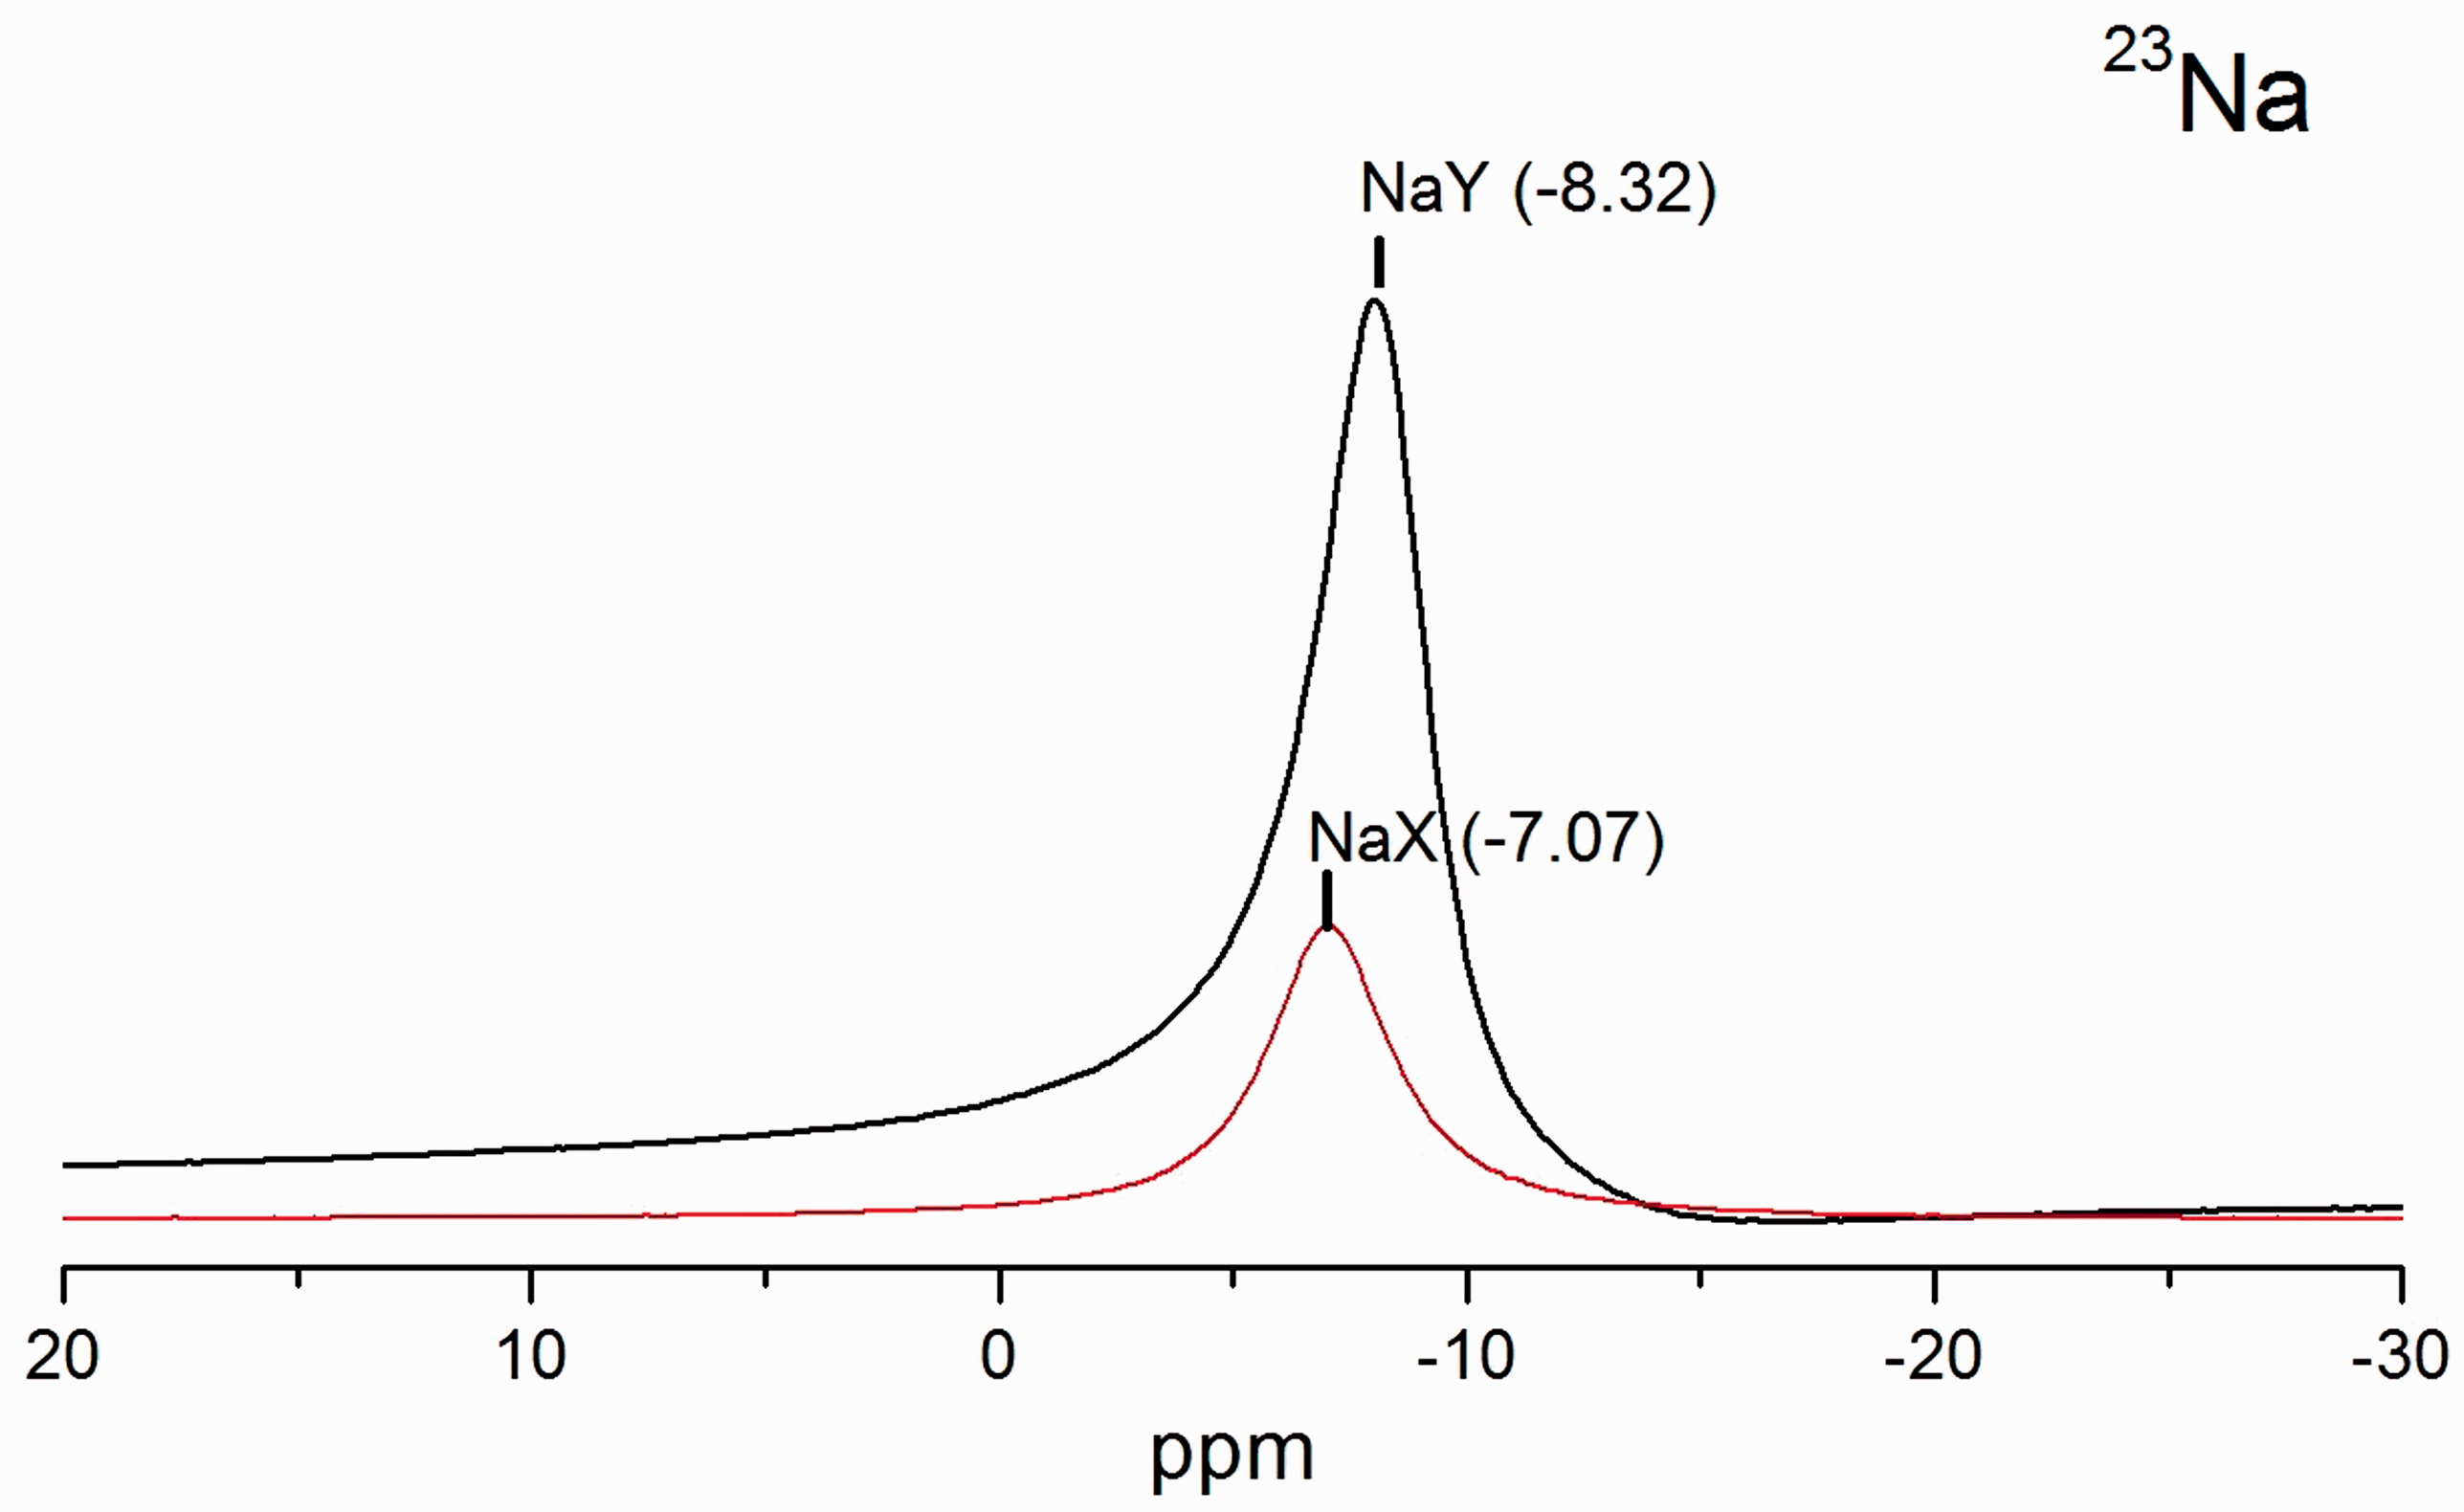
Feuerstein et al. (1996) studied characteristic of sodium ions in dehydrated NaX and NaY with various Si/Al ratio by 23Na MAS NMR. The main peak of sodium ions is from the site II in NaY. Sodium ions locate near the six-ring window in the supercage. In contrast, sodium ion in NaX is near the idealized site III at the four rings in the supercage. The sodium ions in supercage could exchange with paraquat (Zhang et al., 2006). However, the interaction of sodium ions in NaX at site III was stronger than that at site II. The cation on site III might repulse positive charge of paraquat dication resulting in a lower adsorption capacity than NaY.
Figure 6 shows Na1s binding energy of NaX and NaY from XPS. Zeolite contains Si, Al, O framework atoms and charge balancing cation. Na1s binding energies of NaX and NaY were observed at 1070.85 and 1071.30 eV, respectively. The lower binding energy of NaX than that of NaY was also reported in the literature (Grünert et al., 1994). Barr (1990) stated that increasing Si/Al ratio caused an increase in ionicity of Na–O bond. Such property might enhance the exchangeability.
XPS spectra of Na1S of bare zeolites (NaX and NaY).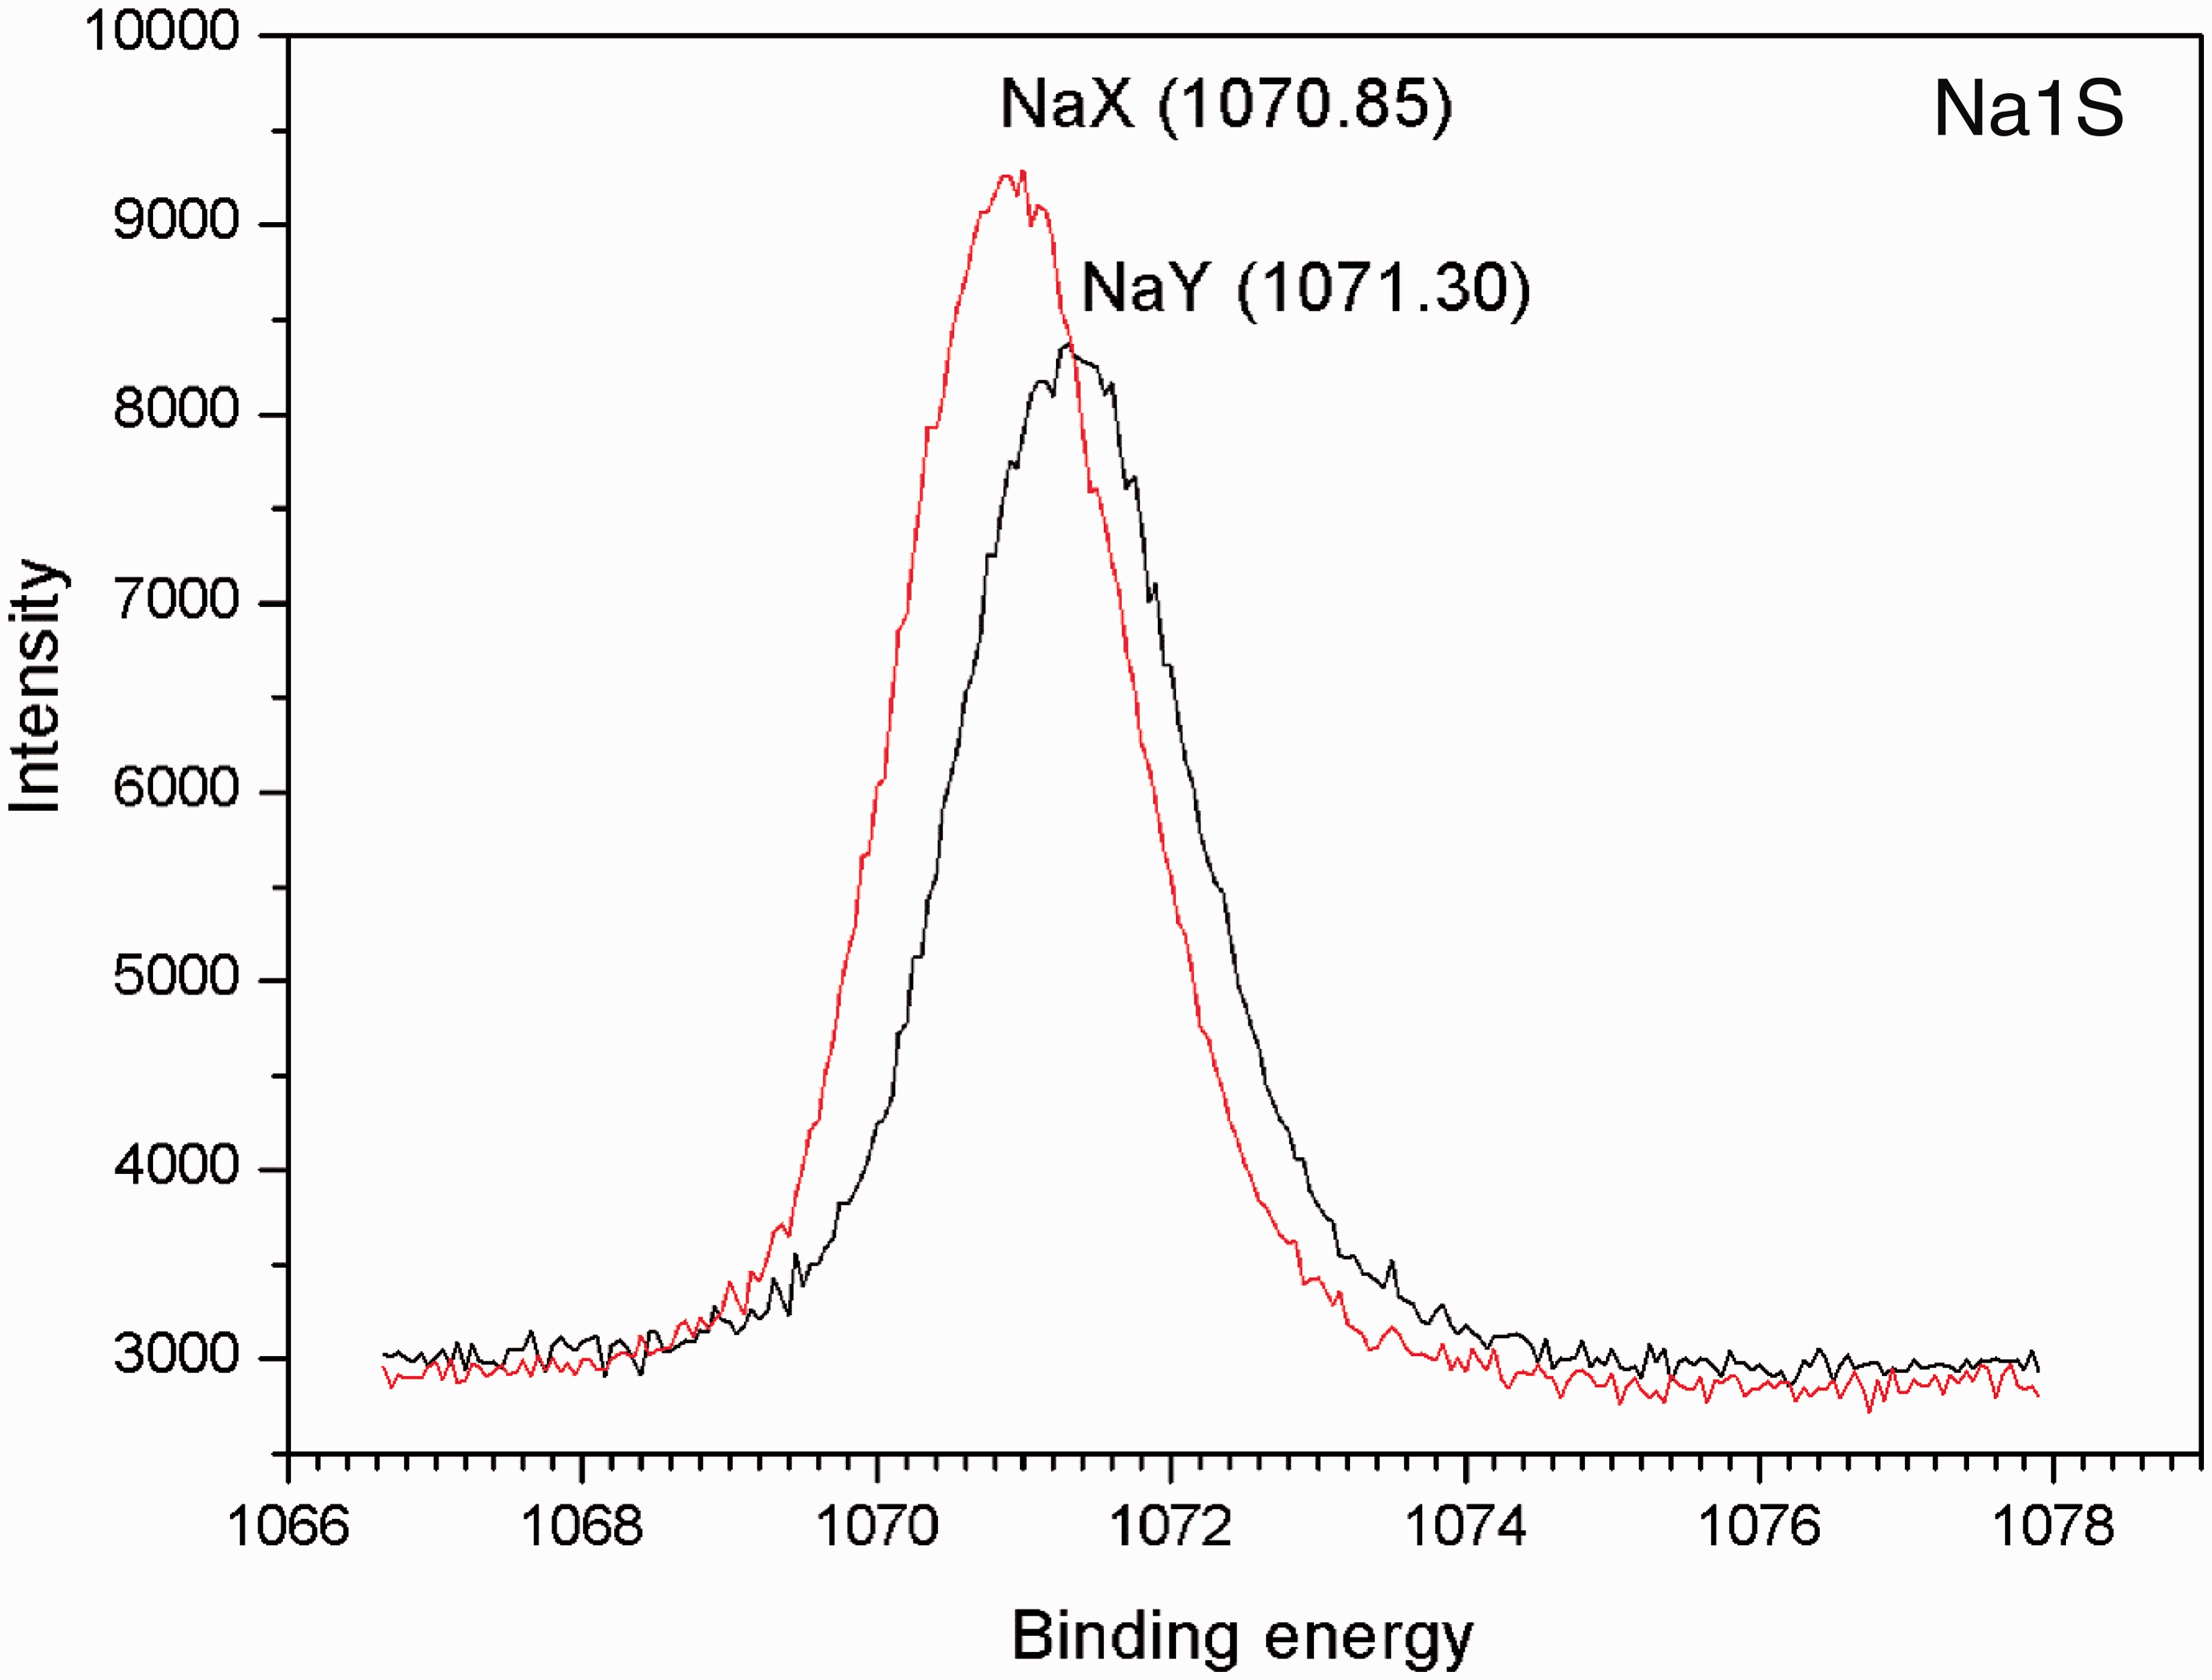
Paraquat adsorption occurred via displacement of sodium cation. It was previously reported that the paraquat adsorption capacity depended on Al content in the adsorbents, namely, NaY (Si/Al = 2.2) > NaBEA (Si/Al = 14.2) (Rongchapo et al., 2013) and Al-MCM-41 > MCM-41 (Rongchapo et al., 2015). However, it was opposite for NaX and NaY in this work. Results from XRD indicated the displacement of sodium ions in NaX and NaY. Na cation in NaX and NaY was studied by MAS NMR and XPS. The relative results of MAS NMR and XPS confirmed that the interaction between Na cation and an oxygen atom in the zeolite NaX was stronger than that in NaY. Thus, Na cation in NaY might exchange with paraquat more easily, leading to a higher adsorption capacity.
Conclusions
Characteristic of bare zeolites (NaX and NaY) and paraquat-containing zeolites (PQX and PQY) were studied. The presence of paraquat after adsorption was confirmed by FTIR. XRD patterns of PQX and PQY slightly changed from those of the bare ones due to the displacement of sodium ions. The N2 adsorption–desorption isotherm was still type I but the surface area decreased significantly. The surface areas of PQX and PQY were consistent with the paraquat adsorption capacity. Most of the NaY micropore area was occupied by paraquat. In contrast, only half of the NaX micropore area was occupied. Analysis by 23Na MAS NMR and XPS indicated that interaction of sodium ions in NaX was stronger than that in NaY making them less favorable for the exchange with paraquat.
Footnotes
Acknowledgements
The authors acknowledge SUT-NANOTEC- SLRI Beamline 5.1, Synchrotron Light Research Institute, Thailand for the XPS analysis.
Declaration of Conflicting Interests
The author(s) declared no potential conflicts of interest with respect to the research, authorship, and/or publication of this article.
Funding
The author(s) disclosed receipt of the following financial support for the research, authorship, and/or publication of this article: A scholarship for the doctoral study of W. Rongchapo is from the Royal Golden Jubilee PhD program from the Thailand Research Fund (TRF) and Suranaree University of Technology (SUT, contract number: PHD/0163/2552). Her postdoctoral support is from SUT and Office of the Higher Education Commission under NRU Project of Thailand (contract number: FtR.20/2559).