
Abstract
This study investigates the activation of bentonite using HNO3 and its application for Pb2+ adsorption. Physical-chemical analyses (Brunauer–Emmett–Teller, X-ray diffraction, and Fourier transform infrared) revealed that HNO3 activation enhanced the surface area and altered the structural characteristics of bentonite. Adsorption experiments, designed using the Taguchi method (L25, four factors, five levels), identified contact time as the most influential factor for Pb2+ removal. The maximum Pb2+ adsorption capacity of HNO3-activated bentonite was 1.3 times higher than raw bentonite (61.77 mg/g vs 48.22 mg/g). Adsorption isotherms fitted well with the Temkin model (R2 > 0.9, χ2 < 0.15), and kinetic data followed the Elovich model (R2 > 0.91, χ2 < 1.44). The initial sorption rate (α) for HNO3-activated bentonite was 1.12 times greater than that of bentonite, indicating enhanced adsorption kinetics. This study demonstrates the effectiveness of HNO3-activated bentonite for efficient Pb2+ removal from aqueous solutions.
Keywords
Highlights
HNO3 activation enhanced bentonite's surface area and structural characteristics, confirmed by Brunauer–Emmett–Teller, X-ray diffraction, and Fourier transform infrared analyses.
The Taguchi method (L25) identified contact time as the key factor affecting Pb2+ adsorption for both types of bentonite.
HNO3-activated bentonite had a Pb2+ adsorption capacity (qmax) of 61.77 mg/g, 1.3 times higher than natural bentonite's 48.22 mg/g.
Adsorption isotherm data fit the Temkin model (R2 > 0.9, χ2 < 0.15), while kinetic analysis matched the Elovich model (R2 > 0.91, χ2 < 1.44).
The initial sorption rate (α) for HNO3-activated bentonite was 1.12 times greater than that of natural bentonite, indicating improved adsorption efficiency for Pb2+ ions.
Introduction
As production increases to meet rising societal demands, it leads to various environmental pollution challenges that impact human health and ecosystems. Notably, water pollution from heavy metal-contaminated wastewater poses serious risks to aquatic life and human health, necessitating urgent attention and effective mitigation strategies (Aziz et al., 2023). Heavy metals like lead (Pb2+) are notably toxic and can cause severe health problems even in minimal concentrations (Fu and Wang, 2011). According to the U.S. Environmental Protection Agency, a list of 129 metal and nonmetal pollutants is frequently discharged into the environment, with the top five metal pollutants being copper (Cu), zinc (Zn), chromium (Cr), lead (Pb), and nickel (Ni). Of these, Pb2+ is especially dangerous, posing severe risks to both human health and ecological systems (Fu and Wang, 2011).
The pollution of Pb2+ can originate from multiple sources, including the application of pesticides and fertilizers, contaminated irrigation water, soil polluted with heavy metals, and leachate from landfills (Bouida et al., 2022). Exposure to Pb2+ can cause extensive damage to various organs and systems in the body, including the kidneys, liver, reproductive system, central nervous system, and brain function (Collin et al., 2022). Thus, removing toxic heavy metals, particularly Pb2+, from water and wastewater is crucial for protecting both human health and the environment (Fu and Wang, 2011).
Traditional methods for removing heavy metals, such as Pb2+, from aqueous solutions are well-established and widely utilized. These techniques typically include chemical precipitation (Kurniawan et al., 2006), coagulation (Tang et al., 2016), ion exchange (Dabrowski et al., 2004), solvent extraction (Jha et al., 2012), filtration (Abdulraheem et al., 2020), and membrane technologies (Birniwa et al., 2023). Despite their effectiveness, these methods often come with limitations such as high costs, complex operations, and potential byproducts (Panayotova and Velikov, 2003; Zhu et al., 2019). In contrast, adsorption technology has garnered increasing attention due to its efficiency, cost-effectiveness, and environmental benefits (Rashid et al., 2021). Adsorption is favored for its ability to remove contaminants without generating byproducts (Park et al., 2019). However, the effectiveness of adsorption can be influenced by factors such as solute concentration, the ratio of adsorbent to adsorbate, contact time, temperature, the type and modification of the adsorbent, ionic strength, and pH (Wang et al., 2016; Zhang et al., 2015). Achieving optimal pollutant removal necessitates careful tuning of these parameters to enhance the efficiency and effectiveness of adsorption processes (Razmi and Ghasemi-Fasaei, 2018).
In recent years, the Taguchi method has gained prominence for its ability to utilize orthogonal arrays (OAs) to efficiently examine multiple variables with a minimal number of experiments. This approach is particularly advantageous compared to traditional design methods, which often require a full factorial design that can involve a prohibitively large number of trials (Türkmen et al., 2008). The Taguchi method identifies the best combination of process parameters to reduce costs, enhance quality, and increase efficiency (Singh et al., 2019). Additionally, to validate the results, the analysis of variance (ANOVA) method was utilized. ANOVA helps quantify the percentage contribution of each process parameter to the desired outcomes, ensuring a thorough understanding of the influencing factors in the adsorption process (Mustapha et al., 2021). The Taguchi method, in conjunction with ANOVA, has been successfully employed to optimize the removal of various pollutants. For example, it has been used for Cu2+ removal with geopolymer materials synthesized from different fly ashes (Litu et al., 2024), for Pb2+ removal using nanohydroxyapatite (Googerdchian et al., 2018), and for Pb2+ removal by magnetized nanoparticles derived from potato peel (Jalees, 2020). This combination not only enhances the research process but also improves the reliability of the findings (Madan and Wasewar, 2017).
Adsorbents based on natural clays, including kaolin, bentonite, and zeolites, have been extensively employed to remove heavy metal pollutants in wastewater (Gu et al., 2019; Kinoti et al., 2022). Bentonite, in particular, stands out due to its inherent properties that enhance its effectiveness in removing cationic heavy metals from water. The clay's net negative surface charge enhances strong electrostatic interactions with positively charged metal ions, leading to efficient removal (Toor and Jin, 2012). This clay is highly valued in water and wastewater treatment for several reasons: its ease of application, low cost, and widespread availability make it an economically viable option (Anna et al., 2015; Chen et al., 2011; Prabhu and Prabhu, 2018). Additionally, the micron-sized particles of bentonite offer a significant external and internal surface area, enhancing its adsorption capacity for a wide range of heavy metal contaminants in water (Zhu et al., 2016).
Bentonite, a clay mineral primarily composed of montmorillonite, is widely available and has demonstrated effectiveness in treating metal-contaminated wastewater. Its benefits include broad availability, natural abundance, stability in both physical and chemical properties, environmental friendliness, and strong adsorption capacity (Alexander et al., 2019; Pei et al., 2021). To further enhance its adsorption capabilities, ongoing research focuses on surface modifications of bentonite. Various techniques have been explored to improve its performance, such as activation with cationic surfactants, clay–rubber mixtures, polymer addition, coupling of inorganic and organic anions, and grafting of organic compounds (Alexander et al., 2019; Borah et al., 2022). Fe3O4 has also been explored as an effective activation agent for bentonite. It has been successfully utilized in both batch experiments (Ewis et al., 2020) and fixed-bed columns (Sarran et al., 2024) for adsorbing gasoline emulsion. The magnetic properties of Fe3O4 facilitate easy recovery of the activated bentonite, further improving the feasibility of its use in large-scale water treatment processes (Sarran et al., 2024).
Notably, acid activation of natural bentonite has been widely studied (Al-Essa, 2018; Ardelia et al., 2024; Bayram et al., 2021; Carrado and Komadel, 2009; Kul and Koyuncu, 2010; Rezapour et al., 2016; Ullah et al., 2016). Acidic treatment improves bentonite's performance by removing impurities and exchangeable cations from the structure, leading to enhanced properties such as increased surface area and pore volume, making it more effective for applications like pollutant removal (Amari et al., 2010). Multiple studies, such as those by Liu (2007), Noyan et al. (2007), and Vimonses et al. (2009), highlight the positive effects of acid activation on bentonite, improving its physical characteristics for adsorption purposes and other industrial uses. For example, acid-activated bentonite (ABC) achieved significantly higher removal efficiencies for Fe2+, Zn2+, and Ni2+ from pharmaceutical effluent compared to non-activated bentonite (NBC). ABC removed up to 89.9% of Zn2+, 81.8% of Fe2+, and 75.5% of Ni2+, outperforming NBC's lower removal rates. The acid treatment also increased the surface area of bentonite from 46 to 76 m2/g and expanded its pore diameter (Ibigbami et al., 2022).
However, while activation with acids like H2SO4 (Ardelia et al., 2024; Bayram et al., 2021; Rezapour et al., 2016) and HCl (Al-Essa, 2018; Kul and Koyuncu, 2010; Ullah et al., 2016) has been widely studied, the use of nitric acid (HNO3) for activation remains relatively underexplored. Only a few studies (Ibigbami et al., 2022) have addressed this process, and even fewer have investigated the application of HNO₃-activated bentonite for Pb2+ removal. This gap is directly addressed by this study, which evaluates the efficacy of HNO3-activated bentonite for Pb2+ adsorption and compares it to raw bentonite's adsorption capacity. Additionally, this study pioneers the use of the Taguchi method in combination with ANOVA to optimize critical adsorption conditions such as reaction time, pH, Pb2⁺ concentration, and material mass, while also assessing the relative contributions of each parameter. The results not only underscore the distinct effects of HNO₃ activation but also offer valuable insights into optimizing Pb2+ removal efficiency, presenting new possibilities for more effective environmental remediation strategies.
Materials and methods
Materials and chemicals
The natural raw bentonite used in this study was purchased from Damao Chemical Reagent Factory (Tianjin, China), with a purity of ≥ 98%. For the activation of bentonite, analytical grade nitric acid (HNO3) was used, with a purity of ≥ 99%. Additionally, all other chemicals required for the experiments were of analytical reagent (AR) grade from Merck, with purities of ≥ 99%. All chemicals were utilized as received, without further purification.
Preparation of HNO3-activated bentonite
Raw bentonite was transformed into HNO3-activated bentonite through a series of steps, as described in the previous study (Ibigbami et al., 2022). The process began by treating the raw bentonite with a 2 M nitric acid (HNO3) solution at a mass-to-volume ratio of 1 g to 2 mL. The solution was stirred at a speed of 300 r/min during the 4-h duration in the water bath, with the temperature controlled at 70 ± 1 °C. To prevent evaporation, the mixture was stirred in a closed container, which helped maintain the required temperature and prevent the loss of solvent during the process. Once the activation process was complete, the HNO₃-activated bentonite was dried in an oven. After drying, it was ground into a fine powder and sieved through a 100 μm mesh to obtain a uniform particle size for further analysis and experimentation.
Characterization methods
The mineralogy, functional groups and surface properties were characterized using X-ray diffraction (XRD), Fourier transform infrared (FTIR), and Brunauer–Emmett–Teller (BET) respectively. The XRD data of the adsorbents were collected with a PANalytical EMPYREAN instrument using Cu-Kα radiation. The FTIR spectra were recorded with a PerkinElmer Spectrum 10.5.2 spectrophotometer. Surface area measurements were performed on Nova Station A (Quantachrome Instruments version 11.0, Miami, FL, USA) surface area and porosity analyzer.
Batch adsorption experiments
Stock solutions of 1000 mg/L Pb were prepared using Pb(NO3)2 as source, dissolved in deionized water. The initial pH of the Pb2+ ion solutions was adjusted by adding appropriate amounts of diluted HNO3 or NaOH to achieve the desired levels. For each experiment, a specific quantity of adsorbent was introduced into the Pb2+ solutions at room temperature (25 ± 2 °C).
Batch adsorption tests were performed in triplicate using polyethylene bottles with a total volume of 50 mL. The bottles were shaken in a shaking incubator (LSI-3016R, LabTech, Korea) at 3000 r/min to ensure thorough mixing and optimal contact between the adsorbent and the Pb ions. After the designated contact time, the supernatant liquid was filtered using Whatman No. 1 filter paper. The concentration of Pb in the supernatant was measured using a PinAAcle 900T Atomic Absorption Spectrophotometer (Perkin-Elmer) in Graphite-Furnace Atomic Absorption Spectrometry mode.
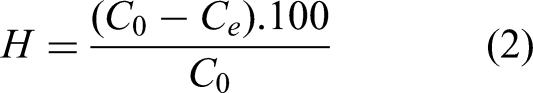
The adsorption capacity (qe, mg/g) and the percentage removal (H, %) were calculated using Equations (1) and (2), respectively, as follow:

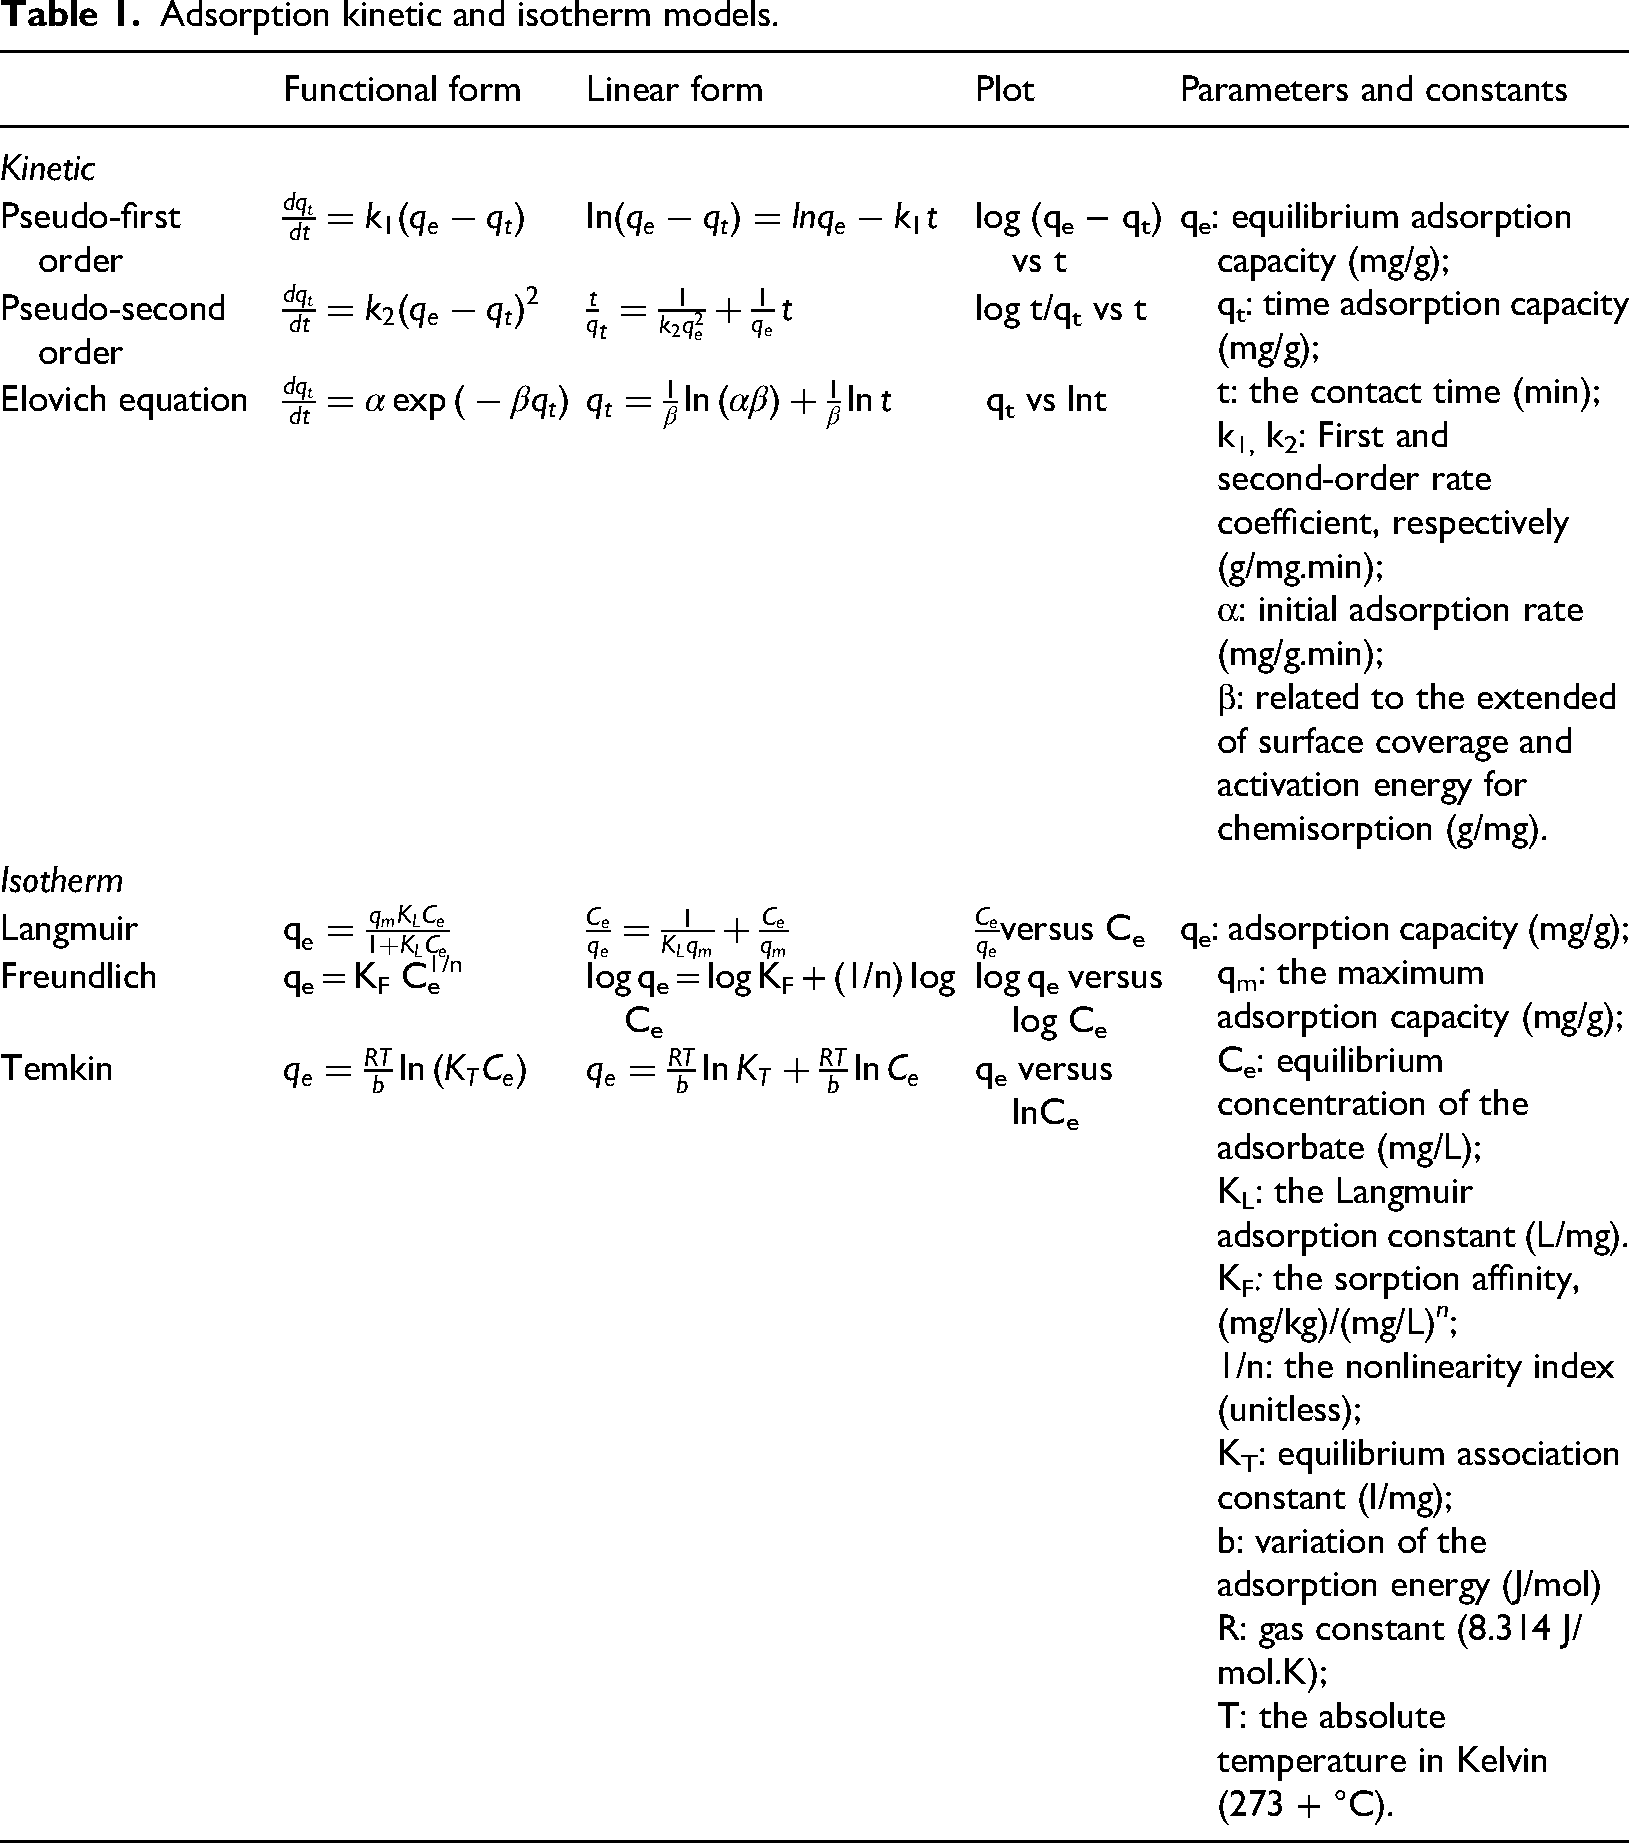
The adsorption equilibrium data for Pb2⁺ on bentonite and HNO3-activated bentonite were analyzed using the linear forms of three two-parameter kinetic and isotherm models. These models were applied to the experimental values of qe and Ce to derive the parameters of the equations. The linearized equations for the kinetic and isotherm models are presented in Table 1.
Adsorption kinetic and isotherm models.
Design of experiments
Prior to the main experiments, screening tests were conducted to identify the most suitable ranges for each parameter. The screening experiments were designed to determine which factors had the most significant influence on Pb2⁺ adsorption. These results guided the selection of the conditions used in the Taguchi experimental design. The screening phase ensured that the experimental conditions covered both lower and upper limits, within which meaningful and measurable changes in Pb2⁺ adsorption could occur.
In this study, four key controllable factors were selected: the pH of the solution, Pb2⁺ concentration, adsorbent mass, and reaction time. Each factor was tested at five different levels to assess their impact on the removal efficiency of Pb2⁺ ions from aqueous solutions. The specific factors and their corresponding values are as follows:
pH (A): 3, 4, 5, 6, 7 Material mass (B): 0.01 g, 0.05 g, 0.1 g, 0.3 g, 0.5 g Time (C): 10 min, 30 min, 60 min, 90 min, 120 min Concentration (D): 10 mg/L, 30 mg/L, 50 mg/L, 80 mg/L, 100 mg/L
Utilizing the Taguchi experimental design, a total of 25 experiments were conducted, incorporating these four controllable parameters at five levels each. The experimental plan was organized in an L25 OA format, as presented in Table 2.
Orthogonal array of L25 for Pb2+ sorption by bentonite and HNO3-activated bentonite.

To assess the relative importance of the factors influencing Pb2+ sorption, the study conducted a one-way ANOVA using Minitab 21 (Minitab LLC, Chicago, USA). The key outcomes of this analysis are the p-values and the corresponding percent contributions. Factors with the highest percent contributions have the most significant impact on the response.
Statistical methods
Taguchi method
The Taguchi method, created by Genichi Taguchi, is a popular approach for optimizing design variables because it effectively reduces both testing time and costs (Zolfaghari et al., 2011). This method employs a Taguchi crossed array layout, which includes an inner and an outer array. The inner array consists of an OA that covers all possible combinations of controllable factors. By leveraging this OA, the Taguchi method streamlines the process of identifying optimal experimental conditions (Taguchi, 1986). The calculation procedure for the Taguchi method involves several steps: calculating the signal-to-noise (S/N) ratios for each factor under investigation, determining delta values from these S/N ratios, and establishing the ranking of each factor (Yuce et al., 2022).
There are three common types of signal-to-noise (S/N) ratio analysis: (1) lower is better (LB), (2) nominal is best (NB), and (3) higher is better (HB). In this study, which aims to maximize lead Pb removal efficiency, the HB S/N ratio analysis is the most appropriate choice, as described in Equation (3).
The delta values are determined by calculating the difference between the maximum and minimum S/N ratios for each parameter. These delta values are then ranked, with the largest delta indicating the most influential parameter. The rank is established based on this order, highlighting the parameters that have the greatest impact on the response variable.
Analysis of variance
Table 3 provides a comprehensive overview of essential concepts and formulas utilized in ANOVA. ANOVA is a statistical method employed to assess differences among group means and understand variability within datasets.
Key concepts and formulas in ANOVA analysis.

ANOVA: analysis of variance.
Results and discussion
Characterization of bentonite and HNO3-activated bentonite
Textural properties
The textural properties, such as specific surface area, average pore size, and pore volume, were evaluated using established techniques, including the BET and Barrett–Joyner–Halenda models.
The N₂ adsorption–desorption isotherms for both bentonite and HNO3-activated bentonite, illustrated in Figure 1, reveal a distinct hysteresis loop of H3 type (Amari et al., 2010). This specific type of hysteresis is indicative of the presence of slit-shaped or ink-bottle pores within the materials. The elevated N2 adsorption/desorption curve for HNO3-activated bentonite indicates that it possesses a higher nitrogen adsorption capacity, which can be attributed to an increased specific surface area. The findings underscore the effectiveness of the HNO3-activation process in enhancing the bentonite's porosity and surface characteristics (Ibigbami et al., 2022).
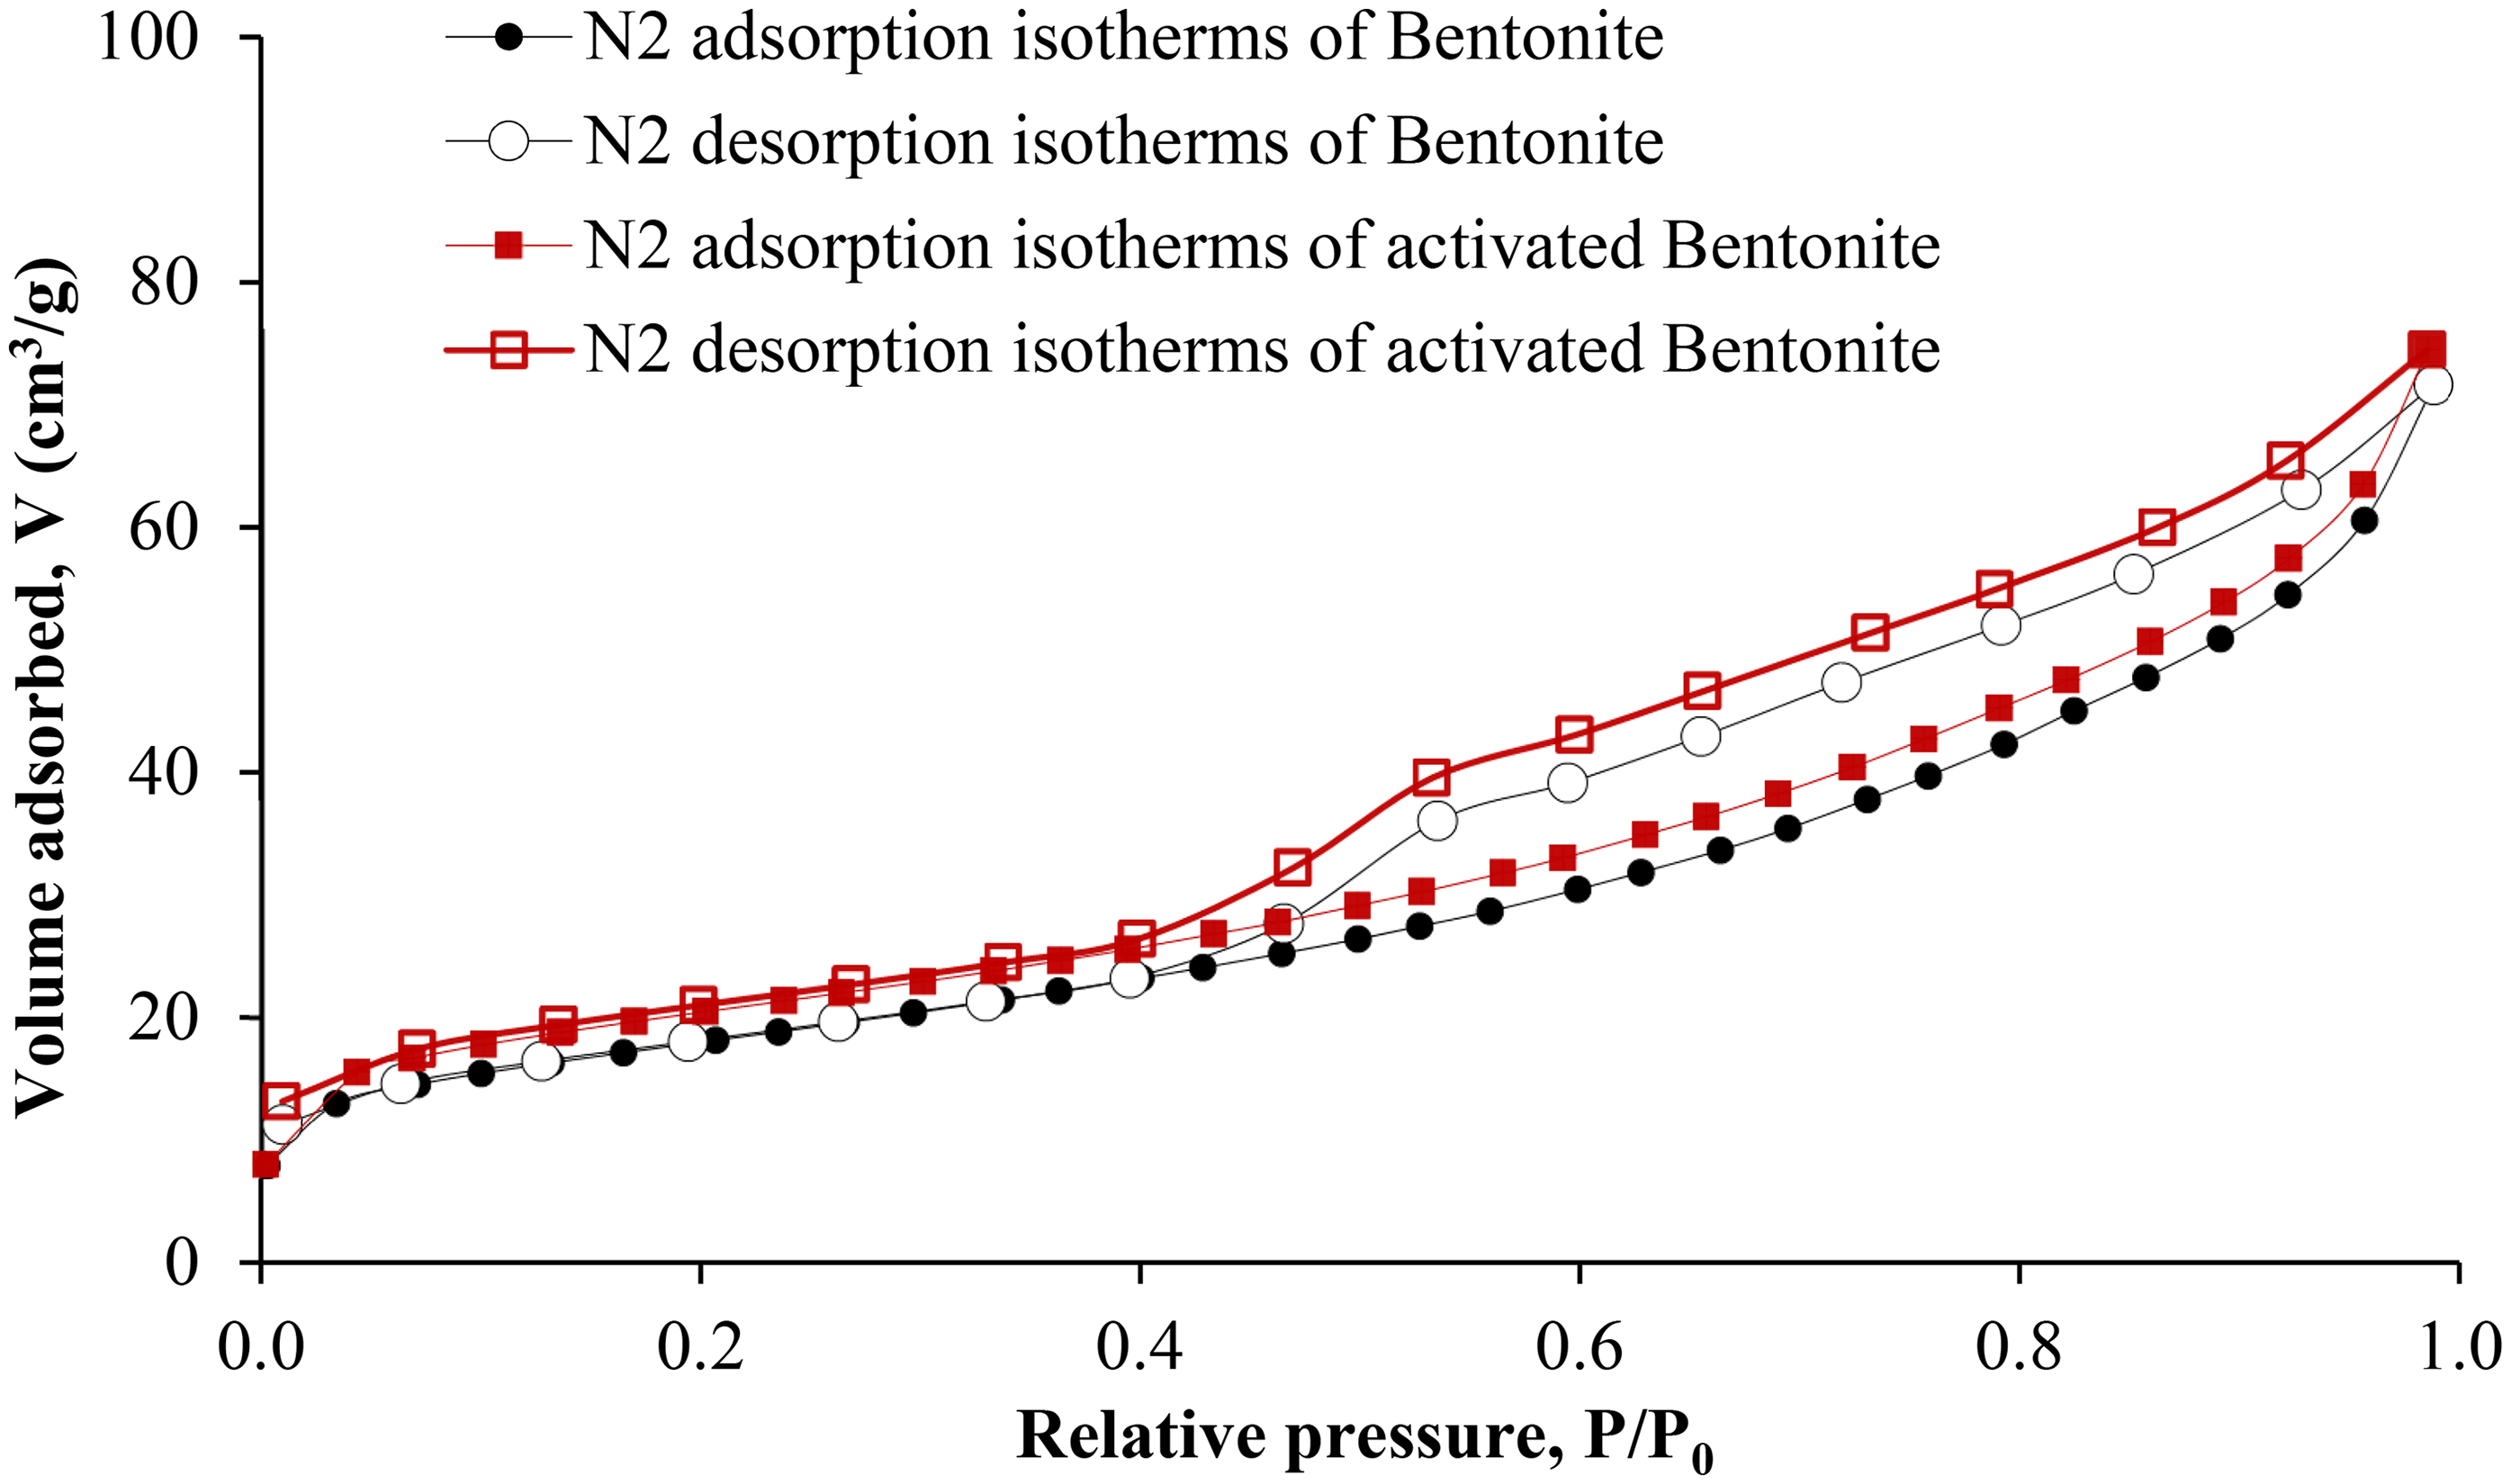
Nitrogen adsorption–desorption isotherms at 77 K of bentonite and HNO3-activated bentonite.
Studies have shown that pore diameter reduction does not significantly affect the total pore volume (Fahmi et al., 2018; Gokce and Aktas, 2014). This observation is consistent with our study, where the pore diameter of HNO3-activated bentonite (2.12 nm) is similar to that of raw bentonite (2.14 nm). However, the activation process likely leads to the formation of a greater number of smaller, more accessible pores. As a result, the overall pore volume increases from 0.06 cm3/g for raw bentonite to 0.07 cm3/g for HNO3-activated bentonite (Table 4).
Specific surface area, pore volume, and pore diameter of bentonite and HNO3-activated bentonite.
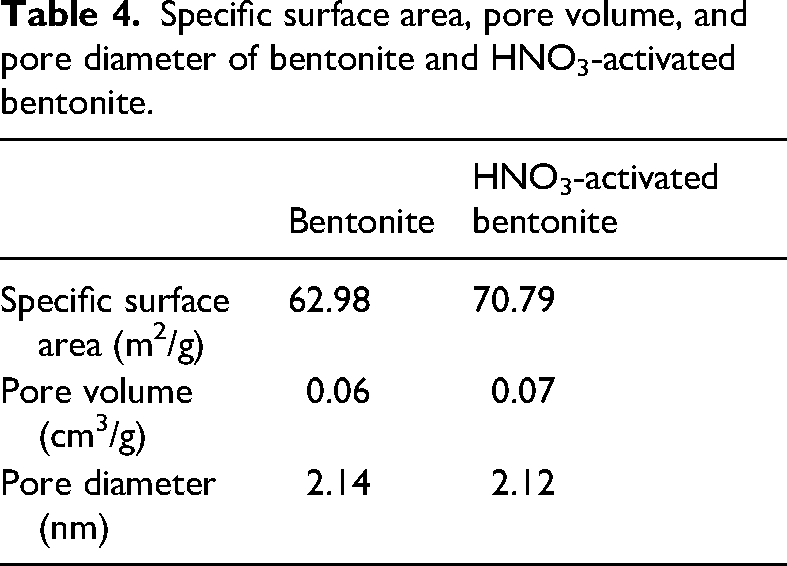
Moreover, the specific surface area, which reflects the available surface for adsorption per gram, is higher for HNO3-activated bentonite (70.79 m2/g) compared to raw bentonite (62.98 m2/g). This increase in surface area, combined with the enhanced pore volume, suggests that although individual pores may be slightly smaller, their increased number and expanded surface area provide more active sites for Pb2+ adsorption.
These findings align with previous research by Ibigbami et al. (2022), which reported an increase in specific surface area (79 m2/g) and pore volume (0.19 cm3/g) for bentonite after acid activation, compared to nonactivated bentonite (70 m2/g and 0.17 cm3/g) (Ibigbami et al., 2022). In another study, the specific surface area of raw bentonite was 69 m2/g, compared to 195 m2/g for acid-activated bentonite, highlighting significant enhancement. Pore volume also increased from 0.14 cm3/g to 0.47 cm3/g postactivation, indicating improved adsorbate accommodation (Amari et al., 2010). These changes underscore the superior adsorptive capabilities of acid-activated bentonite.
XRD spectra
XRD is a key technique for monitoring changes in the interlayer spacing of clay minerals. Figure 2 illustrates the XRD patterns of both bentonite and HNO3-activated bentonite samples.
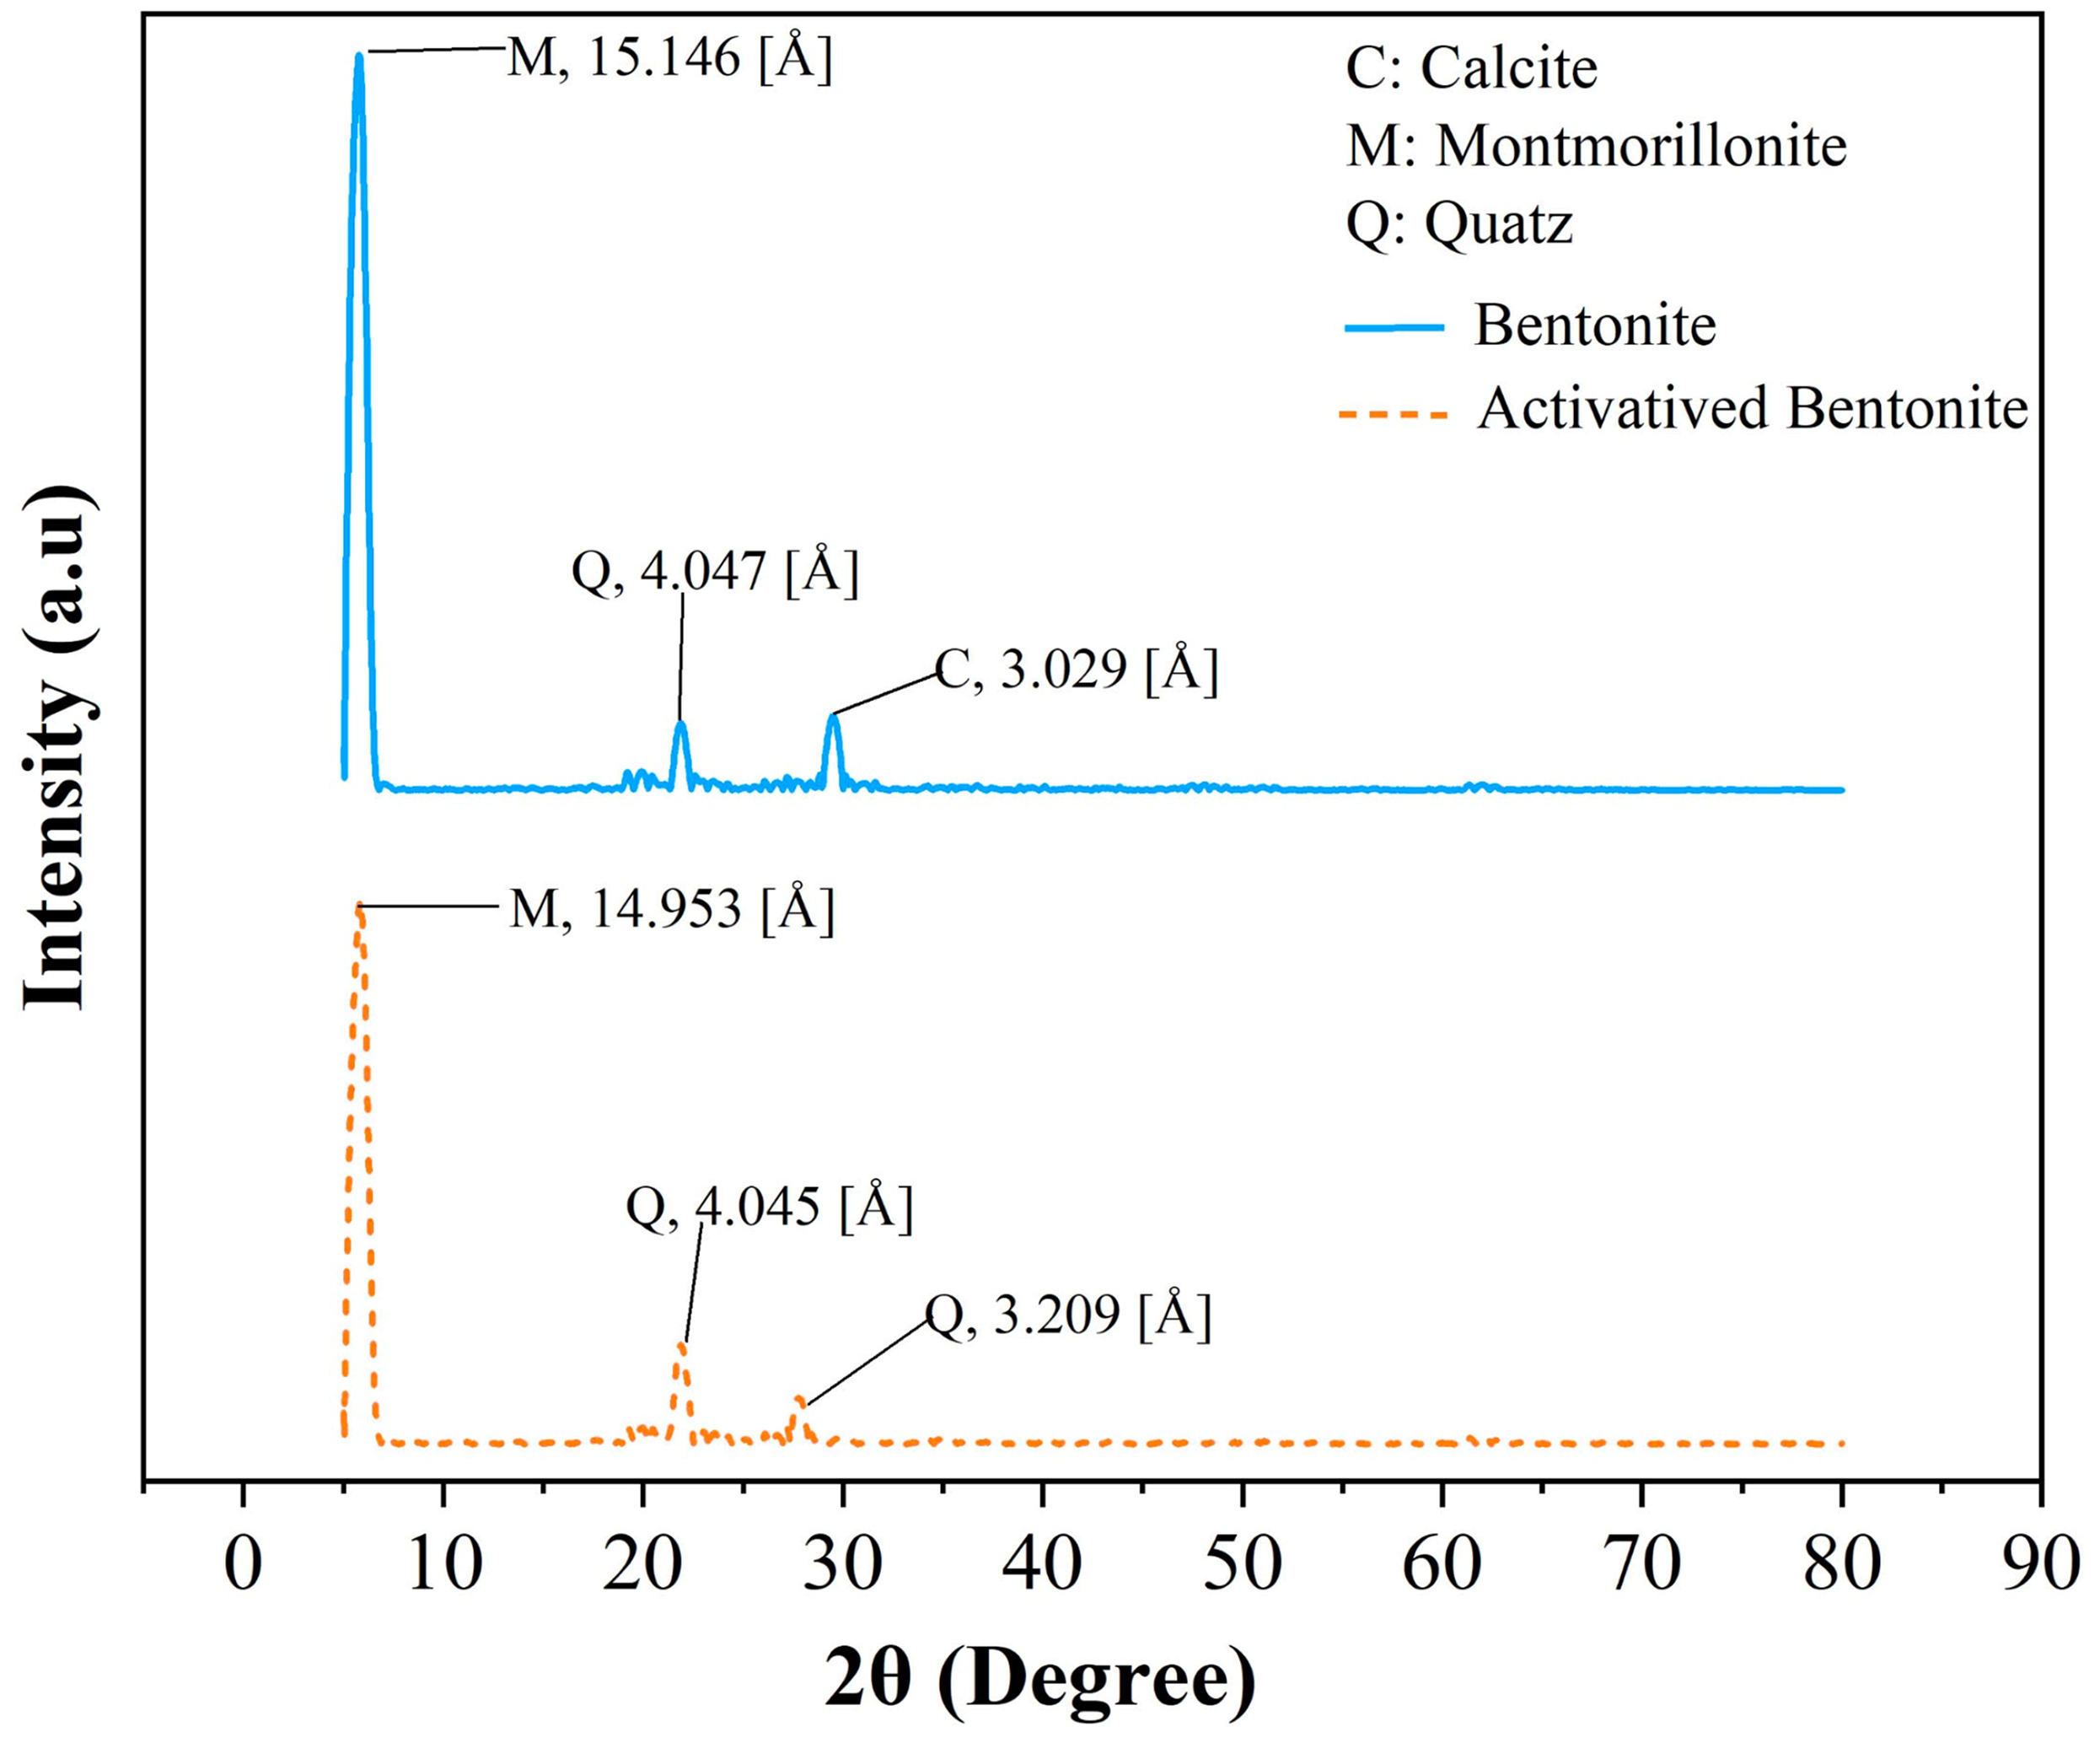
XRD patterns of bentonite and HNO3-activated bentonite.
The XRD analysis results presented in Figure 2 indicate that the bentonite material contains key mineral components, including montmorillonite (Al₂Si₄O₁₁(OH)₂), calcite (CaCO₃), and quartz (SiO₂), along with a smectite phase ((Na; K)AlSi₃O₈) (Amari et al., 2010; Krupskaya et al., 2019). Similar to bentonite, HNO3-activated bentonite retains the mineral components of montmorillonite and quartz, but notably lacks calcite, suggesting that the acid treatment effectively dissolved or transformed this carbonate phase. Montmorillonite is the dominant mineral in both samples, exhibiting a strong peak intensity, indicative of its high purity and crystallinity.
In the case of bentonite, the montmorillonite peak appears at a 2θ angle of 15.146°, while in HNO3-activated bentonite, this peak shifts slightly to 14.953°. This minor shift towards lower angles is significant, as it reflects an increase in interlayer spacing, which is a crucial indicator of the structural modifications occurring in the clay. These alterations suggest changes in the arrangement of both the tetrahedral and octahedral layers of the clay minerals (Ibigbami et al., 2022).
Furthermore, the activation process not only impacts the peak positions but also leads to variations in peak intensities. A reduction in intensity can indicate a loss of crystallinity or the emergence of amorphous phases, which may increase the reactivity and surface area of the HNO3-activated bentonite. The observation of a notable peak at 3.209° following HNO3 treatment reinforces the idea of mineral transformation, marking the transition from calcite to quartz dominance (Pawar et al., 2016). In brief, this XRD pattern highlights the mineralogical stability of montmorillonite and quartz while revealing significant structural changes resulting from HNO3 treatment.
FT-IR analysis
Fourier transform infrared spectroscopy (FT-IR) captures the characteristic vibrations of bonds and functional groups within materials. In this study, we analyzed the functional groups of bentonite and HNO3-activated bentonite using FT-IR (Perkin Elmer Spectrion 10.5.2, UK) with KBr as a base powder. The IR spectrum was recorded in the range of 4000 to 400 cm⁻1 and are displayed in Figure 3.
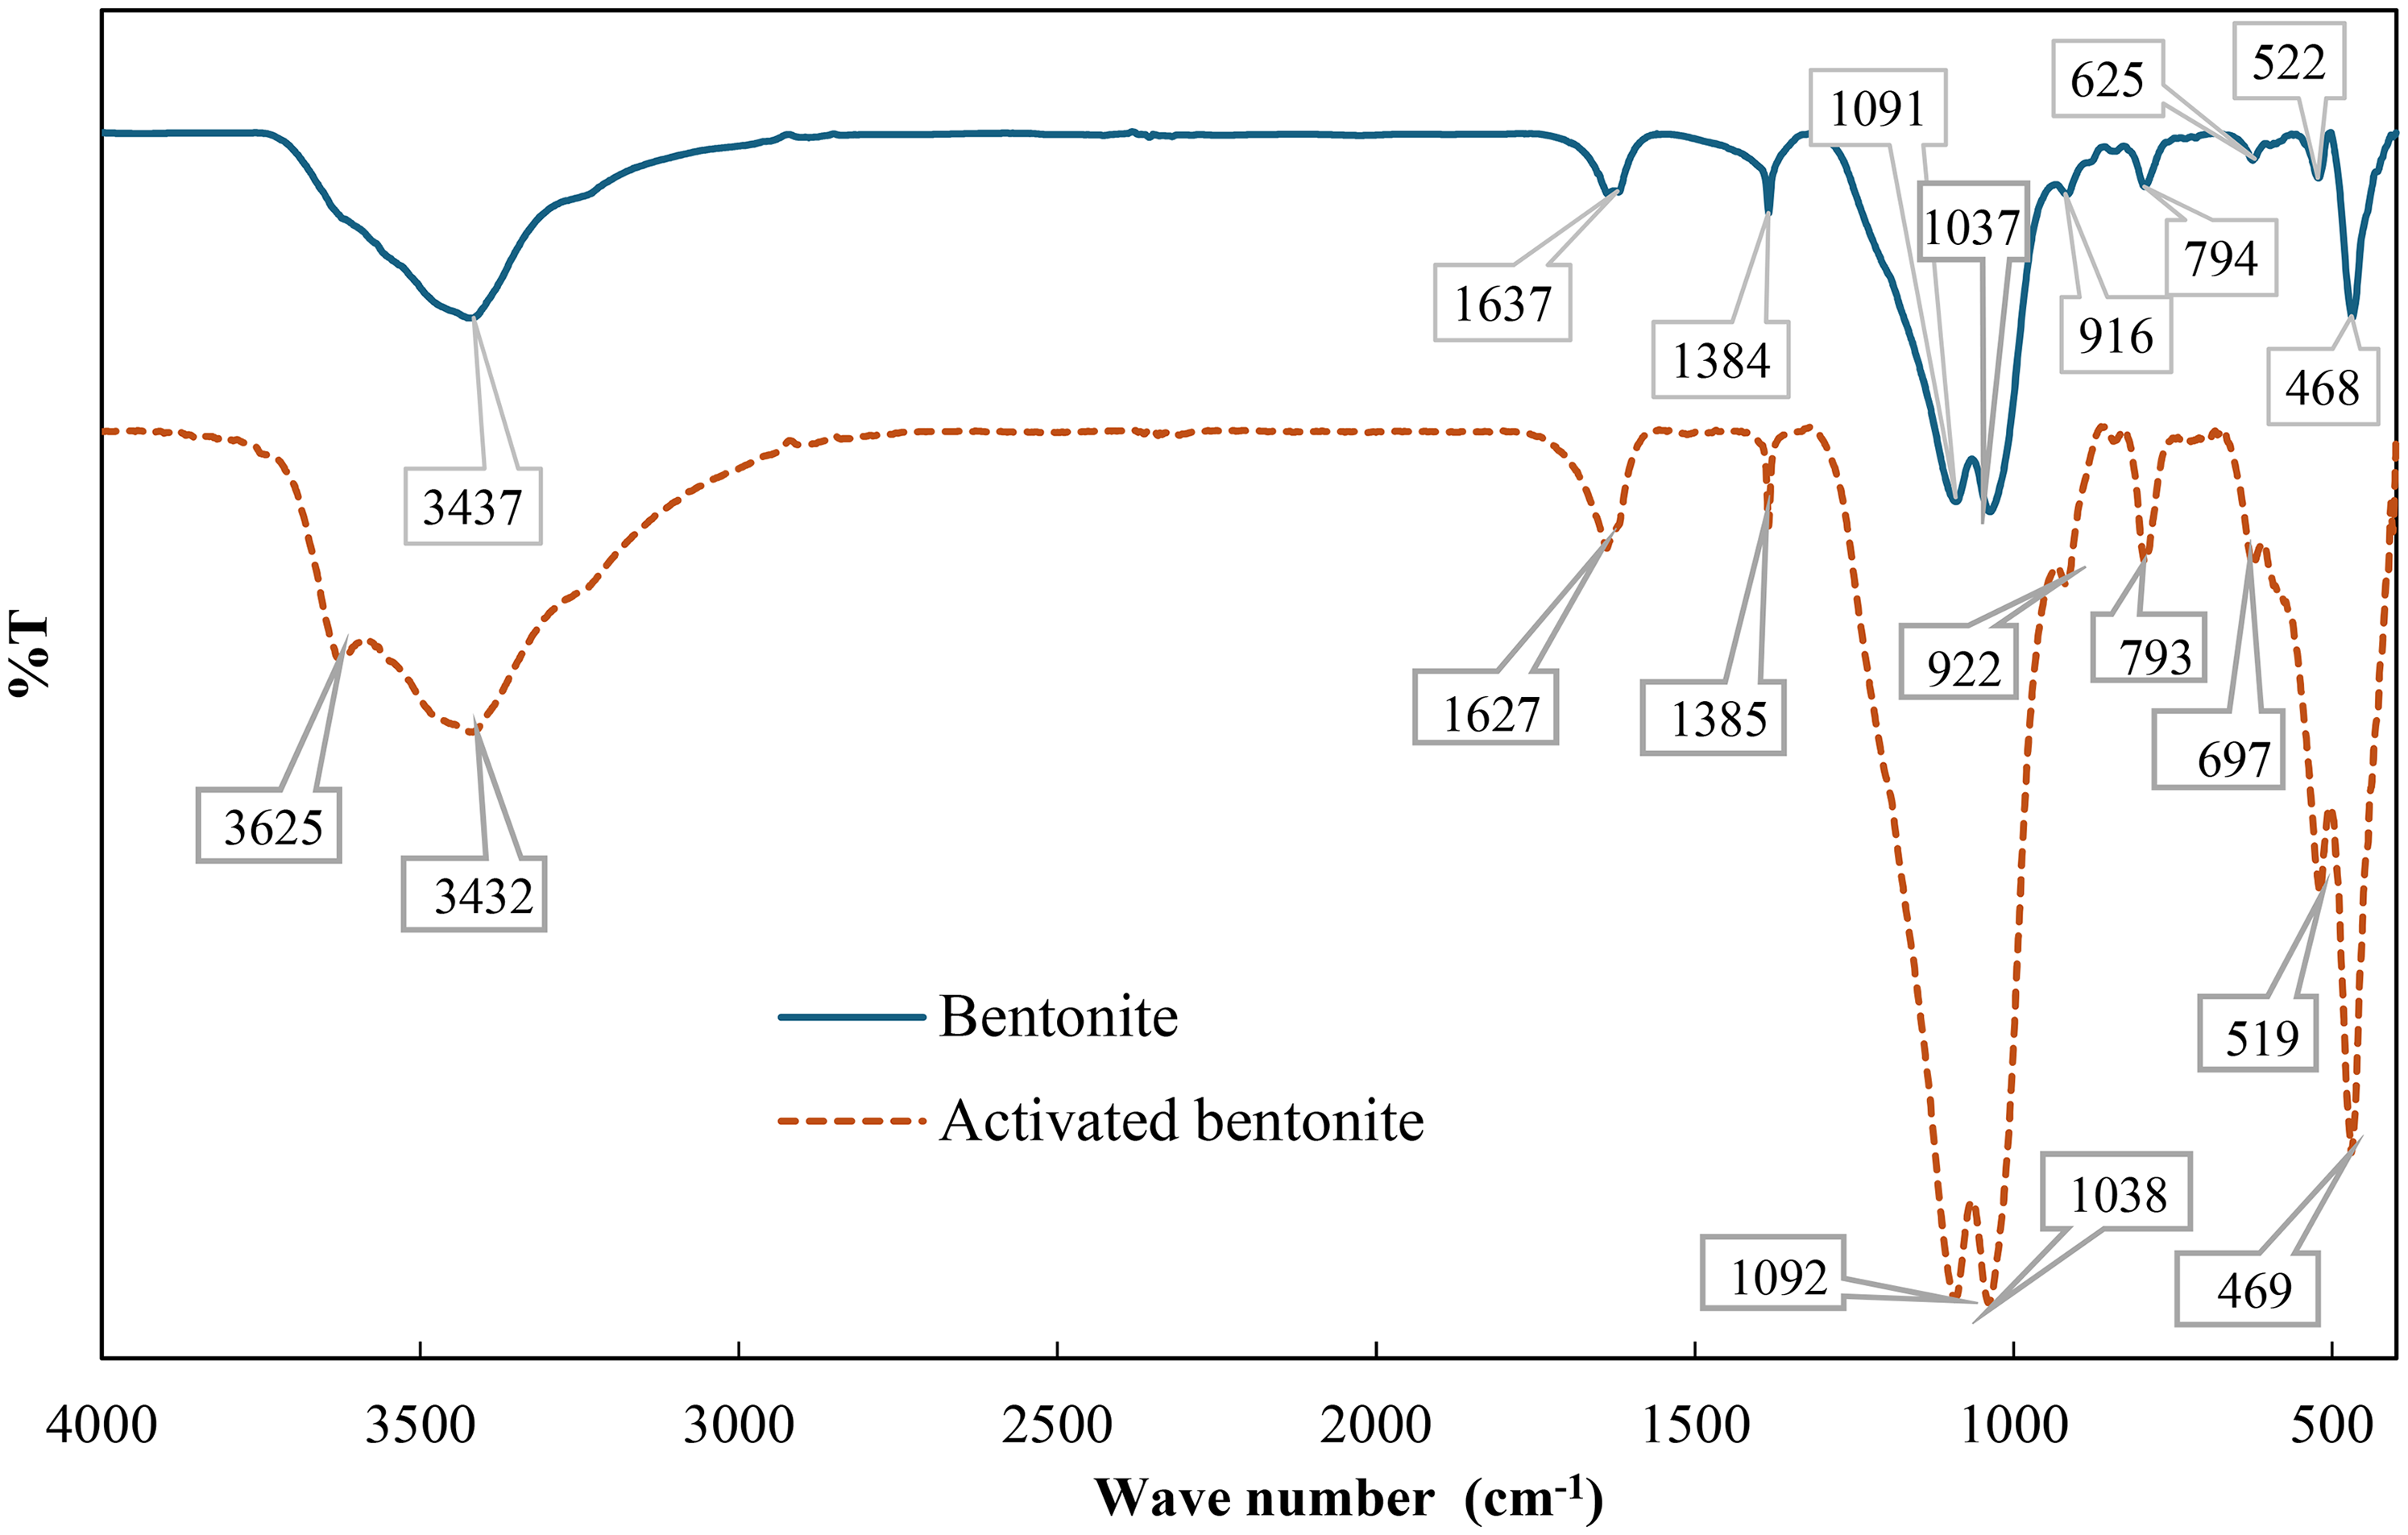
The infrared spectra of bentonite and HNO3-activated bentonite.
The FTIR spectrum of bentonite reveals several key peaks that provide insights into its structure and composition. At 3437 cm⁻1, a peak corresponds to the O-H stretching vibrations of silanol groups (Si–OH) and adsorbed water molecules, typical for clay minerals and indicating the presence of hydroxyl groups and adsorbed water (Bilgiç and Bilgiç, 2019; Olvianas et al., 2017; Zauska et al., 2021). The band at 1637 cm⁻1 is attributed to H–O–H bending vibrations of adsorbed water, confirming bentonite's hygroscopic nature (Aroke et al., 2013; Venkatathri, 2006). The peak at 1030 cm⁻1 is associated with Si–O stretching vibrations in the silicate framework, characteristic of alumino-silicates like bentonite (Zhu et al., 2023), while the 522 cm⁻1 peak corresponds to Al–O–Si bending, indicating that octahedral sites are occupied by Al and tetrahedral sites by O–Si bonds (Harrou et al., 2024; Marouf et al., 2021). Additionally, the 468 cm⁻1 peak is related to Si–O–Si bending, and the 405 cm⁻1 peak is associated with Si–O–Mg (Taha et al., 2011). The 794 cm⁻1 band suggests amorphous silica formation, while the 916 cm⁻1 peak is attributed to Al–OH–Al (Toor et al., 2015). These characteristic absorptions are consistent with the presence of the dominant mineral phase, montmorillonite, a major component of bentonite.
However, after bentonite is activated by HNO3, the FT-IR spectrum of HNO3-activated bentonite shows notable changes. Acid activation causes proton (H⁺) penetration into the clay layers, attaching to -OH groups, leading to partial dissolution and dihydroxylation of the smectite structure (Ibigbami et al., 2022). The band between 3750 cm⁻1 and 3100 cm⁻1 corresponds to the O–H bond in the bentonite sheets (Aguilar et al., 2020; Bhattacharyya et al., 2014). Acid activation significantly reduces cations in the octahedral layer, causing the loss of water and hydroxyl groups within this range. The band at 3432 cm⁻1 represents the -OH stretch, while the intensity of the OH stretch band at 3625 cm⁻1 decreases due to acid attack. This peak is associated with OH bonds at the Al₂OH structural sites in aluminum-rich bentonite (Madejová, 2003). Other stretching bands at 3432 cm⁻1, 1092 cm⁻1, 1038 cm⁻1, and 469 cm⁻1 also decrease in intensity after activation (Komadel et al., 1990). The Si–O–Si stretch peaks at 512 cm⁻1 and 469 cm⁻1 remain after activation, and the 697 cm⁻1 band corresponds to out-of-plane vibrations of Al–O and Si–O (Madejová, 2003).
The FTIR bands show minimal differences between bentonite and HNO₃-activated bentonite, indicating that acid activation affects both octahedral and tetrahedral sheets, as confirmed by XRD analysis. The slight shifts and intensity changes suggest modifications in cations and hydroxyl groups. However, the core structure remains largely intact, confirming that HNO3 activation enhances adsorptive properties without significantly compromising the material's structural integrity (Sdiri et al., 2014).
Results of Taguchi and ANOVA method
Analysis of S/N ratio
To determine the removal efficiency of Pb2+ ions using bentonite and HNO3-activated bentonite adsorbents, we selected the “larger is better” performance characteristics equation. The mean S/N ratio for each controllable parameter at any level was calculated by averaging the S/N ratios from four experiments conducted at that level. The experimental results for Pb2+ ion removal and the corresponding S/N ratio values are presented in Table 5. Additionally, Figure 4 illustrates the effects of four controllable factors on the averaged S/N ratios.
Mean S/N ratio of bentonite (a) and HNO3-activated bentonite (b).
The S/N ratio of each test.
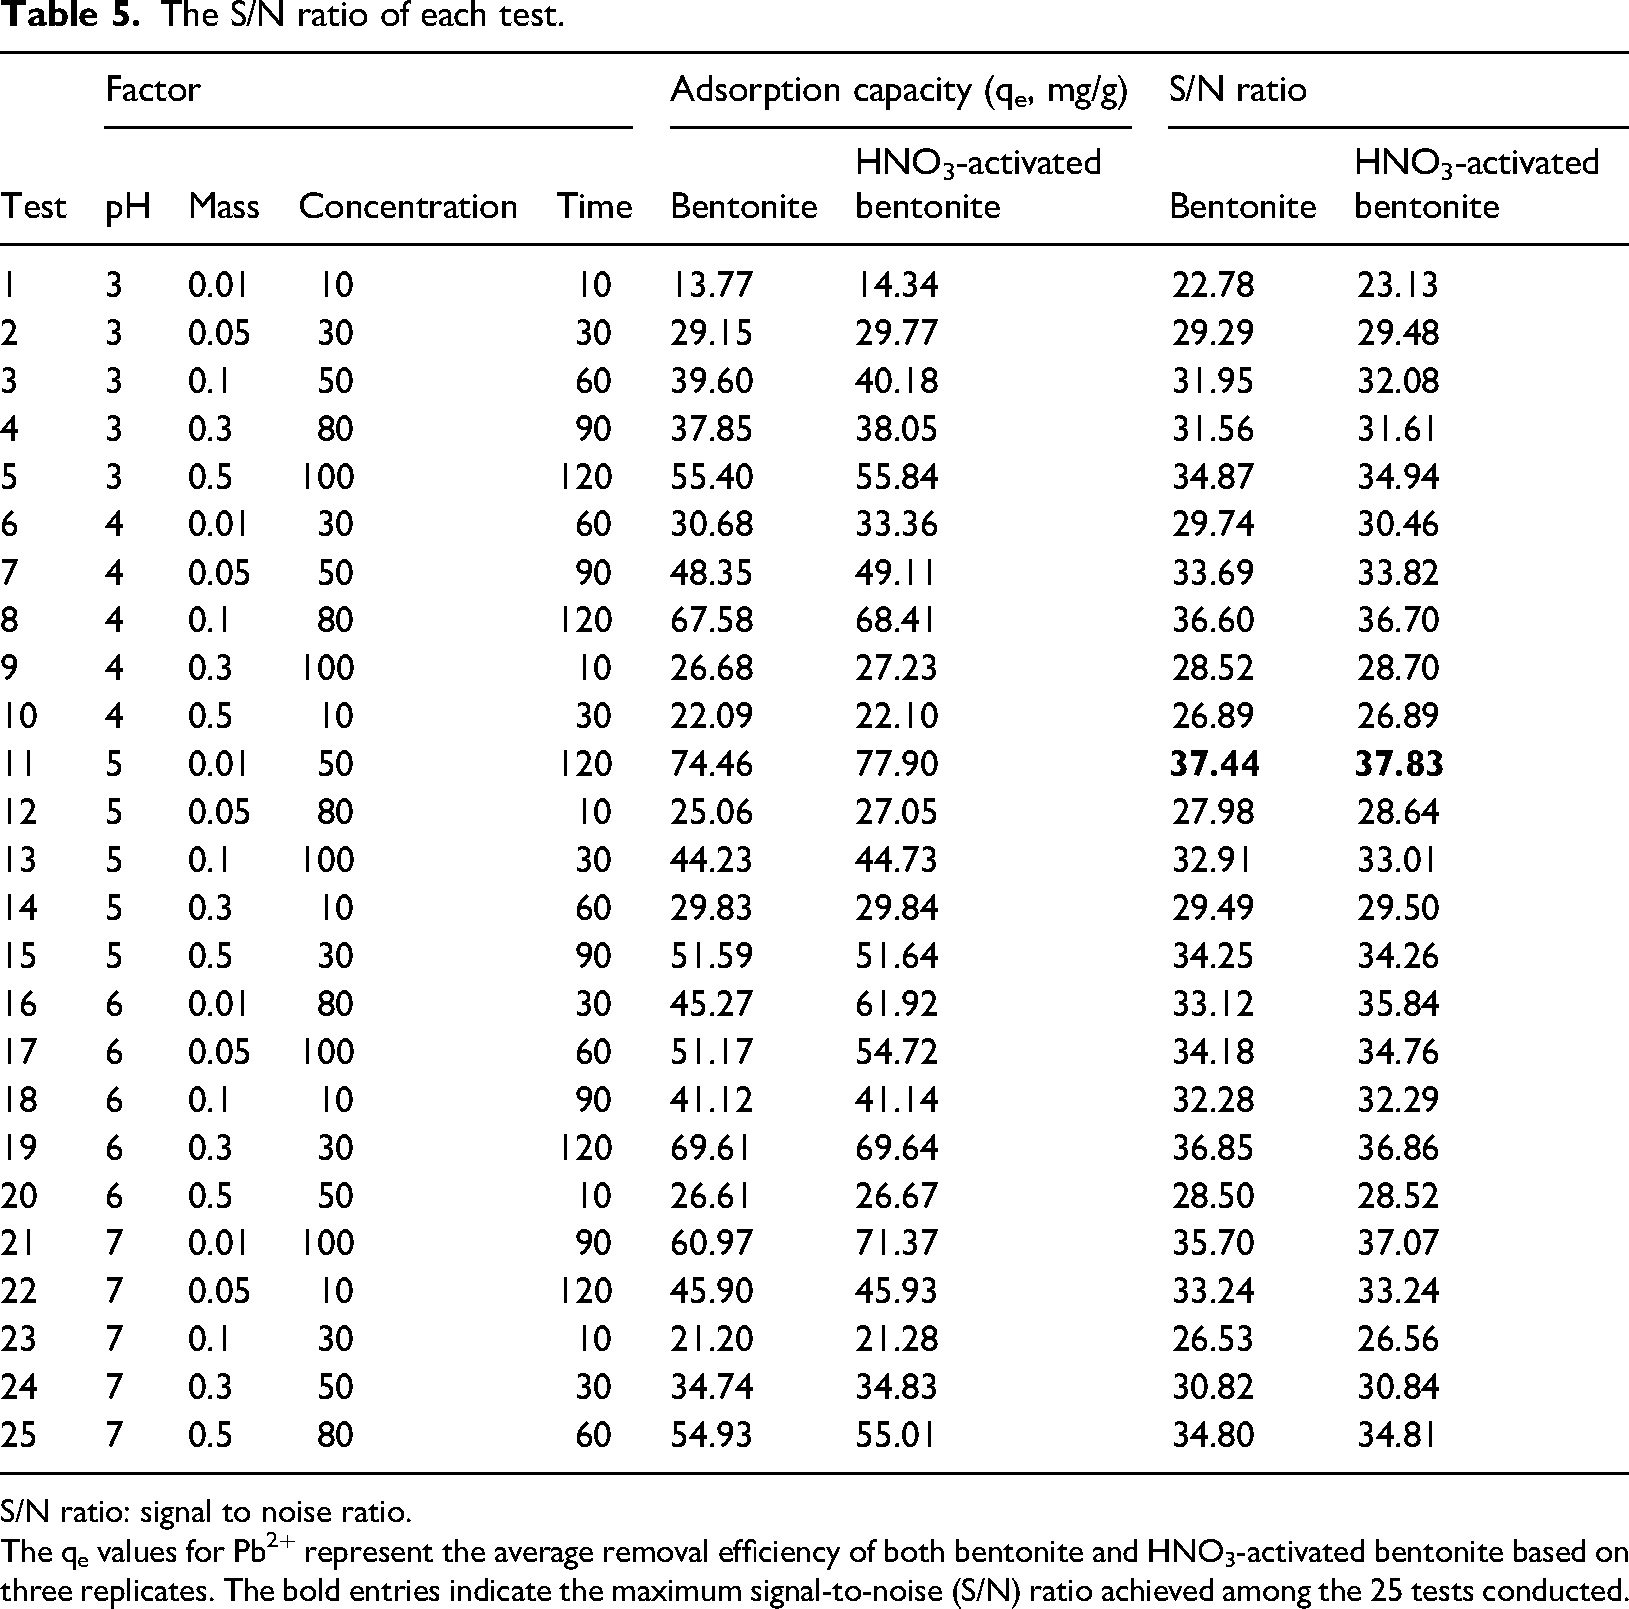
S/N ratio: signal to noise ratio.
The qe values for Pb2+ represent the average removal efficiency of both bentonite and HNO3-activated bentonite based on three replicates. The bold entries indicate the maximum signal-to-noise (S/N) ratio achieved among the 25 tests conducted.
The results in Table 5 demonstrated significant variations in adsorption capacity, with bentonite achieving Pb2+ adsorption levels ranging from 13.77 mg/g to 74.76 mg/g, and HNO3-activated bentonite ranging from 14.34 mg/g to 77.90 mg/g. It is observed that HNO3-activated bentonite consistently showed a higher adsorption capacity compared to bentonite. The differences in adsorption capacity (qe) between HNO3-activated bentonite and bentonite across the 25 tests varied obviously, with the largest differences observed in Test 16 (16.65 mg/g), Test 11 (3.44 mg/g), and Test 21 (10.40 mg/g). Most tests showed relatively slight differences in adsorption capacity, suggesting that while HNO3 activation generally enhances performance, the extent of improvement varies based on experimental conditions. This enhanced performance can be attributed to the superior surface properties of HNO3-activated bentonite, which benefits from an increased specific surface area and a greater volume of larger capillaries following activation, as indicated by previous BET results. These structural enhancements facilitate more effective interactions between the adsorbent and Pb2⁺ ions, allowing HNO3-activated bentonite to retain more Pb2⁺ (Ibigbami et al., 2022).
The average S/N ratio results, shown in Table 6, indicate ranges of 22.78–37.44 for bentonite and 23.13–37.83 for HNO3-activated bentonite. The S/N ratios for each controllable factor stage are derived from removal averages in Figure 4, illustrating the Taguchi method's logic. The strongest influence on the S/N ratio is from contact time, followed by initial Pb2+ concentration, pH, and the mass of the adsorbent materials. The maximum Pb2+ adsorption capacities are 74.76 mg/g (S/N = 37.44) for bentonite and 77.9 mg/g (S/N = 37.83) for HNO3-activated bentonite. Under the same conditions (pH 5, 0.01 g mass, 50 mg/L concentration, 120 min), HNO3-activated bentonite shows higher ion absorption due to increased active sites, porosity, and surface area following acid activation, confirming its superior Pb2+ removal capability.
Analysis of variance of bentonite and HNO3-activated bentonite.
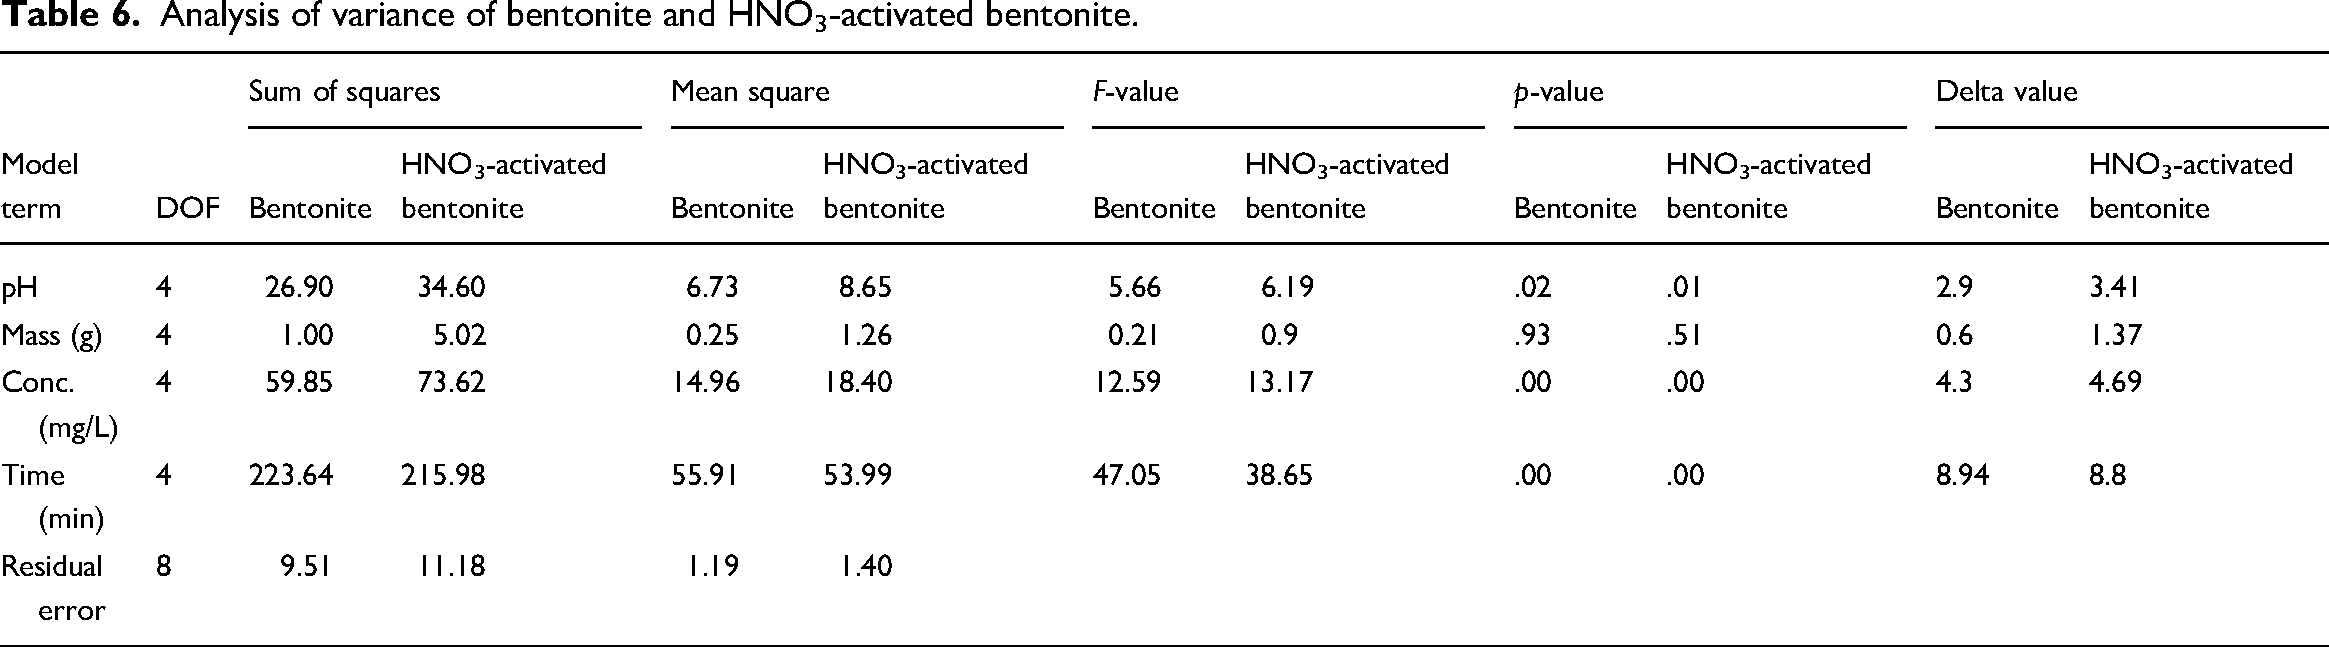
Figure 4 summarizes the mean S/N ratios for both bentonite and HNO3-activated bentonite across four critical factors. Each factor is evaluated at five distinct levels, with the S/N ratios indicating the effectiveness of Pb2+ removal. For bentonite, contact time has the highest S/N ratio (35.8) at Level 5, showcasing its crucial role in enhancing adsorption, followed by concentration with a peak of 33.24, while pH and mass have lower influences, ranked third and fourth respectively. In HNO3-activated bentonite, a similar trend is observed, with contact time again ranked highest (35.91), followed closely by concentration (33.7) and pH (33.65), while mass remains the least impactful (ranked fourth).
Implementation of ANOVA
ANOVA was conducted to assess the impact of each controllable parameter on the efficiency of Pb2+ ion removal, ensuring the reliability of the results and experimental conditions (Razmi and Ghasemi-Fasaei, 2018). The findings for both bentonite and HNO3-activated bentonite are summarized in Table 6. The analysis indicates that pH has a significant effect on adsorption for both materials, with p-values of .02 for bentonite and 0.01 for HNO3-activated bentonite; notably, HNO3-activated bentonite shows greater sensitivity to pH variations, as reflected in its higher sum of squares. Conversely, the mass does not significantly affect adsorption for either material, as demonstrated by low sum of squares and high p-values (.93 for bentonite and .51 for HNO3-activated bentonite). Both concentration and contact time exhibit highly significant effects, with very low p-values (0.00) and substantial variability, highlighting their importance in enhancing adsorption capacity.
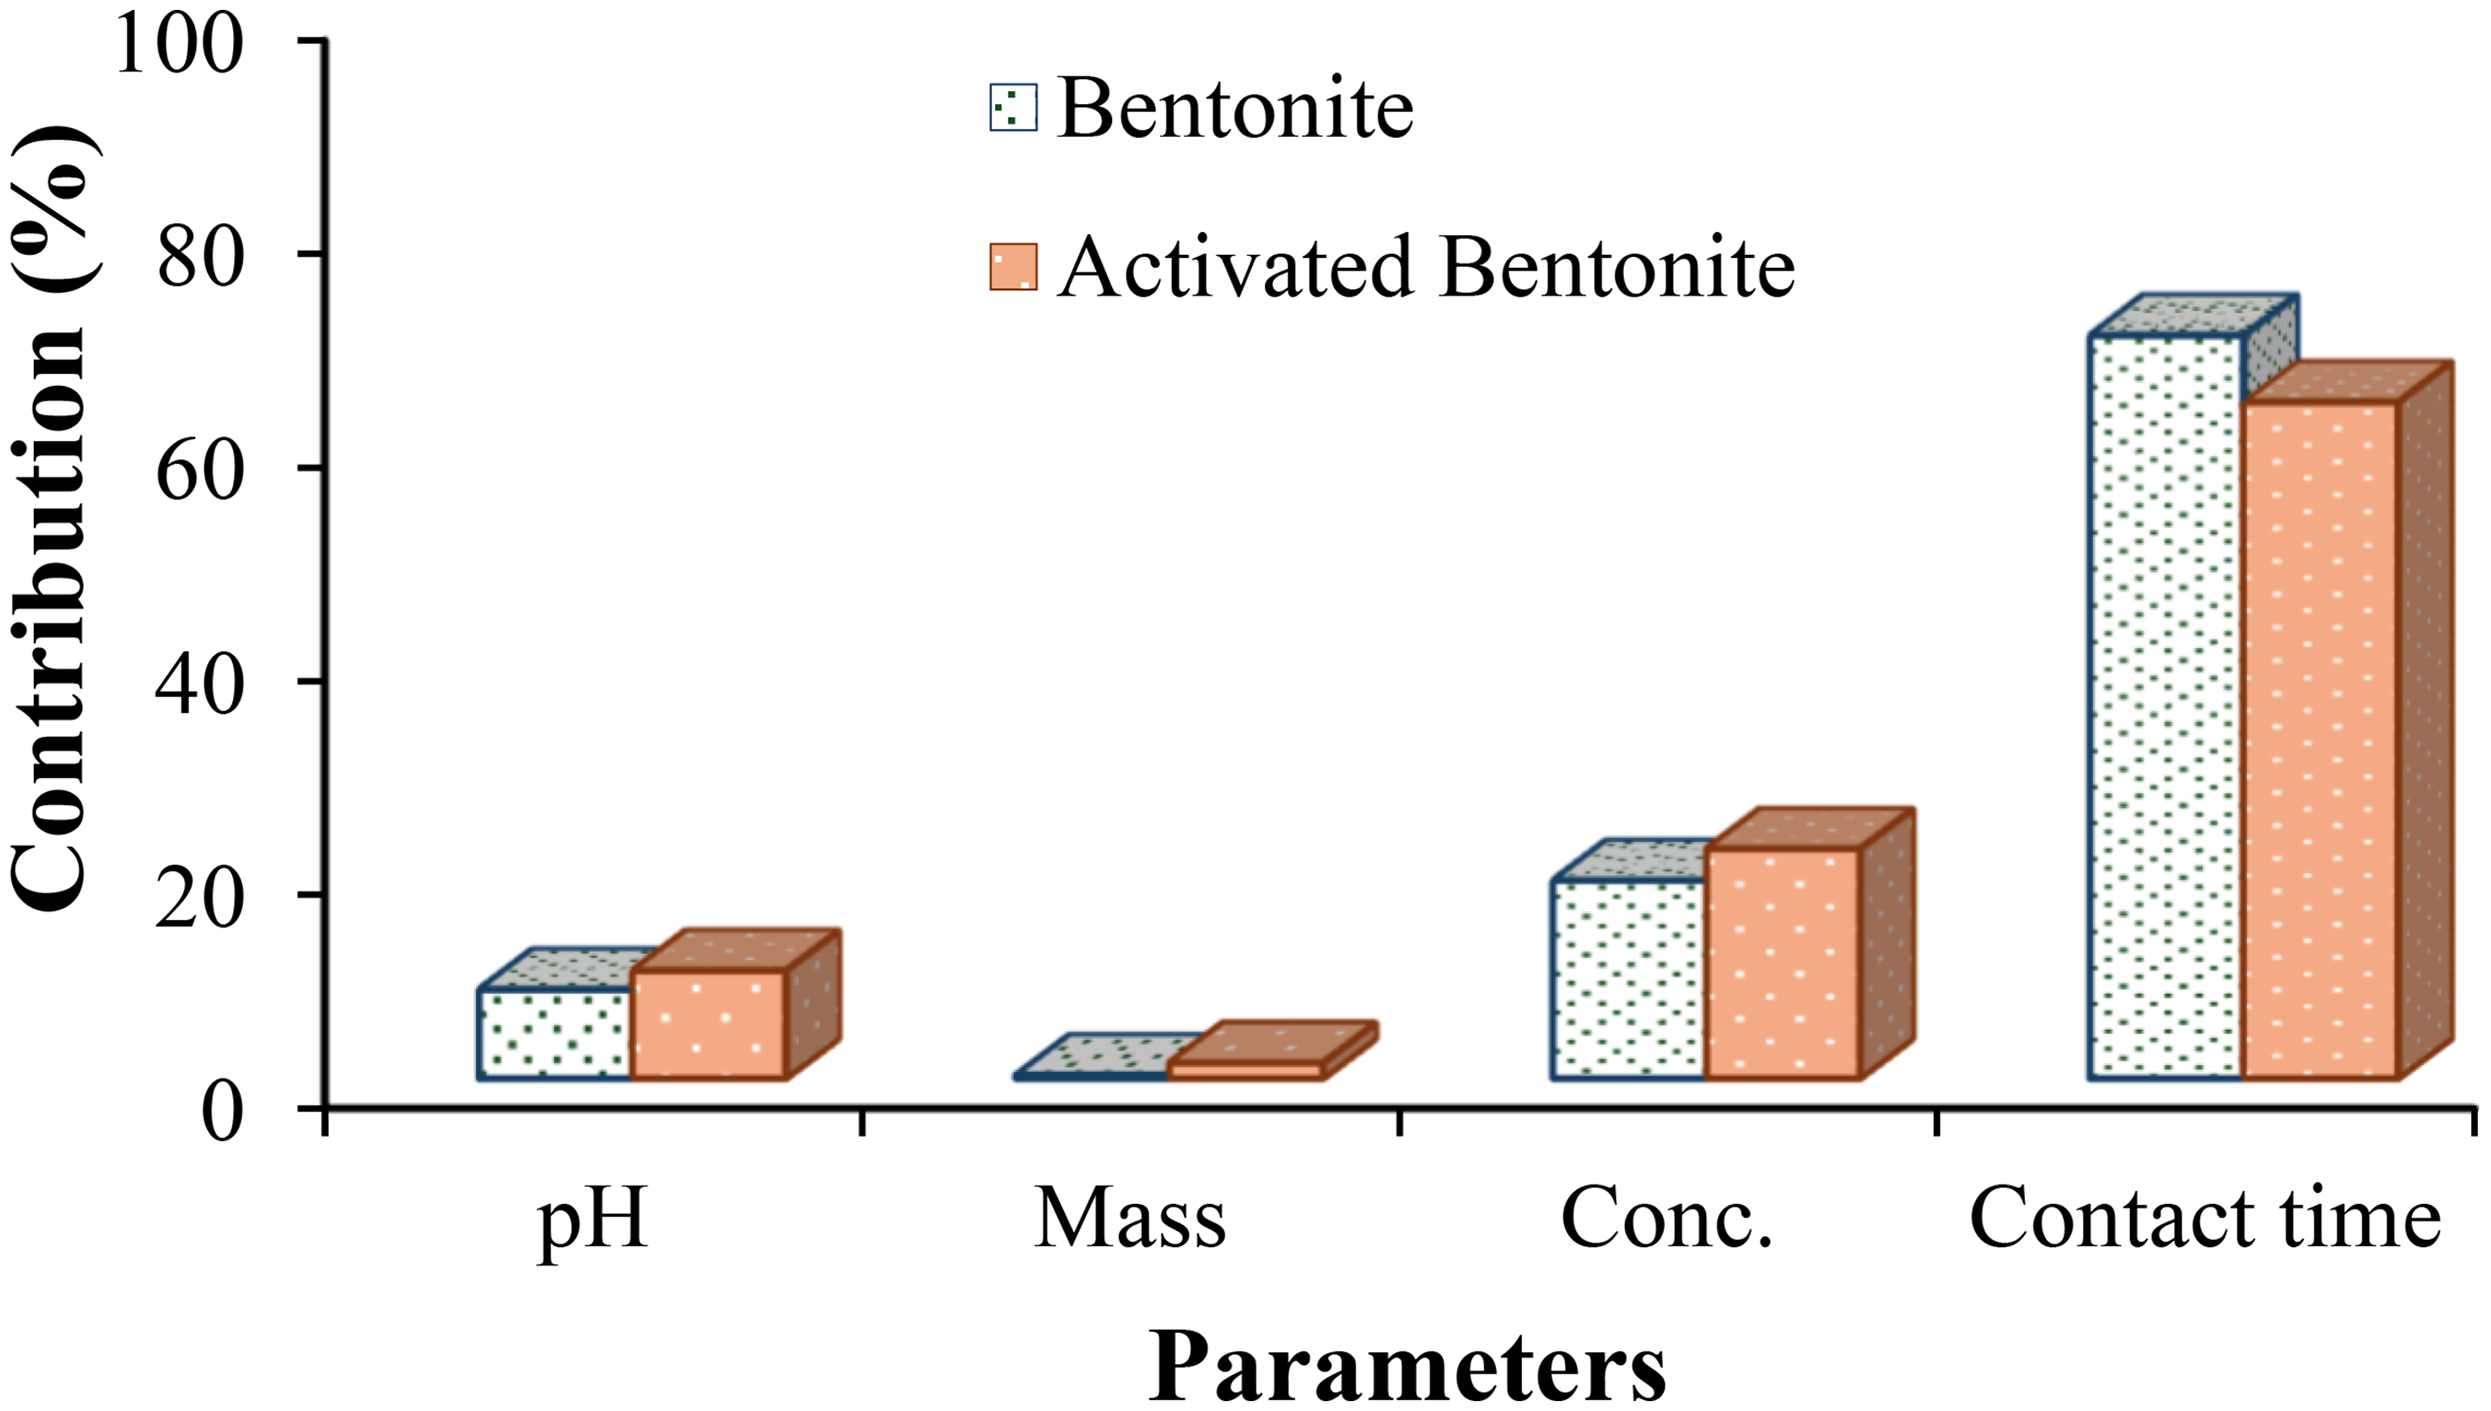
Figure 5 shows the contribution percentages of factors affecting Pb2⁺ adsorption: contact time, initial concentration, pH, and material mass. Contact time is the most significant factor, accounting for 69.69% of variance in Pb2⁺ adsorption for bentonite and 63.45% for HNO3-activated bentonite, highlighting its crucial role in enhancing adsorption capacity. In contrast, material mass has minimal impact, contributing only 0.31% for bentonite and 1.48% for HNO3-activated bentonite. This aligns with the delta values in Table 6, where contact time has the highest delta (8.94 for bentonite, 8.8 for HNO3-activated bentonite), confirming its influence. Previous studies also emphasized contact time and initial concentration as key parameters; for instance, a study using the Taguchi method found initial concentration to be the most influential factor, contributing 31% to Pb2⁺ removal and 43% to Hg2⁺ removal (Zolfaghari et al., 2011).
Percentage contribution of parameters to Pb2+ adsorption capacity by bentonite and HNO3-activated bentonite.
Regression analysis
Regression analysis is applied to model and analyze situations where different variables have a relationship between a dependent variable and one or more independent variables (Kıvak, 2014). In this study, regression analysis is used to calculate the equations predicting the theoretical adsorption amount and the actual adsorption amount of bentonite and HNO3-activated bentonite. The prediction equations are constructed as linear models and quadratic regression models.
Table 7 presents prediction equations for Pb2+ adsorption using bentonite and HNO3-activated bentonite, along with their R) values, which indicate how well each model explains the variability in adsorption results. The table includes linear equations that show simple relationships between Pb2+ adsorption and independent variables (denoted as a, b, c, and d, typically representing factors like pH, mass, concentration, and contact time). In contrast, quadratic regression curves incorporate squared and interaction terms, allowing for a more accurate representation of the relationships among the variables. The R2 values reflect the percentage of variability in Pb2+ adsorption explained by the models; for bentonite, the linear model has an R2 of 0.84, while the quadratic model significantly improves this to 0.96. For HNO3-activated bentonite, the linear model has an R2 of 0.80, and the quadratic model raises it to 0.95, highlighting the complexity of its adsorption behavior due to enhanced surface interactions. The findings indicate that quadratic regression models provide a better fit than linear models, emphasizing the importance of considering both individual effects and interactions among factors for effective optimization of the adsorption process in practical applications (Nas and Altan Özbek, 2020).
Prediction equations of bentonite and HNO3-activated bentonite.
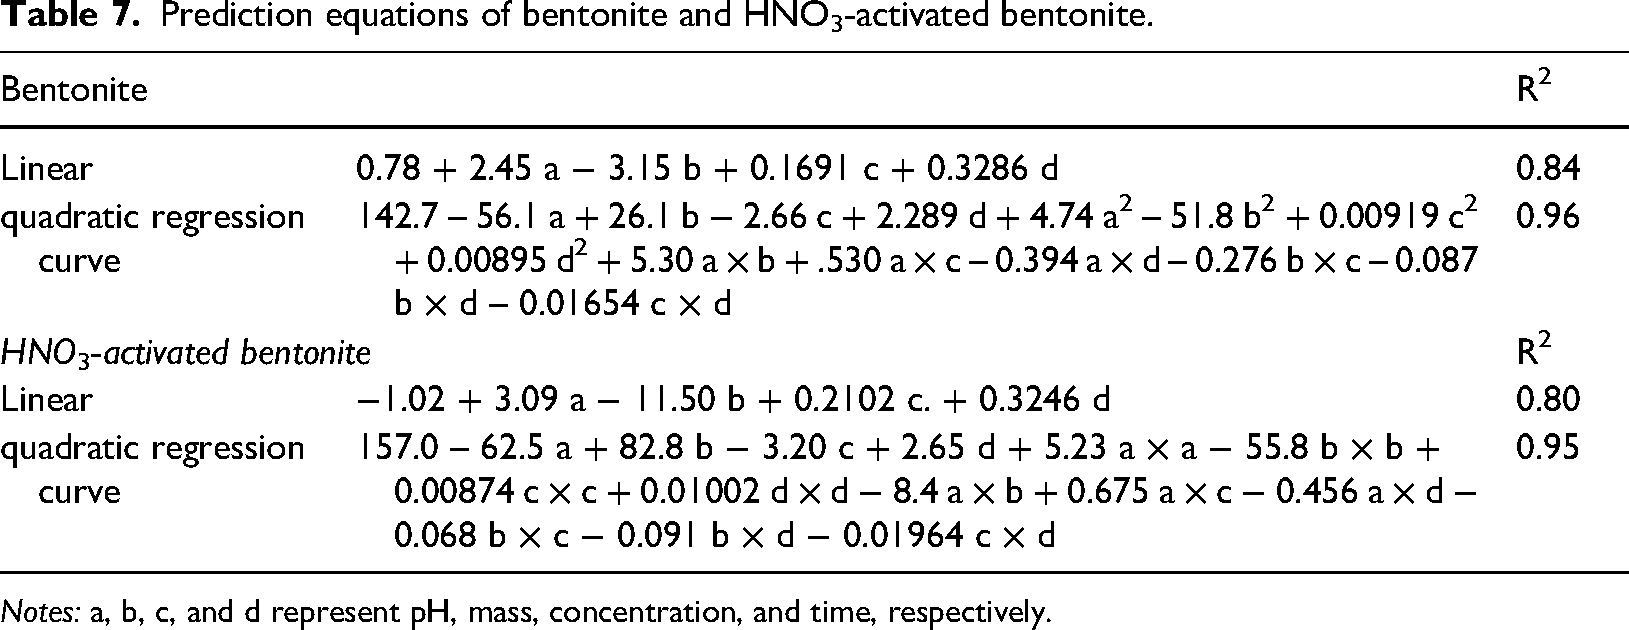
Notes: a, b, c, and d represent pH, mass, concentration, and time, respectively.
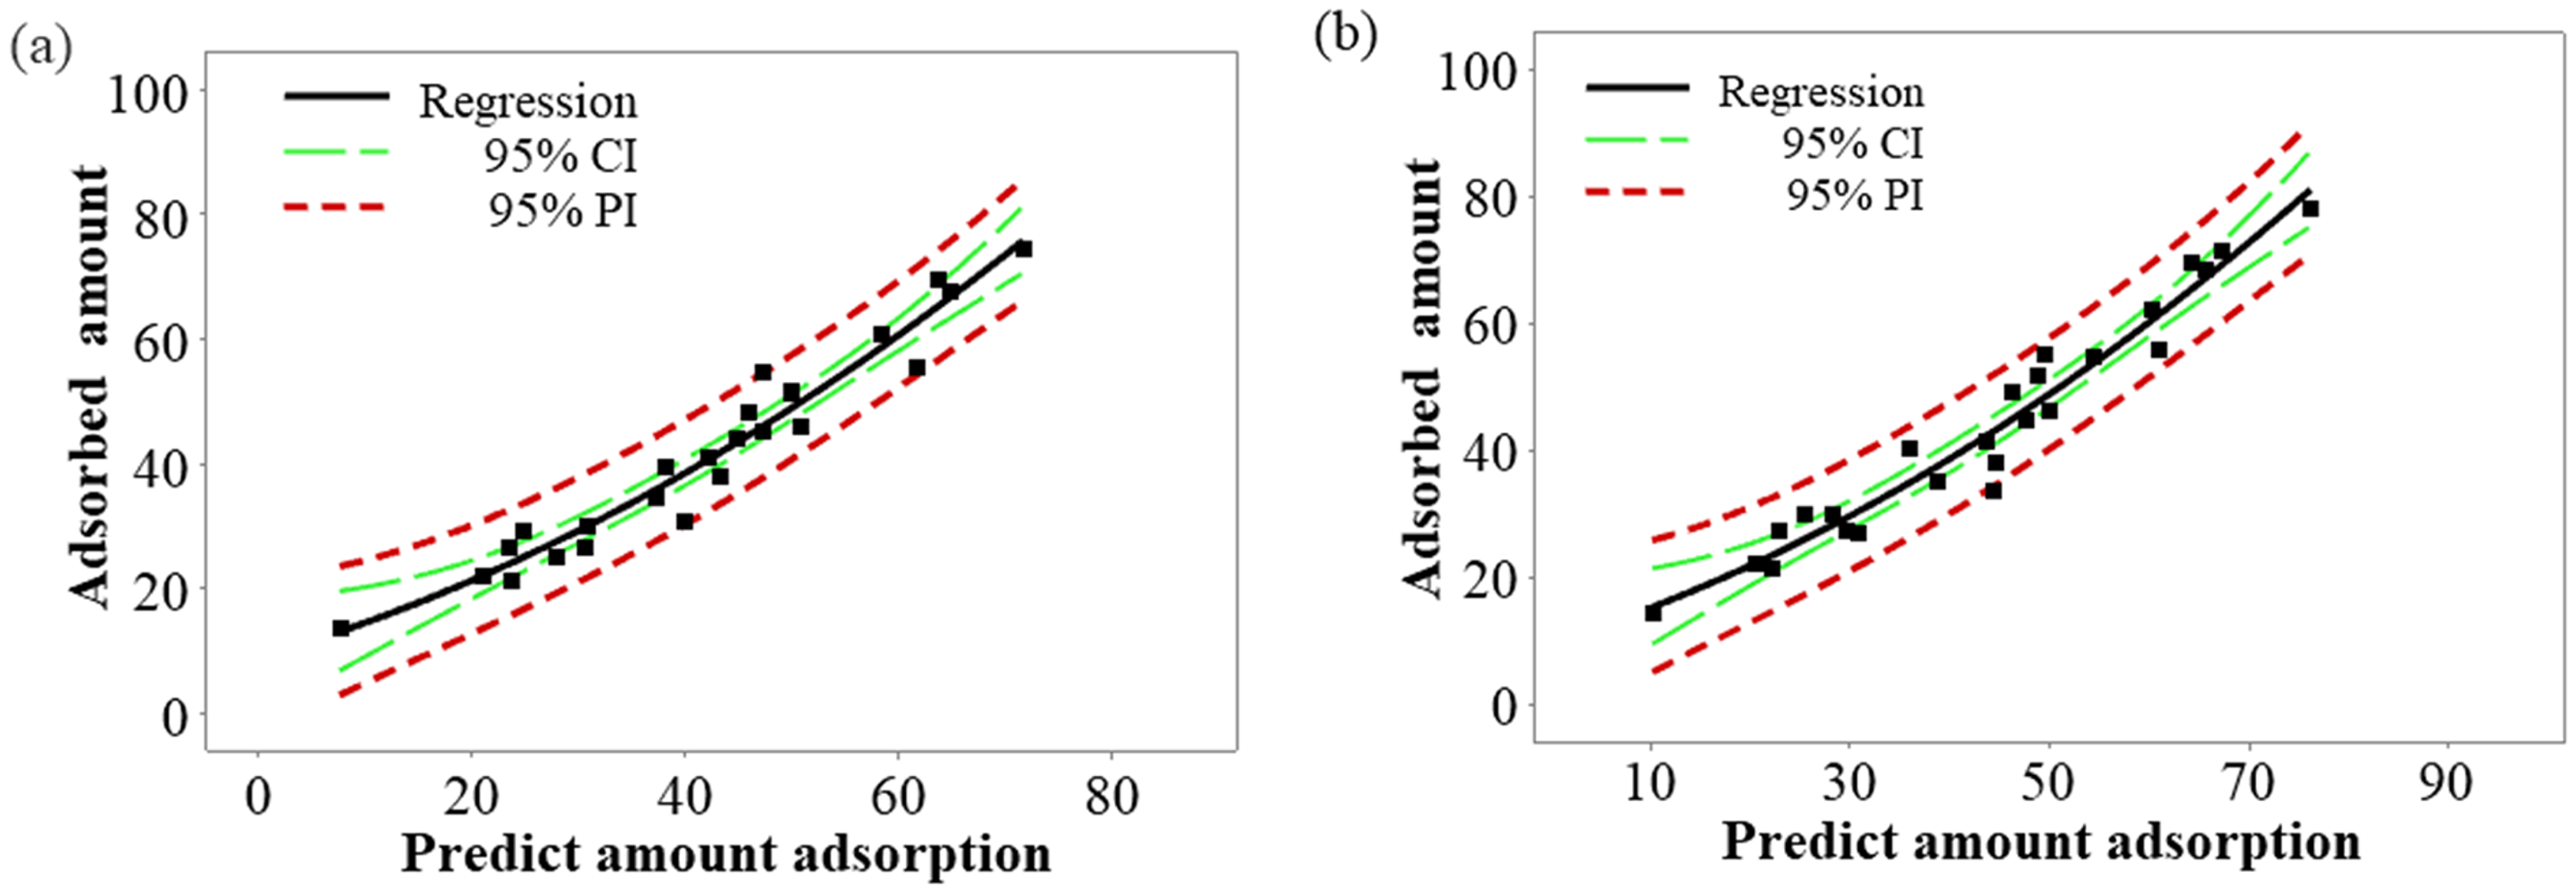
The fit of the quadratic regression curve model for (a) bentonite and (b) HNO3-activated bentonite is illustrated in Figure 6. This figure effectively demonstrates how well the quadratic model aligns with the experimental data, highlighting the strong predictive capabilities of the model for both materials. The close correspondence between the predicted values and the actual adsorption results underscores the quadratic model's ability to capture the complex interactions influencing adsorption behavior, providing a more accurate representation compared to simpler linear models.
Quadratic regression curve model of bentonite (a) and HNO3-activated bentonite (b).
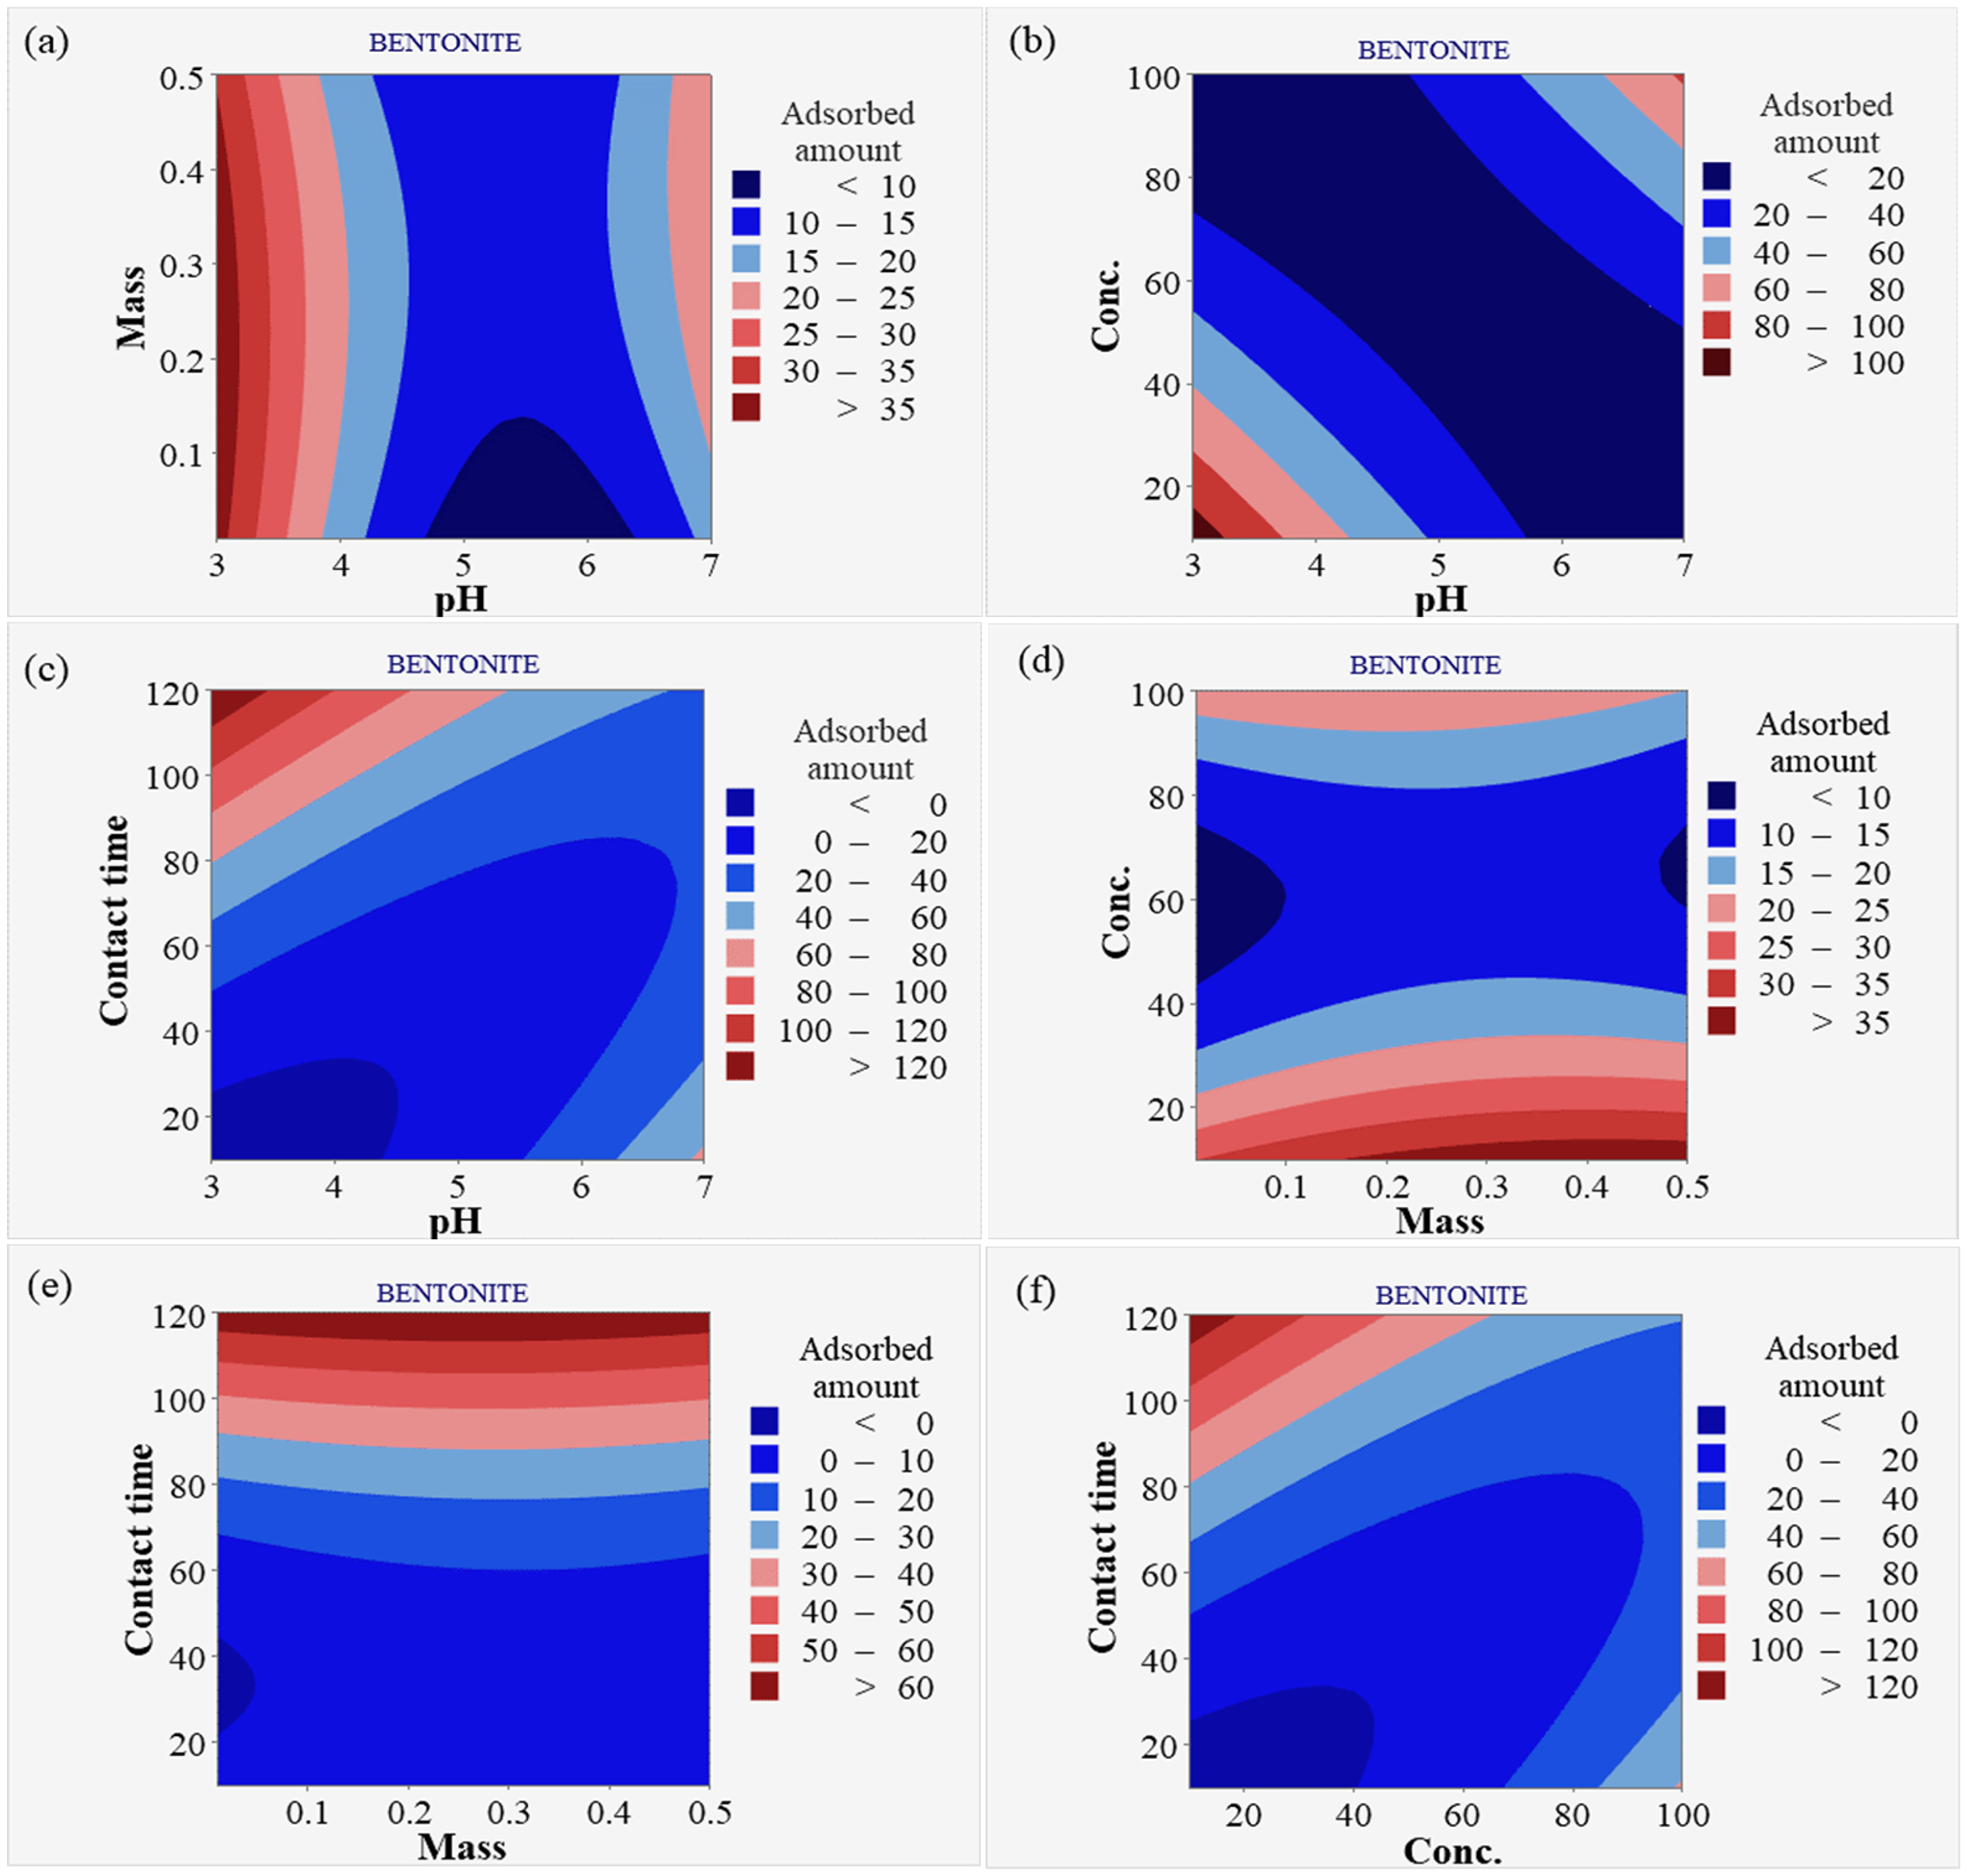
Figure 7 presents contour plots for bentonite and HNO3-activated bentonite, illustrating the intricate relationships between pH, mass, concentration, and contact time in Pb2⁺ adsorption. Plot (a) examines how varying pH levels and adsorbent dosages affect Pb2⁺ adsorption, indicating that certain pH ranges enhance adsorption efficiency. It shows that increasing the dosage improves removal efficiency, particularly at optimal pH levels. This underscores the importance of fine-tuning both pH and dosage to maximize Pb2⁺ removal, revealing that higher dosages at suitable pH create favorable conditions for stronger electrostatic interactions with Pb2⁺ ions (Mäki-Arvela and Murzin, 2013). Plot (b) highlights the relationship between pH levels and Pb2⁺ concentration, demonstrating that lower pH values significantly enhance adsorption efficiency, particularly at higher concentrations of Pb2⁺ ions. The plot likely shows distinct regions where adsorption increases, illustrating that maintaining a lower pH can optimize the removal of Pb2⁺ in solutions with high Pb2+ concentrations, ultimately improving the overall effectiveness of the adsorption process. Plot (c) demonstrates how varying pH levels affect removal efficiency over different contact times, indicating that longer durations at optimal pH significantly enhance Pb2⁺ adsorption. As contact time increases, the likelihood of Pb2⁺ ions interacting with the adsorbent surface also rises, promoting greater adsorption (Mariana et al., 2021). Optimal pH conditions favor electrostatic attractions and chemical interactions, leading to higher retention of Pb2⁺ ions (Radovic et al., 2001).
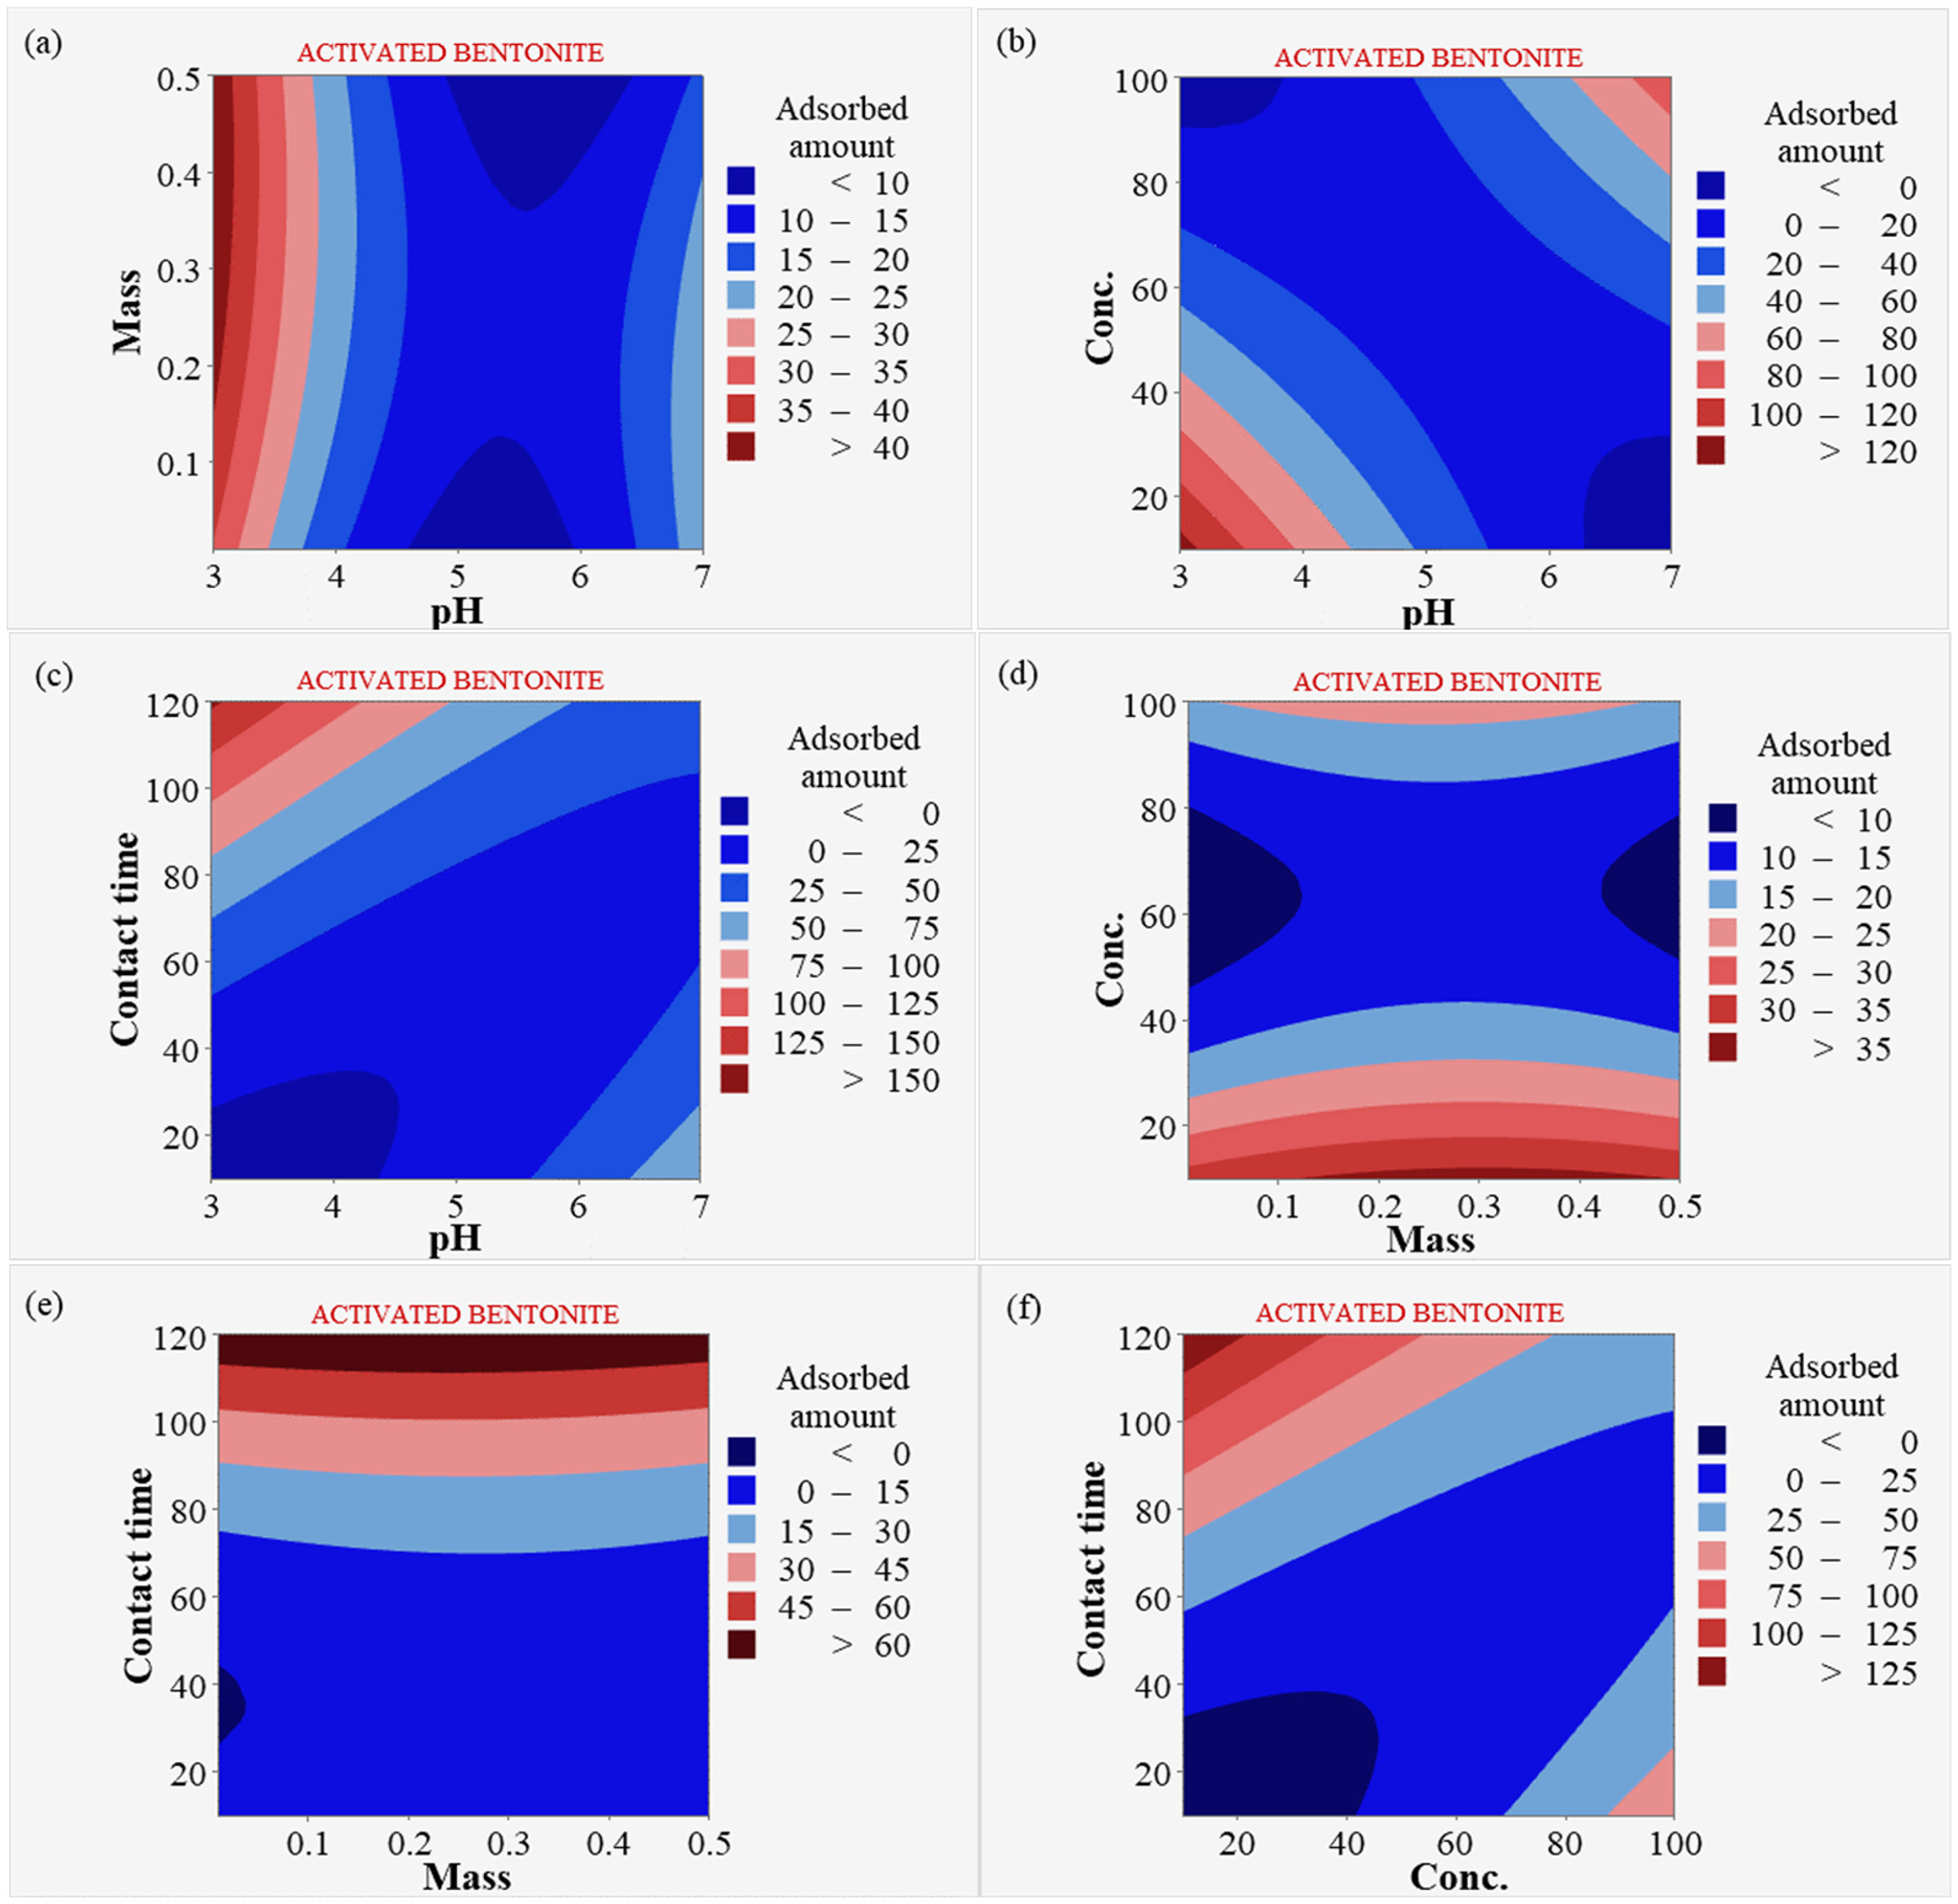
Contour plot for bentonite and HNO3-activated bentonite (a) pH and dosage, (b) pH and concentration, (c) pH and contact time, (d) dosage and concentration, (e) dosage and contact time, (f) concentration and contact time.
Plot (d) shows that increasing adsorbent dosage generally enhances Pb2⁺ adsorption rates, indicating a clear correlation between dosage and removal efficiency. However, this improvement continues only up to a certain concentration threshold, beyond which adsorption rates may plateau or decrease. This suggests that while additional adsorbent provides more active sites, excessive amounts may not significantly increase efficiency if Pb2⁺ ions are insufficient to occupy all sites (Obsa et al., 2024). Plot (e) examines the impact of varying adsorbent dosages on Pb2⁺ adsorption over time, indicating that while longer contact times generally enhance adsorption, higher dosages can lead to diminishing returns. As contact time increases, the likelihood of Pb2⁺ ions interacting with the adsorbent rises, but elevated dosages may saturate available active sites, limiting further adsorption (Huang et al., 2014). This saturation means that beyond a certain dosage, additional adsorbent does not significantly improve removal efficiency. Finally, plot (f) examines the interaction between Pb2⁺ concentration and contact time, suggesting that lower concentrations combined with extended contact times enhance adsorption efficiency. At these lower concentrations, more active sites on the adsorbent are available for binding, allowing for more effective interactions over time (Corda and Kini, 2020). Longer contact time facilitates the diffusion and adhesion of Pb2⁺ ions to the adsorbent surface, leading to improved removal rates (Mariana et al., 2021).
Adsorption kinetics and isotherms
To understand the mechanisms governing the adsorption of Pb2⁺ by bentonite and HNO3-activated bentonite, the kinetic data were analyzed using three models: Pseudo second-order, Pseudo first-order, and Elovich. Additionally, the isotherm data were evaluated using the Langmuir, Freundlich, and Temkin models. The equations for these kinetic and isotherm models are presented in Table 1, while their respective linear parameters are detailed in Table 8.
Regression parameters of Pb2+ adsorption kinetics and Pb2+ adsorption isotherm.
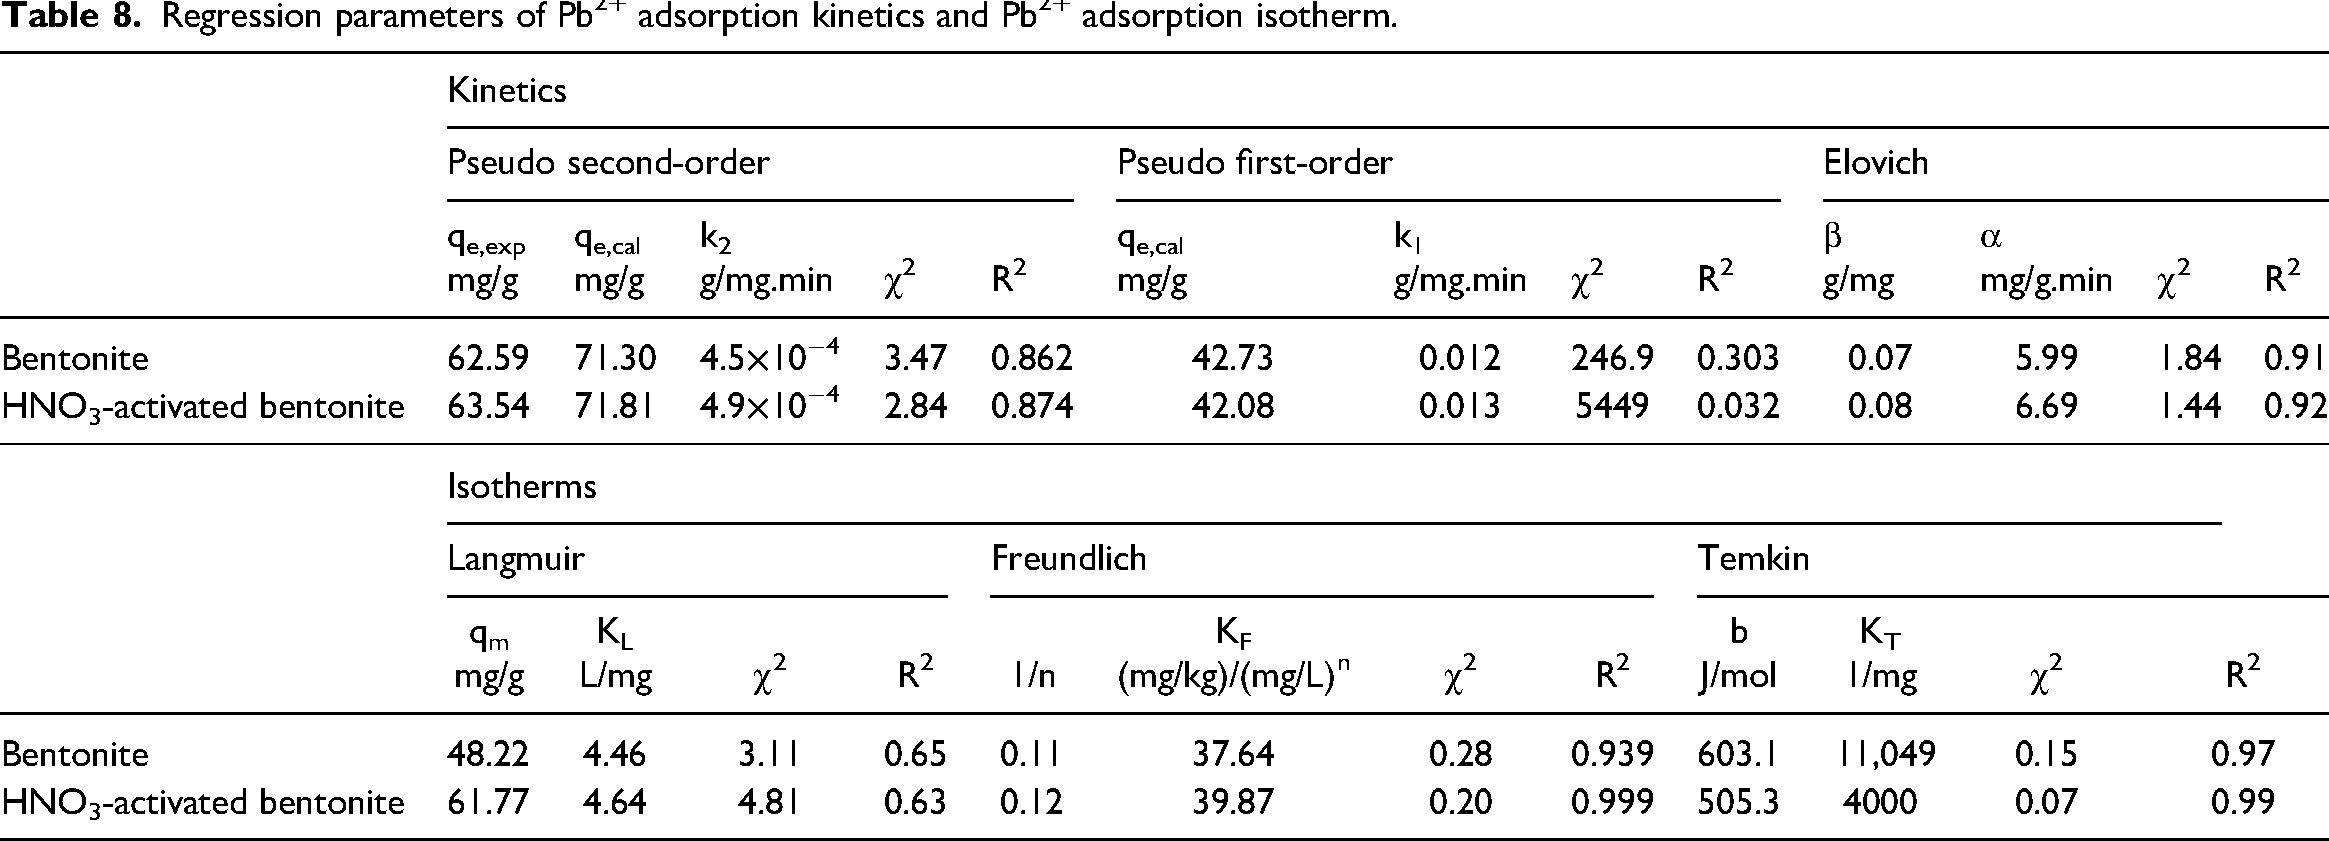
The analysis of the linear error functions in Table 2 shows that the χ2 values for the Elovich kinetic model were the smallest among the evaluated kinetic models, indicating a strong fit to the experimental data for Pb2⁺ ions. Additionally, the R2 value for the Elovich model was the highest, suggesting it effectively represents the adsorption kinetics. The calculated equilibrium adsorption capacities (qe, cal) from the Elovich model closely matched the experimental capacities (qe, exp), further confirming that the Elovich model accurately captures the adsorption behavior of Pb2⁺ onto bentonite and HNO3-activated bentonite and is relevant for describing the dynamics of the adsorption process.
The kinetic data analyzed using the linear form of the Elovich model indicate that Pb2+ adsorption occurs via chemisorption over an extended equilibrium time (Inyang et al., 2016). The initial sorption rate (α) for HNO3-activated bentonite is measured at 6.69 mg/g.min, in contrast to 5.99 mg/g.min for regular bentonite. This higher α not only indicates that HNO3-activated bentonite demonstrates a more rapid adsorption capacity but also suggests enhanced interaction between Pb2+ ions and the modified surface of the bentonite. Such improvements in adsorption kinetics can be attributed to the increased surface reactivity and porosity of HNO3-activated bentonite, making it a more effective material for Pb2+-ion capture in aqueous solution (Inyang et al., 2016: 477; Tseng et al., 2022).
The analysis of the isotherm models in Table 9 indicates that Pb2⁺ adsorption by both bentonite and HNO3-activated bentonite adheres to the Temkin model, evidenced by R2 values exceeding 0.97 and χ2 values below 0.15. This robust correlation suggests that the adsorption process is multilayered and significantly influenced by interactions between Pb2⁺ ions and the surfaces of both bentonites, a fundamental aspect of the Temkin model (Kalam et al., 2021). Notably, HNO3-activated bentonite exhibits even higher R2 values and lower χ2 values than bentonite, indicating enhanced adsorption efficiency. This improvement is likely due to the chemical modifications introduced during the activation process, which may increase the availability of active sites or enhance the binding affinity for Pb2⁺ ions, thereby facilitating more effective adsorption (Ibigbami et al., 2022).
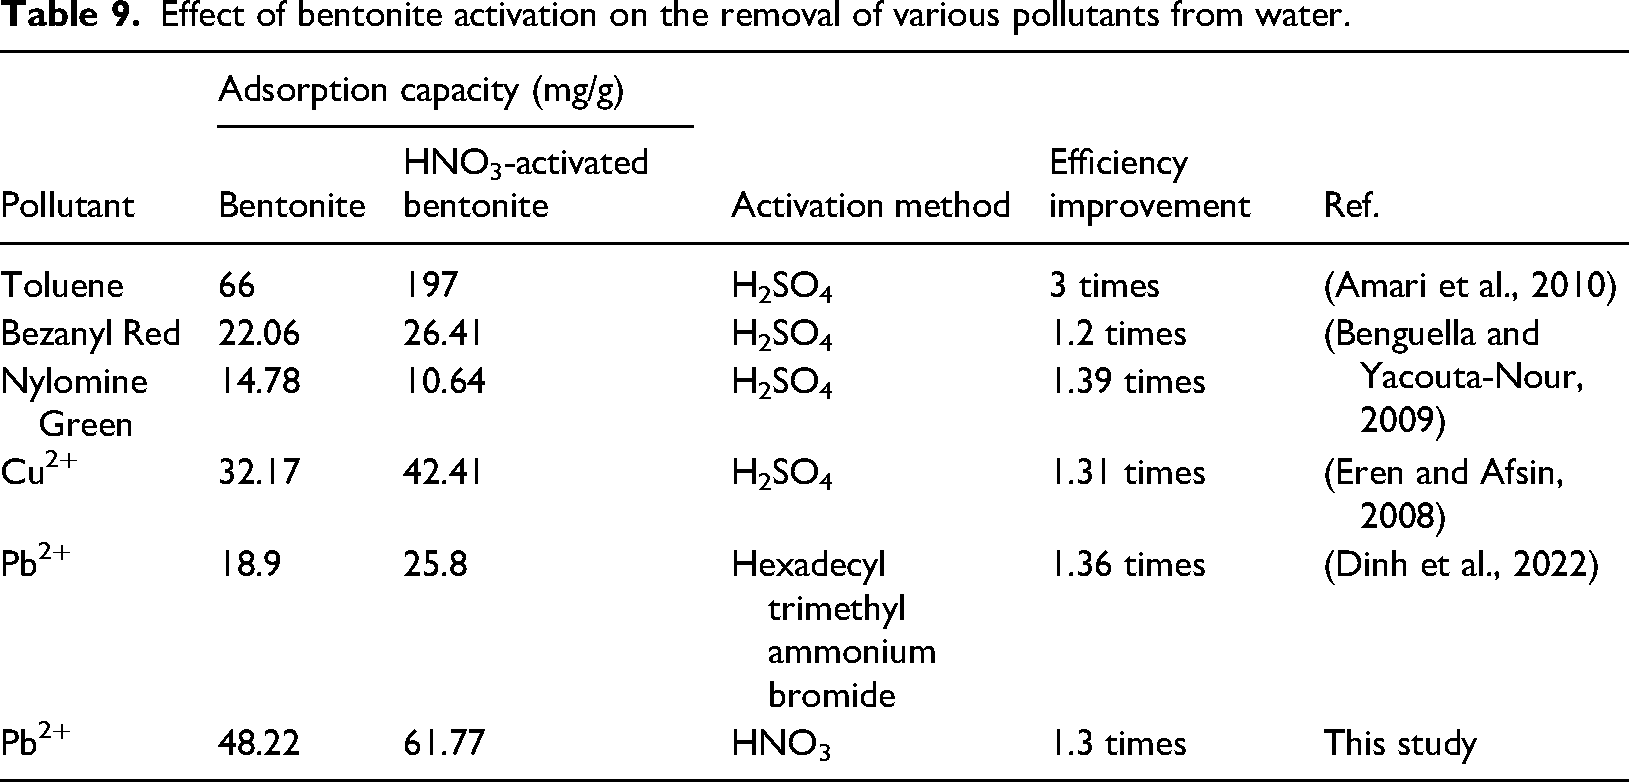
Effect of bentonite activation on the removal of various pollutants from water.
Moreover, the Langmuir model analysis reveals that the maximum adsorption capacity (qmax) for HNO3-activated bentonite is 61.77 mg/g, which surpasses the 48.22 mg/g capacity of bentonite. This difference not only highlights the superior adsorption capability of HNO3-activated bentonite for Pb2⁺ ions but also suggests that the modifications during activation play a crucial role in optimizing its performance as an adsorbent.
Comparison with other studies
Acid activation of bentonite has been shown in several studies to significantly enhance its capacity to adsorb various pollutants. Research focused on H2SO4 activation for the adsorption of toluene, Cu2⁺, and Pb2⁺ (Amari et al., 2010; Dinh et al., 2022; Eren and Afsin, 2008) indicates that these treatments can markedly improve adsorption performance, as summarized in Table 9. In the current study, the adsorption capacity for Pb2⁺ using HNO3-activated bentonite is reported at 61.77
Conclusion
In this study, the activation of bentonite with HNO₃ significantly improved its properties, especially its surface area and structural characteristics, leading to enhanced Pb2+ adsorption capacity. Physical–chemical analyses (BET, XRD, and FTIR) confirmed that HNO₃ activation altered the bentonite's structure, increasing the availability of active sites for Pb2+ adsorption. Specifically, the BET surface area increased, while the XRD and FTIR spectra revealed modifications to the octahedral and tetrahedral sheets, enhancing interaction between the adsorbent and Pb2⁺ ions.
The Taguchi method with an L25 layout was employed to optimize the Pb2⁺ adsorption process, identifying contact time as the most significant factor for both raw and HNO3-activated bentonite. The maximum Pb2+ adsorption capacity increased from 48.22 mg/g for raw bentonite to 61.77 mg/g for the activated material—1.3 times greater. The adsorption data fit the Temkin isotherm model, indicating a chemisorptive process, while the Elovich model described the kinetic data, suggesting a gradual adsorption. The increased sorption rate (α) for HNO3-activated bentonite further supported this enhanced efficiency.
Future research should focus on optimizing the activation process further by varying acid concentrations and activation times to maximize adsorption capacity. Additionally, investigating the reusability and long-term stability of HNO3-activated bentonite under real wastewater conditions could enhance its potential for large-scale water treatment. Thermodynamic studies and the use of nonlinearized models would provide deeper insights into the scaling process and adsorption mechanisms. Finally, examining the morphological changes postadsorption would help clarify the interaction of bentonite with Pb2⁺ and other ions.
Footnotes
Acknowledgment
The authors would like to thank the advanced solid waste treatment laboratory of Can Tho University funded by JICA for conducting experiments and analyzing the Pb2+.
Author contributions
The authors confirm the study conception and design: N. X. Loc and D. T. M. Phuong; data collection: N. T. A. Thu; analysis and interpretation of results: N. T. A. Thu; draft manuscript preparation: N. X. Loc and D. T. M. Phuong. The results were evaluated by all authors, and the final version of the manuscript was approved.
Declaration of conflicting interests
The authors declared no potential conflicts of interest with respect to the research, authorship, and/or publication of this article.
Funding
The authors received no financial support for the research, authorship, and/or publication of this article.