
Abstract
The primary objective of this study is to assess the adsorption behavior of boron using a tannin-based biosorbent known as tannic acid resin, synthesized from Turkish acorns (valonia) through the spray-drying method. The resulting biosorbent, named Valex, underwent modification into a tannic acid resin-based structure, rendering it suitable for use as a biosorbent. Comprehensive characterization studies involving Fourier transform infrared, X-ray diffraction, scanning electron microscopy, and Brunauer-Emmett-Teller analysis were conducted on this biosorbent. The outcomes demonstrated the effectiveness of tannic acid resin, a tannin-based biosorbent, in removing boron from aqueous solutions. Various parameters such as pH, initial boron concentration, and adsorbent dosage were investigated for their impact on boron removal. The study also delved into adsorption kinetics, adsorption isotherm models, and adsorption thermodynamics. Maximum boron removal, reaching 92.9%, was achieved using 1 g of tannic acid resin-based biosorbent with an initial boron concentration of 8 mg L−1 within 6 h at pH 3. The Langmuir, Freundlich, Dubinin–Radushkevich, and Temkin isotherm models were applied to experimental data, with the Temkin model demonstrating a good fit. Adsorption kinetics were explored using pseudo-first-order, pseudo-second-order, Elovich, first-order, second-order, and intraparticle diffusion models, with the pseudo-second-order kinetic model fitting the data effectively. The negative values of ΔG° at all temperatures indicated the spontaneous nature of boron adsorption on the tannin resin, and the positive value of ΔH° suggested the endothermic nature of adsorption. This study shows the efficacy of Valex in boron adsorption and suggests its potential application as an effective method for boron removal. This study's findings on the impact of various parameters on boron removal provide insights for optimizing the boron adsorption process in practical applications.
Introduction
Boron is not found in nature alone in elemental form. However, it exists in the borate form such as boric acid and boron salts. It has been widely used in various areas such as agriculture, ceramics, glass, metallurgy, pharmaceuticals, textile, semiconductors, fertilizer, rocket fuel, nuclear industry, and paper industries (Bai et al., 2022; Guan et al., 2016). Today, with the rapid increase of industrialization, the unconscious consumption of water resources and the amount of wastewater have increased rapidly. Boron, one of the pollutants in wastewater, threatens the life of all living things together with the increase in the proportion of the water (Çalık, 2002). Boron is detrimental to both plants and animals above certain levels (Hilal et al., 2011). Prolonged exposure of living organisms to water contaminated with boron may result in adverse effects on the nervous and reproductive systems in humans, as well as hinder the division and growth of plant roots (Hong et al., 2021; Igra et al., 2016). Recognizing these potential risks, the World Health Organization (WHO) has established guidelines recommending that boron concentrations should not exceed 2.4 mg.L−1 in drinking water. Many countries have implemented even more rigorous standards. Also, some economic plants could not tolerate above 1 mg.L−1 boron in irrigation water (Lin et al., 2021; Morisada et al., 2011; World Health Organization, 2022). Despite these guidelines, the average concentration of boron in water sources varies widely. Surface water shows a range from 0.1 to 4.5 mg L−1, while groundwater concentrations range from 0.3 to 100 mg L−1 (Bai et al., 2020, 2022; Bodzek, 2016; Chen et al., 2020). This discrepancy between recommended limits and actual concentrations underscores the importance of continued monitoring and regulatory measures to ensure the safety of water sources for both human consumption and agricultural use.
In recent years, various separation methods such as adsorption (Jalali et al., 2016; Kanmaz et al., 2023a; Saloglu and Sahin, 2021; Zhang et al., 2022), reverse osmosis (Maung and Song, 2009; Wolska and Bryjak, 2013), ion exchange (Mel’nik et al., 2008), electrocoagulation (Sari and Chellam, 2015), chemical precipitation (Lin et al., 2016; Mahasti et al., 2022; Yoshikawa et al., 2012), sorption–ultrafiltration hybrid process (Samatya et al., 2015), solvent extraction (Fortuny et al., 2014; Matsumoto et al., 1997), and electrodialysis (Kabay et al., 2008) have been used to separate and recover boron from aqueous solutions. Among the various practical separation techniques, adsorption stands out as a promising method for the removal of boron from wastewater. This approach is characterized by its cost-effectiveness, low energy consumption, ease of operation, and high removal efficiency (Afolabi et al., 2021; Dehghani et al., 2019; Ipek et al., 2013; Wu et al., 2019; Xu and Jiang, 2008). The versatility and efficiency of adsorption make it a viable and attractive solution in addressing boron contamination in wastewater, providing a sustainable and effective means of treatment. Hence, a broad spectrum of boron adsorbents/biosorbents has undergone extensive investigation. These encompass diverse materials, ranging from fly ash, activated carbon, oxides, layered double hydroxides, nanoparticles, and mesoporous silica, to selective resins, complexing membranes, and natural resources such as clay minerals, zeolites, oxides, and biopolymers. Engineered materials, including carbonaceous adsorbents, polymers, oxidic adsorbents, and zeolite molecular sieves, have also been explored (Bacelo et al., 2016; Cai et al., 2021; Guan et al., 2016; Hiew et al., 2021; Jalali et al., 2016; Kanmaz et al., 2023a, 2023b; Saloglu and Sahin, 2021; Zhang et al., 2022). This comprehensive exploration of various adsorbent materials reflects the ongoing efforts to identify effective and sustainable solutions for boron removal from wastewater.
Recent years have witnessed a growing research focus on low-cost adsorbents, including biosorbents, agricultural by-products, and industrial waste, as alternative options to conventional manufactured adsorbents. These materials have demonstrated suitability for various applications in wastewater treatment. While considerations of safety have primarily limited drinking-water treatment applications to activated carbon and oxidic adsorbents (Worch, 2012), the high energy costs associated with their manufacturing and the implications for acquisition prices and the environment have prompted the exploration of alternative approaches. In the pursuit of environmentally friendly adsorption processes, the emphasis has grown on the significance of adsorbents that are not only efficacious but also renewable, abundant, and require minimal processing prior to use. Biosorption, defined as the ability of specific biomolecules or biomass types (biosorbents) to selectively bind and concentrate certain ions or molecules from aqueous solutions through a metabolically passive process, plays a pivotal role in achieving these sustainability goals (Bacelo et al., 2016). The mechanisms of biosorption primarily hinge on physicochemical interactions between adsorbates and functional groups present on the biomass surface, encompassing electrostatic interactions, ion exchange, metal ion chelation, or complexation (Dodson et al., 2015). In recent years, biosorption employing marine seaweeds, agricultural wastes, forest residues, and industrial byproducts, whether in their native or modified forms, has emerged as a promising technology for removing heavy metals and organic contaminants from water sources (Fomina and Gadd, 2014; He and Chen, 2014; Palma et al., 2003; Pavan et al., 2014; Sanchez-Martin et al., 2010). Adsorbents derived from lignocellulosic and tannin materials, seaweeds, and chitosan have shown significant potential for selectively capturing precious and critical metals, as well as finding applications in value-added processes such as catalysis (Dodson et al., 2015). Among the diverse array of biosorbents available, this article specifically delves into tannin-based materials (TBAs). Tannins, as natural polymers, are both cost-effective and widespread (Liao et al., 2004). These polyphenolic secondary metabolites are commonly found in higher plants, primarily in soft tissues such as leaves, needles, or bark (Arbenz and Averous, 2015; Hernes and Hedges, 2004). Ranking among the most abundant compounds extracted from biomass after cellulose, hemicellulose, and lignin, tannins are present in various plant parts, including leaves, roots, bark, seeds, wood, and fruits (Khanbabaee and van Ree, 2001).
Tannins are oligomeric compounds characterized by multiple structural units containing free phenolic groups. The tanning properties of certain organic substances, capable of transforming animal skins into leather, have been recognized since ancient times (Can et al., 2013; Khanbabaee and van Ree, 2001; McArt et al., 2006). These compounds exhibit a wide range of molecular weights, spanning from 500 to sometimes exceeding 20,000 (Can, 2011; Hemingway and Laks, 1992). Generally soluble in water (Haslam, 1996; Hemingway and Laks, 1992), with exceptions for those possessing high molecular weight structures, tannins play a protective role for plants against herbivores and pathogenic microorganisms due to their antimicrobial and antifungal properties (Khanbabaee and van Ree, 2001). Widely distributed as secondary metabolites across various sectors of the plant kingdom, including barks, leaves, fruits, galls, and woody tissues, tannins typically manifest as light yellow to brown or white amorphous powders or loose masses. They are characterized by a distinctive, somewhat pungent odor and an astringent taste (Can et al., 2013; Chen et al., 1995). Oak, chestnut, pine, acacia, birch tree, beech, and pomegranate are very important sources of tannin. Acorn is a hard oval-toothed fruit, is called “valonia” when it is in the form of a chestnut. Valex, which is a commercial name for acorn extract, contains a very rich tannin and is widely used in many fields such as leather, pharmaceutics, and painting industries (Diğrak et al., 1999; Özacar and Şengil, 2002; Pasqualone et al., 2019).
Valonia, a hydrolyzable tannin derived from acorns naturally grown in the western part of Turkey, holds significant economic importance in the leather industry. Commercially utilized for the extraction of ellagitannins, valonia serves as a tanning agent, contributing to the transformation of hides/skins into leather, albeit as a relatively low-value product priced at around $500 per ton (Britta et al., 2002; Huang et al., 2008; Onem et al., 2014). The extraction process involves the use of conventional hot water extraction from the cups and beards of acorns (Claudio et al., 2011; Guerrero et al., 2008).
In the extraction process, Turkish oak's fruit acorn capula (valonia) is treated with an acetone/ethylacetate/water mixture to remove the sugar fraction, resulting in the isolation of valonea tannin. Valonea tannin is characterized by moisture content of up to 7%, ash content of up to 2%, and non-tannin substance content of up to 27%. Valex extracted from acorns is required to contain a minimum of 65% tannin to meet quality standards (Can et al., 2013; Turkish Standarts, 1988). Tannins are water-soluble compounds, in order to use tannins as adsorbents they need to be modified and form insoluble tannin resin (Bacelo et al., 2016; Wolska and Bryjak, 2013). Tannin resin has been used as an adsorbent in many experiments. Some of the substances removed by using tannin resin as an adsorbent are palladium (II) and rhodium (III) chloro complexes (Can et al., 2013), antimony (Bacelo et al., 2022), Pb2+ (Okoli et al., 2018), dexamethasone and indomethacin (Moreira et al., 2022), Cu, Cd, Zn, Ni (Santos et al., 2019), and Cr (VI) (Malkoc and Nuhoglu, 2007).
The objective of the present article is to evaluate the adsorption capacity of tannin-based biosorbents for the removal of boron from wastewater. In the present study, tannin-based biosorbent was produced with a spray dryer, physicochemical and morphological properties of tannin-based biosorbent were characterized, and the effects of various parameters, such as pH, initial boron concentration, and adsorbent dosage were analyzed for adsorption of boron. The study encompassed an exploration of various adsorption isotherm models including Langmuir, Freundlich, Dubinin–Radushkevich (D–R), and Temkin, alongside pseudo-first-order, pseudo-second-order, Elovich, first-order, second-order, and intraparticle diffusion models. Thermodynamic parameters such as enthalpy, entropy, and Gibbs free energy were also investigated. Notably, this research stands as the pioneering example in the literature, comprehensively examining the synthesis, characterization, and adsorption behavior of a tannin-based biosorbent for boron. However, to the best of our knowledge to use of tannin resin as adsorbents to separate and recover boron from aqueous solutions has not been previously reported. In addition, there is no study in the literature on the spray-dried production of tannin, which is used as an adsorbent.
Materials and methods
In this investigation, a tannin-based biosorbent, specifically tannic acid (TA) resin, was synthesized from Valex, a product obtained through the spray drying technique. Valonia (acorns), the raw material for Valex production, was generously provided by Artu Chemical Company based in Manisa, Turkey. The tannin-based biosorbent was employed for the adsorption of boron from wastewater. Adsorption experiments were conducted using a shaker at 140 rpm for 24 h. Subsequently, the biosorbents were separated from the solution, and the remaining concentrations of boron were analyzed using Inductively Coupled Plasma Optical Emission Spectrometry (ICP-OES, ICAP 6500 DUO, Thermo Electron).
Chemicals and equipment
Because of the water-soluble characteristic of tannins, to use tannins as adsorbents they need to be modified and form insoluble tannin resin. For this reason, valex which was treated with formaldehyde, ammonia and nitric acid was used as an adsorbent (Erdol Aydın and Nasun Saygılı, 2020; Sezer and Esin, 2018). All chemicals listed in Table 1 were provided by Merck.
Equipment and chemicals used in the experiment.

Valex production from Turkish acorns (valonia) via spray drying
Figure 1 shows the flow diagram of the overall process for Valex production. The main stages of production consist of crushing-grinding, extraction, evaporation and spray drying. In the classical method of Valex production, the process begins with the breaking of acorns (Figure 2(a)), followed by reducing the grain sizes to 0.85–2 mm. The ground acorns (Figure 2(b)) are then pelletized in a beaker with one-third water and stirred at 90 °C for 8 h (Figure 2(c)).

Flowsheet of the production of Valex from valonia via spray dryer.

Valex production stages: acorns (a), grinded acorns (b), extraction and enrichment with water (c), evaporation (d), the mixture is fed spray dry (e), spray dryer (f), and valex (g).
Afterward, the solid phase is separated, and water along with fresh oak pellets are added. This gradual addition of ground solid and water facilitates the enrichment process. The enriched liquid phase undergoes centrifugation to remove impurities insoluble in water, followed by further concentration using a rotary evaporator at 90 °C (Figure 2(d)). The resulting solution is measured with a pH of 3.3 and a density of 1.12 g cm−3.
In the final stage, the concentrated solution (Figure 2(e)) is introduced to the spray dryer (Figure 2(f)) (Yamato ADL310) at 180 °C, completing the Valex production process (Figure 2(g)).
Preparation of tannin-based biosorbent (TA resin (TR))
An amount of 11.45 g of valex was weighed and 50 mL of 13.3 M NH3 solution was added and stirred. Then 65 mL of 37% formaldehyde solution was added. After mixing, centrifugation was performed prior to the addition of distilled water to the centrifuged precipitate and stirred in an Erlenmeyer flask. After mixing, 100 mL of 0.1 M nitric acid was added to the centrifuged precipitate and the solution was centrifuged again. The biosorbent from the centrifuge was placed in a suitable glass container. The biosorbent was left in an oven for drying and aging (80 °C). The resulting biosorbent was pounded in a mortar to reduce the particle size, then it was passed through a 75-micron-sized steel sieve and the obtained fraction was used in the experiments.
Preparation of boron solution
A boron stock solution was prepared by dissolving 571.9 mg of H3BO3 in 1 L of double-distilled water, resulting in a concentration of 100 mg L−1 boron. Experimental solutions at the desired concentrations were subsequently obtained through successive dilutions, with fresh dilutions prepared for each experiment. The pH of the boron solutions was adjusted using 0.1 M NaOH and HCl solutions.
Batch adsorption experiments
The adsorption process of the valonia-tannin-based biosorbent was investigated by batch experiments. The effects of adsorbent amount, initial boron concentration, contact time, pH, and temperature on the adsorption process were investigated. These parameters were studied at different intervals, for example, adsorbent amount (0.4–2 g corresponding to S/L ratio of 8–40 g/L), initial concentration (2–18 mg L−1), contact time (5–3600 min), solution pH (2.0–8.0), and temperature (298–333 K), and the optimum condition was defined for each parameter and proceeded.
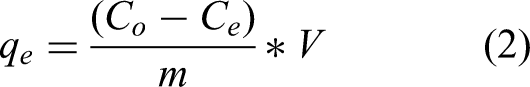
Batch experiments were conducted in 100 mL Erlenmeyer flasks containing 50 mL of different initial boron solution. A total of 50 mL boron solution was shaken with a certain amount of tannin-based biosorbent (TR) at 140 r/min for 24 h and then filtered (Sartorius Minisart 0.45 μm filter paper). The boron content in the initial solution and filtrate was measured by ICP-OES, ICAP 6500 DUO, and Thermo Electron. The impact of pH on boron adsorption was studied at a particular pH level (2.0–8.0) (Erdol Aydın and Nasun Saygılı, 2020; Sezer and Esin, 2018). The adsorption efficiency and adsorption capacity (qe) terms were calculated from the following equations (1) and (2):
Isotherm models
Adsorption isotherm models play a crucial role in determining the adsorption capacity of an adsorbent and help elucidate the mechanism of the sorption process. In this study, 50 mL of a boron solution with an initial concentration of 8 mg/L was agitated with varying amounts of a tannin-based biosorbent (TR) for 24 h using a shaker (Witeg-SHO-2D) at room temperature. The adsorbent was subsequently separated from the solutions using a Sartorius Minisart 0.45 μm filter paper, and the final boron concentration was determined. To investigate the appropriate model for the adsorption process, Langmuir, Freundlich, Temkin, and D–R adsorption isotherm equations were employed. The linearized forms of these four isotherm models are provided in Table 2 for further analysis.
Isotherm models for the current study.

The Langmuir constant, KL (mg L–1), delineates the binding site affinity, and RL serves as a metric for adsorption favorability. The Langmuir model proposes that, despite the surface areas being covered with adsorbate, there will be no decrease in the heat of adsorption (Kanmaz et al., 2023b; Xu and Jiang, 2008).
The Freundlich model introduces the parameters KF and 1/n, denoting the relative adsorption capacity and surface heterogeneity factor, respectively. It suggests a logarithmic decrease in the heat of adsorption as the adsorbent surface is covered (Afolabi et al., 2021; Kanmaz et al., 2023a).
Within the D–R isotherm model, the biosorption energy (E) is determined using the isotherm constant (Kad; mol2 J−2). An adsorption process is classified as physical when the energy is < 8 kJ mol–1 and as chemisorption when the energy values fall between 8.0 and 16.0 kJ mol–1. The D–R model is employed to determine that adsorption occurs on a heterogeneous sorbent surface through the Gaussian energy distribution mechanism (Kanmaz et al., 2023b; Turan et al., 2022; Wu et al., 2019).
The Temkin isotherm model postulates a linear reduction in adsorption heat as adsorbent active sites become occupied by the adsorbate. This model is indicative of a uniform distribution of binding energies associated with the adsorbate, and it assumes strong interactions between the adsorbate and adsorbent (Ipek et al., 2013; Saloglu and Sahin, 2021; Turan et al., 2022).
Kinetic models
The investigation of adsorption kinetics is crucial for assessing the time-dependent efficiency of the adsorption process and understanding the transport mechanism of adsorbate molecules to the adsorbent surface. In this study, the kinetic evaluation of the adsorption process involved agitating 1 g of adsorbent with 50 mL of an 8 mg L−1 boron solution at 140 r/min for durations ranging from 5 to 720 min. The results were analyzed using various kinetic models, including the pseudo-first-order, pseudo-second-order, Elovich's model, first-order kinetic model, second-order kinetic model, and the intraparticle diffusion equation. The details of these six model equations are presented in Table 3.
Kinetics models for the current study.

In the context of this study, qe and qt denote the adsorption capacity of the composites at equilibrium and at a given time t, respectively. The parameters kp1 and kp2 represent the rate constants for pseudo-first-order (min−1) and pseudo-second-order (mg·(g min)−1) adsorption, respectively. The coefficient “a” is associated with the rate constant of initial sorption (mg g−1 min), while “b” signifies the surface coverage of the sorbent (g mg−1). The equilibrium constant is denoted as “K,” where 1/b expresses the number of sorption sites and is related to the activation energy for chemisorption (mg g−1). Additionally, ‘kid’ stands for the intraparticle diffusion rate constant (mg g min−1/2).
Thermodynamic
The investigation into adsorption thermodynamics aims to provide insights into the energetic transformations associated with adsorption and the fundamental properties of the sorption process, such as whether it is endothermic or exothermic and whether it involves chemical absorption or physisorption. To comprehend the impact of temperature on the adsorption phenomenon, calculations of Gibbs free energy change (ΔG°), enthalpy change (ΔH°), and entropy change (ΔS°) are essential.
The thermodynamics of the adsorption process depends on total energy change (ΔH°), Gibbs free energy change (ΔG°), and entropy change (ΔS°). These parameters are calculated by the following equations (Kanmaz et al., 2023b; Malkoc and Nuhoglu, 2007):


Results and discussion
Characterization
Fourier transform infrared (FTIR)
Figure 3 illustrates the FTIR spectra of raw TA, TR, which is a tannin-based biosorbent, and boron-loaded TR (TR-B) within the wavelength range of 600–4000 cm−1. Across all spectra, the broad peak observed in the 3650–3000 cm−1 range corresponds to –OH stretching, with the distinctive presence of phenolic −OH groups inherent to TA. The characteristic peak at 1727 cm−1 is assigned to carboxyl-carbonyl groups in raw TA. Bands located between 1601 and 1449 cm−1 are associated with aromatic –C = C– bonds, while peaks at 1310 and 1039 cm−1 are indicative of phenolic groups in raw TA. Aromatic deformation of C–H bonds is discernible at 1176 cm−1. The bands at 1100–1010 cm−1 relate to C–O stretching and C–H deformations, and those near 900 and 700 cm−1 are assigned to the deformation vibrations of C–H bonds (Erdem et al., 2013; Özacar et al., 2006). Additionally, the deformation vibrations of C–H bonds within the benzene rings manifest as small absorption bands within the 900–550 cm−1 range (Kanmaz et al., 2023b; Ozcan and Saloglu, 2020; Turan et al., 2022).

FTIR spectra of TA, TR, and TR-B.
Moreover, the noticeable shift in the broadband from 3290 to 3175 cm−1 for TR in comparison to the raw TA spectrum suggests a distinct modification (Can et al., 2013; Erdem et al., 2013; Özacar et al., 2006). The alteration in the shape of this broadband, albeit subtle, is indicative of underlying changes in molecular interactions. Specifically, the reduction and shift of the peak at 1727–1666 cm−1, associated with carboxyl-carbonyl groups, reflect nuanced transformations. The concurrent decrease in intensities around 1727 and 1666 cm−1, related to −C = O and −C = C− vibrations, and their amalgamation around 1660 cm−1, point towards a nuanced restructuring. This intricate alteration is likely a consequence of the dynamic environmental shifts in C = O groups, arising from the intricate interplay between formaldehyde and TA, involving the –OH groups of TA and H of formaldehyde (Kanmaz et al., 2023a; Saloglu and Sahin, 2021). This intricate evolution serves as a compelling indicator of the triumph of the chemical synthesis process, affirming the successful amalgamation of raw TA and formaldehyde in the creation of TR.
Subsequent to the synthesis reaction, the peak at 1601 cm−1 undergoes a reduction and a shift to 1608 cm−1 (Can et al., 2013). The alteration in the intensity of the peak at 1449 cm−1 is attributed to the formation of –CH2– bridges (Erdem et al., 2013; Li et al., 2016a). Specifically, the band at 1449 cm−1 exhibits slight changes due to the formation of methylene bridges through the reaction with formaldehyde. Peaks within the range of 1320 to 1020 cm−1 undergo notable shifts and significant changes in the TR spectrum, indicating the formation of –C–O–C– linkages. Intensities of bands between 950 and 500 cm−1 also exhibit changes (Erdem et al., 2013). The appearance of a band at 1214 cm−1 is noteworthy after the aforementioned reaction, and the peaks around 1039 cm−1 undergo remarkable changes in shape within the TR spectrum, possibly attributable to the formation of –C–O–C– linkages. Furthermore, intensities of bands in the range of 900–550 cm−1 experience a complete reduction. According to the FTIR results, TR-B exhibits significant differences in bands compared to TR and raw TA. The bands within the 1700–1100 cm−1 range undergo substantial changes after boron adsorption, indicating reactions between phenolic groups and boron. This is ascribed to the distinctive affinity and intricate bonding formed between boron and specific phenolic groups incorporated into the resin surface of TR.
The broad band at 3175 cm−1 is associated with the presence of free hydroxyl groups in TR and the stretching vibrations of B–OH bonds. Within the 1500–1100 cm−1 region, distinct B–O stretching vibrations are observed, showcasing alterations in band intensities attributable to boron adsorption onto TR. Although the shapes of other bands in the fingerprint region remain largely unchanged, subtle shifts are noted. In the TR-B spectrum, small changes are observed in the 900–700 cm−1 region after boron adsorption, indicative of the formation of –O–B–O– bonds. Essentially, alterations in the TR-B spectrum between 900 and 700 cm−1 are attributed to the emergence of –O–B–O– bonds following boron adsorption (Erdem et al., 2013; Ozcan and Saloglu, 2020; Turan et al., 2022).
These spectral variations serve as compelling evidence of the intricate interactions among raw TA, TR, and boron within the TR-B system. The nuanced changes observed underscore the successful synthesis of TR and the effective management of the adsorption process. This corroborates the efficacy of TR as a viable biosorbent for boron removal, offering valuable insights into the dynamic chemical transformations occurring during the adsorption phenomenon.
X-ray diffraction (XRD)
The XRD patterns depicted in Figure 4 reveal distinctive features of TR and TR-B. In the XRD pattern of TR, two prominent peaks emerge at approximately 2θ 10° and 30°, indicative of a characteristic amorphous phase. Notably, no crystalline phase peaks are discernible, affirming the inherently amorphous nature of TR, consistent with prior studies (Elmorsi, 2015; Guleria et al., 2017; Li et al., 2016b; Zhang et al., 2015). The characteristic data points at 2θ 12.5° and 25° further underscore the amorphous attributes inherent in TA and aldehyde groups within TR.

XRD patterns of TR and TR-B.
TR and TR-B exhibit broad peaks indicating an amorphous structure (Huber et al., 2019, 2020). The amorphous structure exhibits peaks around 10°–15° and 20°–25° for boron (Ojha et al., 2018). Since the study was conducted at low boron concentrations, no crystalline structure is observed, and the minimal change in the amorphous structure before and after adsorption is attributed to the absence of crystalline structure.
Scanning electron microscopy (SEM)
Scanning electron micrographs presented in Figure 5(a) to (c) illustrate the morphological transformations of raw TA, TR, and TR-B. Raw TA exhibits polyhedral or polygon-shaped granules, characterized by a smooth surface devoid of pores and cracks (Figure 5(a)). Significant alterations are observed in the SEM analysis of TR, reflecting the impact of the synthesis process involving formaldehyde. The agglomerative structure of the TR sample highlights molecular changes resulting from the reaction. Figure 5(b) depicts the agglomerated surface of the crosslinked TA matrix after the addition of formaldehyde to produce TR. Micrographs of TR reveal a narrow and heterogeneous surface with a size distribution featuring open pores of ∼ 8–10 μm. The reduction in the number of polyhedral or polygon-shaped granules on TA post-synthesis with formaldehyde is attributed to interactions between the reactive groups of formaldehyde and tannin.
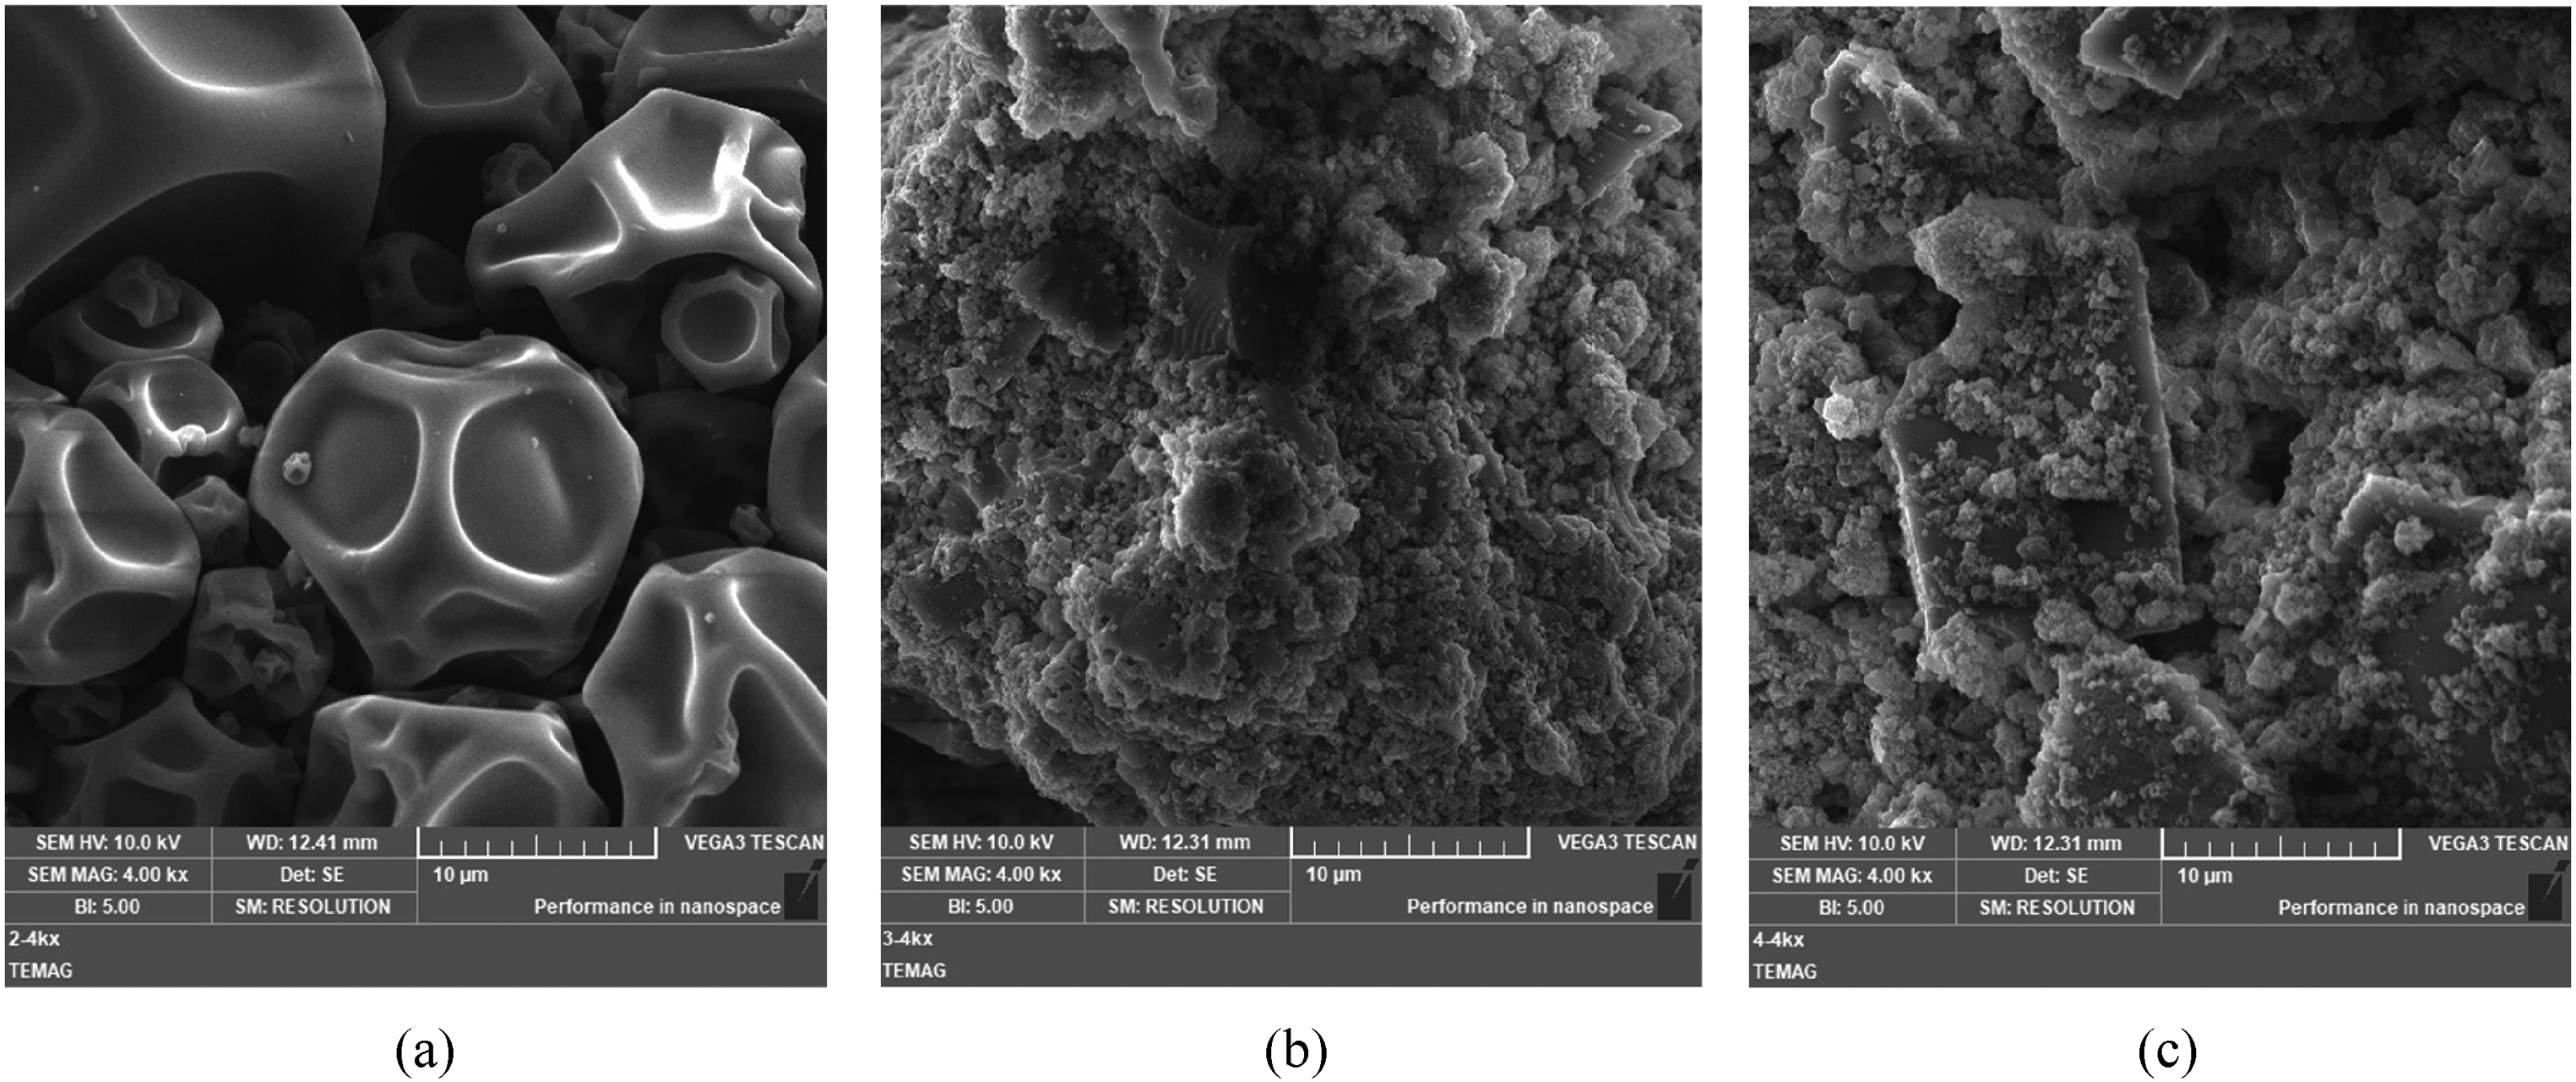
SEM images of TA (a), TR (b), and TR-B (c) (magnification: 4000 ×).
Following boron adsorption, a gradual decrease in the agglomerate radius is observed. The embedded boron is uniformly distributed on the treated TR surface (Figure 5(c)). In comparison to TR, numerous 2- to 4-μm-sized pores form, covering the entire surface and providing a uniform area. The reduction in agglomerate dimensions on the TR surface underscores the efficacy of boron adsorption. These observations affirm the successful synthesis of TR and the adsorption of boron, aligning with existing literature (Can et al., 2013; Khedri et al., 2022).
Subsequent to the adsorption process, the surface characteristics of TR undergo a notable transformation, evolving into an almost uniformly rugged texture. This alteration is linked to intensified interactions between boron and TR. The introduction of boron molecules onto TR-B, following adsorption, leads to a surface with increased roughness and homogeneity. The distinctive rough morphologies observed in TR-B are explicated by the elevated presence of boron molecules, fostering binding through enhanced electrostatic interactions and hydrogen bonding with TR molecules (Saloglu and Sahin, 2021).
Brunauer-Emmett-Teller (BET)
The BET analysis results provide valuable insights into the physical properties of the TR adsorbent. As shown in Table 4, the surface area was determined to be 3.5708 m²/g, indicating a high surface area for TR. This extensive surface area suggests that TR may possess numerous active adsorption sites, which could enhance its ability to effectively adsorb target components such as boron. Additionally, the pore volume of TR was measured at 0.0156 cm³/g, indicating the presence of voids within its structure that could serve as potential pores for adsorption. The pore size was determined to be 1680.32 nm, suggesting that the pores within the structure of TR are typically in the micro and/or mesopore range. This size may be suitable for the effective adsorption of target components.
Results of Brunauer-Emmett-Teller (BET) analysis.

Overall, these analysis results indicate that TR is an effective adsorbent with the potential to remove target components such as boron from solution. The large surface area and suitable pore structure of TR could enhance its adsorption capacity, making it applicable for various applications such as water purification or industrial waste management. Furthermore, as shown in Figure 6, the relative pressure-quantity adsorbed figure for the TR is presented.

Brunauer-Emmett-Teller (BET) analysis isotherm.
Adsorption experiments
Effect of pH
The solution pH. The adsorption process is significantly influenced by the solution pH, impacting both the surface charge of the adsorbent and the speciation of boron in the system. In our study, boron, at a concentration of 8 mg L−1, and 1 g of adsorbent were employed to investigate the adsorption behavior of the tannin-based biosorbent across varying pH levels (2–8), with the outcomes detailed in Table 5. The adsorption efficiency (%) and qe values were computed using equations (1) and (2).
Effect of pH on adsorption.
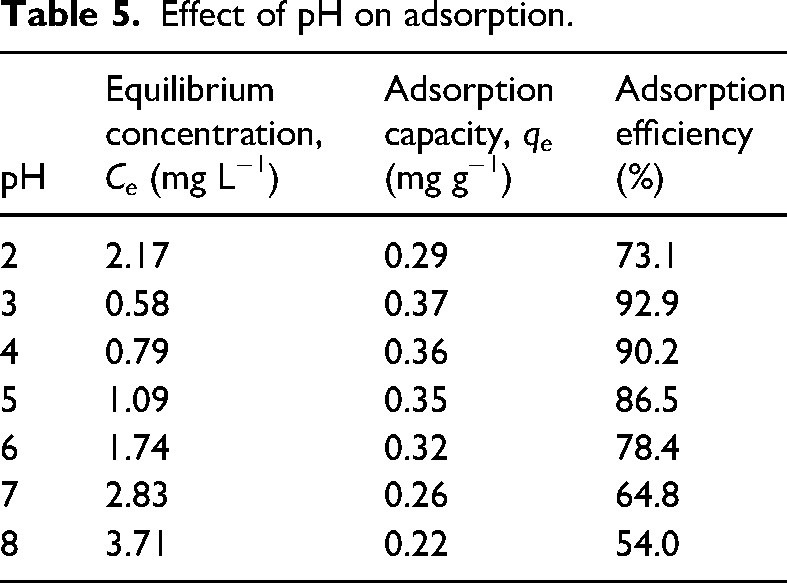
The adsorption of boron by the tannin-based biosorbent demonstrated heightened effectiveness within the pH range of 3–6. Notably, under both acidic and alkaline conditions, the adsorption capacity experienced a pronounced reduction. At pH levels less or equal to 3, boron predominantly existed in the solution as B(OH)3, a form with fewer active sites compared to B(OH)−4, while the alkaline nature of tannin resulted in dissolution. Conversely, at pH levels exceeding 6, intermolecular dehydration processes occurred within the adsorbent, leading to a reduction in phenolic hydroxyl groups and subsequently diminishing the adsorption capacity. Our findings underscore that the optimal pH value for efficient boron adsorption by TR is 3, indicating the predominant adsorption of boron in the form of B(OH)3 (Morisada et al., 2011).
Furthermore, it's important to note that the interplay between solution pH and the adsorption process is intricate, reflecting the dynamic nature of surface interactions and molecular speciation. These nuanced observations contribute to a comprehensive understanding of the pH-dependent adsorption behavior exhibited by the tannin-based biosorbent.
Due to the high concentration of OH− ions in the solution, especially at pH levels exceeding 5, the metal ions tend to precipitate, posing a significant challenge in the execution of successful adsorption tests under these circumstances (Liao et al., 2004). Consequently, when the initial pH deviates from the optimal range of 3 to 6, the adsorption capacity of the tannin-based biosorbent for boron experiences a notable decline (Cai et al., 2021; Liao et al., 2004; Zhang et al., 2022). This is attributed to the precipitation of metal ions, which hinders the effective interaction between the biosorbent and boron species. The intricate interplay between solution pH and metal ion behavior underscores the importance of maintaining an optimal pH range for achieving efficient adsorption of boron by the tannin-based biosorbent.
Effect of initial boron concentration
After selecting the best pH value of 3, the pH was kept constant at 3 for each initial boron concentration value. Besides, the amount of adsorbent was taken as 1 g. As shown in Table 6, adsorption efficiency values were calculated for the indicated initial boron concentrations. These values were calculated using equations (1) and (2).
Effect of initial boron concentration on adsorption.

The adsorption efficiency increased as the initial born concentration increased from 1 to 8 mg L−1. Because when the initial concentration is low, there are too many active sites on the adsorbent surface that are not being used. At an initial boron concentration of 8 mg L−1 and above, the adsorption efficiency decreases slowly. Because boron adsorption was at maximum capacity and all adsorbent active sites were covered with boron. The best boron concentration in the experiment was found to be 8 mg L−1.
Effect of adsorbent amount
The highest adsorption efficiency was found at pH 3 and 8 mg L−1 initial boron concentration. The amount of adsorbent was changed by keeping these parameters constant. As shown in Table 7, adsorption yield values were found for the adsorbent amounts indicated. These values were calculated with the help of equations (1) and (2).
Effect of adsorbent amount on adsorption.

The increase of the active sites on the surface with the increase in the amount of adsorbent causes more boron to be adsorbed. Although the highest adsorption efficiency was obtained in the amount of 2 g adsorbent, 1 g adsorbent was used as the best parameter in the experiments. Because with a 1 g change in the amount of adsorbent adsorption efficiency changed by 1.8%. When considered on an industrial scale, more adsorbents will be required to slightly increase the percentage of adsorption. Therefore, subsequent experiments were continued with 1 g.
Adsorption isotherms
To elucidate the adsorption isotherms, 50 mL of an 8 mg L−1 boron solution underwent agitation at 140 r/min and 298 K, with the addition of 1 g of a tannin-based biosorbent. The resultant data were subjected to analysis using Langmuir, Freundlich, Temkin, and D–R isotherm models. The outcomes derived from these isotherm models are presented in Table 8. Upon comparison of the correlation coefficients (R2) associated with the adsorbent, it was discerned that the Temkin isotherm model proved to be the most fitting model for describing boron adsorption.
Isotherm parameters of boron adsorption on tannin-based biosorbent.

Langmuir isotherm model
The Langmuir isotherm characterizes surface coverage by balancing the rates of adsorption. This model relies on the count of active sites available on the adsorbent, presuming monolayer coverage. The dimensionless separation factor (RL) is computed using equation (6) to assess adsorption efficiency, with favorability indicated by an RL value between 0 and 1.
Considering the congruence of R2, RL, and KL values, the Langmuir model emerged as a robust descriptor for elucidating boron adsorption behavior, thereby affirming the homogeneity of the TR surface. The underlying tenet of the Langmuir isotherm model implied that each active site on the TR engaged exclusively with a solitary boron molecule. Adsorption transpired at well-defined localized sites on the TR, achieving saturation coverage indicative of complete occupancy. Importantly, these adsorption sites on the TR demonstrated energetic homogeneity, with no observable interaction discernible between adjacent boron molecules (Chung et al., 2015; Ozcan and Saloglu, 2020). This comprehensive analysis attests to the efficacy of the Langmuir isotherm model in characterizing the intricate adsorption dynamics between boron and TR.
Freundlich isotherm model
The Freundlich isotherm model, utilized for non-ideal reversible adsorption processes, offers valuable insights into the dynamics of multilayer adsorption characterized by a non-uniform distribution of heat on a heterogeneous surface. This model is especially apt for systems exhibiting diverse surface characteristics. Table 2 reveals the parameters KF and 1/n, denoting the relative adsorption capacity and surface heterogeneity factor, respectively. The 1/n value signifies favorable adsorption (1/n < 1.0), challenging adsorption (0.5 < 1/n < 1.0), or unfavorable adsorption (1/n > 1.0) (Chung et al., 2015; Turan et al., 2022).
In our study, the calculated values for KF and 1/n were 0.479 mg g–1 and 0.819, respectively. Notably, the 1/n values for boron adsorption onto TR were below 1.0, aligning with previous research indicating favorable adsorption when 1/n exceeds 1.0 for all adsorbents (Saloglu and Sahin, 2021). The observed 1/n value in our study fell within the range of 1.0–10.0, indicative of favorable adsorption.
The calculated n value (1.22) further substantiates the favorability of the adsorption process, aligning with established criteria. The high R2 value of 0.899, surpassing that of the Langmuir isotherm model, indicates the heterogeneous nature of the adsorption process. The Freundlich model, therefore, proves effective in elucidating the adsorption dynamics of boron using TR.
D–R isotherm model
The D–R isotherm. The D–R isotherm provides insights into the adsorption mechanism involving a Gaussian energy distribution on heterogeneous adsorbent surfaces. The model is based on the pore-filling mechanism, where the behavior is attributed to Van der Waals bonds and physical adsorption (Çalık, 2002; Demirtaş, 2005; Ozcan and Saloglu, 2020).
Within the D–R isotherm model, the biosorption energy (E) is determined using the isotherm constant (Kad; mol2 J−2). An adsorption process is classified as physical when the energy is < 8 kJ mol–1 and as chemisorption when the energy values fall between 8.0 and 16.0 kJ mol–1. In our investigation, with K = 0.191, the calculated E value was found to be 5.25 kJ mol−1. This mean biosorption energy aligns with the physical adsorption mechanism characterizing the boron adsorption onto TR. The calculated R2 values, standing at 0.873, signify a substantial fit of the model to the experimental data.
Temkin isotherm model
The Temkin isotherm model postulates a linear reduction in adsorption heat as adsorbent active sites become occupied by the adsorbate. This model is indicative of a uniform distribution of binding energies associated with the adsorbate, and it assumes strong interactions between the adsorbate and adsorbent (Saloglu and Sahin, 2021). AT (L g−1) is Temkin isotherm model constant AT (L g−1), b T (J mol–1) is Temkin equilibrium constant, R (8.314 J mol–1 K–1) is the universal gas constant and T (K) is the temperature (Dada et al., 2012; Malkoc and Nuhoglu, 2007; Ozcan and Saloglu, 2020). AT value was determined to be 4.361 L g–1 and the bT value was found as 7.2 kJ mol–1. Considering the R2 values, it was deduced that the Temkin model adeptly captured the equilibrium data. The elevated R2 values indicated a diminishing heat of adsorption for boron molecules in a layer as the interaction with TR-B progressed and surface coverage increased.
Adsorption kinetics
To comprehend the temporal dynamics of adsorption processes and unravel their underlying control mechanisms, we employed various kinetic models in our experimental investigation. The methodology involved shaking conical flasks, each containing 50 mL of an 8 mg L−1 boron solution with 1 g of the biosorbent, over distinct time intervals ranging from 5 to 720 min. We systematically applied well-established kinetic models, including the pseudo-first-order, pseudo-second-order, Elovich, first-order kinetic, second-order kinetic models, and the intraparticle diffusion equation, as outlined in Table 3.
Each of these models was scrutinized to extract valuable kinetic parameters, and the results are presented in Table 9. Intriguingly, our analysis revealed that among the models, the pseudo-second-order model exhibited the highest correlation coefficient (R2 = 0.9997). This outstanding correlation coefficient underscores the model's exceptional fit to the experimental data and strongly suggests that the boron adsorption process is predominantly governed by chemisorption (Turan et al., 2022).
Kinetic parameters obtained from time effect on boron adsorption.

This insight into the kinetics of boron adsorption not only enhances our understanding of the temporal aspects of the process but also lays a foundation for optimizing adsorption conditions for practical applications.
Adsorption thermodynamics
In assessing the thermodynamic viability of boron adsorption, we delved into crucial thermodynamic parameters, namely Gibbs free energy (ΔG°), enthalpy change (ΔH°), and entropy change (ΔS°). The calculation of these parameters, as outlined in Table 10, was executed using equations (3) to (5) (Dodson et al., 2015; Fomina and Gadd, 2014; Kanmaz et al., 2023b; Worch, 2012).
Thermodynamic parameters for boron adsorption onto a tannin-based biosorbent.

By evaluating these parameters, the value of ΔGo indicates whether adsorption is spontaneous, the value of ΔHo indicates whether adsorption is exothermic or endothermic, value of ΔS° indicates the relationship between solid–liquid interface (Kanmaz et al., 2023a, 2023b; Melliti et al., 2020; Morisada et al., 2011). Values of Kc and ΔG°were calculated with the help of equations (3) and (5), respectively. With the help of equation (4), the plot of lnKc versus T−1 gives ΔH° and ΔS° values (Figure 7).

Lnkc versus T−1 plot.
A positive enthalpy (ΔH°) indicates that the adsorption process is endothermic. The positive entropy (ΔS°) indicates that the irregularity increases in the solid–liquid interface. The negative Gibbs free energy value indicates that adsorption happens spontaneously (Bhattacharyya and Gupta, 2006; Liu, 2009; Melliti et al., 2020).
The consistent negativity of ΔG° values at various temperatures underscores the inherent spontaneity characterizing the adsorption process of boron onto the tannin resin. Notably, the decline in the standard free energy alteration with rising temperatures, regardless of the adsorbent's nature, indicates an augmented efficiency in boron adsorption at elevated temperatures. It's worth highlighting that the ΔG° values, falling within the multilayer adsorption range (both above −20 kJ mol−1 and below zero), emphasize the propensity for multilayer adsorption (Bekci et al., 2006; Serpen et al., 2007).
The positive value of ΔH° points to the endothermic nature of the adsorption, suggesting an energy-absorbing process. Additionally, the positive ΔS° value implies an increased disorder at the solid/solution interface during the adsorption process. This indicates that boron ions replace water molecules previously adsorbed on the adsorbent surface, with the displaced molecules gaining more translational entropy than lost by the adsorbate ions. This intricate interplay contributes to a system favoring heightened randomness (Bekci et al., 2006; Malkoc and Nuhoglu, 2007).
Intriguingly, the spontaneous nature of boron adsorption, as indicated by the negative ΔG◦ values, highlights the feasibility of this process. The observed temperature dependency in ΔG° values suggests the importance of considering temperature in optimizing boron adsorption efficiency.
Conclusion
In this investigation, a novel tannin-based biosorbent, referred to as TR, was successfully synthesized from Turkish acorns (valonia) using the spray-drying method. The resulting Valex, produced through spray drying, underwent modifications to transform into a TR-based structure, rendering it suitable for biosorption. The experiments revealed a notable maximum removal efficiency of 92.9% under optimized conditions: pH 3, an initial boron concentration of 8 mg L−1, 1 g of adsorbent, a temperature of 25 °C, and a duration of 24 h.
These findings emphasize the effectiveness of the tannin-based biosorbent, TR, in boron removal applications. Particularly noteworthy is the agreement of boron adsorption on the tannin-based biosorbent with the Temkin isotherm and pseudo-second-order kinetic models. The negative ΔG° values across all temperatures affirm the spontaneous nature of boron adsorption on the tannin resin. Furthermore, the positive ΔH° value indicates the thermodynamically endothermic character of the adsorption process.
This study demonstrates the efficacy of TR, derived from Turkish acorns, as a promising biosorbent for boron removal. The optimized conditions yielded a significant removal efficiency, highlighting its practical potential for environmental remediation. However, further research is warranted to explore the scalability and long-term effectiveness of this biosorbent in real-world applications. Limitations include the need for more extensive testing under varying conditions and the consideration of potential economic and ecological implications of large-scale deployment.
Footnotes
Acknowledgements
This work was supported by the Istanbul Technical University (ITU) Scientific Research Projects Unit [Grant # MGA-2018-41675].
Data availability
All raw data used to support the findings of this study are available from the corresponding author upon request.
Declaration of conflicting interests
The author(s) declared no potential conflicts of interest with respect to the research, authorship, and/or publication of this article.
Funding
The author(s) disclosed receipt of the following financial support for the research, authorship, and/or publication of this article: This work was supported by the Bilimsel Araştırma Projeleri Birimi, İstanbul Teknik Üniversitesi (grant number 41675).