
Abstract
Quaternized kenaf core fiber (QKCF) was used as an adsorbent for adsorption of anionic Acid Blue-25 (AB) and anionic Acid Green-25 (AG) dyes. Chemical treatment with (3-chloro-2-hydroxypropyl) trimethylammonium chloride under basic condition was applied in order to alter the surface properties of the raw kenaf core fiber. Adsorption studies were carried out to delineate the effect of initial dye concentration, temperature and pH on removal of dyes. The results show that the percentage removal of Acid Blue-25 and Acid Green-25 dyes were increased by increasing the concentrations of dyes. In addition, the maximum percentage removal was 99.8% and 99.65% for Acid Blue-25 and Acid Green-25, respectively. Langmuir, Freundlich and Temkin isotherm models were applied to analyze the data for dye adsorption at 15℃, 25℃, 35℃, and 45℃. The experimental data were best represented by the Langmuir model with maximum adsorption capacity of 303.03 mg/g and 344.83 mg/g for Acid Blue-25 and Acid Green-25 dyes, respectively, at 15℃, and the kinetic data for both dyes were best represented by the pseudo-second-order kinetic model. Thermodynamic studies indicated that the reactions of Acid Blue-25 and Acid Green-25 dyes were endothermic. It was concluded that QKCF adsorbent can be utilized as an efficient low-cost adsorbent for removal of anionic dyes.
Introduction
Stream pollution by effluent from textiles industries is regarded as one of the most common problems in the world. Furthermore, effluents from these industries comprise various types of artificial dyes (Saravanan et al., 2014). Increasing levels of dyes pollutants in the environment cause a dangerous menace to the environment and public health. To deal with this problem, industrial effluents must be treated prior to discharging (Gupta et al., 2012; Rahman, 2016; Saravanan et al., 2015). Several studies have been concentrated on the adsorption of this pollutant because adsorption process can remove/decrease different kinds of pollutants and so it has a wide use in water treatment plant (Hamdaoui, 2006).
Various adsorbents have been attempted to remove various types of synthetic dyes (Mittala et al., 2009, 2010; Saleh and Gupta, 2012). In wastewater treatment plant, coal-based activated carbon is a widely used adsorbent to remove many types of dyes, but it is very expensive and requires high energy for the activation method (Gupta et al., 2011, 2013; Gupta and Saleh, 2013).
On the other hand, there is an enormous amount of agricultural residues produced every year. Disposal of these agricultural residues is a secondary environmental pollution. This increases the researchers' interest to produce porous adsorbent that can be derived from an agricultural origin for removing different types of dyes from industrial effluents. Following this the cellulose-based layer of plants are used in the elimination of various types of pollutants from wastewater. Agricultural biomass are not only plenty, but also cheap and renewable natural material (Gupta et al., 2015; Vismara et al., 2009).
Generally, sorption capacity of natural agricultural by-products is low towards some types of pollutants. Therefore, agricultural by-products are chemically modified to enhance their sorption ability and thus they are useful in the treatment of wastewater (Gupta and Nayak, 2012; Makeswari et al., 2016).
Cationization or quaternization is a chemical treatment which helps to add NH4+ groups onto the surface of fiber via replacing epoxy to alter the surface properties and increase the surface area to form more active sites to capture anionic dyes from aqueous solution (Wartelle and Marshall, 2006).
The utilization of quaternized kenaf core fiber (QKCF) to adsorb acid dyes has not been reported elsewhere. Thus, the present research aims to explore the suitability of QKCF to serve as an adsorbent for removal anionic acid dyes from synthetic wastewater. Kenaf, a member of the hibiscus family (Hibiscus cannabinus), is widely cultivated in many tropical countries for its fiber. Kenaf fiber is a natural cellulosic fiber derived from the plant and it is an important raw material for a variety of products. Kenaf ranks third in biomass production and has a fast growth rate where it requires less than six months to attaining a suitable size for practical application (Irmak and Ozturk, 2010).
This research targets to evaluate the adsorption of Acid Blue-25 (AB) and Acid Green-25 (AG) dyes onto QKCF by isotherm studies, and kinetics studies. In addition, it determines the thermodynamic parameters for the sorption process.
Experimental
Preparation of QKCF
KCF coarse powder was first washed thoroughly to get rid of dust and undesirable particles. The collected sample of KCF was rinsed with distilled water and dried in an oven for 24 h at 50℃ to remove all the moisture. The dried KCF coarse powder was sieved using 0.25 mm and 1 mm stainless steel sieves to get particles with different size ranging from 0.25 mm to 1 mm.
A specific amount of KCF (30 g) was mercerized by soaking it in a solution of 20 wt% NaOH (62.5 g NaOH dissolved in 250 mL distilled water) for 24 h. The basic medium made the walls of the fibers to swell and opened the pores to improve the absorbency of KCF. Mercerized KCF (MKCF) was washed with distilled water and dried in an oven at 50℃ for 24 h.
The quaternization was accomplished by reacting each gram of dried MKCF with a solution consisting of 1.5 g of NaOH, 6.67 mL of (3-chloro-2-hydroxypropyl) trimethylammonium chloride (CHPTAC) solution (60 wt% in water) and 2.5 mL of distilled water. The mixture was well-kept in a closed container at room temperature for 24 h. Then, the QKCF was washed with 0.1% acetic acid solution to halt the reaction and rinsed with distilled water until the neutral condition was attained. The QKCF was dried at 50℃ for 24 h and kept in a closed container prior to use.
QKCF characterizations
A scanning electron microscope (SEM) (Hitachi Model S-3400N, Japan) was used to study morphology and fundamental physical properties of the adsorbent surface of QKCF. Samples were prior plated with a fluffy layer of gold. The SEM apparatus was operated at 15 kV, and scanning electron photographs were recorded at a magnification of 100 µm.
Infrared (IR) spectra were registered on Fourier Transform-Infrared (FTIR) Spectrometer (Spectrum-100, PerkinElmer, UK). All spectra were plotted as the percentage of transmittance against wave number (cm−1) at a range of 650–4000 cm−1 at room temperature. FTIR spectrum was used in this study to identify the characteristic functional groups in QKCF. Hence, the presence of quaternary amine group in the spectra represents the successful quaternization treatment.
Surface area, pore volume and pore diameter of the prepared adsorbent were measured by Micromeritics 3Flex Instrument. Nitrogen sorption isotherms were measured at 77 K with a Micromeritics Instrument Corporation model 3Flex surface characterization analyzer. The Brunauer–Emmett–Teller (BET) method was utilized to calculate the specific surface areas.
Preparation of dye solution
AB and AG dyes were utilized as adsorbates in the present study. The structures of these two dyes and the general properties of selected acid dyes are presented in Figure 1 and Table 1, respectively. Stock solutions of 1000 mg/L of dyes were prepared respectively by dissolving 1.00 g of dye in 1 L of distilled water. The experimental solutions were prepared by diluting a definite volume of the stock solution to get the desired concentration.
Molecular structure of (a) Acid Blue-25 and (b) Acid Green-25 dyes. General properties of Acid Blue-25 and Acid Green-25 dyes.
For absorbance measurements, a spectrophotometer UV-1800 (SHMADZU) was employed. The maximum wavelength λmax for the AB and AG were measured at 602 nm and 641 nm, respectively. The concentrations during experimental work were determined from standard calibration curves. The dye solution was filtered through filter paper to separate the adsorbent before performing the UV spectrophotometric analysis. The amount of adsorbate adsorbed at equilibrium condition, qe (mg/g), was calculated by using equation (1) and the percentage of dye removal was calculated from equation (2)


Equilibrium adsorption studies
Batch adsorption system was dependent on the completion of all experimental studies. The 250 mL Erlenmeyer flasks were used, the volume of dye was 100 mL, and the dosage of QKCF used was 0.1 g. All flasks were sealed properly using aluminum foil to prevent leakage and evaporation. The incubator shaker was set at 200 r/min agitation speed for 3 h at 25℃ temperature.
The effect of the initial dye concentration was investigated by varying the initial dye concentration from 10 mg/L to 200 mg/L and by keeping the other parameters constant.
The effect of pH on the AB and AG dyes removal by QKCF was investigated by varying the pH of the dye solution from 2 to 10, keeping the other parameters like dye concentration, adsorbent dose, volume of solution, agitation speed, and temperature constant.
To study the effect of temperature, four different temperatures (15℃, 25℃, 35℃ and 45℃) were applied to observe the influence of temperature on the percentage removal of different concentration of dyes.
Isotherm studies
Adsorption isotherm for a single-component solution was studied by varying the adsorbent dosage of QKCF from 0.05 to 0.16 g/100 mL and keeping the initial dye concentrations at 100 mg/L. The incubator shaker was set at 200 r/min agitation time for 24 h. Each experiment was carried out at four different temperatures (15℃, 25℃, 35℃ and 45℃).
Adsorption kinetics studies
In the adsorption kinetics experiment, a 0.1 g of the QKCF was added to 100 mL of a dye solution with an initial concentration of 20–100 mg/L. The samples were withdrawn at growing time periods ranging from 15 min to 180 min.
Results and discussion
Characterization of adsorbent
SEM is a primary tool for characterizing the surface morphology and fundamental physical properties of the adsorbent surface. The textural structure of natural KCF (NKCF) and QKCF were observed by SEM images shown in Figure 2. As observed from SEM micrographs of Figure 2(a), the surface texture of the lignocellulosic NKCF is comparatively rough. Uneven surface with some minor pores are observed on its surface as well. The pores observed on the surfaces of the QKCF (Figure 2(b)) are clear with distinct pore walls. They are organized in a group of honeycombed structures. Moreover, the presence of these open cylindrical and heterogeneous pores presents good sites for dyes to be trapped and adsorbed on QKCF surface (Zaini and Khairul, 2014).
SEM images of (a) NKCF and (b) QKCF.
The FTIR spectra of NKCF and QKCF are shown in Figure 3. As it can be observed from Figure 3, the trend of the FTIR spectrum for NKCF contains some main peaks which are almost similar to many lignocellulosic plants. From 3843 to 3263 cm−1 indicate O–H stretching vibration and C–H stretching at 2878 cm−1 and 2341 cm−1, respectively. From the spectrum, the peaks at 1783 cm−1, 1654 cm−1 and 1592 cm−1 on QKCF can be assigned to aromatic C=C stretch (Pavia et al., 2009). Furthermore, peaks at 1474 cm−1 and 1419 cm−1 with nearly equal intensity assigned to C–H stretching of tert-butyl group is an evidence of the reaction between quaternary ammonia group and QKCF. C–O stretch mode in C–O–C cellulose linkage appeared at 1059 cm−1 and 1062 cm−1 for NKCF and QKCF, respectively. The bands of QKCF and NKCF at 787 cm−1 to 706 cm−1 are assigned to CH2 rocking.
FTIR spectra for NKCF and QKCF.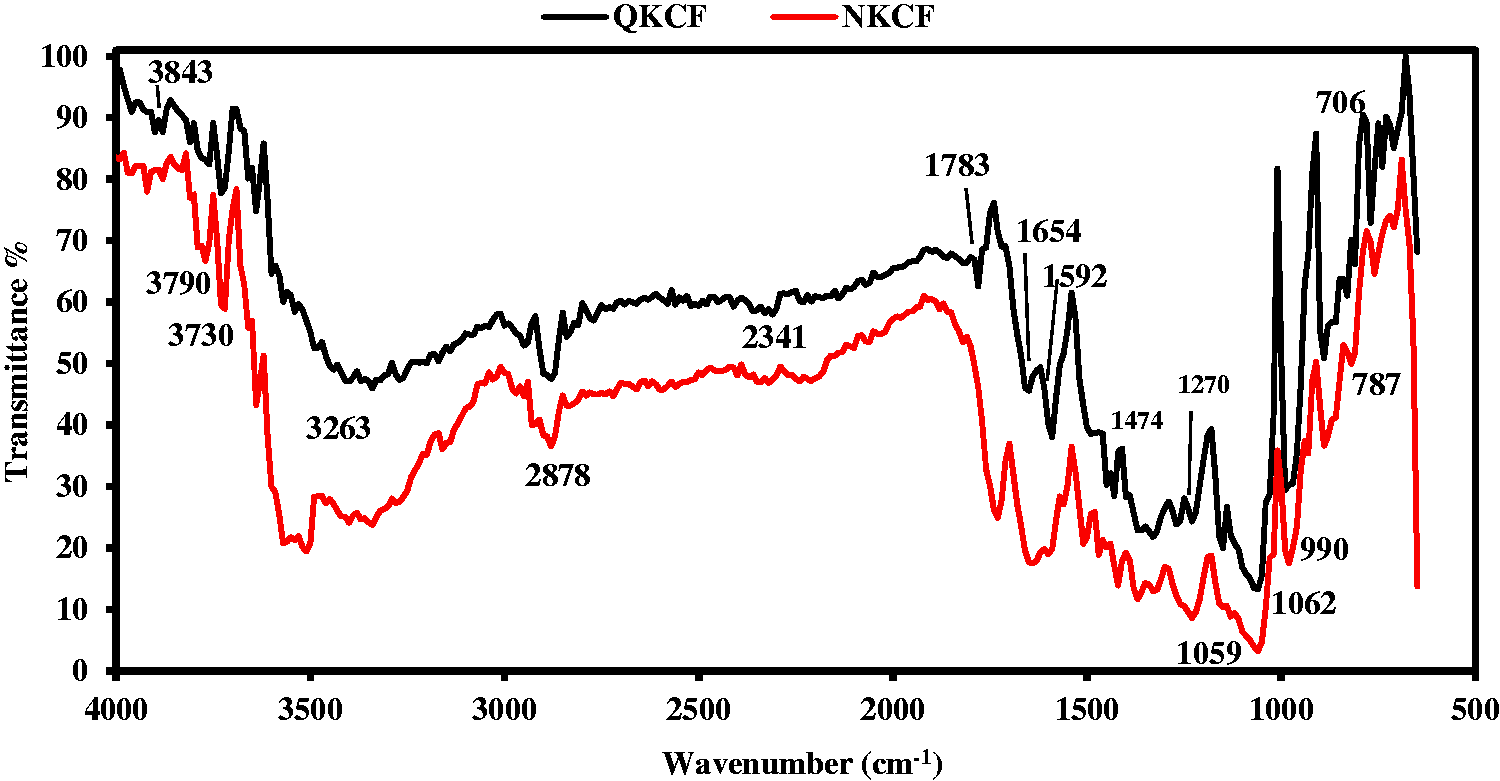
The surface area and average pore diameter of the prepared adsorbents were analyzed by BET analysis. This analysis showed that the surface area (SBET) was increased from 2 m2/g for NKCF to 4 m2/g for QKCF. The average pore diameter of NKCF is 106 nm which is said to be macropores, and QKCF has an average pore diameter of 283 nm. Enlargement of the pore size is due to the dissolved lignin and hemicellulose in NaOH solution during the treatment process. In addition, pore volume is slightly decreased from 0.1699 cm3/g for NKCF to 0.1128 cm3/g for QKCF. It is attributed to the smoother texture of KCF surface after quaternization process.
Equilibrium adsorption studies
Effect of initial dye concentration
The percentage removal of dye is widely dependent on the initial dye concentration. The impact of the initial dye concentration factor depends on the immediate relation between the concentration of the dye and the available binding sites on an adsorbent surface. Figure 4(a) and (b) illustrates the percentage removal and the adsorption uptake of AB and AG anionic dyes, respectively, versus the initial dye concentrations (10–200 mg/L) onto QKCF at 25℃. It is clear that the percentage removal increased from 99.0% to 99.8% and from 98.1% to 99.65% for AB and AG dyes, respectively, as the initial dye concentration increased from 10 mg/L to 200 mg/L. The increase in initial dye concentration enhances the interaction between dye and adsorbent (Shakir et al., 2010). In another word, increase in the initial dye concentrations increase the driving force to overcome the resistance of the mass transfer of dye between the solution and the adsorbent surface (Safa and Bhatti, 2011). Furthermore, it can be seen that with an increase of dye concentration from 10 to 200 mg/L, the adsorption capacity increases from 9.9 to 199.6 mg/g and from 9.8 to 199.3 mg/g for AB and AG dyes, respectively. This is due to the higher adsorption rate and utilization of all active sites available for the adsorption at higher concentration.
Effect of initial dye concentration on the percentage removal and the amount of adsorbed (a) AB dye and (b) AG dye (dose = 0.1 g/100 mL, Temp. = 25℃, speed = 200 r/min).
Effect of pH
pH is an important parameter in the absorption process and it affected the absorption capacity, dye solubility (Iscen et al., 2007), solution chemistry and the surface of the absorbent pore (Osma et al., 2007). The relation between the initial pH of the solution and the percentage removal of AB and AG anionic dyes are shown in Figure 5. The dye removal is not significantly affected by pH over the whole range explored and the removal percentage for both dyes was steady around 99%. Hameed and Ahmad (2009) reported similar results for the adsorption of methylene blue (MB) onto garlic peel; this behavior attributed to the availability of a senior number of effective sites on the adsorbent surface and related the solute (dye) uptake to the active sites and as well to the chemistry from the solute in the solution.
Effect of different pH on the removal of AB and AG dyes by QKCF adsorbent. (Dose = 0.1 g/100 mL, Co = 100 mg/L, Temp. = 25℃, speed = 200 r/min).
Effect of temperature
Figure 6(a) and (b) shows the effect of temperature on the sorption of AB and AG dyes by QKCF, respectively. It can be observed from the graphs that the percentage removal of both dyes for all initial dye concentrations increased by increasing the adsorption temperature from 15℃ to 45℃. The increment of adsorption may be due to the increased rate of diffusion of the adsorbate molecules across the surface boundary layer and due to the presence of internal pores in the adsorbent particles. An increased number of molecules may obtain sufficient energy to succumb an interaction with active sites at the surface (Özdemir et al., 2006).
Effect of different temperature on the removal of (a) AB dye and (b) AG dye by QKCF adsorbent (dose = 0.1 g/100 mL, speed = 200 r/min, time = 2 h).
Equilibrium isotherm studies
Adsorption isotherms are major design requirements for any adsorption system. Isotherm expresses the relation between the quantities of adsorbate (mg) removed from the liquid phase by a unit mass of adsorbent (g) at the constant temperature. The most commonly used isotherm models for dye adsorption are the Langmuir, Freundlich, and Temkin isotherms. The applicability of the isotherm equations was compared by referring to the correlation coefficient, R2 (Demirbas and Nas, 2009).
The Langmuir isotherm model deals with a monolayer maximum adsorption capacity of the adsorbent. This means that each site can take in only one molecule and it assumes constant adsorption energy for all the active binding sites present on the adsorbent. In addition, the adsorbed molecules cannot move across the surface or react with neighboring molecules (Bansode, 2002). Langmuir model is expressed by equation (3) (Weber, 1972)

The linearized form of the Langmuir isotherm can be given by equation (4) (Malik, 2004)

The fundamental characteristics of the Langmuir isotherm have been given by the expression separation factor or equilibrium constant RL, which is defined by equation (5) as follows


The Freundlich isotherm is the closer relationship that depicts the sorption equation derived empirically in 1912. Freundlich model is typically used when the surface of the adsorbent is heterogeneous; Freundlich isotherm is expressed by equation (6) (Metcalf and Eddy, 2003)


A plot of log qe versus log Ce results in a straight line with a slope of (1/n) and an intercept (log KF).
Temkin isotherm is one of the earliest reported isotherms and assumes the heat of adsorption decreases linearly with increasing coverage due to the interactions between adsorbate and adsorbent. The Temkin isotherm has been generally applied in the form as shown in equation (8) (Temkin and Pyzhev, 1939)

Equation (8) can be linearized as

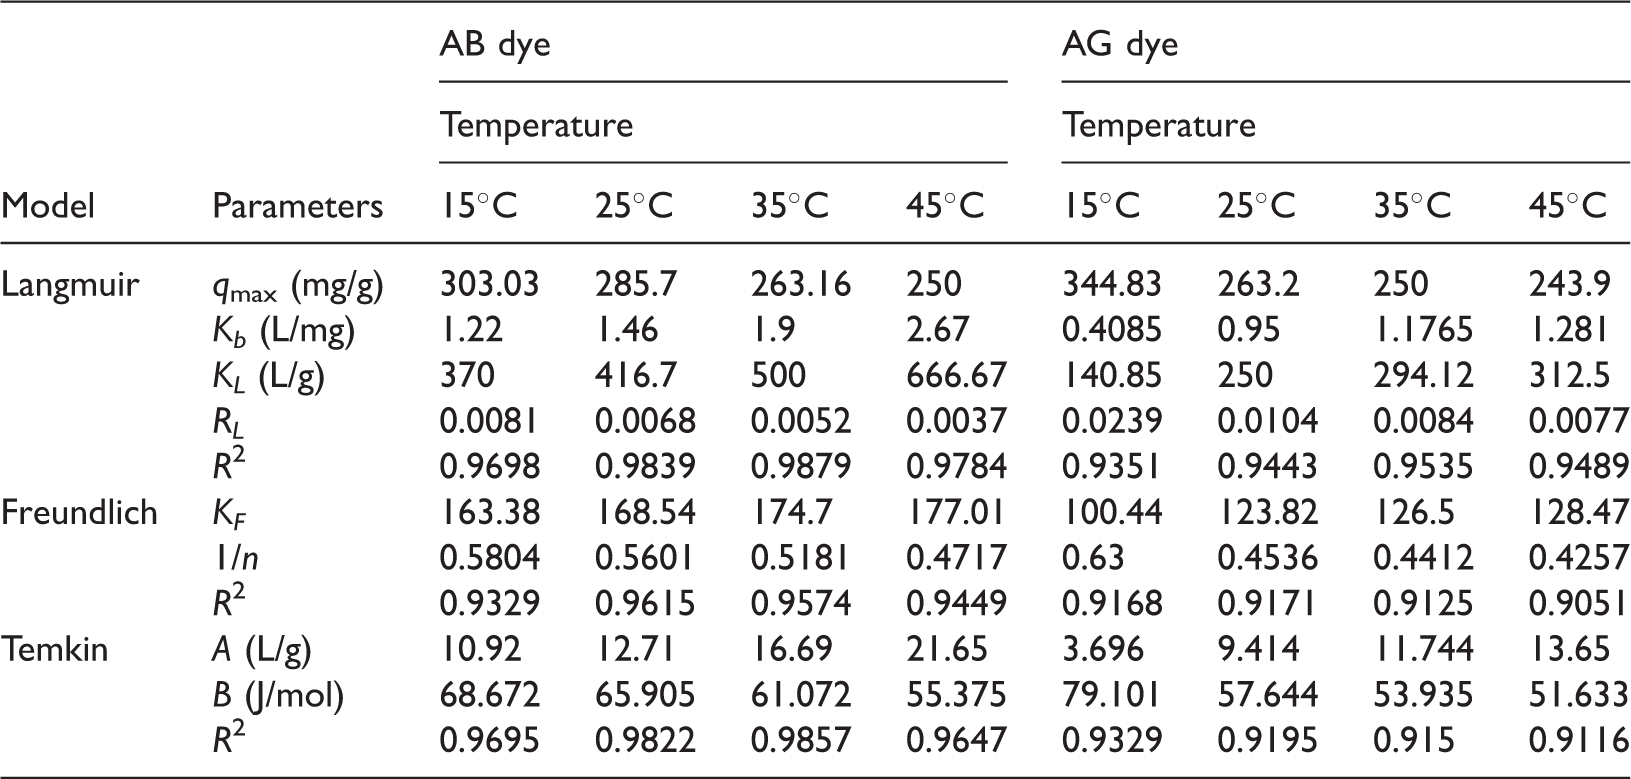
Langmuir, Freundlich and Temkin isotherm constants for adsorption of AB dye and AG dye on QKCF at different temperature.
Comparison of maximum sorption capacity (mg/g) of AB and AG days onto different adsorbents.

Adsorption kinetics studies
The kinetic adsorption studies predict the progress of dyes adsorption during the adsorption to reach the equilibrium. In addition, the estimate of the adsorption mechanism is important for design purposes. To analyze the adsorption mechanism of the anionic dyes on the QKCF, pseudo-first order, pseudo-second order, and intra-particle diffusion models were used.
The linear form of the pseudo-first-order model for adsorption of dyes from aqueous solution is described in equation (10) (Azizian, 2004)

Here qe and qt denote the amount of adsorbed (mg/g) at equilibrium and at any time t, K1 is the first-order rate constant (min−1), the values of constant K1 and theoretical (qcal) for AB and AG dyes were obtained from the slope and intercept of plots log(qe − qt) versus time (t) as shown in Figure 7(a) and (b).
Pseudo-first-order kinetic model for adsorption (a) AB dye and (b) AG dye onto QKCF (dose = 0.1 g/100 mL, speed = 200 r/min, Temp. = 25℃).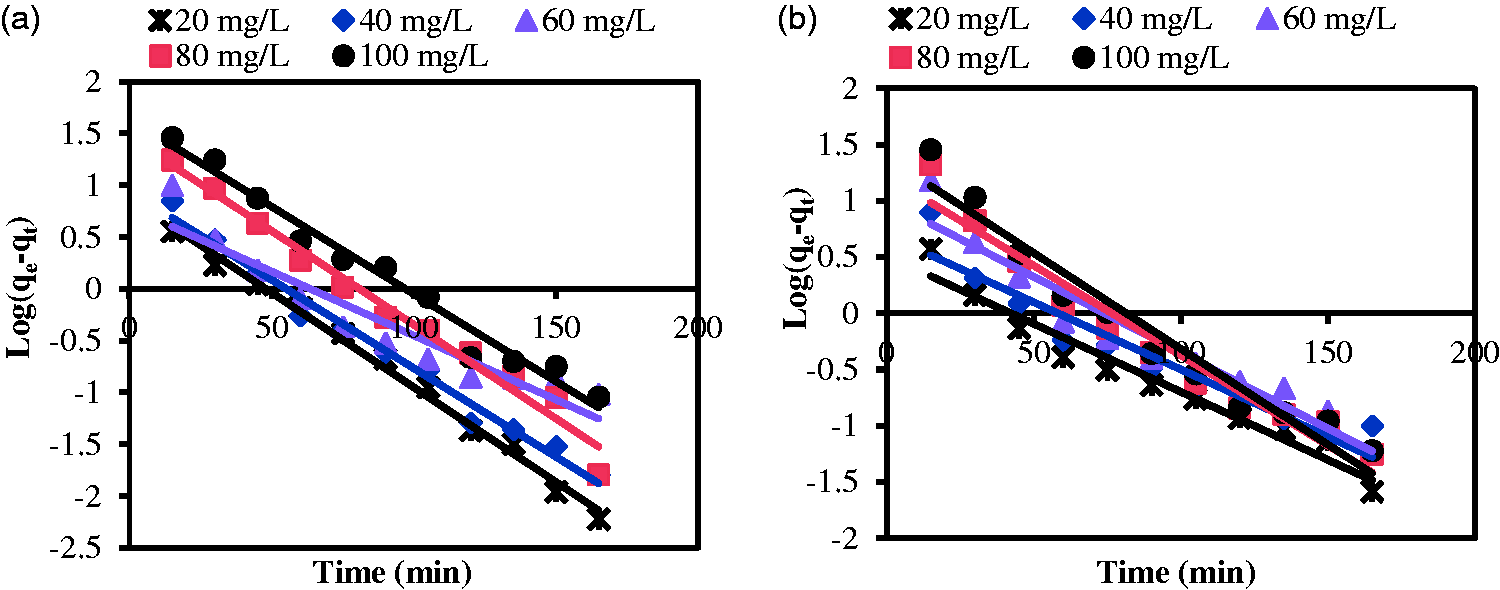
Another model can be used to explain the sorption is pseudo-second-order model. This model was proposed by Ho and McKay (Ho, 2006). It is based on the assumption that the bio-sorption follows a second-order chemisorption. The pseudo-second-order model is described by equation (11)

The linear plots of t/qt versus t determine 1/qe as slope and 1/K2qe2 as intercepts (Nemr, 2009). The linear plots of pseudo-second-order model for AB and AG dyes are shown in Figure 8(a) and (b).
Pseudo-second-order kinetic model for adsorption (a) AB dye and (b) AG dye onto QKCF (dose = 0.1 g/100 mL, speed = 200 r/min, Temp. = 25℃).
Parameters and correlation coefficient (R2) of pseudo-first-order kinetic model, pseudo-second-order kinetic model and intra-particle diffusion model for adsorption of AB and AG dyes by QKCF.
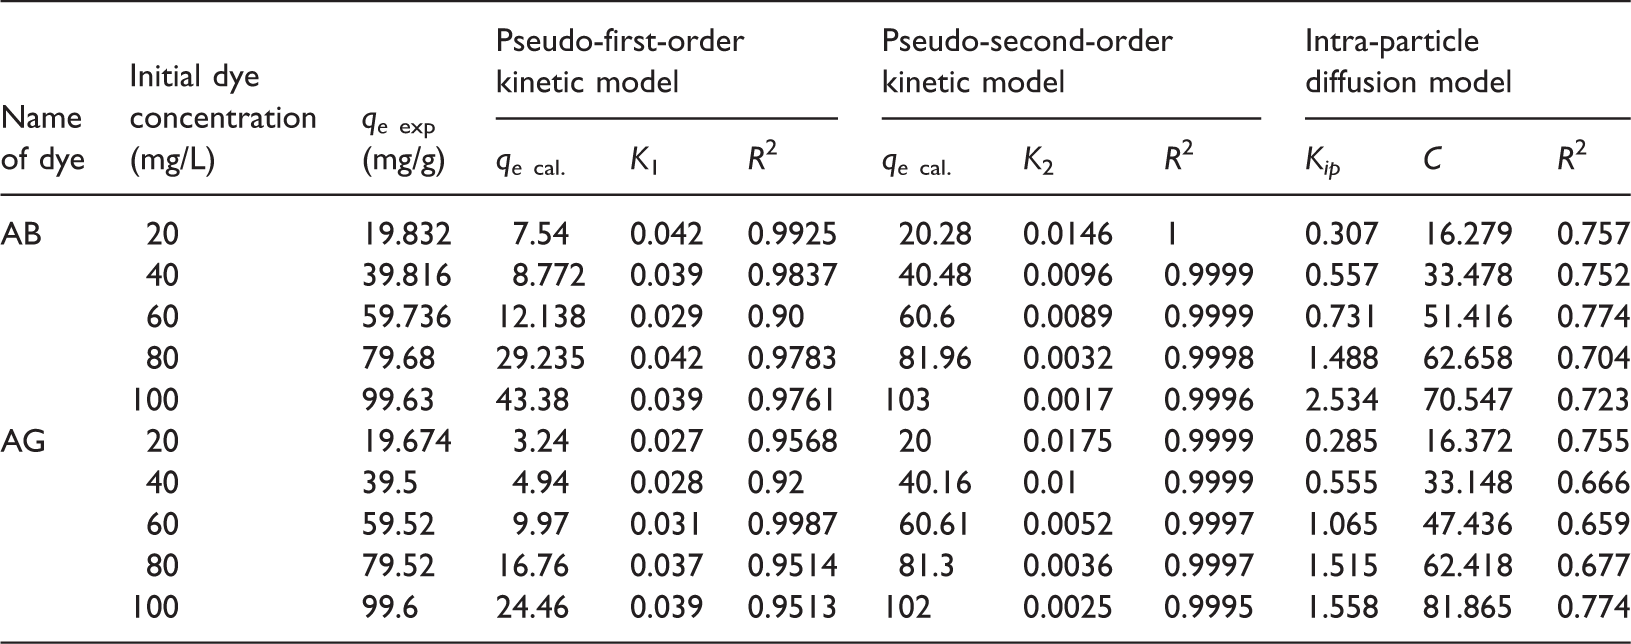
From Table 4, it can be seen that the correlation coefficient R2 for the second-order kinetic model ranges from 0.9995 to 1 and the calculated qe values go along with the experimental qe values. This indicates that the pseudo-second-order model provided the best correlation with experimental data. Hence, the adsorption kinetic of AB and AG dyes on QKCF occurred by chemisorption and internal diffusion mechanism based on the assumption in the pseudo-second-order kinetic model (Piccin et al., 2012).
In order to gain insight into the mechanisms and rate controlling steps affecting the kinetics of adsorption, the kinetic experimental results were analyzed by the intra-particle diffusion model to elucidate the diffusion mechanism. According to intra-particle diffusion, the uptake varies almost proportionally with the half power of time, t0.5. The prediction of the rate-limiting step is essential to have insight into the adsorption mechanism. The intra-particle diffusion coefficient Kip can be calculated by equation (12) (Weber et al., 1963)
Intra-particle diffusion model for adsorption of (a) AB dye and (b) AG dye onto QKCF (dose = 0.1 g/100 mL, speed = 200 r/min, Temp. = 25℃).
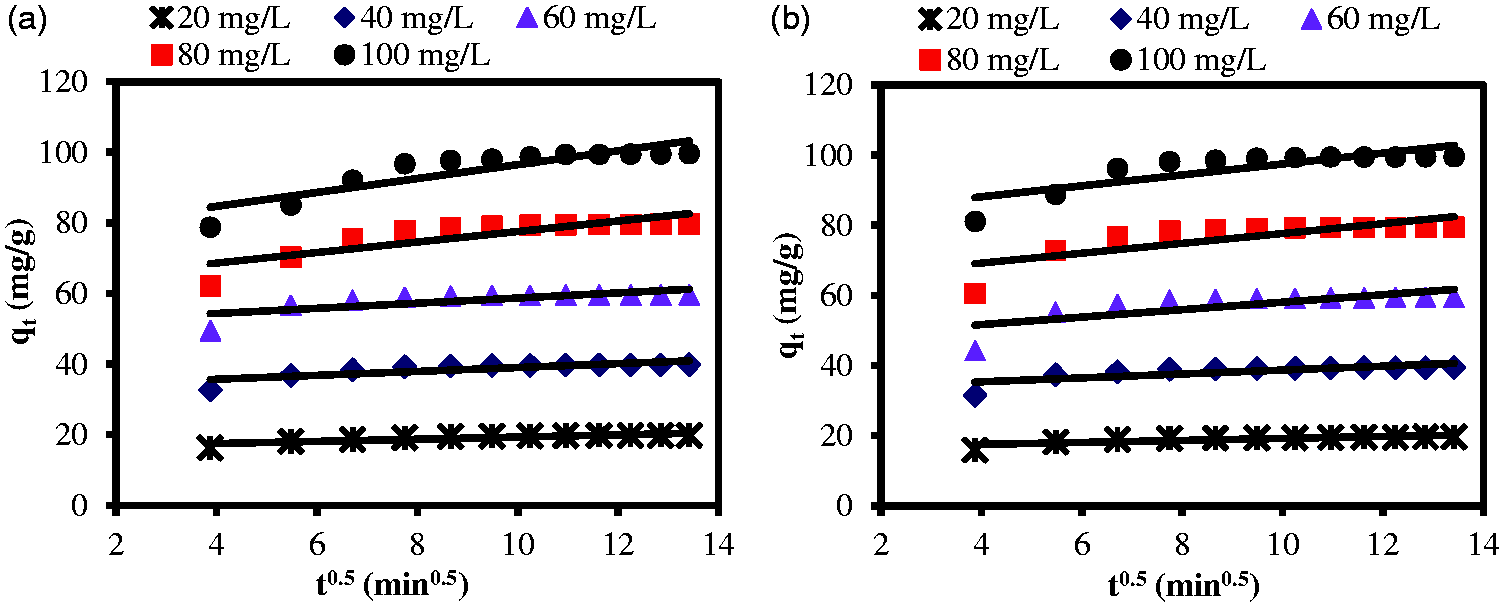
As can be seen from Figure 9(a) and (b), the linear lines for AB and AG dyes do not pass through the origin. This indicates that, in the adsorption process, the pore diffusion is not the only rate limiting mechanism. Along with intra-particle diffusion, other mechanism was also involved for the entire adsorption process (Chowdhury et al., 2012). The values of the intra-particle diffusion model constants (Kid and C) which are obtained for both dyes together with the R2 values are presented in Table 4. It is found that the values of Kid and constant C for both anionic dyes were increased by increasing the initial dye concentrations from 20 to 100 mg/L. This was due to the increase in the initial dye concentrations which increases the driving force to overcome the resistance of the mass transfer of dye between the solution and the adsorbent surface (Safa and Bhatti, 2011).
Thermodynamic studies
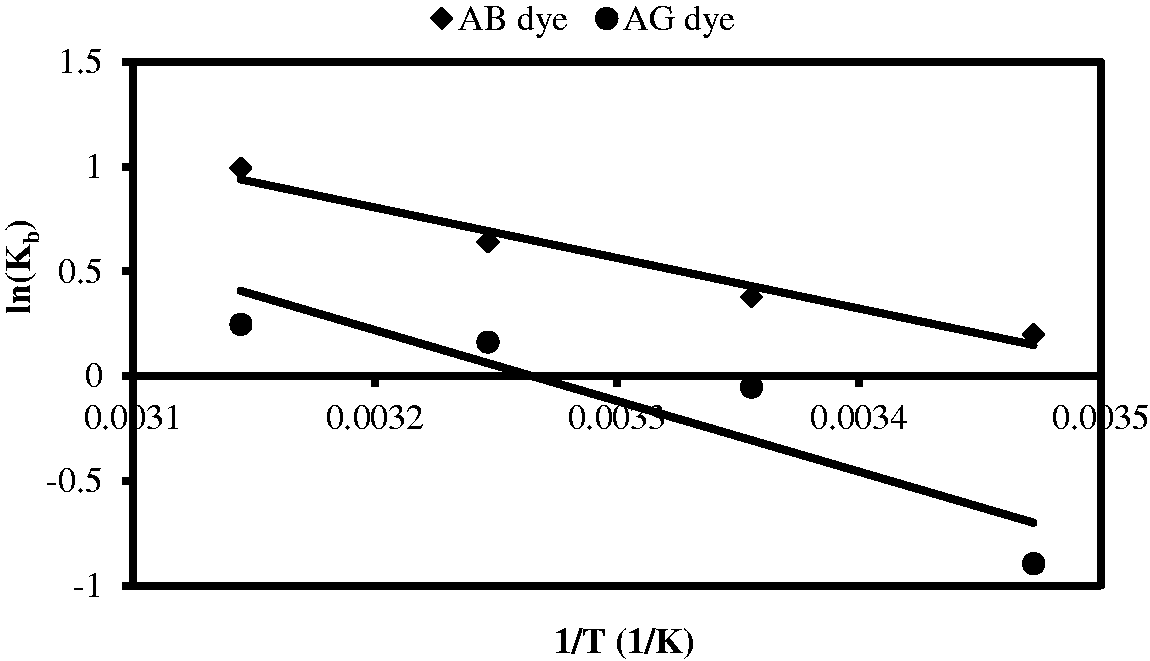
The thermodynamic parameters related to changes in adsorption standard free energy (ΔG), the change in enthalpy of reaction (ΔH), and the standard change in entropy of adsorbate–adsorbent reaction (ΔS) can be calculated by using the Van’t Hoff’s equations (13) and (14) (Yao et al., 2010)
Van’t Hoff plot for adsorption of AB and AG by QKCF. (Dose = 0.1 g/100 mL, speed = 200 r/min, Co = 100 mg/L). Thermodynamic parameters for adsorption of AB and AG dyes on the QKCF at different temperatures.


Conclusions
The present study aimed to develop an adsorbent from kenaf core fiber (QKCF) to remove anionic AB and AG dyes from aqueous solution. The results indicate that a very efficient removal of anionic AB and AG dyes can be achieved by using QKCF. It was observed that the equilibrium data fit well with the Langmuir isotherm model. In addition, the experimental data showed a good agreement with pseudo-second-order kinetic model. Thermodynamic parameters were determined and the adsorption of AB and AG dyes onto QKCF was found to be endothermic. Since KCF used in this work is locally available and environmentally friendly material, it can be employed successfully for removal acid dyes on an industrial scale.
Footnotes
Declaration of Conflicting Interests
The author(s) declared no potential conflicts of interest with respect to the research, authorship, and/or publication of this article.
Funding
The author(s) disclosed receipt of the following financial support for the research, authorship, and/or publication of this article: The authors want to thank the University Putra Malaysia and the Ministry of higher education and scientific research in Iraq for their financial support to this research work.