
Abstract
There is growing evidence of the problematic nature of the UK’s ‘flexible labour market’ with rising levels of in-work poverty and insecurity. Yet successive governments have stressed that paid work is the route to inclusion, focussing attention on the divide between employed and unemployed. Past efforts to measure social exclusion have tended to make the same distinction. The aim of this article is to apply Levitas et al.’s (2007) framework to assess levels of exclusionary employment, i.e. exclusion arising directly from an individual’s labour market situation. Using data from the Poverty and Social Exclusion UK survey, results show that one in three adults in paid work is in poverty, or in insecure or poor quality employment. One third of this group have not seen any progression in their labour market situation in the last five years. The policy focus needs to shift from ‘Broken Britain’ to Britain’s broken labour market.
Introduction
[T]his Government is unashamedly ‘pro-work’. We believe in work and its wider benefits. (DWP, 2012: 36) Income through benefits maintains people on a low income, and can even risk bolstering welfare dependency and feeding social problems such as drug dependency. Work, on the other hand, and the income it brings, can change lives – boosting confidence and self-esteem, providing a structure to people’s lives and giving them a stake in their community. (DWP, 2012: 10)
The UK government from 2010 to 2015 was a coalition between the Conservative Party and the Liberal Democrats, the former being numerically dominant. The Coalition had a simple and apparently compelling narrative about work and welfare which provides at least the explicit rationale for its policy approach. There is a great deal of continuity with the narratives of the previous New Labour government (Wiggan, 2012) but there are also important differences in emphasis. Employment has long been seen as the key route out of poverty and to social inclusion but, as Patrick (2012) notes, the transformative potential of paid work receives a particularly marked emphasis in the Coalition documents. Work is seen as having wide-ranging benefits, beyond the reduced risk of poverty. The income derived from work is said to have a different value to that from benefits as the second quote above shows. Paid work is said to provide social or participation benefits through a sense of purpose or a social role (DWP, 2012: 37). These together with the structure which work gives to daily life are seen as promoting quality of life through health and well-being (DWP, 2010a, 2010b, 2012, 2014).
The argument that individuals benefit from paid work is backed by an emphasis on the civic responsibility to work, and the obligation on those in receipt of out-of-work benefits to search for work (DWP, 2010b). Going beyond this, however, the Coalition argued that the failure to find paid work can be explained largely in individual terms due to a “culture of worklessness” (DWP, 2012: 38). This emphasis on individual moral failings is linked to arguments about the corrosive effects of welfare benefits, legitimating cuts in benefits as well as greater conditionality (DWP, 2010a, 2010b, 2012). There are direct links here to Blond’s (2010) analysis of the problems of ‘Broken Britain’.
One consistent theme across these statements is the emphasis on the divide between those in work and those unemployed – the ‘strivers’ and the ‘skivers’ (Coote and Lyall, 2013). This neat binary division is problematic for many reasons, not least for ignoring the high levels of movement between categories and the high level of benefits flowing to those in work without any apparent moral decline (Tomlinson and Walker, 2010; Coote and Lyall, 2013). The focus on this divide also serves to divert attention away from the deep and growing divisions within the employed group. Over the last 35 years, policy changes combined with the effects of wider economic restructuring have produced rising inequality and insecurity for those in employment, so that a growing number enjoy few if any of the supposed benefits of paid work (Gregg and Wadsworth, 2011).
The aim of this article is to bring the divisions between those in employment into focus using the conceptualisation of social exclusion constructed by Levitas et al. (2007). The claims made about the benefits of paid work encompass not just material or resource benefits but also aspects of social participation and quality of life. All three aspects are present in Levitas et al.’s framework. This framework is therefore applied to identify what the article terms ‘exclusionary employment’ – employment that fails to provide the inclusionary benefits that the Coalition and others attribute to it. Levitas et al.’s framework was developed to aid the measurement of exclusion and was operationalised in the Poverty and Social Exclusion UK (PSE-UK) 2012 survey. This unique dataset permits us to examine the multiple dimensions of ‘exclusionary employment’ and how they overlap, and hence to provide an estimate of the overall scale of the problem for the first time.
The article begins by summarising the changing labour market context. It then sets out how social exclusion is conceptualised and hence how exclusionary employment is defined and measured. After summarising details on data and methods, the first part of the findings section looks at the risk factors associated with each dimension of exclusionary employment, using a variety of potential measures for each dimension. This helps to identify a smaller set of preferred measures for each dimension for the second stage which looks at the overlap between the dimensions and hence the overall prevalence of exclusionary employment. This stage also provides some evidence of the extent to which exclusionary employment is a more or less durable state. The final section presents a concluding discussion.
Changing labour market context
Although the Coalition’s rhetoric has been particularly strident, its approach to work and welfare shows a great deal of continuity with those of governments of the previous 30 years. In this time, policy changes have not moved uniformly in one direction, and the link between policy change and the labour market has not always been direct (Deakin and Reed, 2000). Nor is policy the only factor at work in this area; others include technological change and industrial reorganisation, both linked to ‘globalisation’ (Machin, 2011; OECD, 2011). Nevertheless, policy changes have contributed substantially to a fundamental shift in the benefits and conditions of employment, particularly for those in lower skilled, lower paid or lower status occupations (Gilbert and Besharov, 2011).
First, labour markets have been ‘deregulated’ in the pursuit of ‘flexibility’ for employers. The term ‘deregulation’ is slightly misleading in the sense that some changes involved new forms of regulation (for example, curbs on collective action) but overall they aimed to significantly increase the scope for firms or organisations to determine how and on what terms labour was used (Dickens et al., 2003). The Conservative government from 1979 onwards undertook the most fundamental reforms but New Labour continued the approach albeit while introducing some limited new rights, most notably with the National Minimum Wage (Deakin and Reed, 2000). Despite the fact that the UK had one of the lowest levels of employment protection amongst OECD countries at the time the Coalition government took over (Venn, 2009), the Coalition pursued further deregulation; for example, raising the qualifying period for rights to unfair dismissal from one year to two (BIS, 2011).
Second, governments have attempted to reduce the attractiveness of unemployment and increase that of employment. The value of unemployment benefits has steadily fallen behind earnings and consumption since benefit increases were pegged to price indices in 1980 (Kenway, 2009). The Coalition introduced further caps on increases in 2013 (Aldridge et al., 2013). The UK has low replacement rates for unemployment benefits relative to the other European countries (OECD, 2014). In addition, the introduction of labour market ‘activation’ measures in the UK followed an American rather than a European model with an emphasis on high levels of conditionality backed by harsh sanctions rather than support measures such as re-investment in skills (Venn, 2012; Loopstra et al., 2015). The Welfare Reform Act 2012 introduced significant further increases in the scale of sanctions even though the government had no evidence for the effectiveness of such long sanctions (House of Commons Work and Pensions Committee, 2015).
The labour market consequences of these changes can be seen in three major areas. First, the distribution of income from work has become markedly more unequal. There has been a significant widening of wage inequalities, particularly during the 1980s but continuing through the 1990s and 2000s (Machin, 2011). Rising wage inequality has been the most important driver of widening levels in income inequality in many developed countries, including the UK (OECD, 2011). The National Minimum Wage helped slow the rise in inequality in the bottom half of the labour market during the 2000s but the highest paid continued to pull away from the median (Green, 2011). The result has been the steady rise in the proportion of people in poverty who are in working households (DWP, 2014).
Second, security of employment has been reduced, particularly for those in lower paid employment, with the rise of ‘non-standard’ employment contracts – part-time, short-term or temporary positions (Millward et al., 2000). The UK rates poorly on job security compared with other OECD countries (OECD, 2014). There is a particular concern about a growing number of people who cycle repeatedly between short spells of insecure employment and unemployment – the ‘low pay, no pay’ cycle – as well as the rising numbers on ‘zero-hours’ contracts (ONS, 2015; Thompson, 2015). Work has also been polarised at the household level, with a rise in the number of workless households (Gregg and Wadsworth, 2011).
Third, there have been more varied trends in relation to other aspects of work (Green, 2011). On the positive side, working hours have fallen, and more workers enjoy rights to paid holidays as well as parental leave. On the other hand, there have been declines in worker autonomy or control over tasks and increasing intensification of work, both of which contribute to rising levels of work-related stress (Green, 2011; Eurofound, 2012a).
Exclusionary employment
Various frameworks might be used to capture the changing divisions between those in employment. This article approaches the task through the framework of social exclusion. This is a concept with diverse meanings and uses (Levitas, 1998). Some versions would provide little purchase for current purposes since they equate employment automatically with inclusion – the versions described under the Social Inclusion Discourse in Levitas’ (1998) analysis, for example. Nevertheless, social exclusion is said to have a number of advantages as an approach to studying welfare, notably its multi-dimensional focus and the attention paid to dynamics, processes or trajectories (Berghman, 1995; Byrne, 1999; Barnes, 2005).
There have been relatively few attempts to move from conceptual frameworks to definitions that can support operational measures of exclusion at the individual level. Many studies rely on baskets of indicators to track changes in different aspects of exclusion over time (Levitas et al., 2007). All of these would recognise unemployment and, in some cases, inactivity for those of working age as indicating exclusion while some also pay attention to exclusion within employment, notably low pay but also insecurity (for example, Aldridge et al., 2013). Since indicators come from diverse sources, however, these studies are not able to identify the extent to which different dimensions overlap in individual lives and hence the overall scale of exclusionary employment.
A small number of UK studies have attempted to operationalise measures of exclusion using individual data, including the previous 1999 PSE survey (Pantazis et al., 2006) and studies using British Household Panel Study data (Burchardt et al., 2002; Barnes, 2005). The PSE survey looked at exclusion across four dimensions of which labour market exclusion was one. In practice, this was measured through non-employment, effectively equating employment with inclusion although some analyses explored problems of exclusion on other domains (impoverishment and exclusion from social relations) for those in employment (Bailey, 2006). The approach by Burchardt et al. (2002) is very similar with ‘production’ one of four dimensions of exclusion, measured as those not in employment, or education or training, or looking after family.
Barnes (2005) took a slightly different approach, excluding labour market status from his domains of exclusion. He argued that the use of employment as a marker of inclusion was too crude. It served to obscure a diverse set of situations for those not in paid work, as well as masking divisions between those in employment. Excluding current employment from the measure of exclusion enabled him to explore its influence as a risk factor for exclusion.
This article takes a similar approach, starting from the conceptualisation of exclusion developed by Levitas et al. (2007). That study proposed a multi-dimensional construct with a number of domains, grouped into the three broader areas of resources, participation and quality of life. 1 As the policy statements above demonstrated, employment can be expected to provide inclusionary benefits in relation to each of these areas. Exclusionary employment can therefore be identified where employment fails to lead to these anticipated benefits. 2
In effect, the three areas relate to the three sets of trends discussed in the previous section. In relation to resources, the most direct benefit of employment is obviously intended to be material or economic resources. There may also be secondary effects in relation to other kinds of resource, notably those accessible through social networks (Bailey, 2006) although these are not discussed within this article. Exclusionary employment occurs where these material benefits are inadequate. The rising levels of in-work poverty discussed above are the most obvious evidence here.
In relation to participation, employment is a form of economic participation (although as Levitas et al. (2007) remind us, unpaid work is an equally valid form). It provides a role for the individual within society which can in turn confer a sense of meaning or personal value, and hence support social integration. While those in employment can be seen as ‘included’ by definition, there may also be exclusion within employment for those whose status is particularly insecure or unstable; they have a high risk of unemployment in the near future or are likely to experience repeated spells of unemployment.
In relation to quality of life, employment is most directly connected to the health and well-being domain in the current framework. In general, employment is seen as conferring a range of health benefits through the structure and meaning it brings to individual lives as well as through increased material resources. Increasingly, however, it has been recognised that poor quality employment may actually damage health, giving worse outcomes than unemployment (Gallie and Paugam, 2003; Butterworth et al., 2011). Employment quality has different dimensions but aspects such as employee task control or autonomy, security, variety and satisfaction have all been identified as important (Gallie, 2007).
In addition to emphasising the multi-dimensional nature of exclusion, Barnes (2005) stresses the need to capture the dynamics of exclusion through longitudinal data. He is critical of other approaches such as that in the 1999 PSE survey – and by extension the PSE-UK 2012 survey – which lack such a dynamic element. The trade-off he has to make, however, is constructing his exclusion measures from data available from an existing longitudinal survey. While the PSE-UK has only limited longitudinal information, it compensates for this through the richness of its coverage of the different domains. One area where it does have data on dynamics, however, is in relation to employment status. As explained in more detail below, respondents are asked about their progression in the labour market over the previous five years. This is used to provide insights into the dynamics or durability of exclusion states in the final part of the analysis.
The concept of social exclusion is of course only one way to explore variations in the conditions of employment. In his ground-breaking study of poverty, Townsend (1979) sought to apply the concept of deprivation to the workplace through a measure termed ‘work deprivation’. This captured pay and material benefits of work, along with job security, the intensity or demands of work, and the physical conditions or amenities. There is a great deal of overlap between that approach and what is proposed here although the coverage of quality of work is rather narrower in Townsend’s framework.
Concerns with divisions arising from the ‘flexible labour market’ are also central in the concept of social precarity or the ‘precariat’ (Gallie and Paugam, 2003; Standing, 2011). Again, there is a significant overlap with the framework proposed here although precarity places greater emphasis on insecurity as a particularly durable feature of individual lives. The limitation of precarity as a lens on social welfare, however, is that it appears to link groups with very different degrees of vulnerability. Some highly skilled knowledge workers on short-term contracts may form part of the precariat because their employment is liable to disruptions but their material position is comparatively secure and their broader social, political or cultural position is relatively advantaged (Standing, 2011).
Data and methods
The PSE-UK survey
The PSE-UK survey is based on re-interviewing people living in households previously interviewed for the Family Resources Survey (FRS) 2010/11. Fieldwork for the PSE-UK was conducted between February and October 2012, 12 to 18 months after the FRS survey. Interviews were achieved with 5193 households (59 per cent response rate). Within those households, interviews were achieved with 7978 adults (89 per cent of those present). Of these, 5367 were full interviews with adults aged 18 to retirement age with 3672 in paid work (weighted 3798). Weights allow for unequal chances of selection and adjusted the sample to match the age/sex population structure for the region/nation established by the 2011 Census. These are used in all the analyses that follow.
Resources
To measure the resource benefits of work, various standards might be applied based on hourly rates of pay – the National Minimum Wage or the Living Wage standards, for example. These provide only a limited picture of material benefits, however, since quantity of work and stability over time are also important. A more complete measure is the extent to which those currently in paid work are able to avoid poverty. The PSE-UK survey provides several measures. First, there is a low income poverty measure based on equivalised household income. Low income measures are very responsive to changes in employment but suffer several limitations as indirect measures of poverty (Ringen, 1988). Second there is a direct measure of poverty using the PSE-UK’s consensual or democratic methodology. A public opinion survey identifies a set of items or activities which the public regard as ‘necessities’: things that the majority believe everyone should be able to afford and no one should have to go without. A second survey of living standards (the main PSE-UK survey) identifies who lacks each necessity because they cannot afford it. This is the basis of the deprivation measure which is a count of the number of necessities items that people lack (average 2.4, median 1). It is combined with income to construct the PSE poverty measure (Gordon, 2006). For the PSE-UK survey, the threshold is lacking three or more necessities items and having an income below the median for those who lack three items.
Participation
The aim here is to assess insecurity of employment for those currently in paid work. One immediate measure would be based on contractual position, with those on various forms of ‘non-standard’ contract regarded as excluded. The limitation here is that many highly skilled and well-paid individuals work on such a basis while a secure contract is no guarantee against redundancy. Two alternative approaches are to ask for a subjective assessment of security and to ask about continuity of employment by looking at an individual’s recent work history. The PSE-UK survey contains one question on whether the respondent felt that their job was secure. It also asks all adults under 80 about the proportion of time over the last five years they have been unemployed.
Quality of life
Various dimensions of job quality have been associated with worse health or well-being outcomes, and can also be viewed as important in their own right (Eurofound, 2012b). As there is no standard framework for measuring job quality, a range of frameworks were examined (Bailey and Livingston, 2011). From this, a barrage of fourteen questions was developed, with responses on five-category Likert scales. Factor analysis suggested that twelve of these questions could be used to identify four dimensions: satisfaction or sense of doing valued work; (low) stress; control or flexibility for the worker; and (good) physical conditions (Table 1). For each dimension, scores are averaged across the relevant questions and converted to dichotomous variables. 3
Job quality questions.
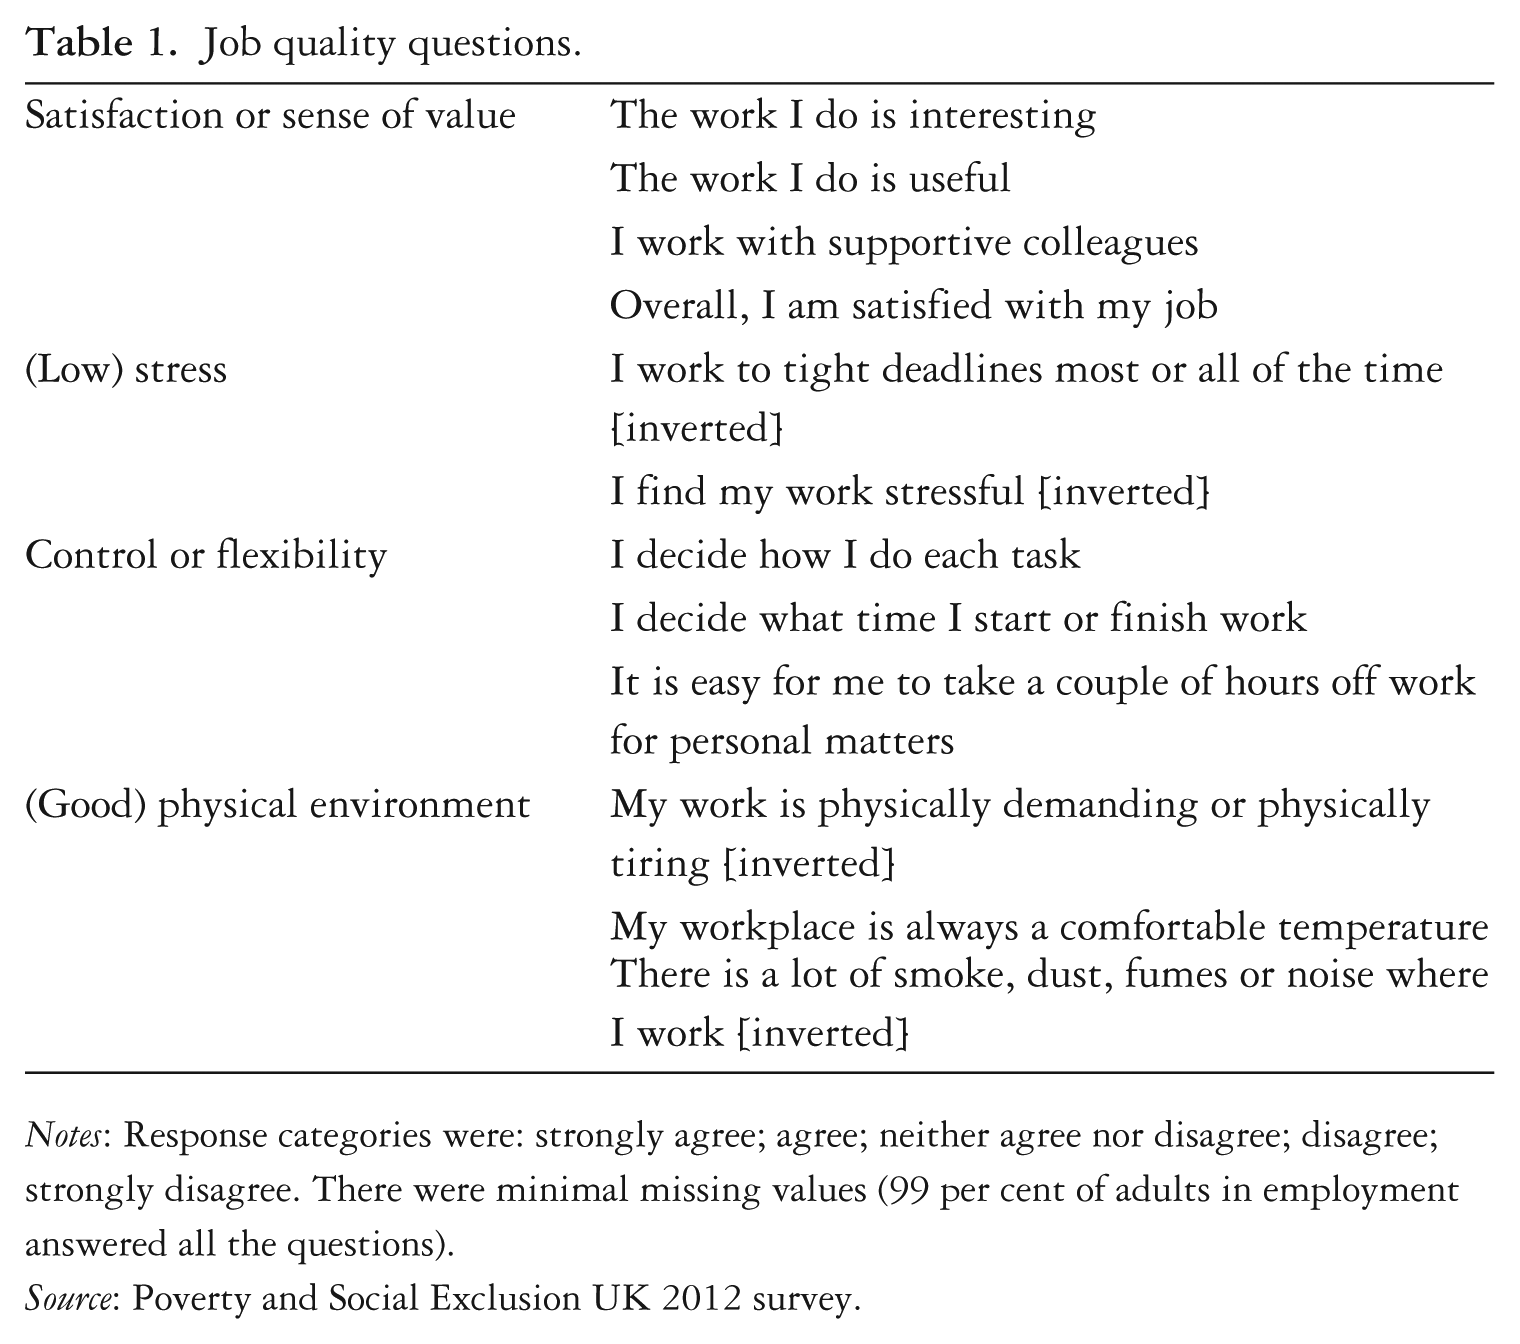
Notes: Response categories were: strongly agree; agree; neither agree nor disagree; disagree; strongly disagree. There were minimal missing values (99 per cent of adults in employment answered all the questions).
Source: Poverty and Social Exclusion UK 2012 survey.
As discussed below, the factors associated with high stress were quite different to those associated with low satisfaction, low control or poor physical conditions. In particular, high stress was associated with high status work (full-time employment in managerial or professional occupations) of a kind not usually associated with exclusion. The measure of overall job quality is therefore based on the average for the other three dimensions. This is converted to a dichotomous variable which distinguishes those reporting ‘positive’ views from the rest with neutral or negative views. 4
Sense of progression
In the PSE-UK survey, three questions ask respondents to compare their role in their current job with what they were doing five years earlier, in terms of: levels of skill used; variety of tasks performed; and level of responsibility (response categories: increased; decreased; little or no change). There are moderately strong correlations between the three (about 0.6) and they are reduced to a single score, recoded to a dichotomous variable contrasting those showing no or negative progression from those with positive responses on average. It is of course recognised that not everyone desires progression through the labour market or would recognise the changes measured here as such. Nevertheless it is reasonable to assume that this measure would be associated with improving material benefits, security and job quality and hence with more inclusionary forms of work.
Analysis
Dichotomous measures are constructed to identify the aspects of resources, participation and quality of life related to employment as described above. Logistic regression models are used to examine the individual or household characteristics associated with each measure and, from this, to identify the set of measures that might best be used to identify exclusionary employment. Regression models take account of weights and of the clustering of the sample arising from the original sample selection process within the FRS. Independent variables include a range of socio-demographic or human capital factors related to employment (sex, age, ethnicity, household composition, health, education, occupation, full- or part-time status and household work intensity). The last of these captures the extent to which adults of working age (and not in full-time education) were working full-time over the previous year; it has the value of 100 per cent when all adults worked full-time for the whole of the year.
The analysis then explores the overlap between the three areas, using one measure for each (the PSE-UK poverty measure, the poor work history measure and the combined low quality of work measure). The rationale for the selection of these three measures is provided in the section that follows. The analysis also looks at levels of progression to gain an insight into the dynamics or durability of different situations.
Findings
Resource exclusion
The three measures of poverty reveal substantial levels of in-work poverty in the UK albeit with significant variations; one in six is in poverty on the low income measure, one in three on the deprivation measure, and one in six on the combined PSE poverty measure. Although poverty rates are higher for those out of work, those in paid work make up 45 to 57 per cent of all working age adults in poverty, depending on the measure used.
While poverty rates vary between measures, there is a high degree of consistency in terms of the personal risk factors associated with each and these provide a very familiar picture of disadvantage. These factors are predominantly related to human capital and returns from paid work. People in semi-routine or routine occupations experience greater poverty as rates of pay are lower, reflecting lower human capital requirements. Poor health can limit access to better paid employment and hours of work. Low educational qualifications and being relatively young have further modest relationships with poverty risks, with both associated with lower human capital.
Other risk factors are socio-demographic ones, indicating constraints on availability for paid work or higher costs. Having children, and especially being a lone parent, is associated with higher in-work poverty risks, reflecting both factors. The affordability of childcare has been a long-term issue in the UK (Skinner, 2006). The higher poverty risks faced by those from minority ethnic groups suggest other issues including barriers in the form of employer discrimination (Platt, 2007).
Many of these factors overlap so logistic regression models are used to show the independent effect of each of these personal factors on the risk of being in in-work poverty (Table 2, first three columns). The models are moderately successful in explaining in-work poverty (as indicated by the pseudo R-squared statistics). Household work intensity is clearly the strongest influence. (Since the household work intensity measure is derived in each individual’s employment status as well as those for other adults in their household, it is not appropriate to include both in the same model.) Occupation and ethnicity are the next most important. The importance of occupational differences is a reminder of growing inequalities in the returns from employment while ethnicity highlights the importance of discriminatory barriers.
Logistic regression models.
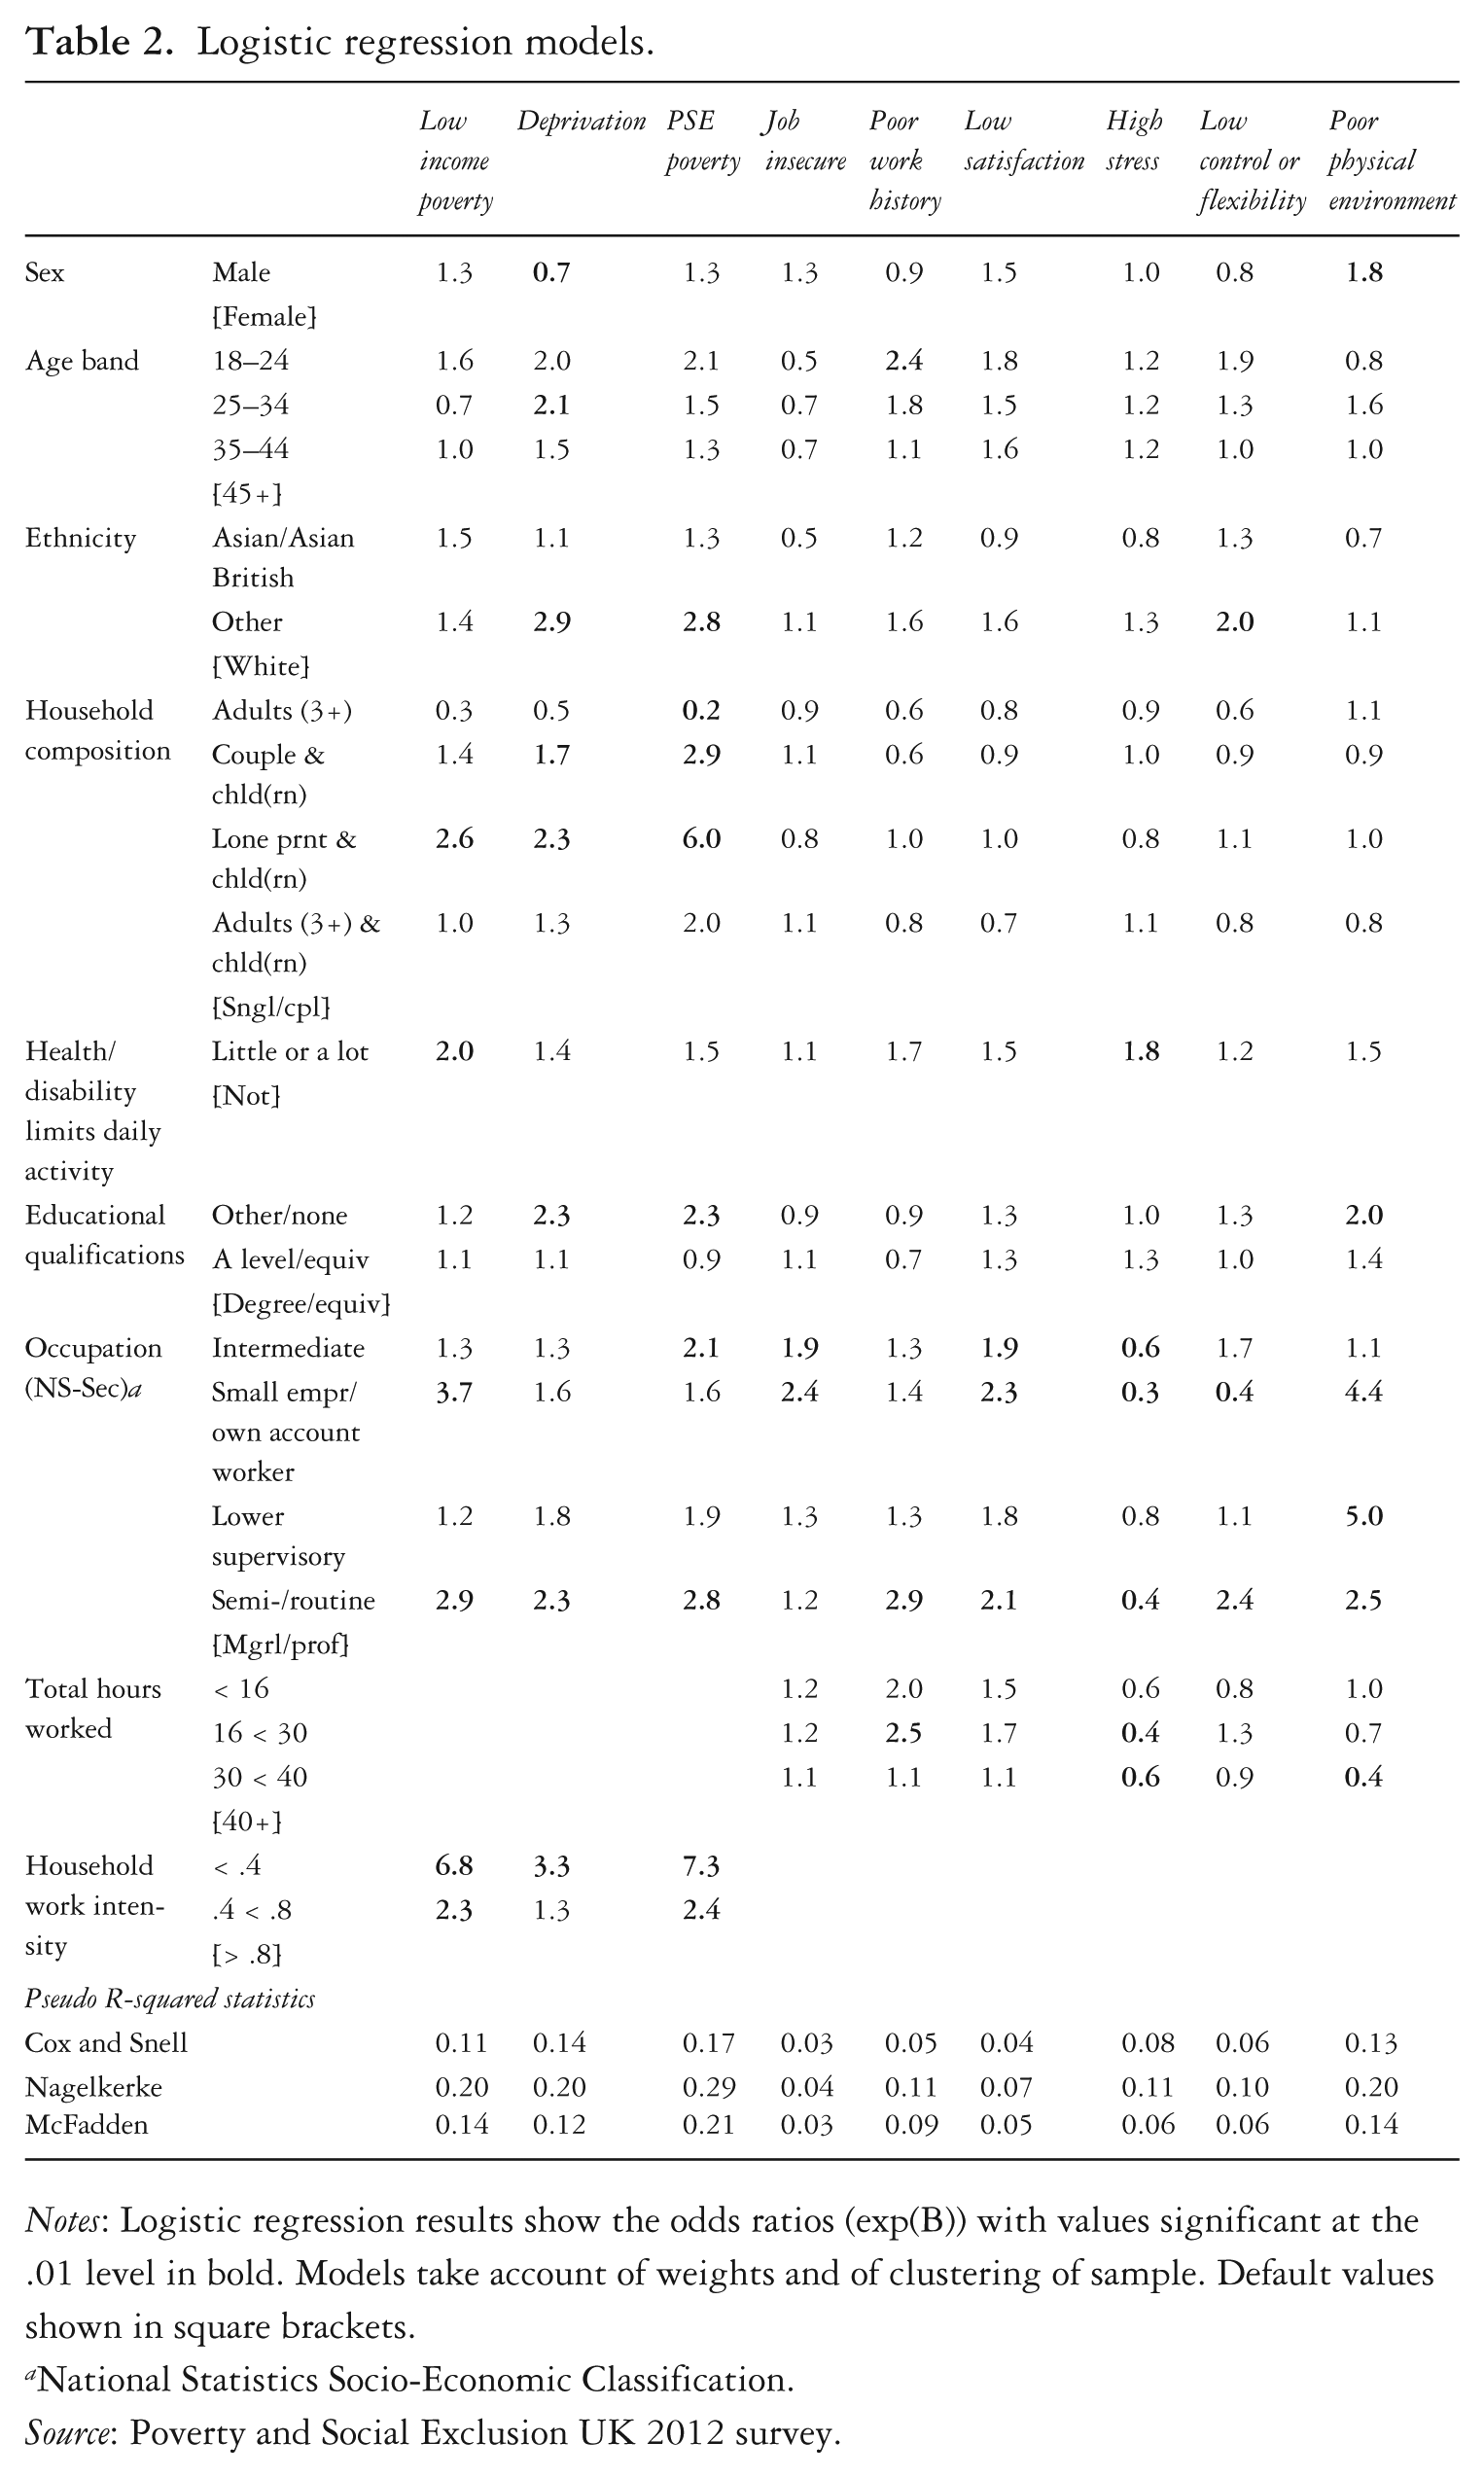
Notes: Logistic regression results show the odds ratios (exp(B)) with values significant at the .01 level in bold. Models take account of weights and of clustering of sample. Default values shown in square brackets.
National Statistics Socio-Economic Classification.
Source: Poverty and Social Exclusion UK 2012 survey.
There is little to choose between the poverty measures based on this analysis since the relationships with personal risk factors are so similar. The PSE measure is used below on the basis that it combines deprivation and low income, and gives an overall poverty risk between the other two.
A focus on risk factors alone can be misleading in terms of identifying who the working poor are and what problems they face. Part-time working and low household work intensity are important risk factors, suggesting the need to increase employment rates or effort. However, a substantial proportion of the working poor already work full-time (39 per cent using the PSE poverty measure) or live in a household with work intensity above 80 per cent (36 per cent) – and one in five of the working poor (19 per cent) are in both categories. In these cases, more work cannot be the solution.
Participation exclusion
Two measures of insecurity in employment are shown in Table 2 (columns four and five): subjective views of current insecurity and poor work history. Absolute rates of exclusion vary between the measures (one in five compared with one in ten respectively) but, unlike the previous resource measures, the risk factors associated with each are quite different. The subjective insecurity measure has little relationship with measures of socio-economic disadvantage. People who perceive themselves to be insecure are more likely to be older and self-employed or in intermediate occupations. None of these factors is associated with increased risks of poverty or generally associated with exclusion – although there are increasing problems of low-paid self-employment (Aldridge et al., 2013).
There is a clearer relationship between the second insecurity measure, having experienced more unemployment in the last five years, and disadvantage. The people with higher risks of this form of insecurity tend to be younger, in poorer health, in semi-routine or routine occupations and working part-time. All of these factors were associated with increased risks of in-work poverty. On this basis, it is this measure of insecurity that is used to assess exclusionary forms of employment.
Quality of life exclusion
The four measures of job quality are quite diverse, both in terms of overall levels of poor quality (from one in six for low satisfaction to almost one in two for high stress), and in terms of risk factors (Table 2, last three columns). Stress is the measure most unlike the others, with high stress associated with the kinds of work that are usually high status and well remunerated (full-time work in managerial or professional occupations) but unrelated to all other factors except poor health. Although it may be a dimension of poor job quality and may have a causal connection with poor health, it seems out of place as a measure of exclusionary employment.
The other three quality measures have more in common, notably an association with semi-routine or routine occupations. Low satisfaction and a poor physical environment are more commonly reported by men, by those self-employed or lower-level supervisors (in addition to those in semi-routine or routine occupations), or those in poor health. Low satisfaction is also more common amongst younger adults and those working part-time while poor physical conditions are more common amongst those with low or no qualifications or working full-time. Low control or flexibility is more commonly reported by younger adults, those in intermediate occupations (in addition to semi-routine or routine ones) and those of ‘other’ ethnicity. Rather than selecting any one of these dimensions for the next stage, a single combined measure is used instead to capture the multi-dimensional nature of job quality (as detailed in the methods section above).
These aspects of job quality were originally justified on the basis of evidence of the negative impact they have on health and well-being. The PSE-UK survey cannot be used to demonstrate a causal relationship between low job quality and health but it is nevertheless interesting to compare job quality with self-assessed general health and with two subjective well-being measures – satisfaction with day-to-day activities and with life overall. Figure 1 shows the proportion of people reporting ‘high’ satisfaction or ‘very good’ general health by quintiles of job quality (from high to low). For comparison, the figure also shows the proportions for the unemployed and inactive of working age. Figure 1 shows clearly that lower quality employment is associated with worse health and well-being than high quality employment. On two measures, those in employment in the lowest quality quintile reported worse health and well-being than the unemployed.
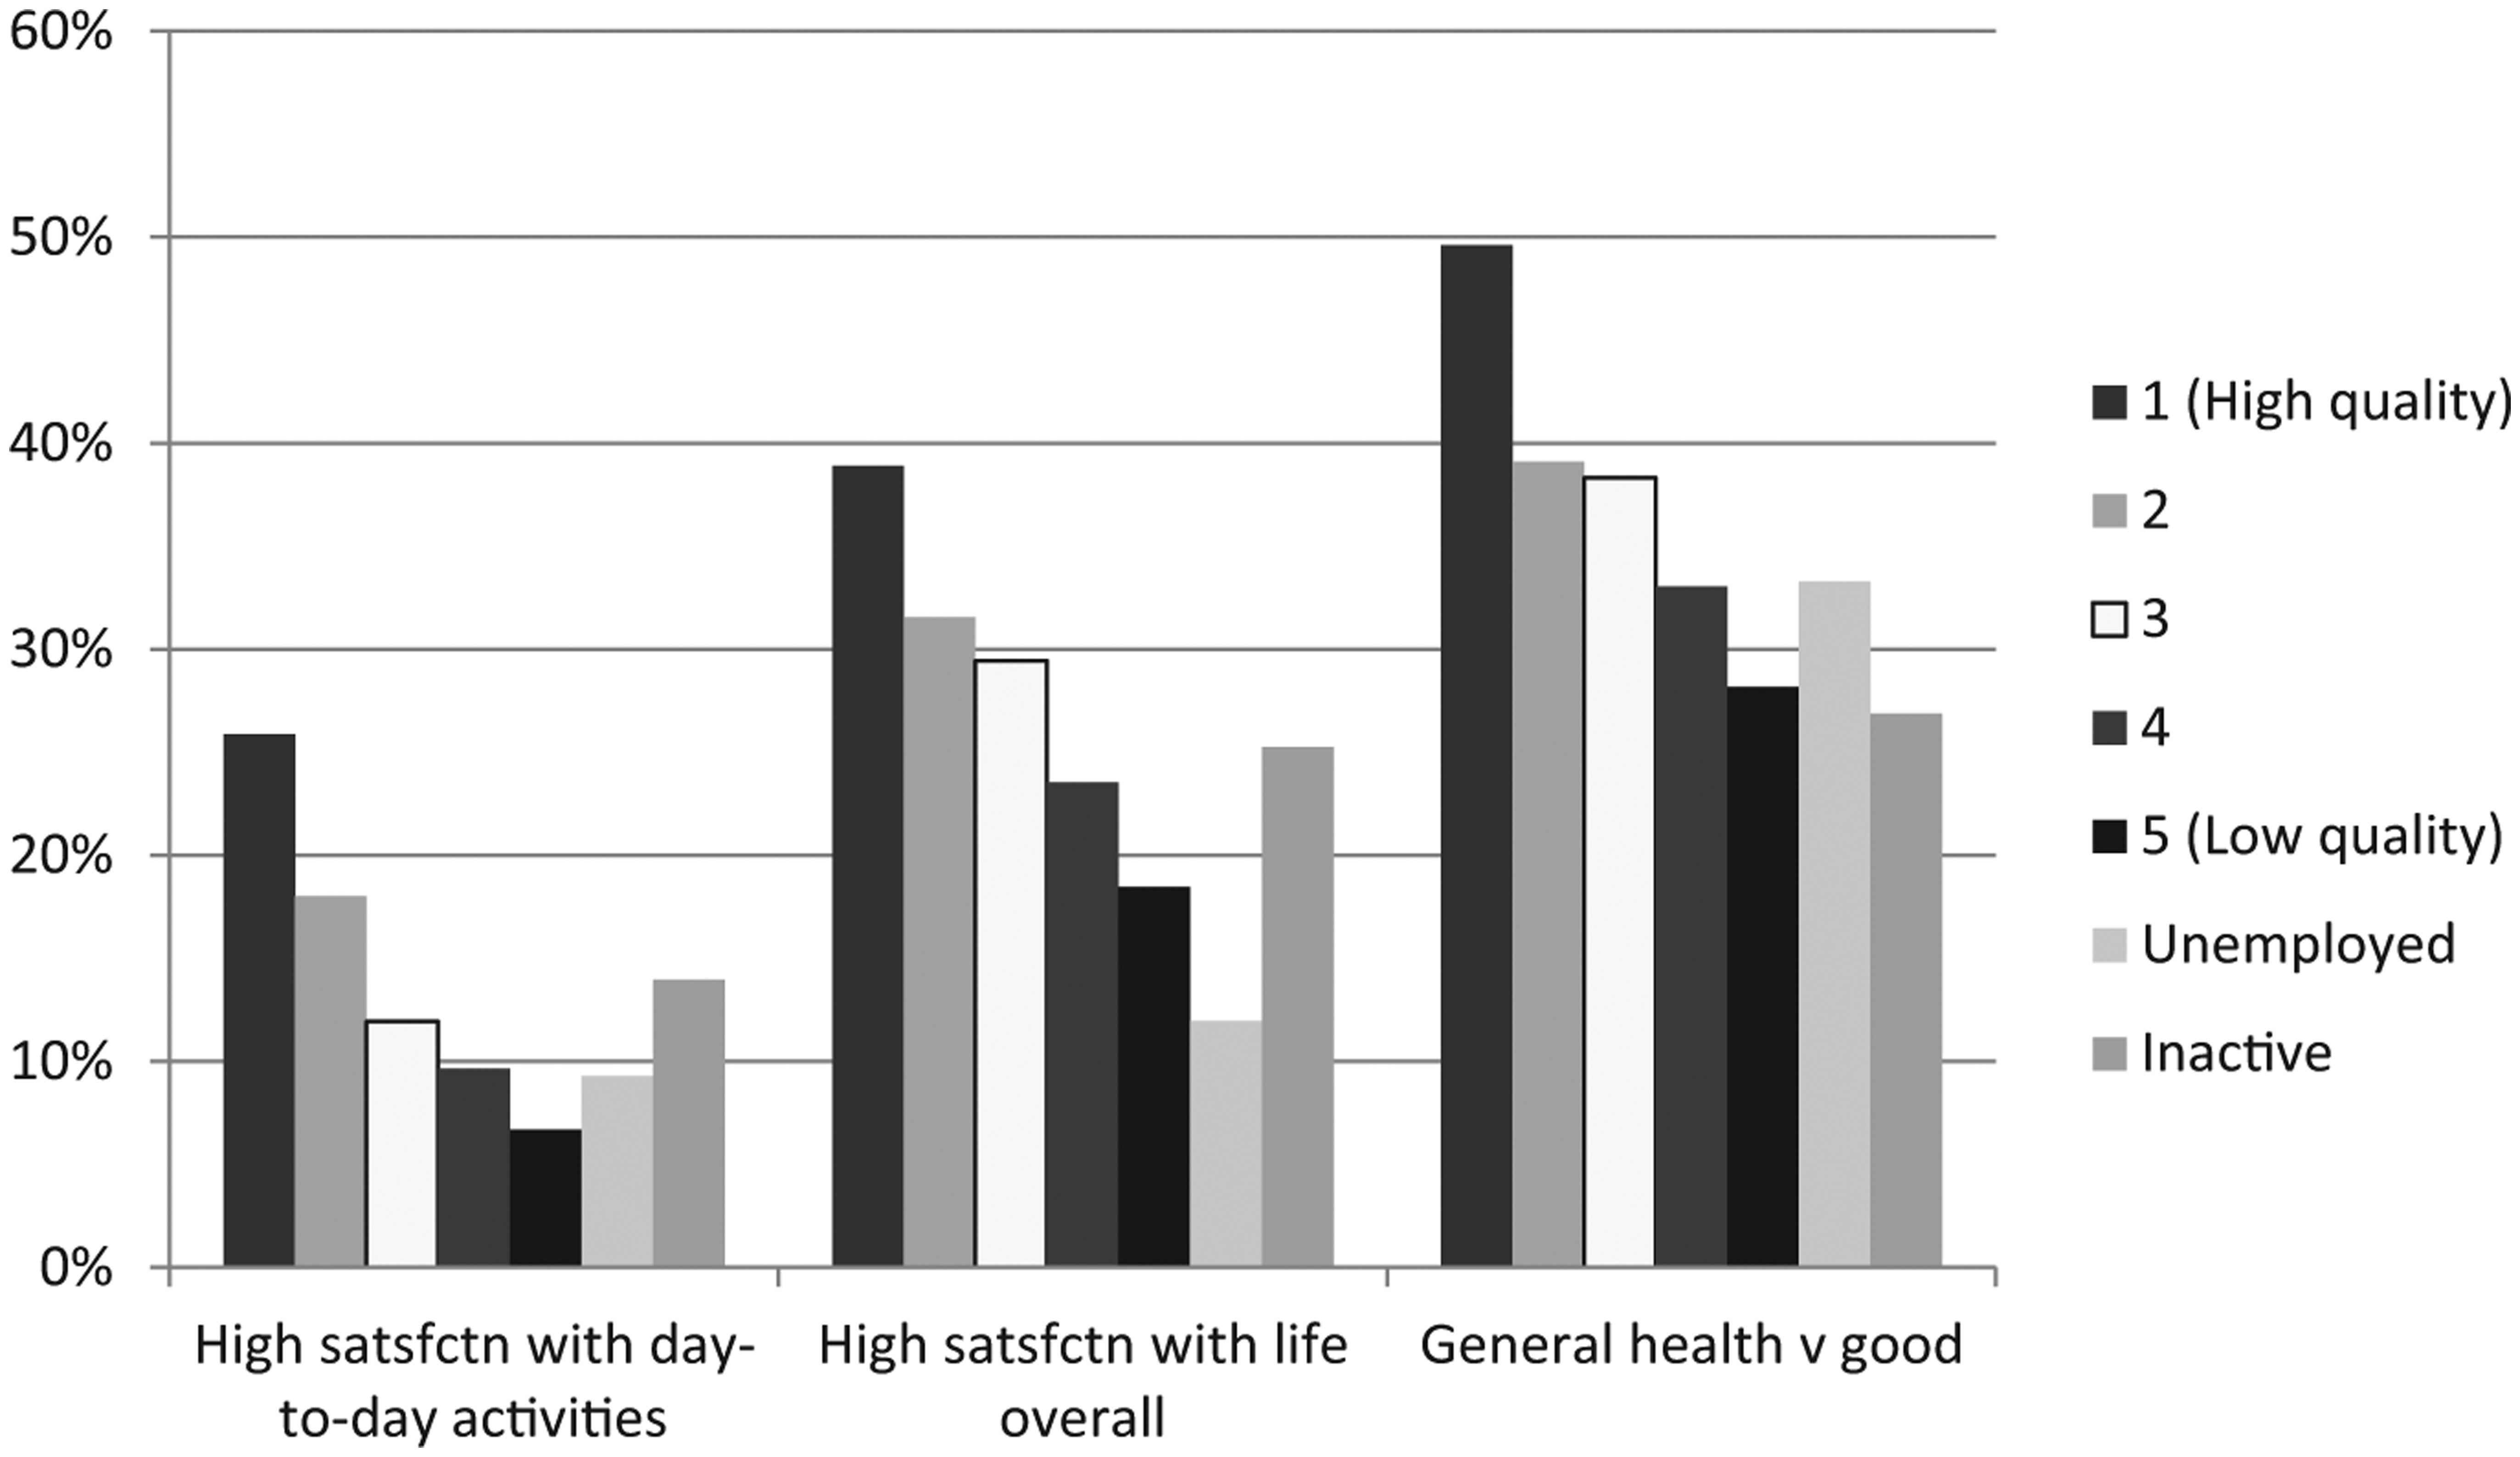
Health and well-being outcomes by employment status and quality.
Relationships between the dimensions
To explore the relationships between the dimensions of exclusionary employment and to assess its overall scale, it is necessary to select one measure for each. As discussed above, these are PSE poverty, poor work history and the combined low quality measure. The left-hand side of Figure 2 is a visual representation of the working age population, showing employment status, the scale of each form of exclusion and the overlaps between them. The three main boxes in the left panel show the relative size of employed, unemployed and inactive groups (71, 8 and 22 per cent of the working age population respectively). Within each box, there is a shaded box which runs the full height, starting on the left and extending to cover an area equivalent to the proportion that is in poverty (17, 59 and 47 per cent respectively). As discussed above, this shows how poverty rates are much lower for those in employment but also reinforces the point that the working poor are as numerous as the non-working poor.
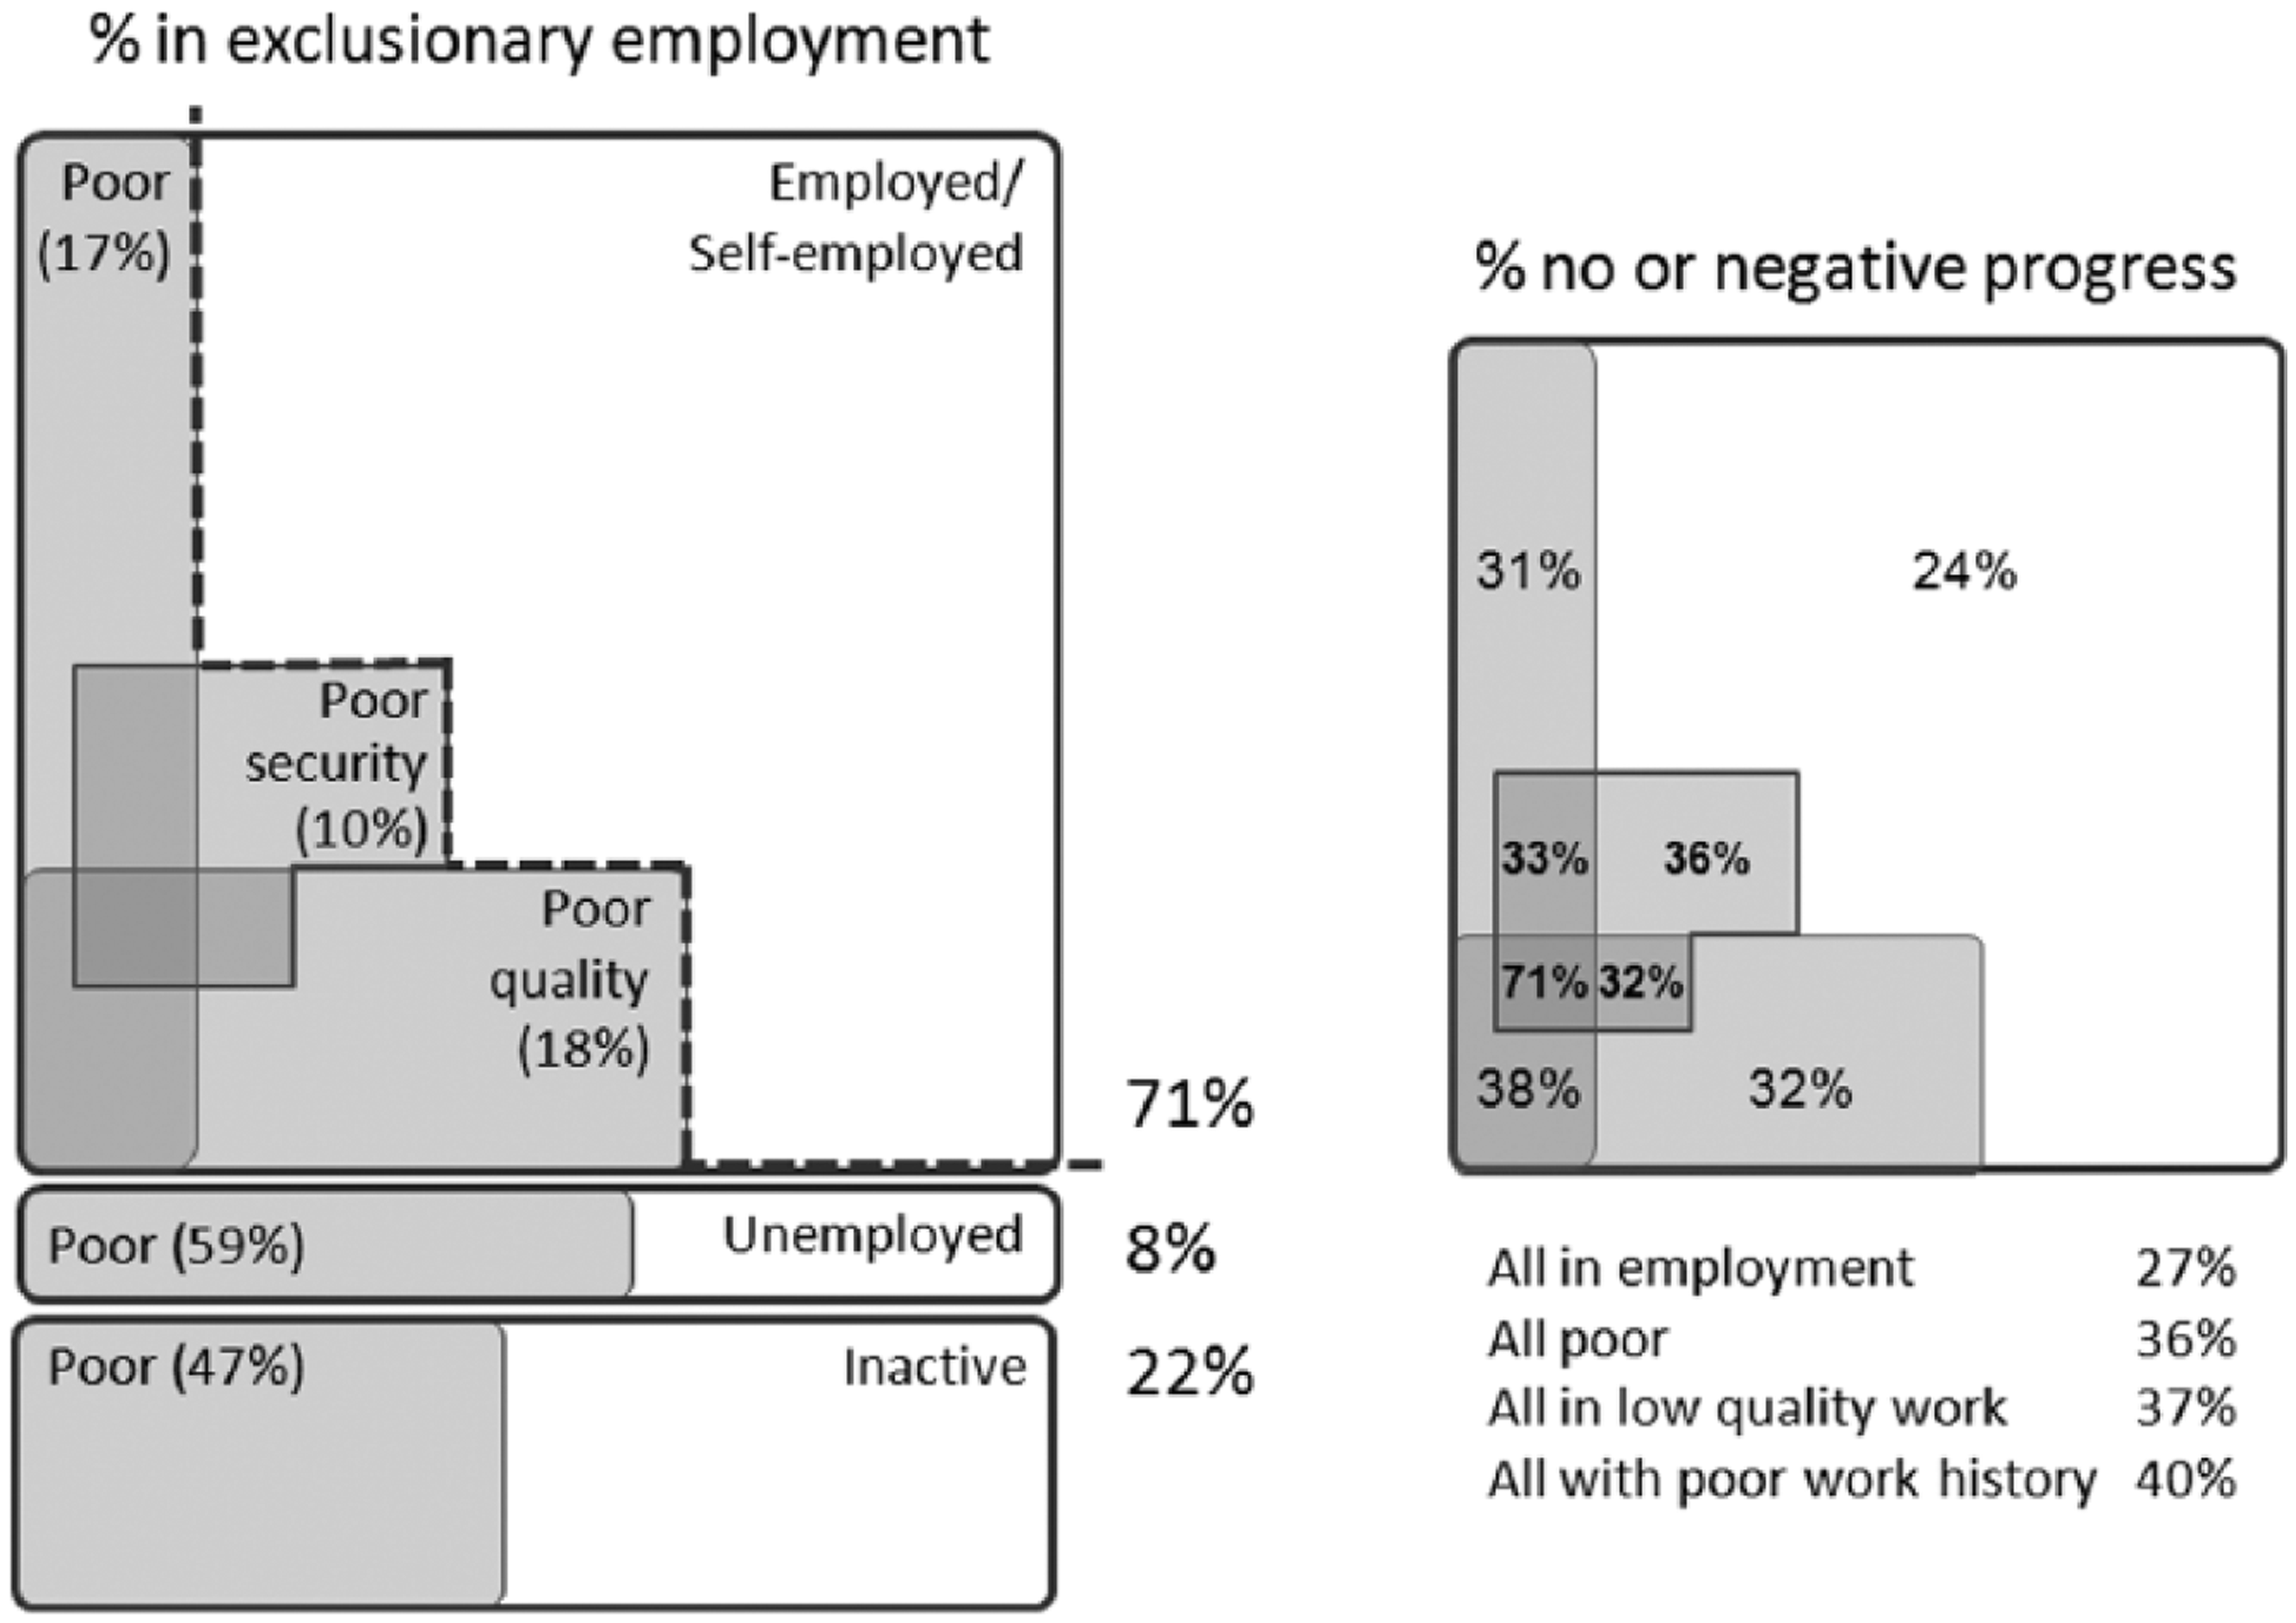
Exclusionary employment and progression.
For the employed group, there are two further shaded boxes, representing the proportion of people in work but excluded in the sense of having either poor quality work or poor security (18 and 10 per cent respectively). These measures are not available for those not currently in employment so are shown only for the employed group.
The overlaps between the boxes are drawn to reflect the proportions suffering exclusion on multiple dimensions. One in three adults in paid work (35 per cent) is ‘excluded’ on at least one of these three measures, with 8 per cent ‘excluded’ on two or more. The overall scale of ‘exclusionary employment’ on this basis may seem high and it should be noted that the selection of measures and thresholds reflects various subjective judgements. On the other hand, selected measures each provide relatively conservative estimates for each dimension; the PSE-UK measure gives the second lowest estimate for poverty while the threshold chosen for the combined low quality measure captures a very similar proportion of the total.
In some respects, the figure might be read as showing that the different dimensions of exclusionary employment are relatively distinct or non-overlapping. For each dimension, less than half of the ‘excluded’ group are also excluded on one of the other two dimensions. On the other hand, the regression models in Table 2 show a high level of commonality in the risk factors across different social groups. All three dimensions are more prevalent among young adults, those with ‘other’ ethnicity, in poorer health, and in semi-routine or routine occupations. Some of the lack of overlap at the individual level may be attributed to ‘noise’ or random error in the measures and to the use of binary divisions of ‘excluded’ versus ‘not’.
At the same time, it is worth paying attention to the differences between the groups which the earlier analysis highlighted. Having children (and particularly being a lone parent) and working part-time both increase the risks of poverty but not of other forms of exclusionary employment. Low levels of qualifications are associated with poverty and with low quality employment but not with insecurity whereas working part-time is associated with insecurity (and poverty) but not low quality.
Progression
As noted in the literature review, the term social exclusion is often said to carry with it a particular focus on the dynamics or durability of states over time, as well as routes into or out of exclusion. The PSE-UK survey is a cross-sectional study but does capture some data on labour market history retrospectively. In particular, it asks those currently in work to assess the extent to which they felt they had progressed over the last five years in terms of levels of skill used, variety of tasks and level of responsibility. One in four people (27 per cent) felt they had made no progress or had gone backwards. A lack of progress was associated with older workers (45+), those not in professional or managerial positions, and part-time working.
The right-hand side of Figure 2 takes the employed group only and, using the same representation of the dimensions of exclusion as the left-hand side of the figure, overlays these with the proportion of respondents in each category who felt they had not ‘progressed’ in the last five years. It shows, therefore, how durable the different states of exclusion appear to be. Beneath the pane, it shows the proportions reporting no progression for all in employment, and for the three forms of exclusion. People in exclusionary employment were more likely than average to report a lack of progress. This affected more than one in three of those working poor or working in low quality employment, and two in five of those with a poor work history. Most strikingly, the greater the number of dimensions of exclusion that someone experiences, the lower their sense of progression is. As exclusion in employment deepens, it appears to become more durable. For those who reported all three forms of exclusionary employment, more than two thirds (71 per cent) reported a lack of progress.
Conclusions and discussion
The aim of this article is to use the PSE-UK survey to measure, for the first time, the overall scale of exclusionary employment. It shows that the UK’s labour market creates a situation where: one in six adults in work is poor in spite of high levels of support for some groups through tax credits; one in six adults is in poor quality work which is unfulfilling in itself and which is likely to be harmful to health and well-being; and one in ten adults appears to be highly insecure, having experienced at least 6 months unemployment in the previous five years. Overall, one in three adults of working age falls into one or more of these categories.
It is particularly striking that a large minority of the working poor are working full-time and/or live in a household with near-full work intensity. These are the people that even the government would recognise as ‘strivers’ yet work still does not pay for them. It is hard to see how ‘more work’ can be the solution to their problems. Rather, it highlights the fundamental problems caused by widening inequalities in pay. The analysis also makes it clear that the problems that people face are broader than those of precarious or unstable employment. Other dimensions of poverty and poor quality of work cannot be reduced to problems of insecurity. They overlap only partially with that category.
Perhaps most striking is the evidence about low levels of progression for those in exclusionary employment. For a substantial minority, exclusionary employment does not appear to be a temporary or transitory state but an enduring condition. And the deeper the exclusion, the more durable the state. The analysis therefore gives one representation of how, for some people, multiple dimensions of exclusion overlap with the potential for much greater harm.
By using Levitas et al.’s (2007) framework, the analysis reinforces the point that social exclusion should not be equated with unemployment. Reflecting back on this framework, however, the analysis suggests the framework might be extended. ‘Quality of working environment’ could be seen as an additional domain, alongside ‘quality of living environment’ which covers the home and neighbourhood. The dimensions of job quality identified above would then be justified on their own merits, alongside other aspects of well-being. Alternatively the conception of ‘living environment’ might be expanded so that it encompasses home, neighbourhood and, for those in employment, workplace.
In policy terms, the analysis points towards the need to move away from a focus on the failings of individuals and to a broad agenda to reform the UK’s labour market. This needs to cover the material rewards of work but also to extend well beyond this. Rather than talking about the need to reduce regulation (BIS, 2011), it requires the kinds of ambition outlined by the Scottish Government (2015) in its revised economic strategy. Its agenda for ‘fair work’ encompasses material rewards, job security and opportunities for development or progression. The focus is on how businesses and managers need to change. They are being invited to pledge themselves to a package of measures, going beyond the Living Wage to include a ban on zero-hours contracts and extensions to workforce engagement practices – and are being offered various forms of government support in return.
One significant limitation of the analysis presented here is that it is based on a single cross-sectional survey. The survey does provide some insights into dynamics through questions on work histories and on labour market progression. These data are based on recall questions, however, which are known to have limitations. Embedding the social exclusion framework developed by the PSE-UK survey into longitudinal surveys could be extremely valuable. Even without this, further analysis of the PSE-UK data could provide insights into the different kinds of ‘exclusionary employment’ and their characteristics or incidences.
Footnotes
Acknowledgements
The PSE-UK survey involved a large team of researchers, led by Professor Dave Gordon at the University of Bristol and including academics from the universities of Birmingham, Bristol, Glasgow, Heriot-Watt, Queen’s Belfast and York, and the Open University. I would like to acknowledge the great collective effort by this team on the design and delivery of the surveys that underpin this analysis, and the many influences they have had on my understanding of issues addressed here.
Funding
This work was supported by the Economic and Social Research Council (RES-060-25-0052).