
Abstract
We question the common description of poverty in Western countries as largely brief and transient and show that the spell-based analyses from which this view stems diverts attention from the bulk of poverty, which is persistent rather than transient. Measures of poverty concentration are suggested. Using Swedish population data spanning 18 years (1990–2007, N (persons*years) = 102,754,809), we can avoid problems that plague poverty research using survey data and can give precise calculations of completed durations without relying on questionable assumptions. The majority of poverty years were experienced by people in long-term poverty: 69 percent of all poverty years over the 18-year period fell on people with 5 years or more in poverty. Half of all poverty years were borne by only 5 percent of the population, meaning that poverty was highly concentrated. This speaks in favour of the social policy efficiency in targeting a small group of long-term poor.
Introduction
The understanding of poverty has been much enhanced by longitudinal survey data during the last decades. With the rise of such data, it became evident that cross-sectional poverty rates gave an imprecise image of ‘the poor’, often unreflectively understood as one static group. Following this dynamic perspective on poverty, it has become popular to emphasize the movements into and out of poverty rather than its persistence, and poverty in Western countries is often described as brief and transient, for example, ‘very widespread but not usually very persistent’ (Corcoran et al., 1985: 516), ‘a brief stage many adults will face at some point during their adult life course’ (Rank and Hirschl, 2001: 749), ‘no more than an episode in the course of life and is actively overcome by most of those afflicted by it’ (Leisering and Leibfried, 1999) or a ‘widely generalized experience’ (p. 9) which most people experience at some point in their life (Beck and Willms, 2004: 102). The focus on transitions has also fuelled popular theories about ‘individualization’ or ‘democratization’ of poverty (Beck and Beck-Gernsheim, 2001; Leisering and Leibfried, 1999).
While it may be correct that a large fraction of the population has incomes that at some point fall below a poverty line, the very fact that the experiences are brief gives them little policy relevance. The real downsides lie with the long-term, persistent or recurrent poverty, and those in brief poverty as defined by the researcher may not even feel poor. Findings from several Western countries suggest that there is, in fact, substantial persistence in poverty (e.g. Biewen, 2006; Devicienti, 2011; Hansen and Wahlberg, 2009; Snel et al., 2013), and although such results have not shone through as much in popular descriptions of contemporary poverty, they are of high policy relevance. Our primary contribution in the current article is to shift the focus towards poverty persistence and the related issue of poverty concentration. As distinct from much of the existing longitudinal research on poverty, we do not linger on analyses of dynamics per se, and the aim here is not to model the causes or covariates of entries to and exits from poverty. 1 Instead, we seek to deepen the understanding and improve on the measurement of poverty persistence and concentration. How many are persistently poor? For how long? How large proportion of the population stands for the bulk of the poverty years? Using this strategy, movements into and out of poverty are studied only as a step towards understanding the persistence of poverty among the poor and in the entire population of poor and non-poor.
We profit from the use of population data for Sweden (N (persons*years) = 102,754,809), data that do not suffer from well-known problems of selective non-response, attrition and recall bias; and because the data are longitudinal, up to 18 years, the problem of censoring becomes muted. On the basis of these data, we can show convincingly that descriptions of poverty as a ‘brief’ or ‘transient’ experience are largely a misperception caused by a focus on inflow cohorts. We demonstrate that poverty is fundamentally concentrated to a small group: 11 percent of the population actually bore 80 percent of all poverty years in Sweden in 1990–2007. And we explain how it can be that while around half of an inflow cohort leaves poverty after 1 year only – a recurrent finding in many countries – half of those in poverty in a given year is in a poverty episode that lasts at least 5 years. We conclude the article highlighting the positive policy conclusions from our analyses: the long-term poor are a small group – around 4 percent of the Swedish population – and therefore relatively easily targeted.
Previous research on poverty in longitudinal perspective
How common is it to be persistently poor? To answer this question, longitudinal data are needed, but different analytical strategies can give very different impressions of the degree of persistence. The study of exit rates by durations is the most common form of longitudinal analysis: people are followed from the poverty entry, and their transitions to non-poverty are observed. The general impression from this approach is of poverty as a largely short-term phenomenon. Regardless of poverty definition, and for a wide range of countries and time periods, results show that around half of those who enter poverty exit within a year (Bane and Ellwood, 1986; Fouarge and Layte, 2005; Fritzell and Henz, 2001; Jenkins, 2000; Oxley et al., 2000; Stevens, 1999), and only a small proportion of each inflow cohort remain in uninterrupted poverty for several years.
The study of exit rates, however, paints too bright a picture if re-entry is not taken into account. Stevens (1994, 1999) found massive re-entry in the United States during the 1970s and 1980s: after 1 year out of poverty, 27 percent returned, and within 5 years of exit, 50 percent had fallen back into poverty. Similarly, Devicienti (2011) found that around one-third of those exiting poverty in Britain returned within a year. For 11 European countries, Damioli (2009) reported that between 21 and 34 percent had re-entered after 1 year out of poverty and between 37 and 62 percent had done so within 5 years. Consequently, single-spell analyses clearly underestimate the persistence of poverty.
Exit and re-entry rates refer to inflow cohorts, which is a rather special reference population and one that is not always intuitive. Expressing poverty persistence in relation to the entire population or to the population of poor people at a given point in time is more relevant in policy terms, and as shown by Bane and Ellwood (1986), the general result is that the long-term poor are a small proportion of an inflow cohort, but a very high proportion of all who are poor at a given point in time. A natural measure of durations among the ‘point-in-time-poor’ is the poverty history, looking back from a given point in time (e.g. the interview date or the year of observation) and saying for how long the currently poor have been poor (e.g. Valletta, 2006). Poverty histories are easy to understand and are in themselves correct, but easily give a misleading impression due to the right-censoring of the data, as many of those who are poor will continue in poverty (Bane and Ellwood, 1986). Poverty histories will thus underestimate the length of poverty spells. To overcome this problem, one can look back and forward from a given point in time and measure concluded poverty episodes from the beginning to the end for those who are currently in poverty. Naturally, this requires long observation windows. As shown by Akerlof and Main (1981) for unemployment, average episodes are twice the length of average histories in the steady state (i.e. if the same macroeconomic conditions hold before and after the point of observation). Estimates of durations (histories and episodes) among the point-in-time-poor are rare in the literature. Bane and Ellwood (1986) estimated (using the Panel Study of Income Dynamics (PSID)) that over half of those poor at a point in time were in an episode of 8 years or more, while only 10 percent were in a 1-year episode. For Germany from 1988 to 1996, Biewen (2006) finds that around 35 percent of those poor in a given year were in an episode of 5 years or more. Thus, when focusing on the point-in-time-poor rather than on inflow cohorts, persistence tends to be the dominating image.
An alternative approach is to summarize poverty experiences over a given period, accounting for multiple spells regardless of when poverty spells started. For example, Duncan (1984: Table 2.1) finds that only 0.7 percent of the US population (as estimated in PSID) were poor in 10 out of the 10 observed years (using the official US poverty line). Using a UK sample (British Household Panel Survey (BHPS)) and defining poverty as <60 percent of median income, Devicienti (2001) shows that 5–6 percent of the population were poor 5 years or more out of 8, and Jenkins (2011) finds that 10–15 percent were poor 3 or 4 out of 4 years (with the proportion decreasing from the end of the 1990s). Looking at several Western countries, Oxley et al. (2000) find that between 1 percent (Sweden) and 6 percent (United States) of the population had been poor (<60 percent of median income) for all of the 6 observed years. Focusing on the working-age Swedish population, Hansen and Wahlberg (2009) show that 9 percent of the population, or 41–45 percent of those ever-poor, in the native population were poor for at least 5 out of 11 observed years (absolute poverty measure). Persistence was clearly higher among immigrants.
When summarizing poverty experiences over time, results depend heavily on the length of the observation window and are highly sensitive to censoring. This kind of analysis will almost inevitably underestimate the number of long spells. For example, the only 10-year spells that will be observed as such in a 10-year period are those that started during the first observed year because all 10-year spells starting before or after the first observed year will be observed as shorter spells due to the censoring set by the time-frame. Biewen (2006) shows that 2–3 percent of the sample (German Socio-Economic Panel (GSOEP) are poor for 5 or more years out of 10, but when simulating durations from exit and entry rates to eliminate the impact of censoring, he estimates a corresponding rate of 7 percent (although noting that the true number is likely to be lower).
Rank and Hirschl (1999) take a different perspective by summarizing cumulative poverty experiences by age (20–85 years) among individuals in PSID 1968–1992. They estimate that 27 percent had experienced some poverty by age 30, and around half of the population had experienced it by age 65. However, these estimates are not based on actual poverty experiences, as individuals are only observed for parts of the age span, so estimates depend on assumptions about homogeneity in poverty distributions over different cohorts. In addition, for such an analysis, PSID is a small data material.
The Swedish context
The availability of high-quality population data makes it ideal to study poverty durations for the case of Sweden. At first sight, one may believe that Sweden, as a classic example of a social-democratic welfare state (Esping-Andersen, 1990), may be somewhat of an outlier when it comes to poverty, and (absolute and relative) poverty rates are certainly lower than in most, but not all, Western countries (Eurostat, 2009; Notten and De Neuborg, 2011; Smeeding, 2006). The low relative poverty rates are mostly due to an even income distribution, and with a comprehensive welfare state, redistribution policies and a large public sector (e.g. fee-free schools, free healthcare and heavily subsidized daycare), absolute poverty is also held at bay. However, the consequences of such factors for poverty dynamics and durations are not self-evident (Fritzell, 1990). In fact, the central patterns of poverty dynamics are to a large extent similar across nations, while the levels often differ (e.g. Duncan et al., 1993; Oxley et al., 2000), so there may still be a lot to learn from the case of Sweden. Our results will in fact point to some patterns and regularities in poverty dynamics that are of a general kind.
The time period we study (1990–2007) spans boom and bust, with a deep recession in 1992–1996 and recovery and growth in the following period. Figure 1 shows cross-sectional poverty over the period using different poverty indicators, revealing strikingly disparate trends for absolute poverty (reflecting a fixed purchasing power over time, for detailed definition, see the ‘Data and the poverty definition’ section) and relative poverty rates using the standard limits of 50 and 60 percent of national median disposable income. During the economic recovery, real incomes increased across the income distribution, but it increased more at the median than at the bottom, meaning that the poorest saw an increase in purchasing power but at the same time slid more behind median income (for similar findings from Ireland, see Layte et al., 2001).
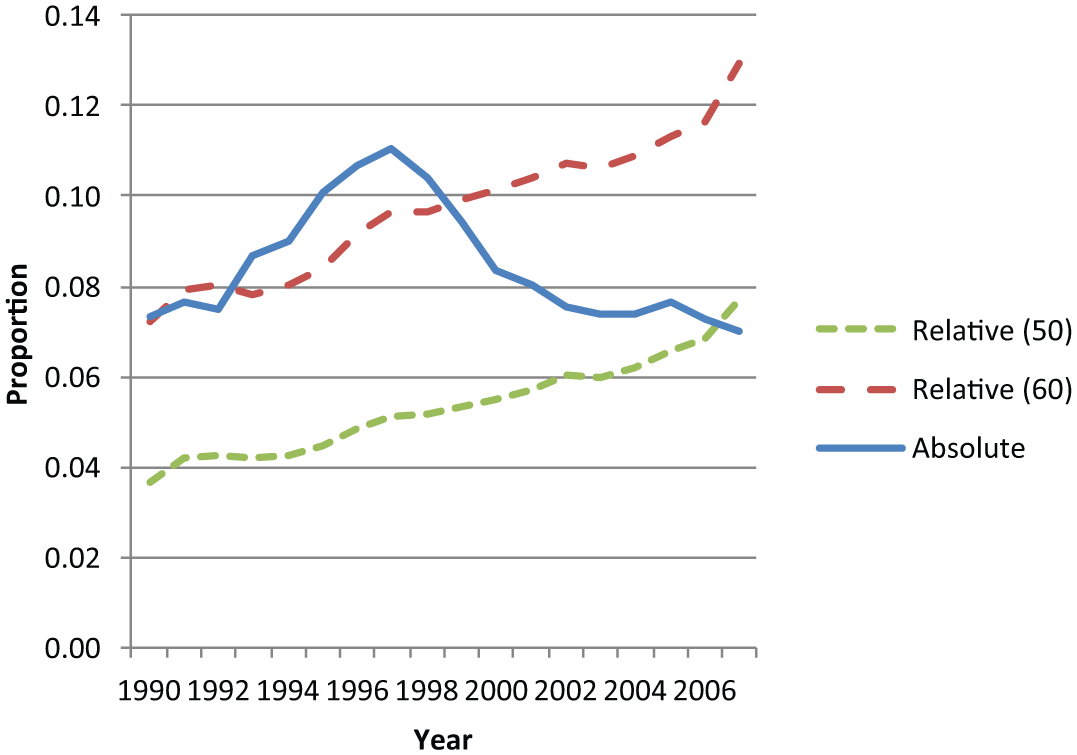
Cross-sectional absolute and relative (50 and 60 percent of median) poverty 1990–2007, ages 16–75 in own households).
The fluctuations in cross-sectional absolute poverty over the period have predominantly reflected changes in outflow rates, while yearly inflow to poverty has been more stable. In other words, persistence has been higher when cross-sectional poverty is higher, and long-term poverty and cross-sectional poverty have followed similar trends (Jonsson et al., 2013). In this article, we will, however, not deal with business cycle effects, but we will sum over the whole time period to get estimates of persistence that average over several business cycles (something that is important but rarely done in the previous literature).
Data and the poverty definition
Longitudinal survey data have vastly increased our understanding of poverty dynamics.
2
However, as discussed by many observers (e.g. Cellini et al., 2008), longitudinal poverty analyses of survey data are nonetheless hampered by severe, and almost insurmountable, problems. Selective non-response, measurement error in incomes and recall bias loom large in survey data, and mobility into and out of poverty will be severely overestimated in the presence of such problems (Breen and Moisio, 2004). The literature furthermore suffers from small samples and panel attrition, necessitating the use of complex statistical models and heroic, and not always well-founded, assumptions to make up for data deficiencies. As pointed out by Bane and Ellwood (1986), The ideal methodology for examining durations of spells of poverty and the characteristics of spells of various lengths would utilize an extremely large data set covering a very long period of time. With such a data set, one could simply tabulate the actual distribution of completed spells for people who began a spell in some previous year long in the past. One could also tabulate the distribution of completed spells for those people who were poor at some time in the past. Unfortunately, such a dataset does not exist. (p. 6)
In this article, we use population register data that are not a far cry from the ideal condition described by Bane and Ellwood. The data come from the LISA database (Statistics Sweden, 2011) and cover the entire Swedish population aged 16–75 years during 1990–2007 (the number of person-years used here is 102,754,809, with 7,989,847 persons observed for an average of 13 years). The database coordinates records from various population registers, covering, for example, incomes, education and family events, and the data are made available through the Sweden over time – activities and relations (STAR) project, administered by Statistics Sweden for the Swedish Institute for Social Research (SOFI). As the data come from population registers, we can almost entirely avoid problems of small n, attrition and non-response; and although censoring is unavoidable, we benefit from very long observation windows. The completeness of the data allows transparent analyses and obviates the need for complex methods that build on questionable assumptions. 3
Poverty is defined based on calendar year household incomes, which means that if the incomes for the rest of the year are high enough to bring the annual income above the poverty line, we may miss short (and probably not so significant) poverty episodes; in addition, we do not know the exact monthly length of spells. For immigrants, the poverty line during the first calendar year in Sweden is defined by dividing the annual income poverty line by 12 and multiplying it by the number of months of residence in Sweden. We use disposable income, which includes all income from work and benefits and subtracts tax. Household incomes that are zero or negative (0.8 percent of the population) have been coded missing for reliability reasons. True zero disposable incomes are very unlikely in Sweden due to the many available cash benefits (e.g. universal parental and sickness insurance, social assistance (SA), unemployment insurance) and an unknown proportion of those with zero incomes no longer live in Sweden.
In the United States, poverty is generally measured using an absolute poverty line, whereas European researchers most commonly use a relative definition of poverty (with 60 percent of the national median being the European Union (EU) standard poverty line and 50 percent the Organisation for Economic Co-operation and Development (OECD) one). For the sake of brevity, our analyses of poverty persistence show only the analyses of absolute poverty. This measure is chosen because dynamics of absolute poverty are somewhat more straightforward to interpret as they reflect only changes in the purchasing power of the individual, while dynamics of relative poverty reflect changes also in other people’s incomes. For example, people may remain in or even enter relative poverty even though their real incomes increase substantially, if only others’ real incomes increase even more.
As seen in Figure 1, absolute and relative measures of poverty give contradictory images of the change in cross-sectional poverty over the period. To assess the sensitivity of our results to the chosen poverty definition, we carried out all analyses in this article also using relative poverty definitions. The results using the 60-percent relative poverty line give results very similar to the ones using the absolute poverty measure, but the 50-percent relative poverty line gives clearly lower levels of persistence. The explanation is that the 50-percent poverty line delimits a much smaller fraction of the income distribution, meaning that there is a larger range of incomes that signify a move out of poverty. Thus, persistence increases when the poverty threshold is higher. 4
The absolute poverty definition is based on a calculation of the poverty line defined as the inflation-adjusted norm for SA that applied to the years 1985–1995. This definition is common in Sweden and is also known as low income standard (Jansson, 2000; Socialstyrelsen (National Board of Health and Welfare), 2008). The idea in Swedish social policy is that SA should guarantee an adequate living standard, and therefore, the eligibility limit for SA is a poverty line of obvious relevance. The SA norm in 1985–1995 was based on an estimate (by Konsumentverket, an independent state bureau) of an acceptable living standard, covering the costs for a comprehensive ‘basket’ of goods and services deemed necessary (such as housing, clothing, healthcare, radio and TV, daily paper, telephone, insurances) for a household of a particular size and composition. In 1995, some goods and services were removed and instead made subject to individual assessment, which makes later norms more difficult to use.
The basket is thus the same over the entire period studied, but adjusted annually with the consumer price index (CPI) to compensate for inflation and deflation, and the poverty line is defined as this basket plus estimated costs for housing and journeys to and from work, the calculation of which depends on region of residence, year and household composition. The poverty line thus defined in Sweden represents a purchasing power considerably higher than the absolute (Orshansky) poverty measure traditionally used in the United States. By inflating the poverty threshold only with CPI (leaving the basket unchanged), it is possible that the measure gets somewhat dated over time. However, poverty lines based on later SA norms are close to the inflation-adjusted 1985–1995 norm, meaning that the income required for an adequate basket of goods and services has not changed much between 1985 and 2007. 5
Individuals are here defined as poor if their annual household disposable income falls below the absolute poverty line. One-year spells out of poverty are not considered as exits from poverty in the analyses if income during that year is below 110 percent of the poverty line. We analyse poverty at the individual level, but because disposable household income is used to define poverty, all persons in the same household in a given year are assigned the same income and the same poverty status. Those who still live in their parental household are excluded.
The handling of censored spells is crucial in analysing poverty durations. Because people’s poverty states are unobservable before the observation period starts (left-censoring) and/or after it ends (right-censoring), one cannot infer the exact length of any ongoing spells at the beginning/end of the observation period nor the total sum of poverty experiences for people’s entire lifetimes. In survey data, people can choose to drop out of the survey (attrition), which means that censoring becomes a serious problem for the estimation of completed durations. By contrast,censoring in our data is only caused by the natural time-frames of the data and by entries or exits to the population of interest (death, immigration/ emigration, reaching the lower (16) or upper (75) age limit, or moving out of the parental home). We handle this censoring in different ways depending on the question at hand, and we describe the strategy we use when relevant for each analysis.
Results
As discussed above, there are different ways of analysing poverty persistence, and there are subtle but important differences in their underlying questions. We will cover the more common types of analyses (e.g. exit and re-entry) and less common types of analyses (e.g. poverty histories and episodes), and we will also propose new ways of analysing poverty concentration.
Outflow from poverty
Analyses of outflow are concerned with the proportion that remains in poverty for a certain number of years after the start of the poverty spell. Figure 2 shows this analysis for the period 1991–2007, where we have taken the average of the proportion that remains each year after the poverty entry – in essence, Figure 2 represents the typical outflow from poverty for the period in question. 6 As in most analyses of this kind, left-censored spells are excluded but right-censored spells remain in the analysis until the censored year. For each duration, the average proportion is calculated among all those who entered poverty in 1991–2007 and who still remain in the population (within the age limit) at this duration. If someone who exits poverty falls below the poverty line again, the second episode is counted as a new episode with a new start-year (the analysis is thus based on poverty episodes, not individuals).
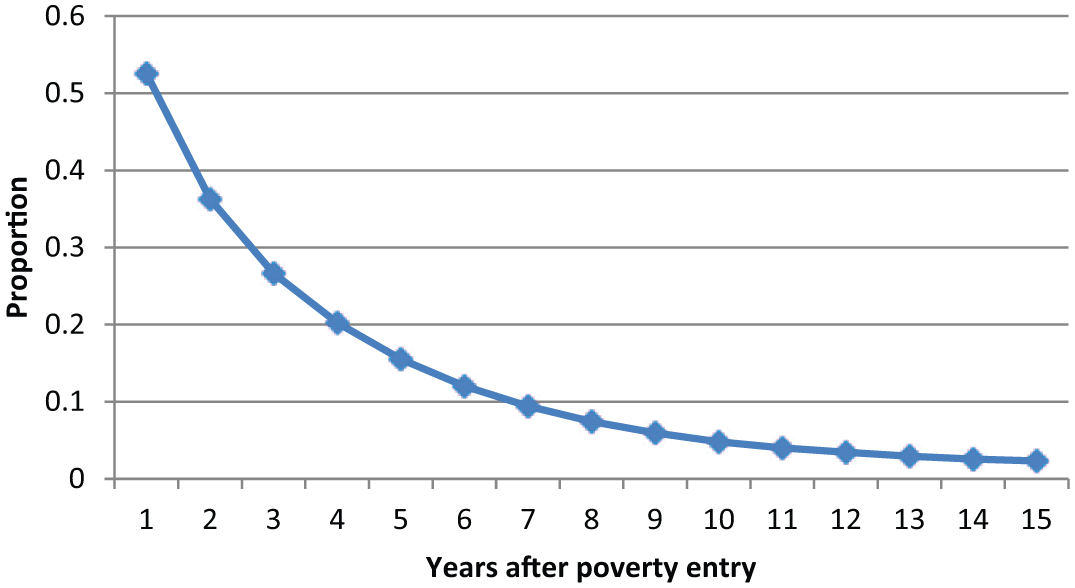
Outflow from poverty. Proportion of inflow cohorts that remains in uninterrupted poverty by years since inflow. Cohorts with inflow years 1991–2006. Persons aged 16–75 years in own households.
Figure 2 demonstrates that outflow is in general rather quick: around half of all spells end within a year. After 4 years, on average, around 20 percent remain in poverty, and after 10 years, only around 5 percent remain. The total annual exit rate is typically between 25 and 30 percent, which is similar to results found in the United States (summarized by Cellini et al., 2008). The pattern shown by the outflow analysis in Figure 2 is in fact the familiar one seen from several other countries (e.g. Oxley et al., 2000): most poverty spells that start during the period are brief, and only a small proportion of those who enter poverty stay in uninterrupted poverty over many years. This analysis is relevant if we wish to predict the probability to remain in poverty among those becoming poor. In addition, the analysis is a natural starting point for multivariate analyses aiming to understand which factors affect the probability of poverty exits. However, the focus of this approach is exits from poverty among inflow cohorts, and it does not inform us about durations in the population of all poor, nor in the population of both poor and non-poor. In the following, we therefore expand on the types of analyses in order to give a fuller picture of poverty durations.
Poverty histories and episodes
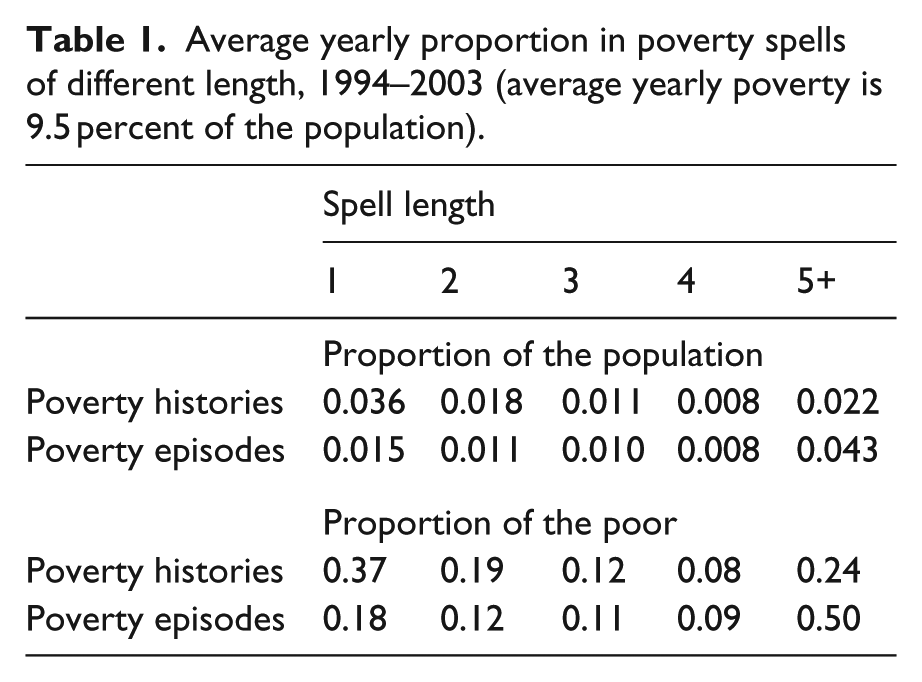
When expressing poverty durations in relation to all poor in a year, or to the total population in a year, estimates depend strongly on whether durations are defined as histories (e.g. right-censored) or as completed episodes. Table 1 shows averages of both measures over the years 1994–2003, 7 and the difference is dramatic: on average, 24 percent of the poor in a given year had been poor at least 5 years (poverty history), but 50 percent of the poor were in a spell of 5 years or more (poverty episode). Similarly, 37 percent of the poor were in their first year of poverty, but only 18 percent were in a 1-year episode. This is because many of those with a 1-year history of poverty will continue in poverty one or more years after the observation year. Expressed as a proportion of the entire population, 4.3 percent have episodes of 5 years or more, but only 2.2 percent have a poverty history of 5 years or more.
Average yearly proportion in poverty spells of different length, 1994–2003 (average yearly poverty is 9.5 percent of the population).
Re-entry to poverty
Outflow from poverty is in many cases temporary. In Figure 3, we define re-entry as having had at least one new experience of annual poverty in a given period – far from all of these new poverty spells consist of new uninterrupted poverty spells. Figure 3 is constructed as Figure 2, but shows the duration of non-poverty after poverty exit (year 0). We can see in Figure 3 that after 5 years, 34 percent of those who exited poverty have experienced it again. 8
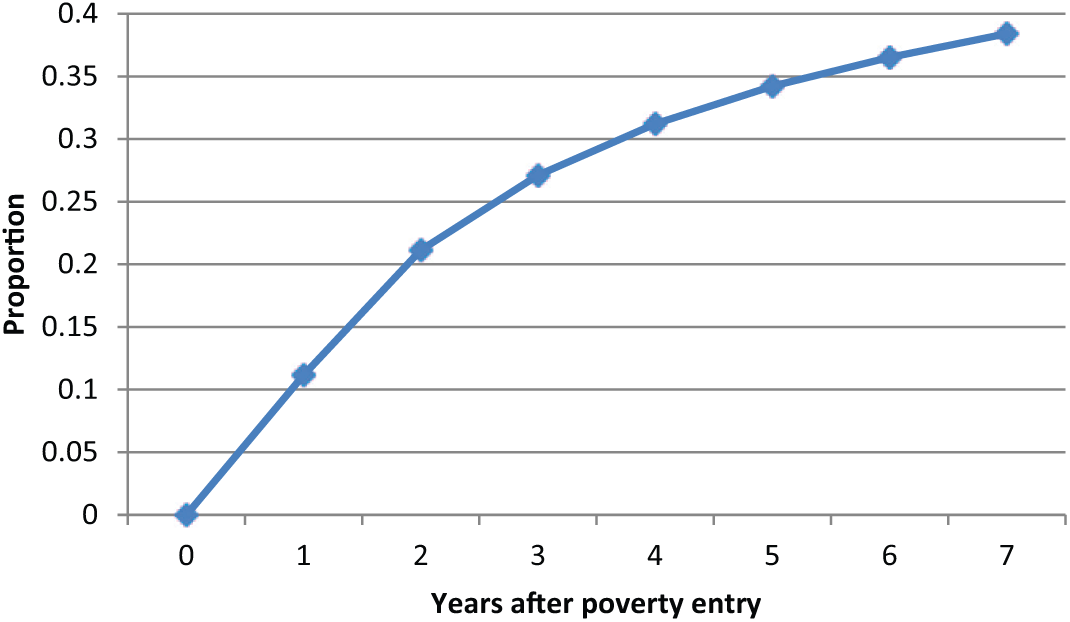
Re-entry into poverty. Proportion of outflow cohorts that have re-entered poverty by years since outflow. Cohorts with inflow years 1991–2006. Persons aged 16–75 years in own households.
Cumulative experience of poverty after poverty entry
The high re-entry rates are primarily interesting as a step towards understanding the total experience of poverty over multiple spells. We can synthesize the results on outflow and re-entry by counting the cumulative number of years in poverty (with or without interruptions) within a given time after the first observed poverty entry. In Figure 4, we set the observation window to 10 years after the first observed inflow. It is clear that this measure suggests much more rigidity in poverty status than the single-spell persistence in Figure 2. Figure 4 reveals that 30 percent of those who enter poverty experience only this single year in poverty in the following 10 years, but 29 percent experience at least 5 years of poverty, in one or multiple spells during the following 10 years. Thus, while poverty for some of those who experience it really is a swift and temporary occurrence, for an equal share, it is an enduring or recurrent experience.
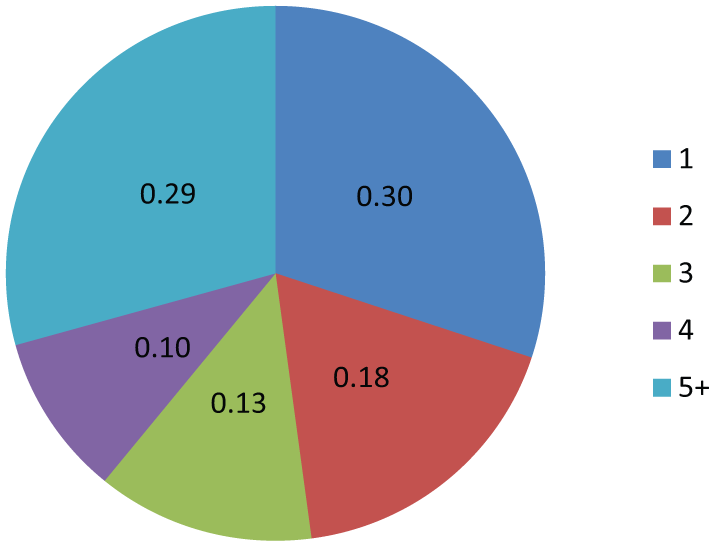
Proportions with different number of years in poverty 10 years after first observed poverty entry. Cohorts with inflow years 1991–1998. Persons aged 16–75 years in own households.
Multi-spell poverty in the population
Figure 4 expressed multi-spell poverty within a time-frame after poverty entry (i.e. for inflow cohorts). As described above, one can also sum total experiences of poverty in the population over a given period regardless of entry year, showing, for example, how many are poor in 1–10 out of 10 years (Duncan, 1984: Table 2.1), or 1–6 out of 6 years (Oxley et al., 2000). This is an intuitive measure, but the quality of it is highly dependent on censoring and the rate of attrition: the shorter the observation period and the more people who drop out of the panel, the more we underestimate the length of poverty experiences. Simply put, the larger the span of years observed, the more we can capture of the potential poverty years in individuals’ lives.
The maximum period that people in our data can be observed is 18 years (1990–2007), and given that we have no attrition from the population of interest, 9 we can provide uniquely reliable distributions of total poverty experiences over a long period. In order to minimize censoring problems, we here use the balanced population that has been observed during all 18 years 1990–2007 and thus have the same number of potential poverty years. This means that only those aged 16 or over in 1990 are included, and no immigrants arriving after 1990, since these cannot be observed for all the 18 years. The population aged 16–75 years in own households in 2007 is 5,937,719, and 61 percent (3,616,917) of these have been observed outside the parental household for all years since 1990. The results are thus representative only for this group and not for those who turned 16, moved out of the parental home, or immigrated after 1990, nor for those who turned 75 or emigrated before 2007. 10
Figure 5 shows the accumulated number of calendar years in poverty in this population (leftmost bar), among the ever-poor (middle bar), and calculated in terms of poverty years instead of poverty spells (rightmost bar). We learn that in the population, 76 percent had no calendar year with incomes below the poverty line over the 18 years. Those who were poor for 10 years or more constituted 3 percent of the population and 11 percent of all who were ever poor, 11 but because they were poor for so long, their time in poverty represents 33 percent of the total number of years spent in poverty. As much as 69 percent of all years in poverty was borne by the group of people with 5 years or more in poverty. And correspondingly, those who were poor only 1 year were 32 percent of the ever-poor, but their years in poverty represented only 8 percent of all years spent in poverty.
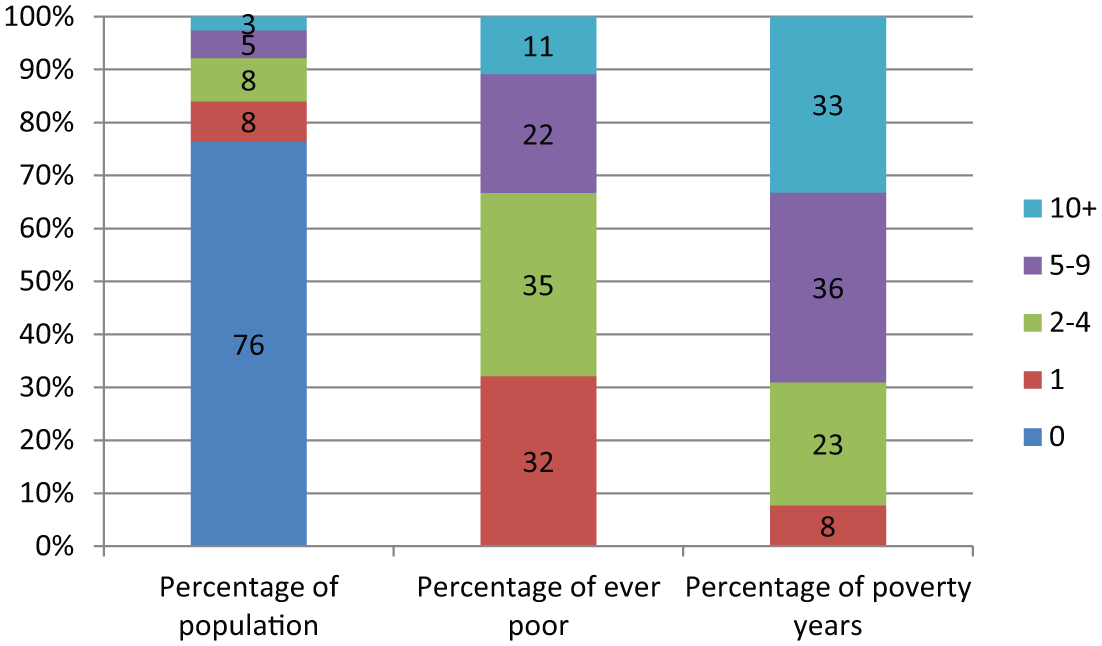
Accumulated poverty experience for the population observed all years 1990–2007, as a percentage of population, ever-poor and poverty years. N = 3,616,917.
Although 18 years is a long period of time, it must be kept in mind that the data are not free from censoring. We do not know the length of spells that are ongoing in 1990 and 2007, so the sum of poverty experiences would naturally increase if more observation years were added, and the proportion with no poverty experience would decrease. Nevertheless, the long observation window and lack of attrition mean that the results in Figure 5 are far less affected by censoring than is commonly the case.
Poverty concentration
From Figure 5, it is clear that the distribution of poverty experiences is heavily skewed: a small proportion of the population bears a large proportion of the time in poverty. This skewness can be visualized more comprehensively by fitting Lorenz curves. Such curves are common in the description of income inequality, but can be used to show inequality of other outcomes, such as poverty years. Figure 6 gives the cumulative proportion of all poverty years on the y-axis and the cumulative proportion of all individuals on the x-axis, and the diagonal gives a hypothetical reference point which would hold if everyone in the population had equal numbers of years in poverty (e.g. if there were complete ‘democratization’ of poverty experiences). The population is the same as in Figure 5, namely, all individuals who were in the population during the entire 18-year period, and the total sum of poverty years is calculated for this balanced population during this period. The upper curve in Figure 6 relates the distribution of poverty years to the entire population, while the lower curve relates it only to those who have experienced some poverty during the period. The curves correspond to Gini-coefficients of 0.87 (upper curve) and 0.47 (lower curve).
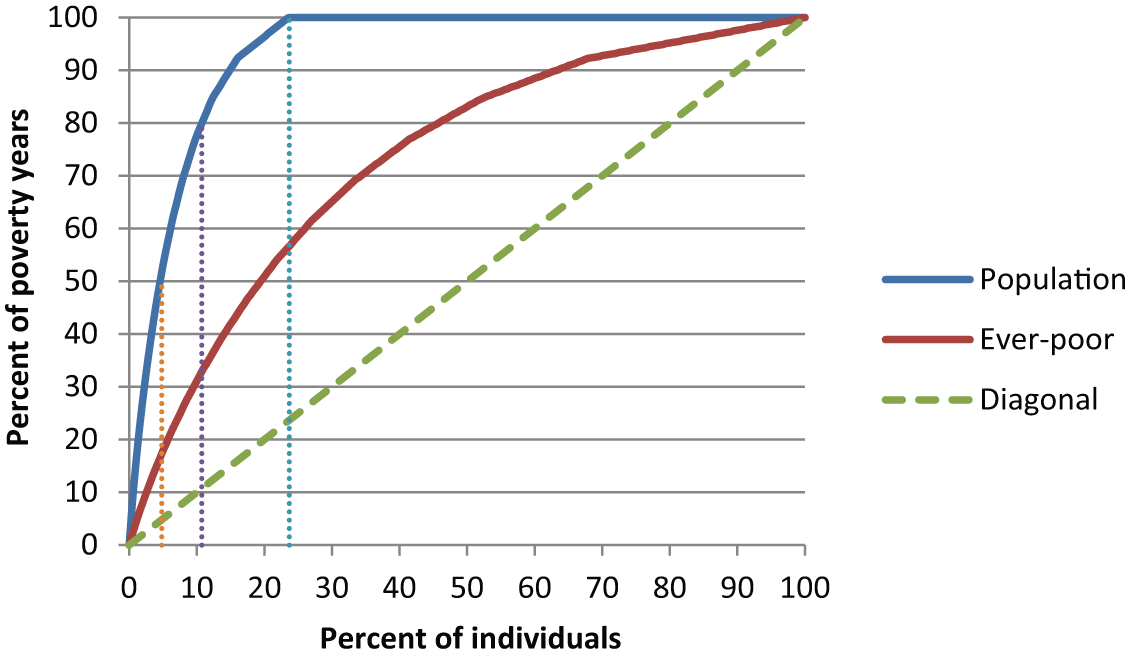
Lorenz curve of poverty years. Cumulative proportion of all poverty years by cumulative proportion of all individuals in the population (blue line) and among ever-poor (red line).
As in Figure 5, we see that all poverty years are accounted for by 24 percent of the population, while 76 percent never experienced poverty during this 18-year period. Figure 6 verifies that the burden of poverty is far from equally shared: 50 percent of all poverty years were borne by 5 percent of the population (or 20 percent of those who had some experience of poverty), and 80 percent of all poverty years were borne by 11 percent of the population (45 percent of the ever-poor).
Is poverty long or short?
Our results confirm the finding that many poverty spells are short: half of those who enter poverty exit within a year. However, re-entry to poverty is common, meaning that poverty experiences are longer than poverty spells. In addition, most people who are in poverty in a given year are in a long-term poverty spell, and a large majority of poverty years are experienced by the long-term poor.
An essential distinction is whether weight is given to poverty spells or poverty years. The inflow cohort/spell approach shows the proportion of all spells (that started a given year or during a given period) that are of a certain length, which means that each spell has a weight of 1 regardless of its length. The alternative is to take the proportion of all poverty years (during a period) that are spent in episodes of a certain length. The duration of poverty episodes among the poor in a given year is a poverty-year weighted measure because long episodes will have a larger likelihood to be observed in any given year, and spells are thus in effect weighted by their length. The spell-weighted and the year-weighted perspectives are both correct per se, but as their results appear contradictory, they are not exchangeable and they differ in the underlying questions that they inform us about. While the technical difference between these measures was pointed out already by Bane and Ellwood (1986), the confusion remains: when showing both measures, people are left with the paradoxical impression that poverty is both predominantly long and predominantly short. It is necessary to take one step further and discuss the different questions to which the two measures speak.
The growing dominance of the ‘spell-perspective’ may be partly explained by an ambition to de-stigmatize the poor, as it puts the light on the large number of brief spells and the fact that a large part of the population falls under the poverty line at some point in time. For example, Rank and Hirschl (1999) argue, Much of the general public’s resistance toward assisting poor people and particularly those on welfare is that … their poverty is the result of a lack of motivation, questionable morals, and so on. In short, poor people are fundamentally different from the rest of us and, therefore, do not warrant sacrifices on our behalf … [O]ur analysis suggests that given its widespread nature, poverty appears systematic to our economic structure. In short, we have met the enemy, and they are us. (p. 214)
From a policy perspective, this conclusion is, however, misleading, as the emphasis on the many brief spells diverts the attention from the bulk of poverty. Discussing unemployment, Akerlof and Main (1981) argue, For the application of economic theory to the problems of unemployment, the less misleading statistic to our mind is not the length of the average spell of unemployment but, rather, the average length of spell in which time unemployed is spent. The existence of many short spells is of little consequence if the very shortness of these spells means that they do not contribute much to total unemployment. (p. 1010)
This, we believe, goes for poverty as well: while the spell-weighted perspective speaks to questions about the distribution of poverty durations for someone who enters poverty, it is misleading if it is understood as the distribution of poverty durations for those who are in poverty. If our interest is in the poor and not only the newly poor (and this must surely be true for social policy), measures that are year-weighted are more relevant to study as they concern poverty durations among all poor. Put differently, the central difference between spell-weighted and year-weighted measures is the weight given to time in poverty, with year-weighted measures giving weight to all years in poverty while spell-weighted measures give equal weight to all poverty spells regardless of their length. Paradoxically, much of the longitudinal literature has given too little weight to time in poverty because of its strong focus on poverty spells in inflow cohorts.
Conclusion
We address the issue of poverty persistence and concentration by using Swedish population data which overcome most problems plaguing this research field: small n, attrition and low response rates. We replicate the common finding that most poverty spells are brief: around half of all spells end within 1 calendar year. However, while this is true, it is an incomplete portrayal of poverty dynamics that tends to give a too optimistic impression of the prevalence of long-term poverty. Our further analyses show that these brief spells make up just a small fraction of all poverty experienced in the population over the 18-year period that we study: only 9 percent of all years spent in poverty were contributed by persons that had no more than 1 calendar year of poverty. The burden of poverty and its individual and societal costs lies not primarily on the short-term poor but on the persistently (and recurrently) poor: in fact, 5 percent of the population account for 50 percent of all poverty years in our data. The pattern of these results is relevant even for those not specifically interested in the Swedish case. Although the distribution of durations no doubt differ across countries, many of our results are general as they concern the logical relation between different measures: for example, spell-weighted measures will always suggest much shorter durations than year-weighted measures.
It is a popular view today that poverty is ‘democratized’ and ‘individualized’ (Beck and Beck-Gernsheim, 2001; Leisering and Leibfried, 1999). According to this thesis, poverty is a widely shared risk that varies within individual life courses rather than between individuals – a ‘mainstream event’ (Rank and Hirschl, 1999: 212) that affects most people now and then rather than some people often or for a long period of time. However, our analyses demonstrate quite convincingly that persistence, not transience, is the dominating experience in the group of poor in Sweden in any year. Most poverty falls on relatively few persons who are poor for a long time.
Our results speak directly to anti-poverty policy. The view of poverty as a widely shared and brief experience may lead to a preference for bridging programmes emphasizing short-term monetary support, which would be ill-fitted for those experiencing the bulk of poverty. More appropriate programmes are likely to be those that target the persistently poor with a long-term focus on structural life-changes and support that is not only monetary in nature but may potentially be directed towards, for example, skill development, housing and health. The fact that around half of those who ever enter poverty exit it within a year shows that many have been or will be touched by poverty briefly at some point, but it is questionable whether this group is of much interest for policy. Many of those with brief poverty spells may not even feel poor (after all, poverty definitions are to some extent arbitrary), and many will have the economic buffer to see such a short spell through.
It has been argued that if many people have experienced or realize that they may experience poverty, this can increase the support for anti-poverty policies (Rank and Hirschl, 1999) and possibly also the empathy with the poor. However, the persistently poor will suffer a very different level of hardship than the temporarily poor, so it is unlikely that there would be a sense of shared experience.
Although it is crucial to distinguish between the spell-weighted and the year-weighted perspectives, it is also important to keep in mind that the most relevant questions often go beyond both these perspectives and ask for the extent of long-term poverty in the population. The distribution of durations among the poor is not very informative without some reference to the entire population of poor and non-poor – the social policy relevance of the latter being obvious. We find that over 2 percent of the population in a given year have spent 5 years or more in poverty (poverty history), but if we take into account that many will continue in poverty after the year of observation, over 4 percent of the Swedish population in a given year is in a poverty episode of 5 years or more. This is a modest-sized group, but as noted above, they stand for a very large proportion of all poverty years – and while the group size may be bigger in more unequal or poorer countries, it is likely that the importance of poverty concentration is quite general. From Figure 5, it is clear that the distribution of poverty is highly unequal, with 76 percent of the population not experiencing any poverty at all in an 18-year window, and a very small fraction experiencing long periods of it. Poverty, just like wealth, is thus concentrated rather than widespread. But at the same time as the concentration reflects large inequalities in the population, it also opens up a possibility of targeting a small group for policy intervention.
Footnotes
Acknowledgements
The author thanks Jan O Jonsson, Erik Bihagen and the anonymous reviewers for helpful comments.
Funding
This research received funding from The Swedish Foundation for Humanities and Social Sciences (RJ) and The Swedish Research Council for Health, Working Life and Welfare (FAS).