
Abstract
Introduction
The World Health Organization estimates that the global population of adults over 65 is expected to double by 2050 (United Nations, 2020). This demographic shift, coupled with the cognitive decline that accompanies ageing, and the rise of Alzheimer's disease, the leading cause of dementia, presents a growing public health crisis (Alzheimer's Association, 2024). In Ireland alone, approximately 64,000 individuals currently live with dementia, a number that is expected to triple by 2050, highlighting the urgent need for effective prevention and intervention strategies (Pierse et al., 2019).
Studies now suggest that environmental factors, lifestyle choices and stress-induced inflammatory processes are significant contributors to cognitive decline in ageing (Sarubbo et al., 2018). Lifestyle factors linked to chronic inflammation may exacerbate neuroinflammatory processes associated with ageing and consequently contribute to cognitive decline. For example, a high body mass index (BMI) contributes to chronic low-grade inflammation (Esser et al., 2014) and is associated with white matter atrophy throughout the brain (Shefer et al., 2013) and poorer performance in memory and verbal fluency tasks (Gunstad et al., 2010). In contrast, physical activity has been shown to counteract inflammation (Ertek and Cicero, 2012) and exert neuroprotective benefits, potentially delaying or mitigating cognitive deterioration in older adults (Blondell et al., 2014; Kennedy et al., 2017).
Nutritional status also plays a pivotal role in the ageing brain. Diets rich in refined carbohydrates, saturated fats and trans-fatty acids have been associated with increased chronic low-grade inflammation, higher BMI (Asensi et al., 2023; Buyken et al., 2014; Ruiz-Núñez et al., 2016) and cognitive impairment (Barnard et al., 2014; Hawkins et al., 2018). In addition, deficiencies in essential micronutrients, including minerals and trace elements have been linked to inflammatory processes and cognitive decline in older adults (Bao et al., 2010; Huskisson et al., 2007; Sahebari et al., 2019; Sanna et al., 2018; Xin et al., 2015). However, despite growing evidence supporting the role of diet and lifestyle in cognitive ageing, the precise interactions between dietary intake, physical activity, inflammation and cognitive function remains poorly understood.
Given the increasing burden of cognitive decline and dementia, identifying modifiable lifestyle factors is crucial for developing targeted interventions to promote healthy ageing. The present pilot study aimed to examine the relationship between dietary constituents, BMI, physical activity, systemic inflammation and cognitive function in a cohort of healthy older aged adults. An understanding of these interactions may inform nutritional and lifestyle strategies to support cognitive health and improve quality of life in ageing populations.
Subjects and methods
Study population
Approximately 500 individuals aged 65–85 years were identified and provided with information about the study through community-based recruitment in outpatient waiting rooms, retirement clubs and related events. Of these, 50 individuals (Figure 1) expressed interest and were invited for formal screening based on apparent eligibility, including age, general good health and availability.
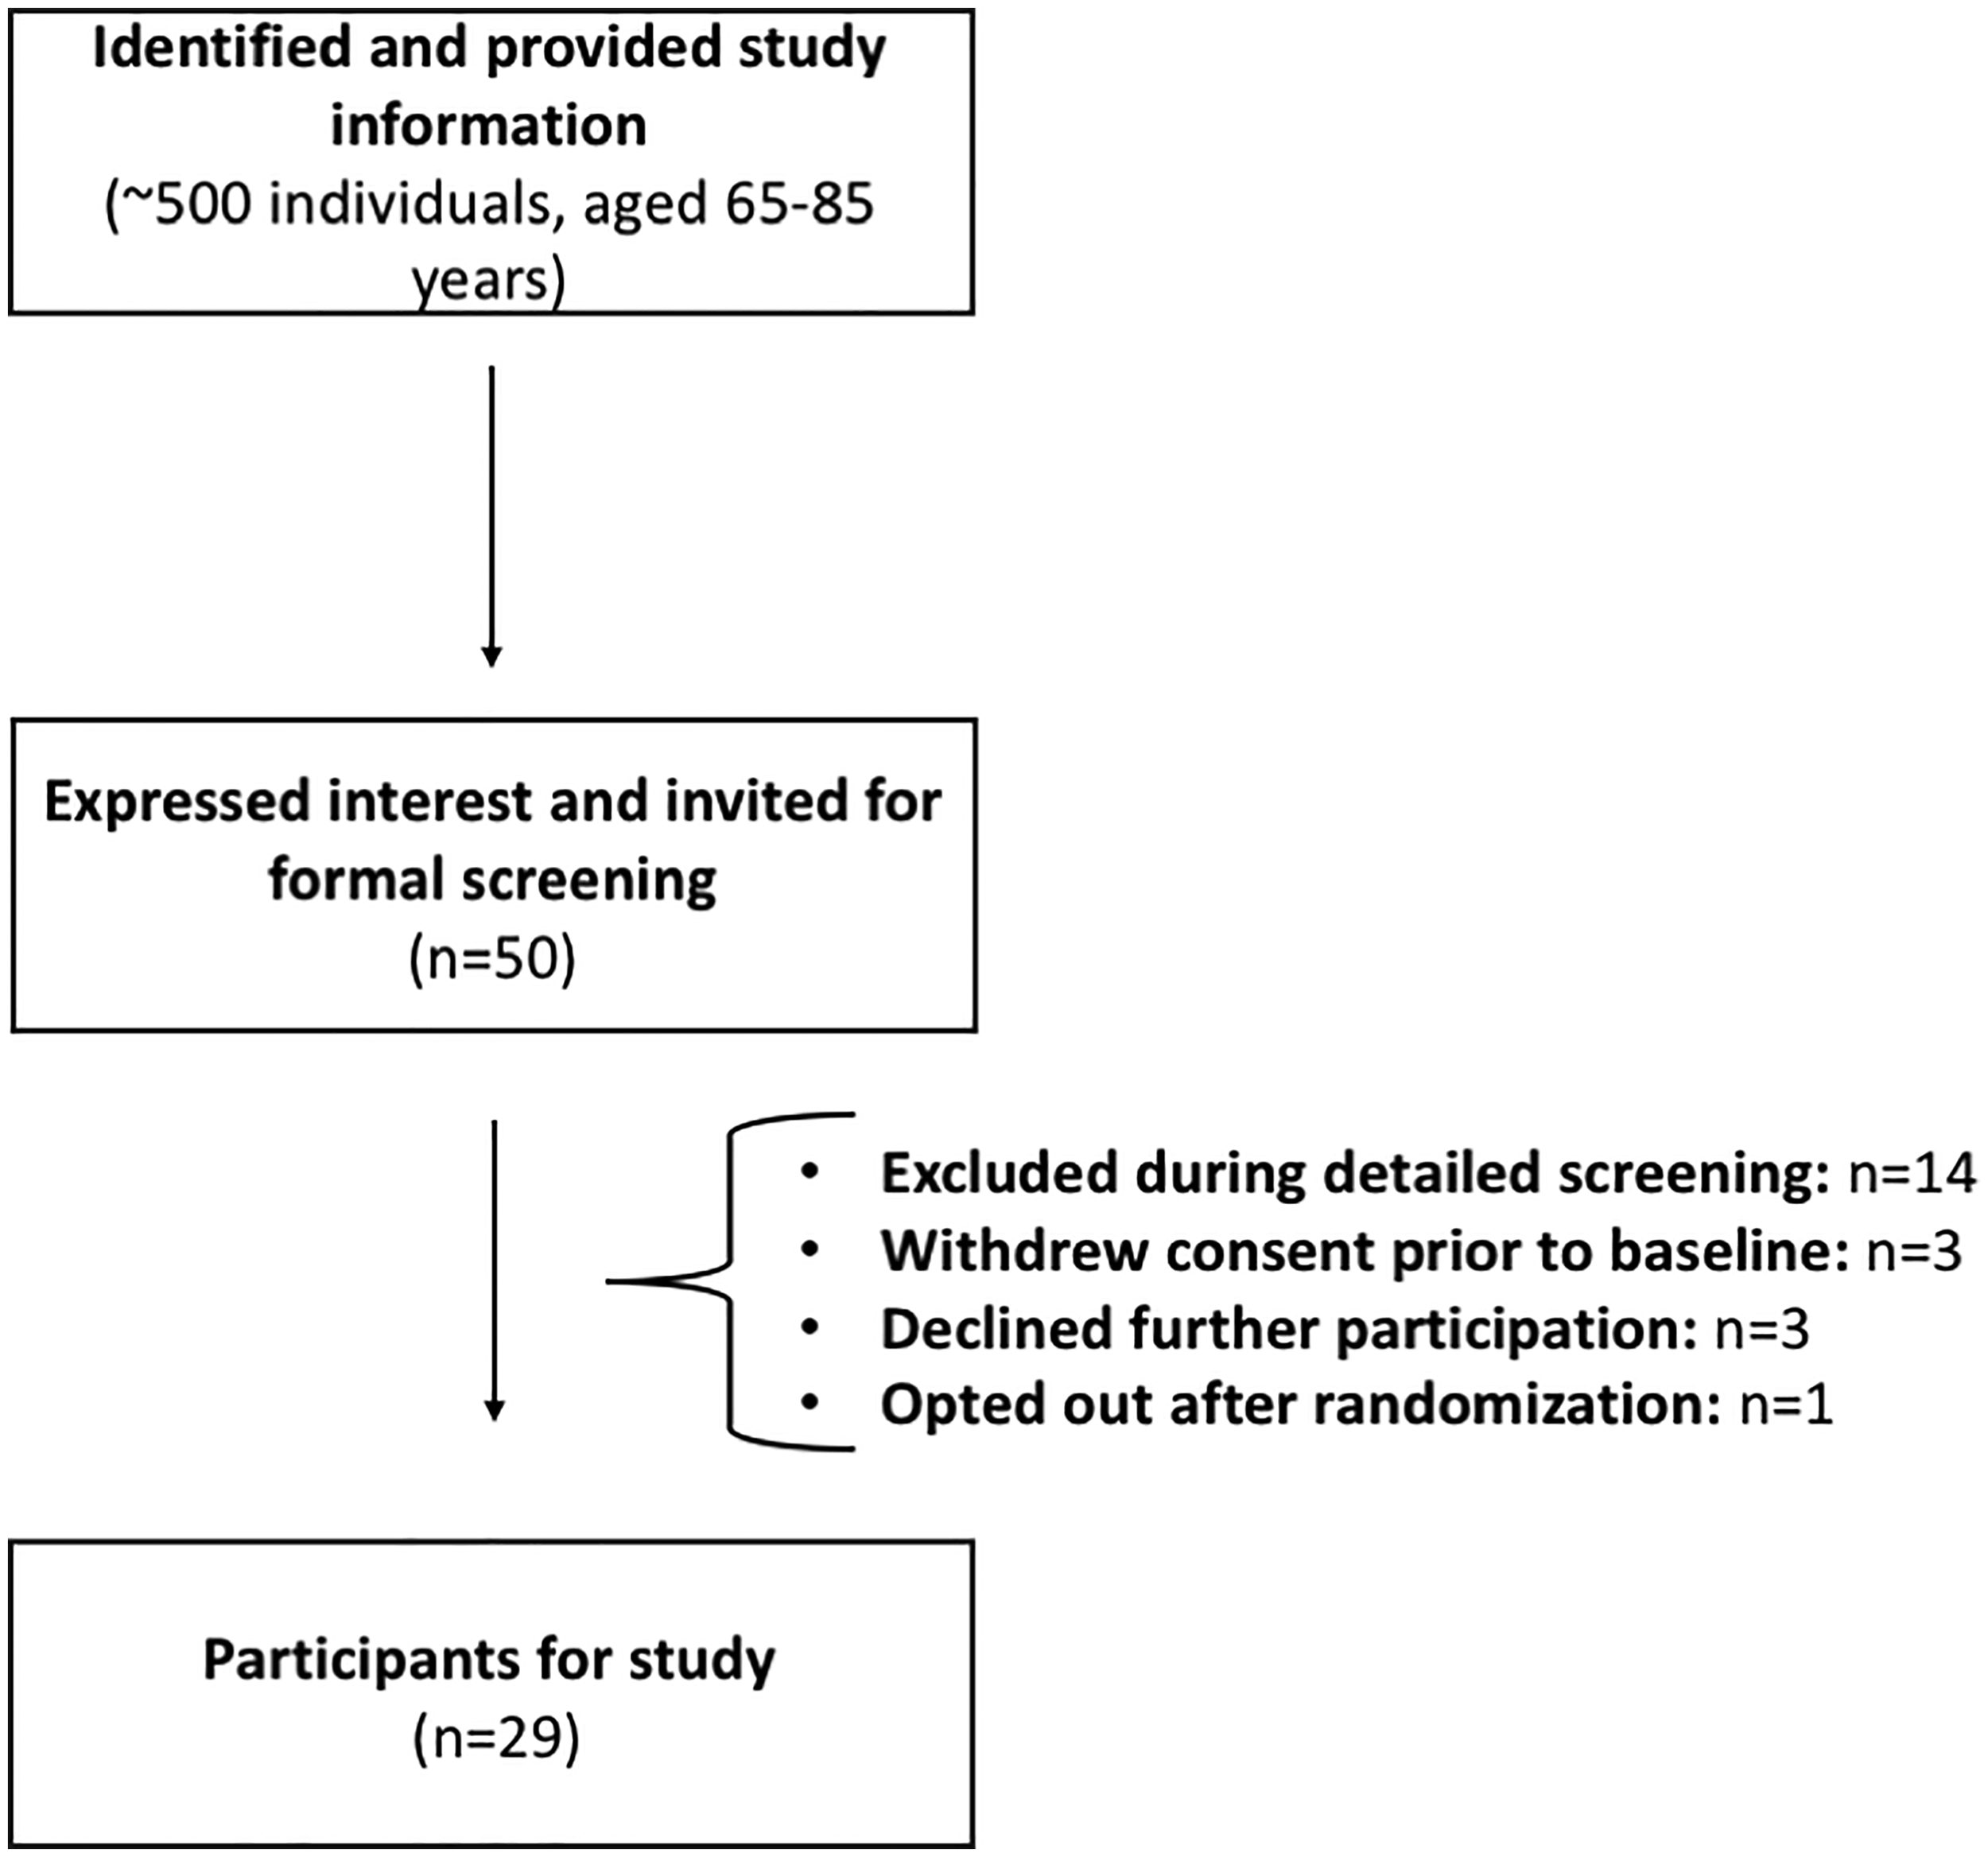
Study participant flow chart. This flow chart illustrates the enrollment and screening process, from initial recruitment through to final study participants.
During detailed screening, 14 participants were excluded for predefined reasons, including being outside the 65–85 years range, taking calcium or magnesium supplements within the past 14 days, significant acute or chronic illness (e.g., cardiovascular, gastrointestinal, endocrine, immunological, renal or metabolic conditions), cognitive impairment (Montreal Cognitive Assessment score <22 without subjective memory complaints), use of medications or supplements that could interfere with study outcomes, recent participation in experimental trials, malignant or end-stage organ disease, psychiatric illness or other factors judged by the investigator to pose a safety risk or interfere with study objectives.
An additional three participants withdrew consent prior to baseline assessment, three declined further participation and one participant opted out after randomization. This resulted in a final sample size of 29 participants, all of whom provided written informed consent and were deemed to be in general good health by the investigator.
Inclusion criteria required participants to be able to provide written informed consent, be aged 65–85 years, non-pregnant if female, and generally in good health. No participants were lost to follow-up.
General characteristics and anthropometric measurements
Socio-demographic factors (gender, age, ethnicity, occupation and years of education) and physical characteristics (height, weight) were recorded for all participants. Height was measured with a standard height scale to the nearest 0.1 cm, while weight was recorded with a metric weight scale to the nearest 0.01 kg. Body mass index was calculated as kg/m2. Participants were categorized as normal BMI (18.5–24.9 kg/m2), overweight (25.0–29.9 kg/m2) or obese (30.0–39.9 kg/m2) in accordance with WHO criteria (WHO, 2010). Information regarding current and past medical status was also obtained.
Measurement of physical activity
An International Physical Activity Questionnaire (IPAQ) score was calculated for each participant (Craig et al., 2003; Di Blasio et al., 2016). Physical activities throughout the week were recorded and converted into metabolic equivalent of task (MET)-minutes per week using standard IPAQ scoring procedures (IPAQ Research Committee, 2005). Participants were then categorized into low, moderate or high physical activity levels based on total MET-minutes/week and activity frequency and duration. Low activity was defined as not meeting criteria for moderate or high activity. Moderate activity was defined as (i) three or more days of vigorous activity of at least 20 minutes per day, (ii) five or more days of moderate intensity activity or walking of at least 30 minutes per day or (iii) five or more days of any combination of walking, moderate or vigorous activities achieving at least 600 MET-minutes/week. High activity was defined as either (i) vigorous intensity activity on at least three days achieving at least 1500 MET-minutes/week or (ii) seven or more days of any combination of activities achieving at least 3000 MET-minutes/week (IPAQ Research Committee).
Dietary intake assessment
Dietary intake was assessed using a validated self-administered, semi-quantitative Food Frequency Questionnaire (FFQ) consisting of 150 different food items (Harrington et al., 2011). The FFQ is an adapted version of the European Prospective Investigation of Cancer FFQ (Ocké et al., 1997) and has been validated for use in the Irish population (Friel et al., 2003; Harrington et al., 2008). The FFQ provides an assessment of habitual dietary intake comprising the major food categories in both macronutrients and micronutrients. Participants reported the frequency of consumption of each food type on a scale from ‘never or less than once per month’ to ‘6 + per day’. Nutrient and energy intakes were then calculated using a customized computer program (FFQ Software Version 1.0; developed by the National Nutrition Surveillance Centre, School of Public Health, Physiotherapy and Sports Science, University College Dublin, Belfield, Dublin 4, Ireland), which linked participants’ responses to food equivalents listed in the McCance and Widdowson Food Tables (Millar et al., 2022). Some nutrient values present in the original FFQ output were excluded from analysis in the current study due to lack of widely accepted dietary reference values (DRV), population-level intake references or established relevance to cognitive or inflammatory outcomes. Specifically, fluoride, vitamin B7 (biotin), choline, pantothenic acid, vitamin K and starch were omitted, as these nutrients lack consistent intake recommendations or validated status as dietary biomarkers in older populations (EFSA, 2024; NHMRC, 2006 [amended 2017]). Additionally, the accuracy of FFQ-based estimation for some of these nutrients is limited due to variability in food composition data. The focus of the current analysis was on nutrients with established roles in brain health, inflammation or age-related cognitive decline.
Macronutrient and micronutrient intake was compared to the European Food Safety Authority (EFSA) DRV tool, including average requirement, adequate intake and tolerable upper intake level (Institute of Medicine (US) Food and Nutrition Board, 1998) and set to adults over 65 years of age for both males and females as described previously (EFSA, 2024). The assumption of a 10% variation was applied, based on data regarding the variation in basal metabolic rate (Garby and Lammert, 1984; Joint FAO/WHO/UNU, 1985; Institute of Medicine (US) Standing Committee on the Scientific Evaluation of Dietary Reference Intakes and its Panel on Folate, Other B Vitamins, and Choline, 1998). Macronutrients and micronutrients were calculated and stratified for males and females based on EFSA recommendations as described previously (EFSA, 2022; EFSA, 2024).
Cognitive function
Cognitive screening
General intelligence quotient was estimated using the National Adult Reading Test (NART) to establish pre-morbid cognitive function. To ensure optimal performance, participants were instructed to refrain from strenuous exercise and alcohol for 24 h prior to the cognitive screening.
Cambridge Neuropsychological Test Automated Battery
Cognitive function was measured via the Cambridge Neuropsychological Test Automated Battery (CANTAB® Cambridge Cognition LTD. www.cantab.com) (Robbins et al., 1994), which was presented on a high-resolution touch-screen monitor under computer control. A trained test administrator sat with participants and provided verbal instructions from a standardized script and used specific verbal prompts and encouragement when needed. The administrator had full control of a keyboard used to start, pause or abort each test. To minimize potential fatigue for tests completed later in the session, tests were presented in different orders for different participants, using a Latin square design. Prior to the main cognitive assessment, participants completed a motor screening test, allowing them to familiar themselves with the touchscreen interface.
Cambridge Neuropsychological Test Automated Battery spatial working memory task
Spatial working memory (SWM) (Robbins et al., 1994) is a test of the participant's ability to retain spatial information and manipulate remembered items in working memory. The participant was presented with a number of coloured squares, one of which conceals a blue token. By process of elimination, the participant was required to find the blue token and move it to the side of the screen. The number of boxes to be searched gradually increased, and as the blue token is never found in the same box twice, the participants need to remember which boxes have previously contained tokens as well as which boxes remain to be searched. The outcome measures assessed included errors, strategy and latency.
Cambridge Neuropsychological Test Automated Battery pattern recognition memory
Pattern recognition memory (PRM) (Robbins et al., 1994) evaluates visual PRM. Participants were sequentially presented with a series of visual patterns, one at a time. The patterns were designed so they cannot easily be given verbal labels. In the recognition phase, the participant is required to choose between a pattern they have already seen and a novel pattern. The test is then repeated with a new set of patterns. The outcome measures assessed included number and percentage of correct trials and latency.
Cambridge Neuropsychological Test Automated Battery paired associates learning
Paired associates learning (PAL) (Robbins et al., 1994) assesses conditional learning of pattern-location associations and gives an index of list memory and a measure of list learning. During the task, white boxes are presented on-screen, and each opens sequentially in a random order. In one or more of the boxes, a pattern is shown. Participants must remember patterns associated with different locations. In the practice phase, two patterns are presented and afterwards the participant must touch the boxes in which the patterns appeared. Participants have to remember two patterns presented after touching the boxes in which the patterns appeared. The participants have to remember two, three, six and eight patterns across four trials. If the participant makes an error the patterns are represented to remind the participant of their locations. When all pattern locations are correctly identified the test proceeds to the next stage. However, if a participant failed to recall the correct locations within 10 attempts, the test was terminated. Outcome measures assessed included total errors for each stage, mean number of trials required to locate all patterns correctly, first trial memory score and stages completed.
Cambridge Neuropsychological Test Automated Battery graded naming test
The Graded Naming Test (GNT) (Robbins et al., 1994) was used to assess object naming ability. The participants were presented with a series of drawings of objects and asked to name them. The objects were shown in order of ascending difficulty.
Plasma cytokines
Fasting plasma samples were collected from the subjects (8 × 3–5 mL) using EDTA-vacutainers and were stored at −80°C. Plasma cytokine concentrations of vascular endothelial growth factor [VEGF], tumor necrosis factor-alpha [TNF-α], interleukin [IL]-8, IL-10, IL-8, IL-6, IL-4 and IL-1β were determined using enzyme-linked immunosorbent assay (ELISA) (Assay Designs). IL-1β did not meet the limit of detection (BioVendor, n.d.). For the included cytokines, the ELISA kits had the following performance characteristics: TNF-α had a sensitivity of 26.3 pg/mL, intra-assay CV of 6.0% and inter-assay CV of 7.4%; IL-6 had a sensitivity of 0.5 pg/mL, intra-assay CV of 4.5% and inter-assay CV of 7.2%; IL-8 had a sensitivity of 0.5 pg/mL, intra-assay CV of 4.5% and inter-assay CV of 7.2%; IL-10 had a sensitivity of 1.32 pg/mL, intra-assay CV of 1.9% and inter-assay CV of 4.2%; IL-4 had a sensitivity of 1.3 pg/mL, intra-assay CV of 4.8% and inter-assay CV of 5.6%; VEGF had a sensitivity of 7.0 pg/mL, intra-assay CV of 5.3% and inter-assay CV of 9.8%.
Statistical analysis
All statistical analyses were performed using GraphPad Prism8 (GraphPad Prism for Mac, version 8.4.3). Demographic data is presented as means and standard deviations, while categorical variables are shown as absolute numbers and percentages (n, %). Normal distribution was determined by the Shapiro–Wilk test. For normal distributed data, comparison between two groups was performed using a Welch's unpaired t-test. Non-parametric data was analysed with the Mann–Whitney U test. When more than two groups were compared, one-way ANOVA was used for normally distributed data, followed by Tukey's post-hoc test. Non-parametric multiple comparisons were conducted using the Kruskal–Wallis test, followed by Dunn's post-hoc test. Nutrient intake was compared with DRV (EFSA) and deemed either out of or within range based on a 15% deviation threshold as used in previous studies (Mainardi et al., 2019). Fisher's exact tests were performed to compare the number of participants outside this threshold with those within the recommended range. Individual nutrient intake categories of above, in or below range were compared with CANTAB scores and plasma cytokine levels. Statistical significance was set at p ≤ 0.05 and differences are indicated in the figures by *p ≤ 0.05, **p ≤ 0.01 and ***p ≤ 0.001. The nutrients protein, total sugar, folate, thiamine, riboflavin, niacin, vitamin B6, vitamin C, vitamin D, phosphorus, iron and calcium could not be assessed because the number of participants with intake data, either below or within reference range, was too small to allow meaningful group comparisons. Given the exploratory nature and small sample size of this pilot study, no global correction for multiple comparisons was performed.
Power calculation
A post-hoc power analysis using G*Power indicated that, with group sizes of n = 13 (males) and n = 16 (females), the study had approximately 25% power to detect medium effects (Cohen's d = 0.5) at α = 0.05. This is consistent with the small sample size typical of pilot studies and highlights the exploratory nature of these findings, which are intended to inform the design and sample size of future, fully powered studies.
Effect size calculations
To quantify the magnitude of observed effects, effect sizes (r) were calculated for all relevant statistical tests to facilitate comparison across analyses. For independent samples t-tests, effect size, r, was calculated using the formula: r = √(R2), where R2 is the coefficient of determination (eta squared). For the Mann–Whitney U test, effect size was computed from the standardized test statistic (Z) using r = Z/√N, where Z is the Z-score from the Mann–Whitney U test, and N is the total sample size. For Dunn's post-hoc tests following Kruskal–Wallis analyses, effect size was computed from the standardized test statistic (Z), with adjustments made for multiple comparisons, using r = Z/√N, where Z is the Z-score from the specified test, and N is the total sample size, applied to each pairwise comparison. For Tukey's post-hoc tests following ANOVA analyses, effect size was computed from the t statistic associated with each contrast (t = mean difference/SE difference), and absolute effect size r was calculated as r = √t2/t2 +df), where df is degrees of freedom from each pairwise comparison.
Results
Socio-demographic and physiological characteristics of older aged adults
Table 1 summarizes the socio-demographic, physiological and cognitive characteristics of the study participants. The mean age of male participants was 72.00 years, while female participants had a mean age of 73.88 years. Females reported an average of 14 years of education, compared to 11 years in males. No significant differences were observed between biological sexes and IPAQ scores or inflammatory markers. Biological males had significantly higher body weight than biological females (t(25) = 3.05, p = 0.0053, r = 0.52), consistent with physiological differences, although BMI did not differ between sexes. Spatial working memory strategy scores were significantly higher in females compared to males (t(27) = 2.31, p = 0.0285, r = 0.41). This may suggest a sex-related difference in the approach to SWM tasks, though the functional implications of this finding warrant further investigation.
Socio-demographic and health-related characteristics of study participants.
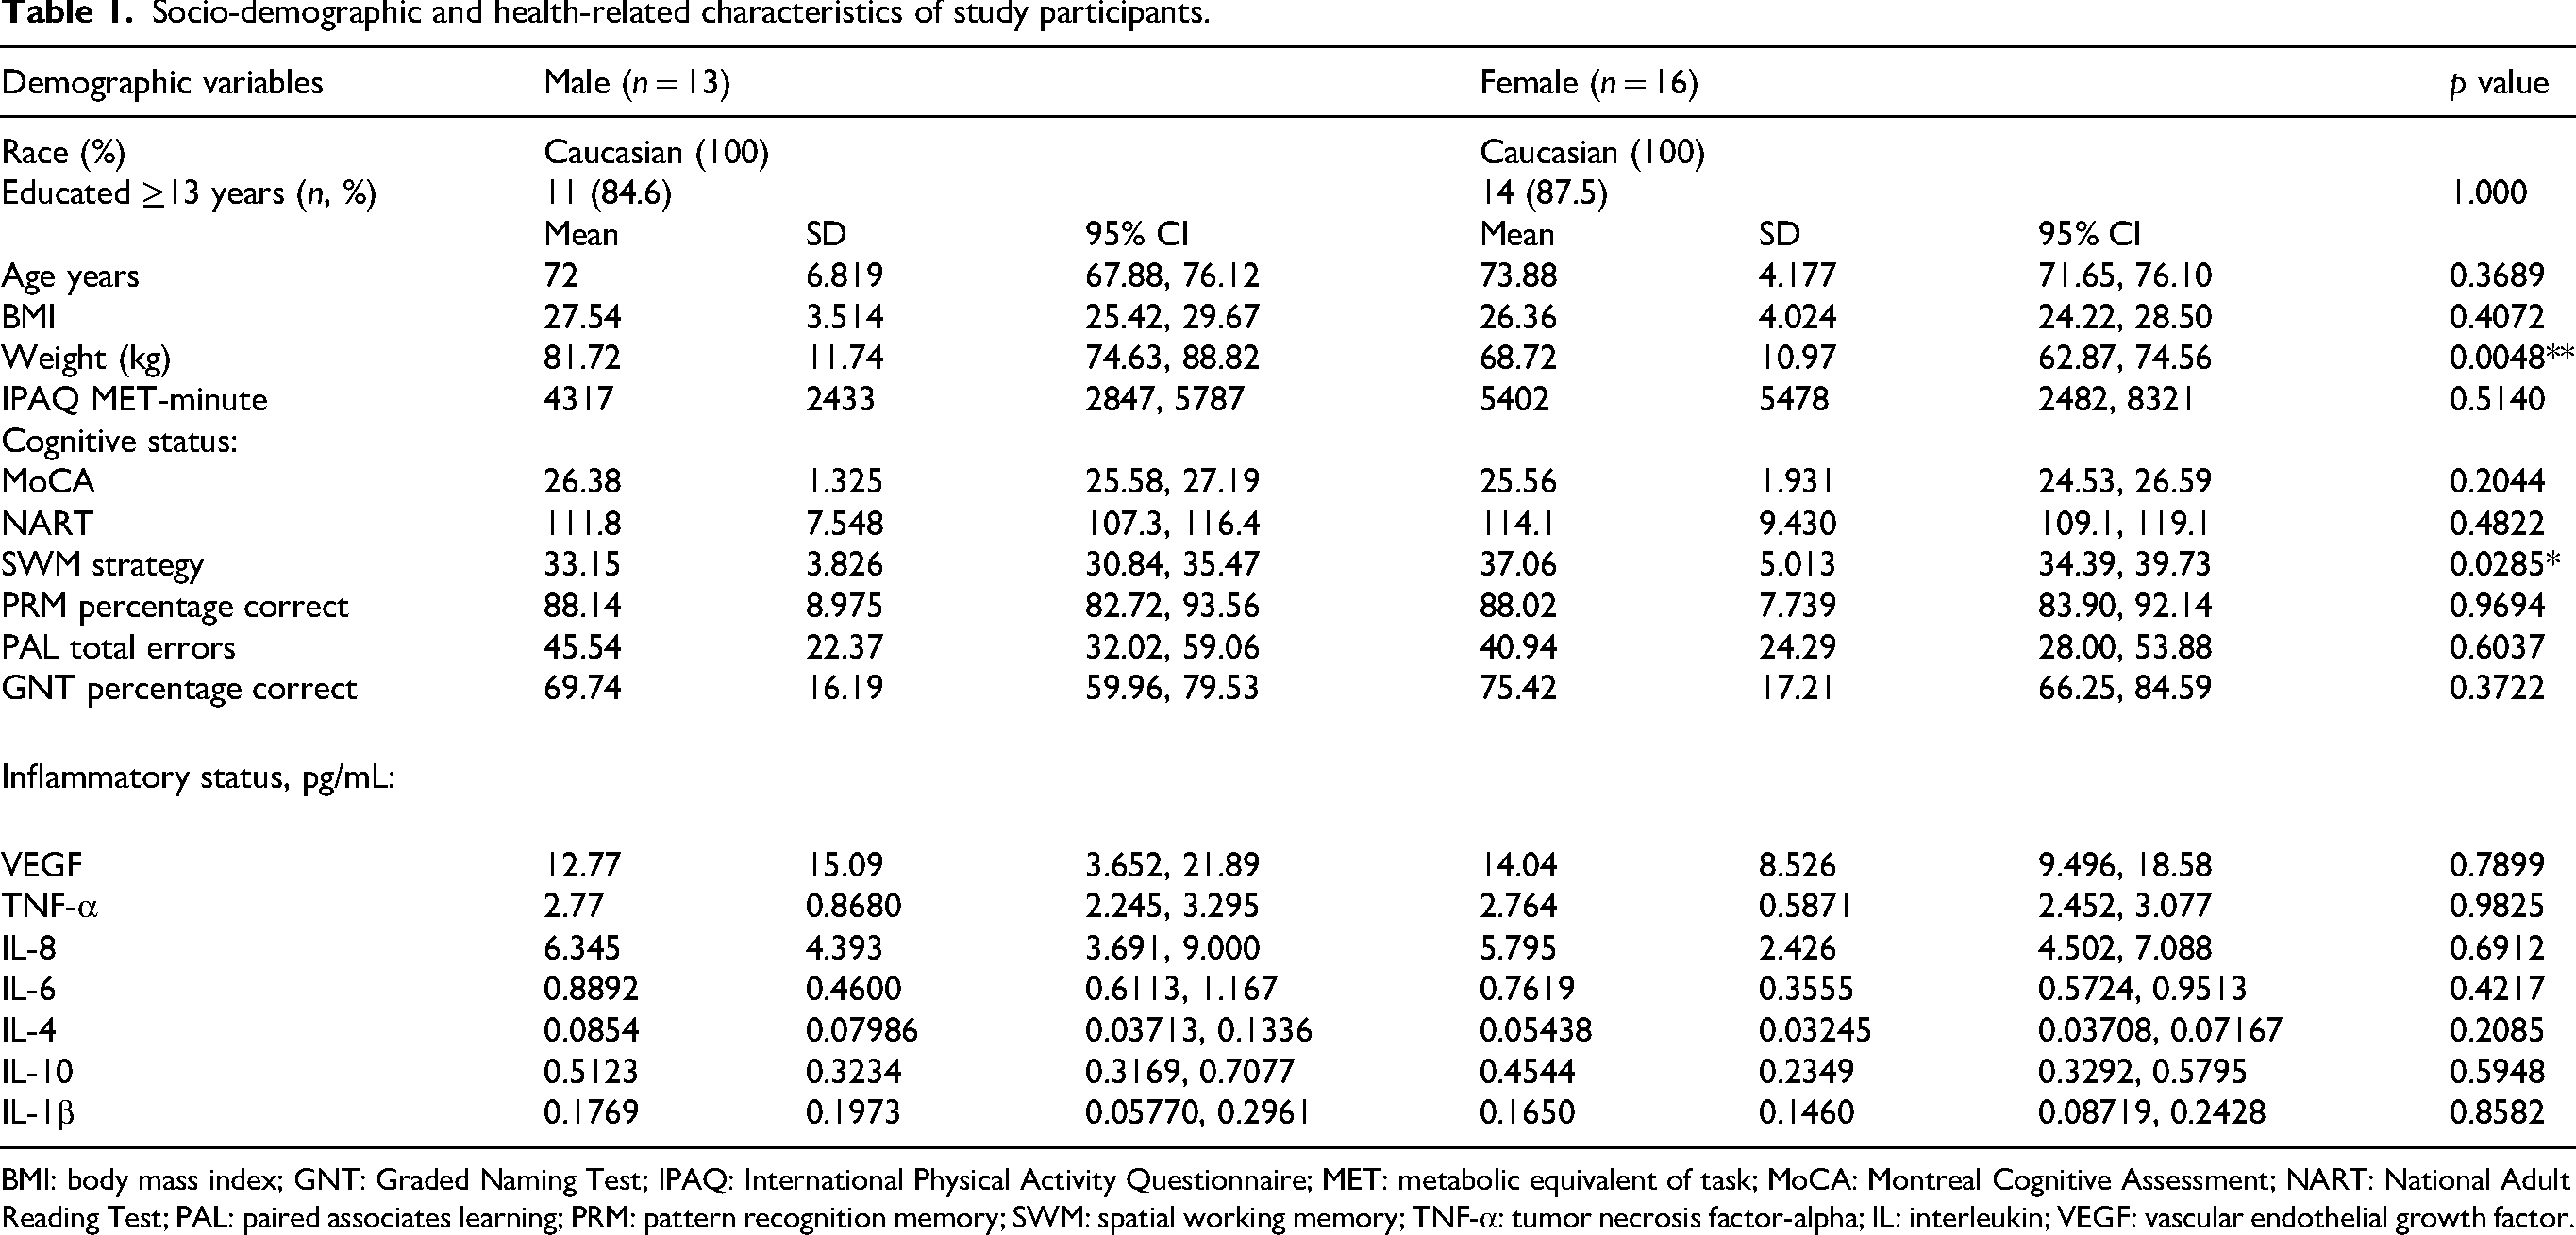
BMI: body mass index; GNT: Graded Naming Test; IPAQ: International Physical Activity Questionnaire; MET: metabolic equivalent of task; MoCA: Montreal Cognitive Assessment; NART: National Adult Reading Test; PAL: paired associates learning; PRM: pattern recognition memory; SWM: spatial working memory; TNF-α: tumor necrosis factor-alpha; IL: interleukin; VEGF: vascular endothelial growth factor.
Elevated TNF-α and IL-10 in obese older aged adults
Participants were classified into BMI categories based on WHO criteria (WHO, 2010): normal (18.5–24.9 kg/m2), overweight (25.0–29.9 kg/m2) and obese (30.0–39.9 kg/m2). The majority of the cohort was overweight (62.1%, n = 18), followed by 24.1% with a normal BMI (n = 7), and 13.8% (n = 4) classified as obese (Figure 2A). No participants were underweight. Plasma TNF-α levels differed significantly across BMI categories (Kruskal–Wallis H(2) = 7.49, p = 0.024; Figure 2B), with significantly higher TNF-α observed in the obese group compared to those with normal BMI (p = 0.019, r = 0.83; Figure 2B). IL-10 levels also varied significantly across BMI groups (H(2) = 7.76, p = 0.021; Figure 2B), with elevated IL-10 in obese participants relative to both normal weight (p = 0.020, r = 0.82; Figure 2B) and overweight individuals (p = 0.048, r = 0.51; Figure 2B). No significant differences in CANTAB cognitive performance scores were observed across BMI categories (data not shown).
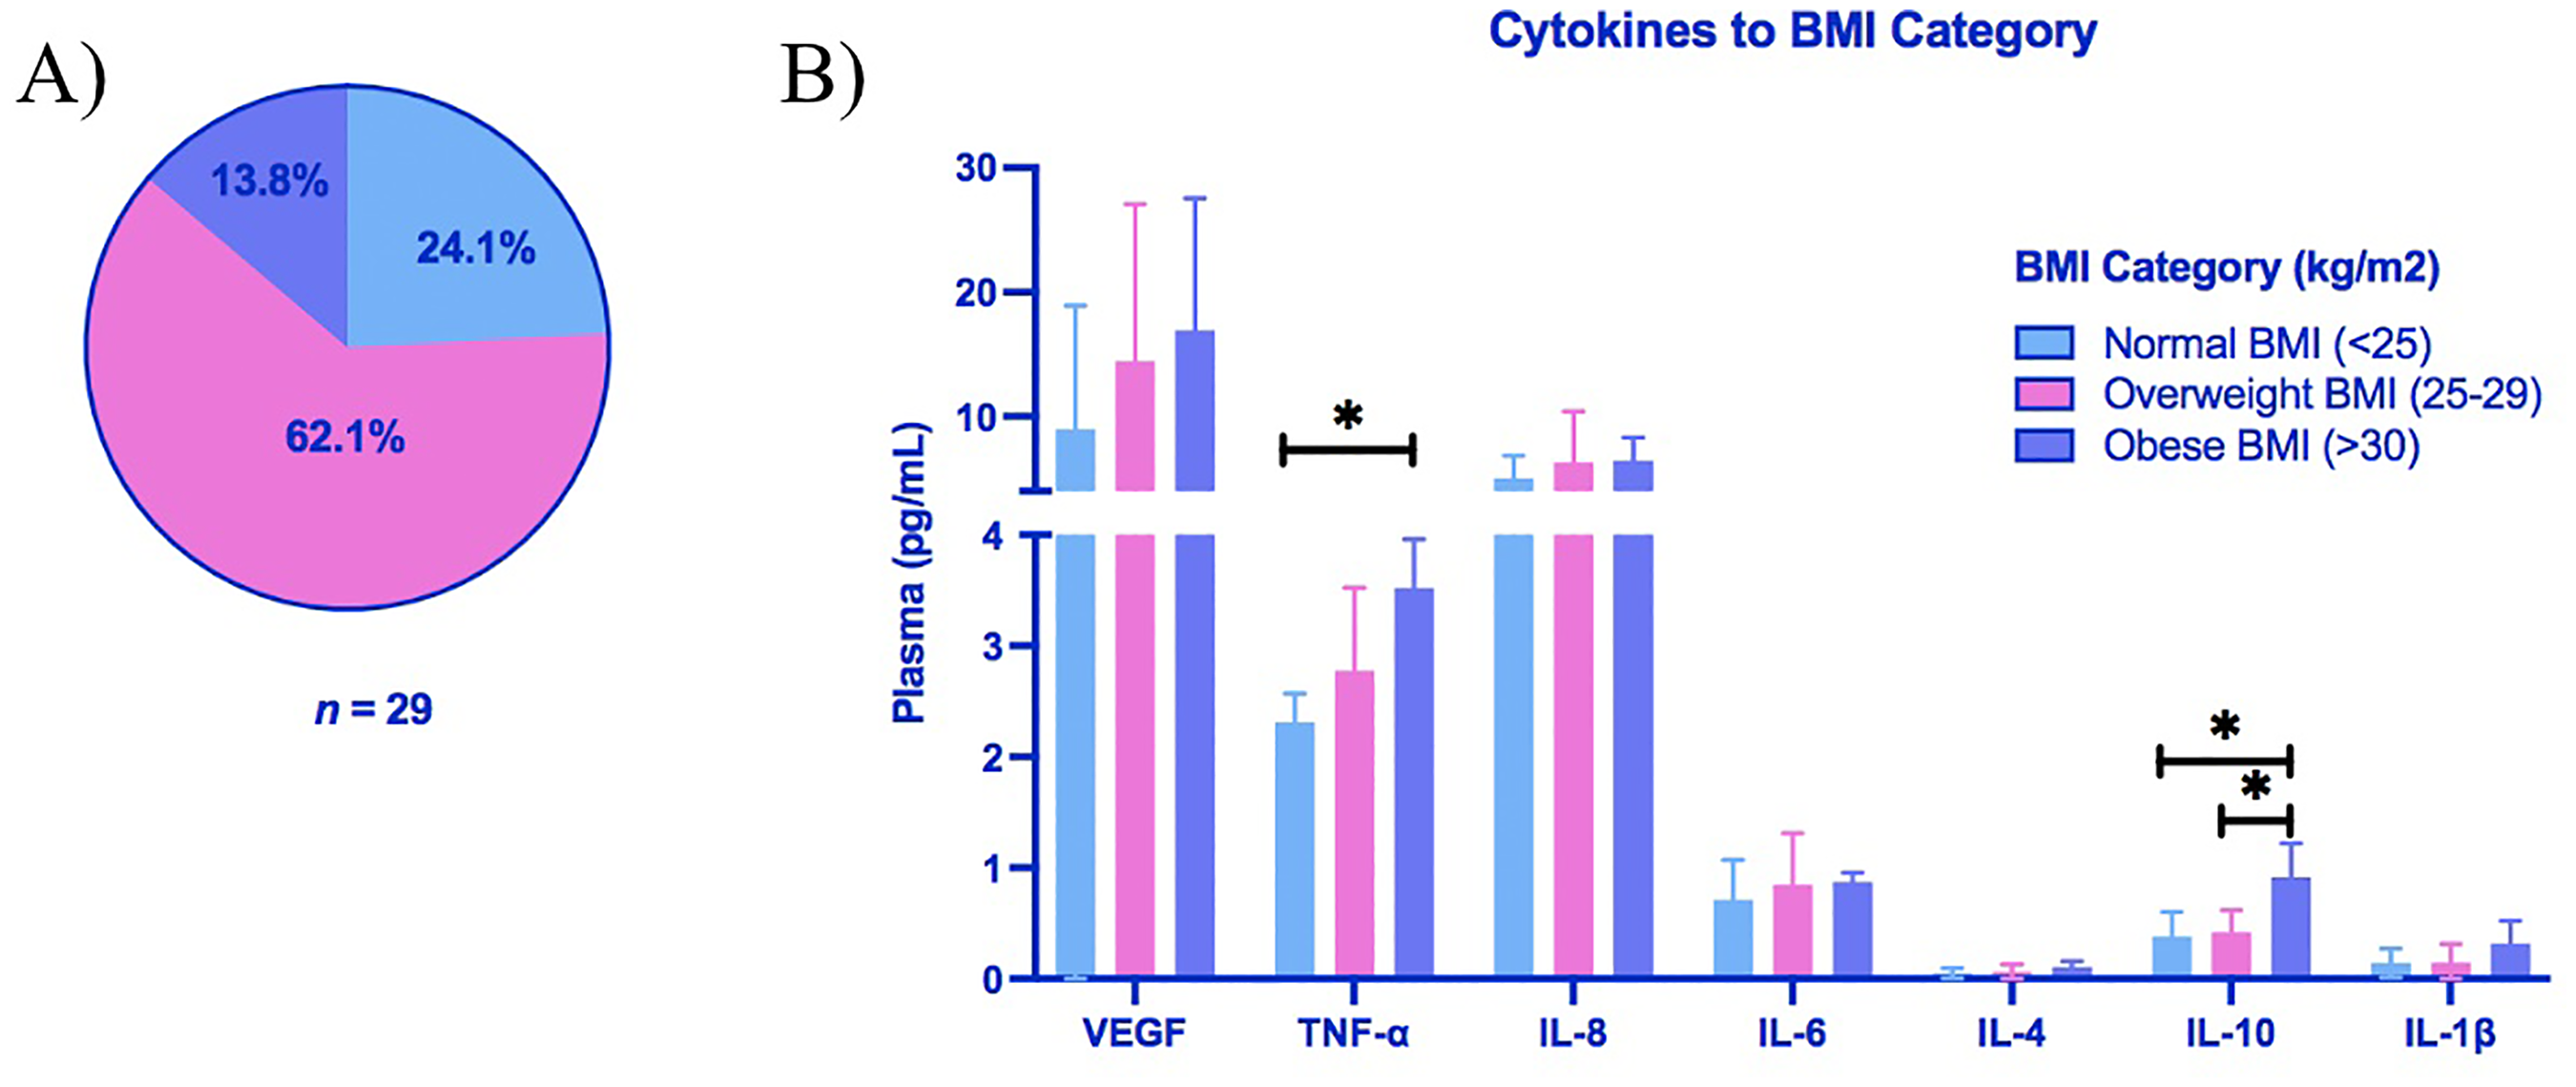
Plasma levels of TNF-α and IL-10 are elevated in obese older aged adults. (A) Percentage of participants categorized as normal weight (24.1%, n = 7), overweight (62.1%, n = 18) or obese (13.8%, n = 4) according to WHO body mass index (BMI) Criteria. (B) Plasma cytokines (pg/mL) in each BMI category. Group differences were assessed by Kruskal–Wallis test, with post-hoc pairwise comparisons performed using Dunn's multiple comparison test (*p < 0.05).
Elevated plasma TNF-α, IL-6 and IL-10 levels in older aged adults with low physical activity
Participants were categorized into high, moderate or low IPAQ activity groups based on validated IPAQ scoring criteria (Craig et al., 2003). The majority of participants were classified as highly active (65.5%, n = 19), followed by 20.7% with moderate activity (n = 6), and 13.8% in the low activity group (n = 4) (Figure 3A). Plasma TNF-α levels differed significantly across IPAQ categories (Kruskal–Wallis H(2) = 7.78, p = 0.020; Figure 3B). Participants with low physical activity had significantly higher TNF-α levels than both the moderate (p = 0.046, r = 0.77; Figure 3B) and high activity groups (p = 0.022, r = 0.56; Figure 3B). Similarly, IL-6 levels varied by activity category (H(2) = 6.18, p = 0.046; Figure 3B), with elevated IL-6 observed in the low activity group compared to the moderate (p = 0.048, r = 0.76; Figure 3B). The IL-10 levels differed significantly across activity levels (H(2) = 6.11, p = 0.047; Figure 3B), with higher levels in the low activity group compared to the high activity group (p = 0.0442, r = 0.51; Figure 3B). No significant differences in CANTAB cognitive performance scores were observed across IPAQ physical activity categories (data not shown).
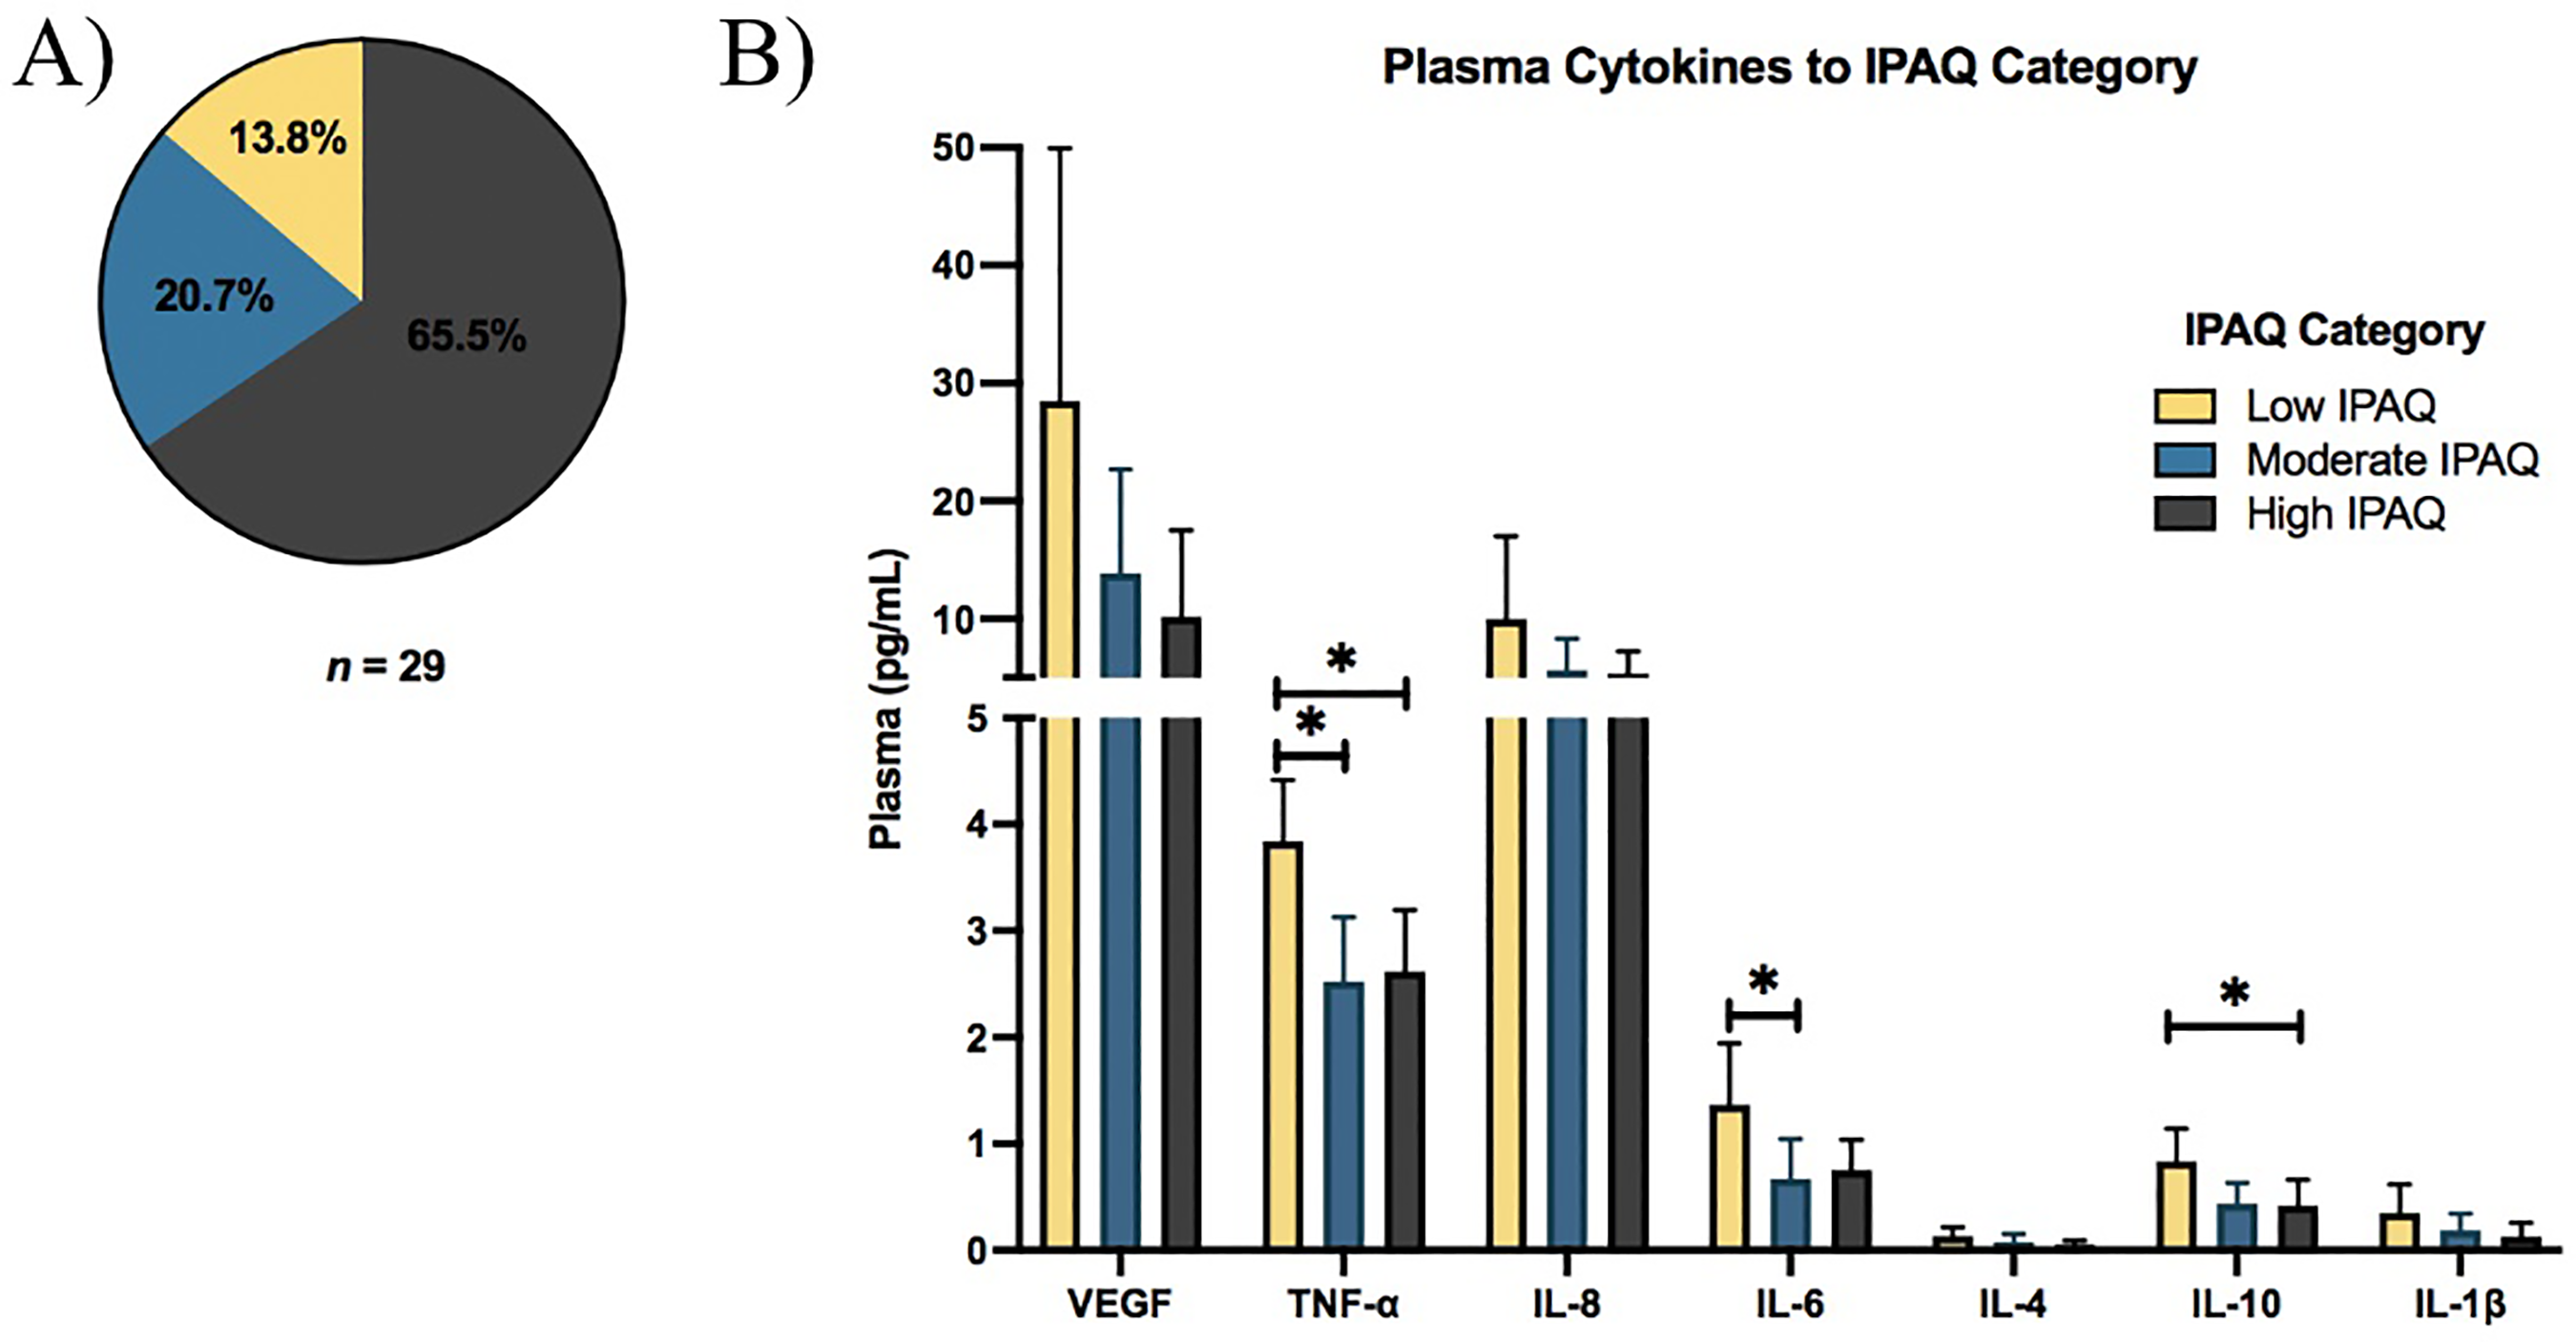
Plasma levels of TNF-α, IL-6 and IL-10 are elevated in older aged adults with low physical activity. (A) Percentage of participants categorized as low (13.8%, n = 4), moderate (20.7%, n = 6) or high (65.5%, n = 19) physical activity according to International Physical Activity Questionnaire (IPAQ) scoring criteria. (B) Plasma cytokines (pg/mL) across IPAQ categories. Group differences were assessed by Kruskal–Wallis test, with post-hoc pairwise comparisons performed using Dunn's multiple comparison test (*p < 0.05).
Cognitive and inflammatory differences associated with deviations from DRV macronutrient intake in older adults
Macronutrient intake was categorized as above, within or below the recommended range for age and sex based on the EFSA's DRV. Most participants consumed protein (96.55%, n = 28), total fat (75.86%, n = 22), saturated fatty acids (SFAs) (79.31%, n = 23) and total sugar (93.10%, n = 27) at levels exceeding the DRV (Figure 4A and B).
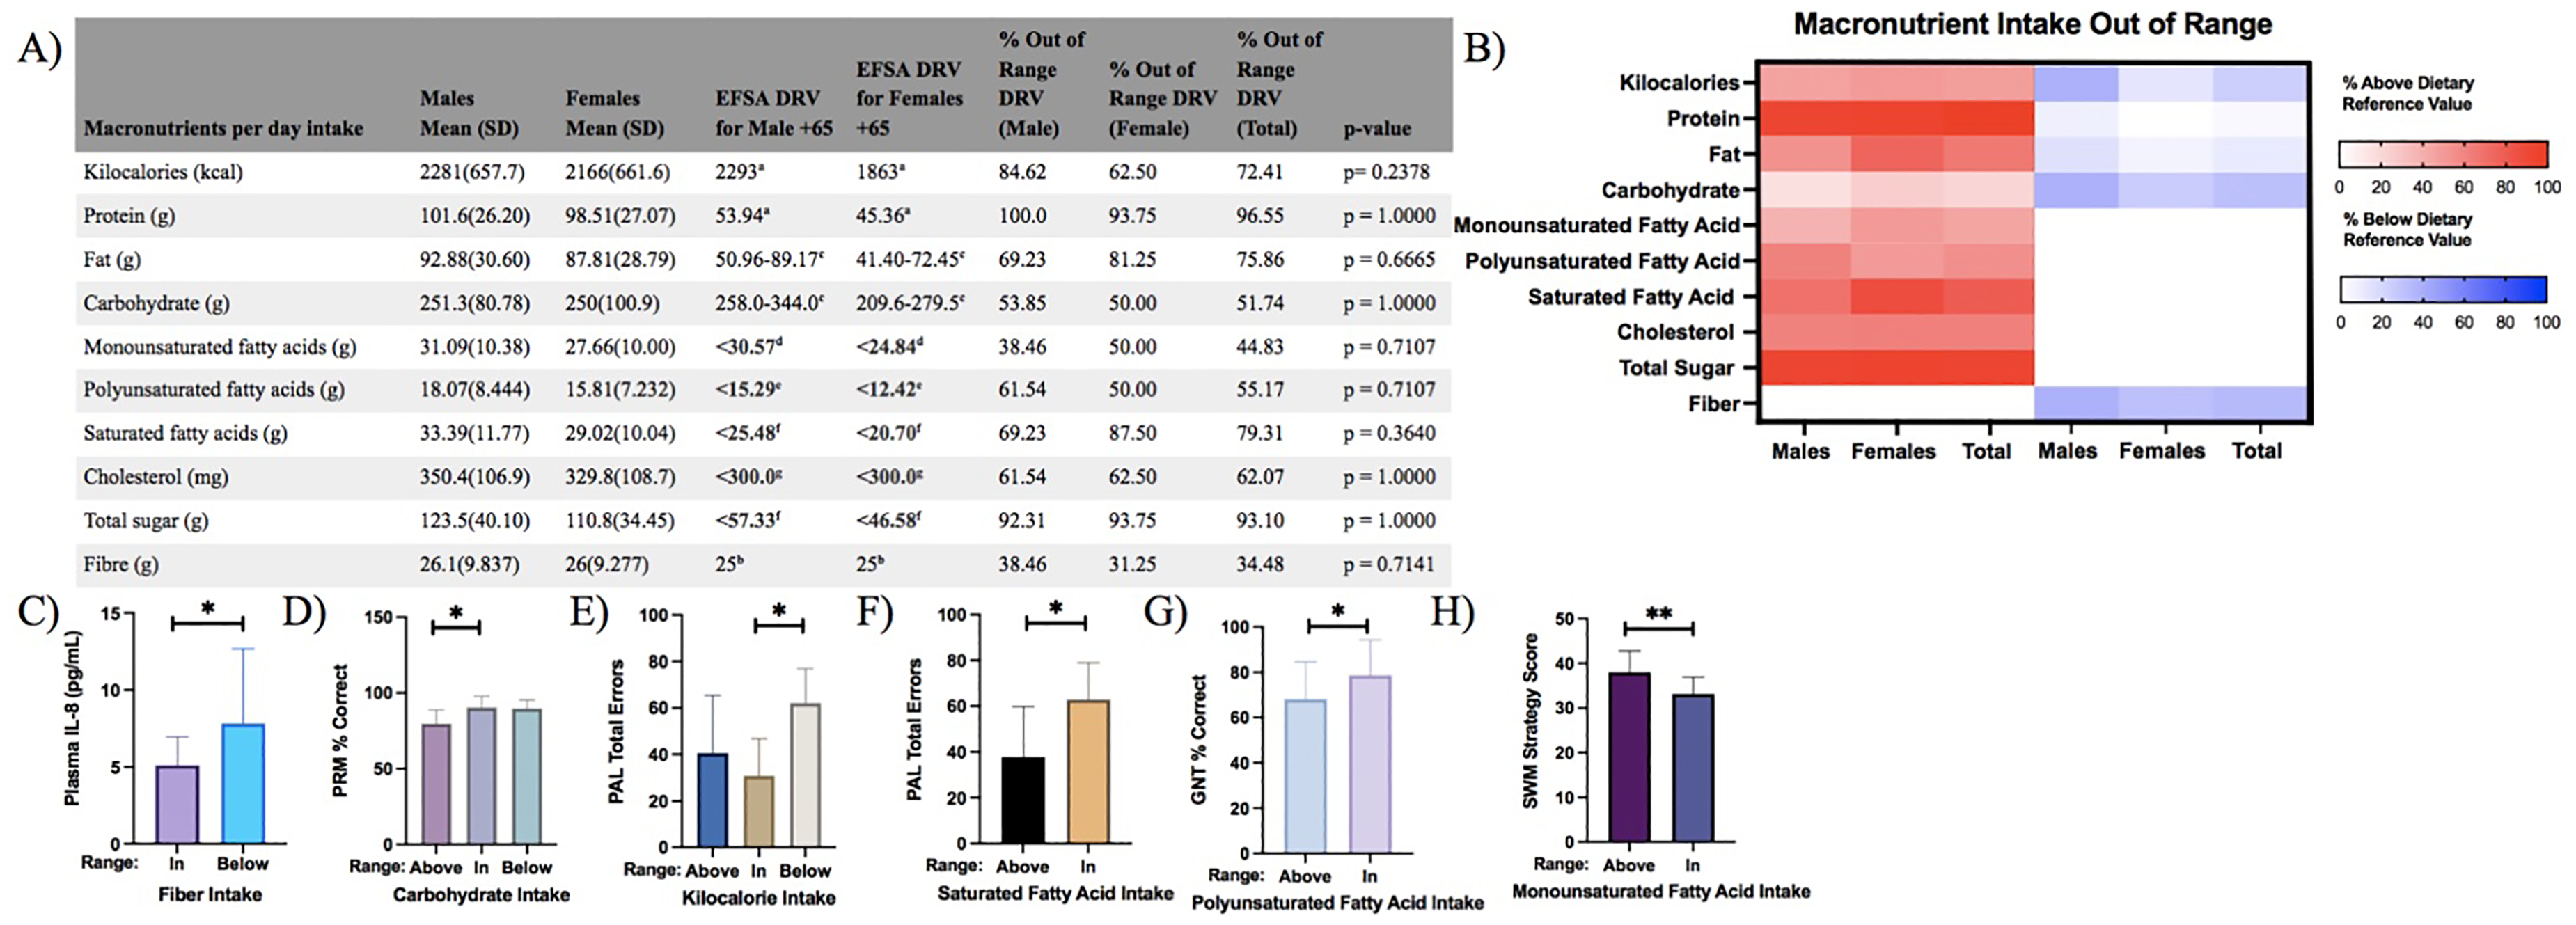
Deviations in macronutrient intake impact cognitive performance and inflammation in older aged adults. (A) No significant differences were observed in the percentage of macronutrient intake outside the DRV range between male (n = 13) and female (n = 16) older adults. (B) Heatmap illustrating macronutrient intake deviations from the DRV, with strong red indicating intake above and strong blue indicating intake below the DRV for male, female and pooled older adults. Differences in intake distribution were analysed using Fisher's exact test. (C) Participants with fibre intake below the DRV exhibited significantly higher plasma IL-8 levels (Mann–Whitney U test). (D) Participants whose carbohydrate intake exceeded the DRV showed significantly lower Pattern Recognition Memory (PRM) accuracy (% correct) (Kruskal–Wallis test with Dunn's post-hoc pairwise comparisons). E) Participants with kilocalorie intake below the DRV made more errors on the Paired Associates Learning (PAL) task (one-way ANOVA with Tukey's post-hoc pairwise comparison). (F) Participants with saturated fatty acid intake above the DRV performed better on the PAL task (Mann–Whitney U test). (G) Participants with polyunsaturated fatty acid intake above the DRV had lower Graded Naming Test (GNT) accuracy (% correct) (Mann–Whitney U test). (H) Participants with monounsaturated fatty acid intake within the DRV performed better on Spatial Working Memory (SWM) strategy task (independent sample t-test). Data in panels (C)–(H) are presented as mean ± SD (*p < 0.05, **p < 0.01). (a) Average requirement, (b) adequate intake, (c) reference intake (carbohydrates 45–60%; fats 20–35%), (d) <12% energy intake as recommended, (e) <6% energy intake as recommended, (f) <10% energy intake as recommended, (g) tolerable daily upper intake level. EFSA = European Food and Safety Authority; DRV = dietary reference value.
Plasma IL-8 levels were significantly higher in participants whose fibre intake was below DRV (n = 10) versus in range (n = 19) (Mann–Whitney U test; p = 0.0445, r = 0.38; Figure 4C). No significant associations were observed between other cytokines and macronutrient intake.
Performance on the PRM task differed significantly across carbohydrate intake groups (Kruskal–Wallis H(2) = 7.34, p = 0.026). Participants whose carbohydrate intake exceeded the DRV (n = 6) had significantly lower PRM accuracy compared to those within the recommended range (n = 14) (p = 0.0223, r = 0.60; Figure 4D). Paired Associates Learning scores differed significantly across kilocalorie intake groups (ANOVA F(2,26) = 4.43, p = 0.022). Participants whose kilocalorie intake was below the DRV (n = 7) range made more PAL errors versus those in range (n = 8) (Tukey's test, p = 0.019, r = 0.49; Figure 4E), indicating poorer visual learning and memory. In contrast, participants whose SFA intake was above the DRV (n = 23) performed significantly better on the PAL task compared to those within the recommended range (n = 6) (Mann–Whitney U test; p = 0.01118, r = 0.455; Figure 4F). Conversely, polyunsaturated fatty acid (PUFA) intake above the DRV (n = 16) was associated with lower performance on the GNT (Mann–Whitney U test; p = 0.0429, r = 0.375; Figure 4G) compared to those in range (n = 13). Participants whose monounsaturated fatty acid (MUFA) intake fell within the recommended range (n = 16) showed significantly better performance on the SWM strategy task compared to those above the range (n = 13) (t(27) = 3.06, p = 0.0050, r = 0.51; Figure 4H).
Cognitive and inflammatory differences associated with deviations from DRV micronutrient intake in older adults
Micronutrient intake deviated from the DRV for the majority of participants, with intakes above the recommended range observed for thiamine (96.55%, n = 28), riboflavin (93.10%, n = 27), niacin (96.55%, n = 28), vitamin B6 (93.10%, n = 27), vitamin C (93.10%, n = 27), calcium (93.10%, n = 27) and iron (96.55%, n = 28) (Figure 5A). In contrast, all participants (100.0%, n = 29) had vitamin D intake below the DRV (Figure 5A and B). Plasma IL-8 levels were significantly elevated in participants with intake below the DRV for vitamin B12 (Mann–Whitney U test; p = 0.0163, r = 0.43; Figure 5C) and for magnesium (Mann–Whitney U test; p = 0.0319, r = 0.53; Figure 5D). There was a significant difference in IL-6 levels across zinc intake groups (Kruskal–Wallis H(2) = 7.27, p = 0.026), with higher IL-6 levels in participants with zinc intake above the recommended range compared to those within range (p = 0.0328, r = 0.54; Figure 5E).
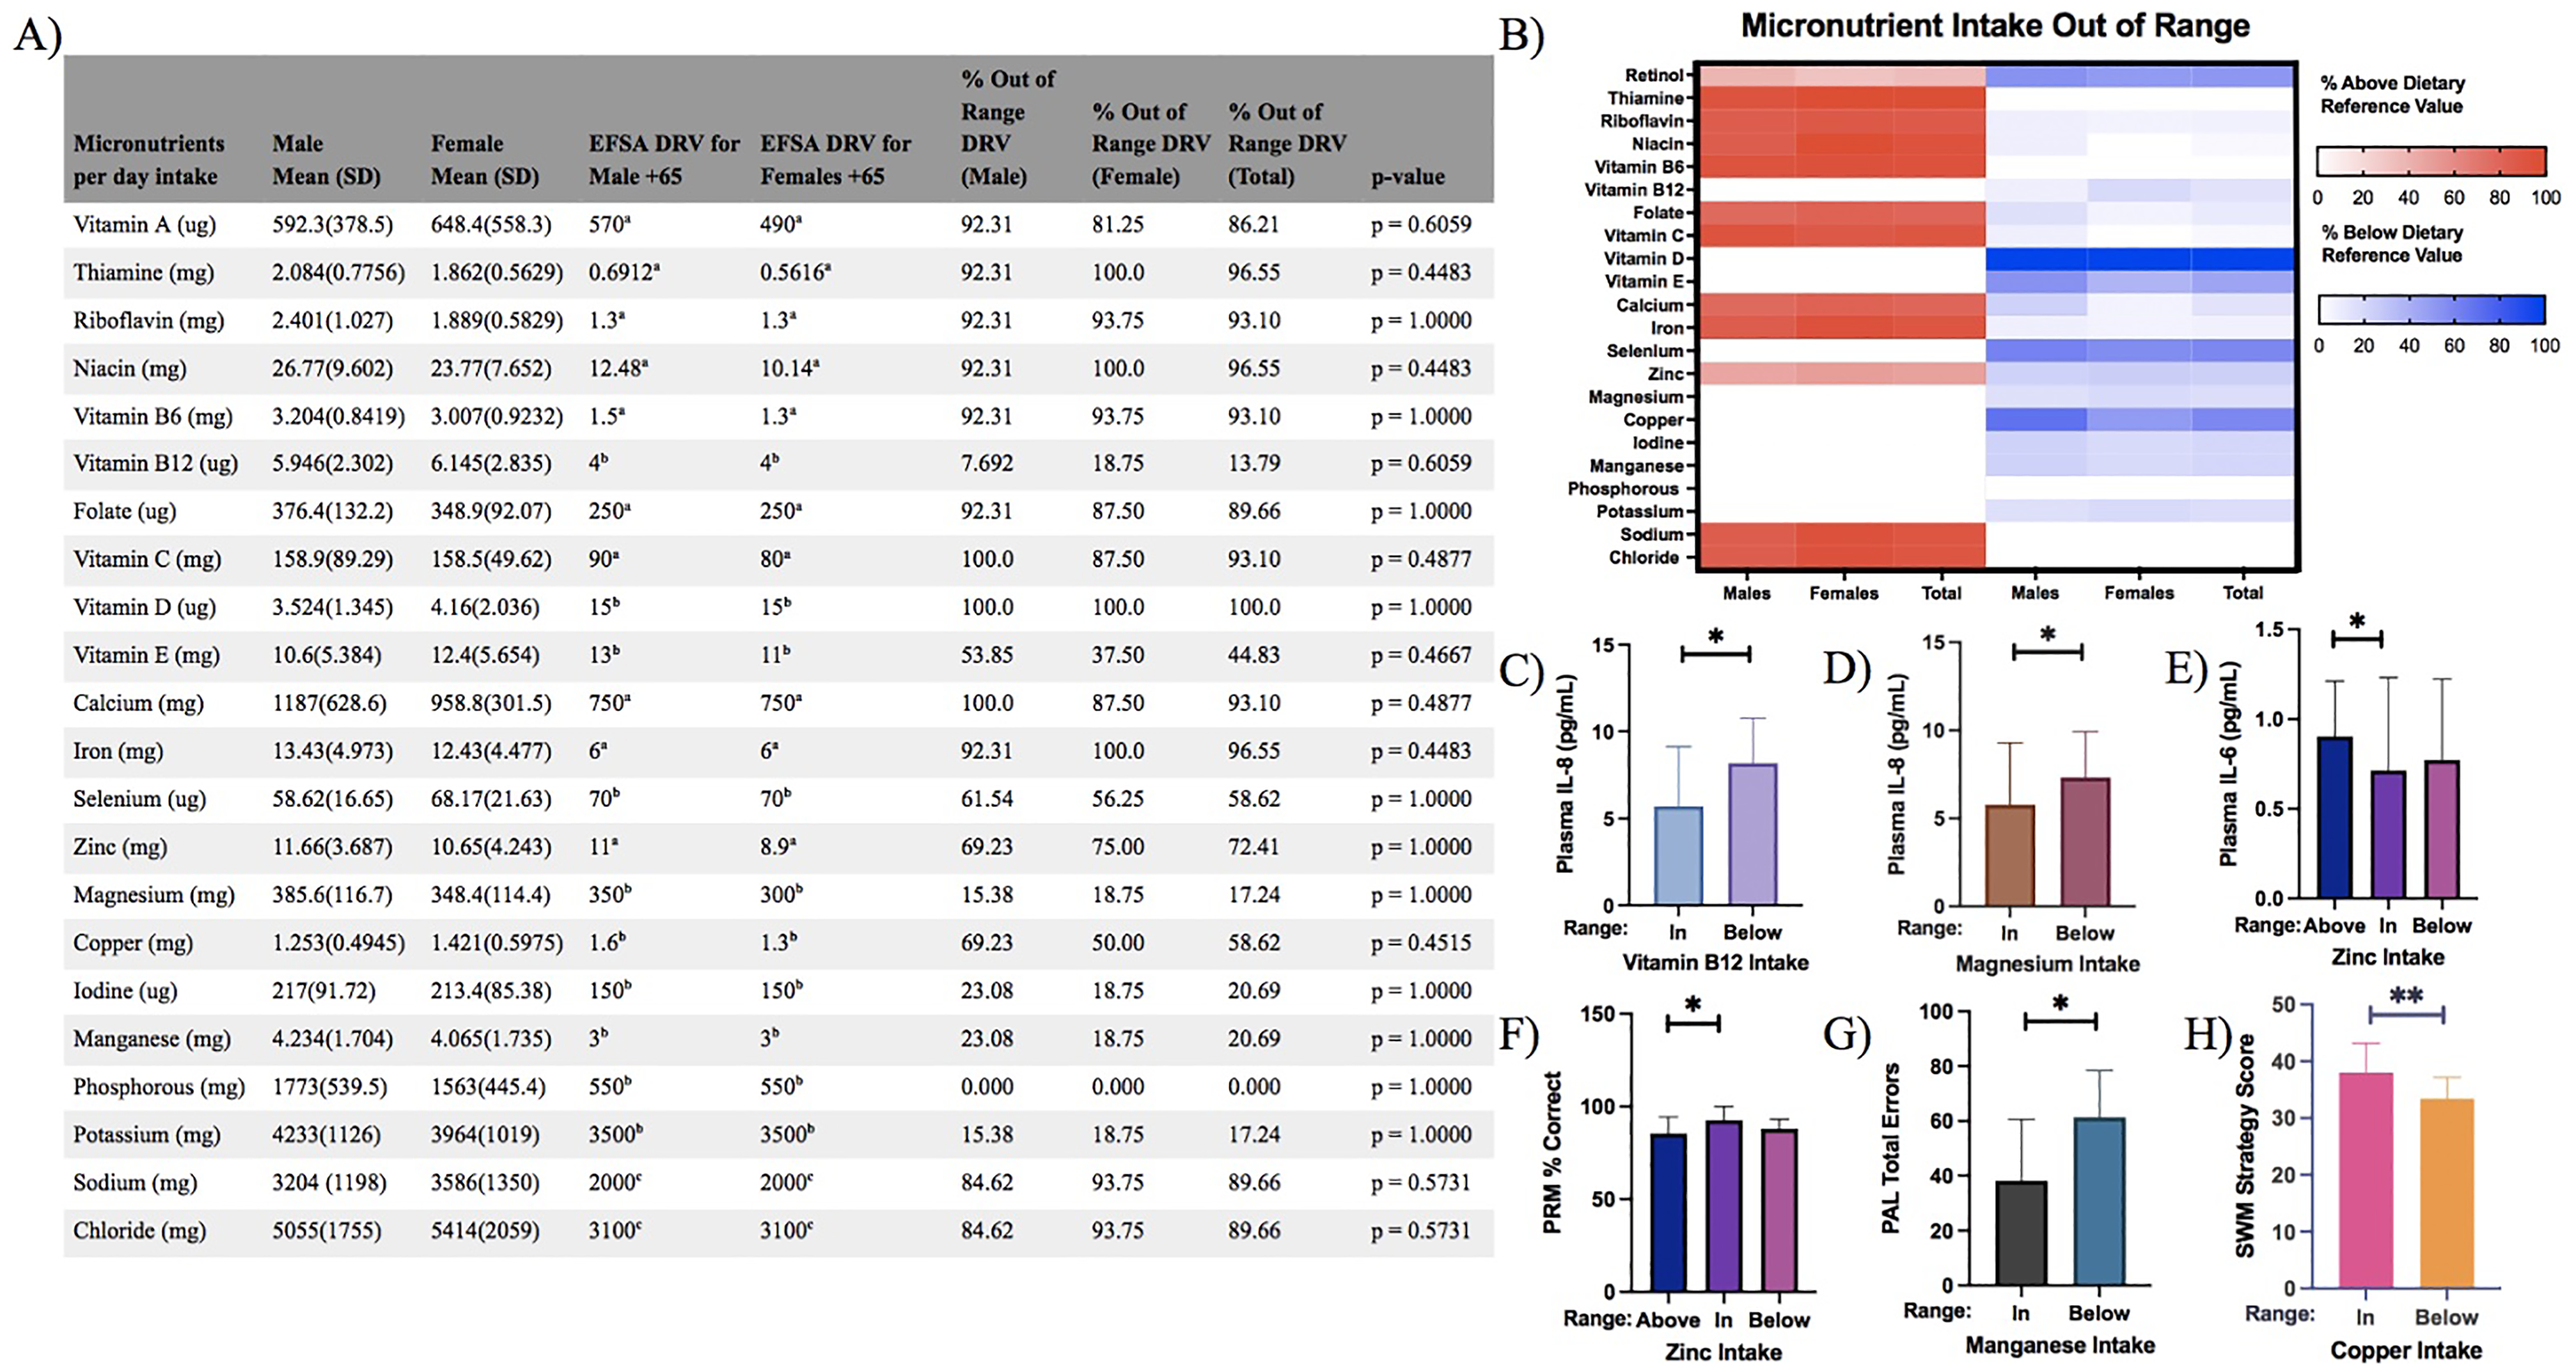
Deviations in micronutrient intake impact cognitive performance and inflammation in older aged adults. (A) No significant differences were observed in the percentage of micronutrient intake outside the DRV range between male (n = 13) and female (n = 16) older adults. (B) Heatmap visualizing deviations from the DRV, with strong red indicating intake above and strong blue indicating intake below the DRV for male, female and pooled older adults. Differences in intake distribution were analysed using Fisher's exact test. (C) Participants with vitamin B12 intake below the DRV exhibited significantly higher plasma IL-8 (pg/mL) levels (Mann–Whitney U test). (D) Participants with magnesium intake below the DRV showed significantly higher plasma IL-8 (pg/mL) levels (Mann–Whitney U test). (E) Participants with zinc intake above the DRV had significantly higher plasma IL-6 (pg/mL) levels (Kruskal–Wallis test with Dunn's post-hoc pairwise comparison). (F) Participants with zinc intake above the DRV demonstrated lower Pattern Recognition Memory (PRM) accuracy (% correct) (Kruskal–Wallis test with Dunn's post-hoc pairwise comparison). (G) Participants with manganese intake below the DRV made more errors on the Paired Associates Learning (PAL) task (independent samples t-test). (H) Participants with copper intake below the DRV showed lower Spatial Working Memory (SWM) strategy scores (independent sample t-test). Data in C–H is presented as mean ± SD (*p < 0.05, **p < 0.01). (a) Average requirement, (b) adequate intake, (c) safe and adequate intake. EFSA = European Food and Safety Authority; DRV = dietary reference value.
Cognitive performance varied significantly across micronutrient intake groups. Pattern Recognition Memory scores differed across zinc intake categories (Kruskal–Wallis H(2) = 6.50, p = 0.0387), with participants whose zinc intake exceeded the DRV (n = 14) showing significant lower PRM accuracy compared to those within the recommended range (n = 8) (p = 0.0397, r = 0.53; Figure 5F). Participants with manganese intake below the recommended range (n = 6) made significantly more total errors on the PAL task than those within the recommended range (n = 23) (t(27) = 2.35, p = 0.0265, r = 0.41; Figure 5G).Similarly, SWM strategy scores were significantly lower in participants with copper intake below the DRV (n = 17) compared to those whose intake met the recommended range (n = 12) (t(27) = 2.27, p = 0.0096, r = 0.47; Figure 5H). No significant associations were observed between cytokine levels and CANTAB scores cognitive performance scores.
Discussion
This pilot study highlights the intricate interplay between dietary intake, BMI, physical activity, systemic inflammation and cognitive function in older aged healthy Irish adults. The findings suggests that high BMI, low physical activity and deviations from DRV for specific nutrients, such as fibre, vitamin B12, magnesium and zinc, were associated with increased pro-inflammatory cytokine levels. In terms of cognitive outcomes, poorer performances were observed in participants with excessive intake of carbohydrates, PUFAs and zinc, as well in those with insufficient intake of kilocalories, manganese and copper. Conversely, higher intake of SFA and MUFA was associated with better cognitive scores. While associations are notable, they should be interpreted cautiously due to the modest sample size. Nevertheless, the consistent patterns observed warrant further investigation in larger, adequately powered cohorts.
Despite a small sample size (n = 29), findings align with epidemiological evidence linking elevated BMI and physical inactivity to chronic low-grade inflammation. The mean BMI of 26.89 kg/m2 in this cohort falls within the WHO's overweight category (WHO, 2010), consistent with data showing that around 60% of European older adults have BMI ≥ 25 kg/m2 (Peralta et al., 2018) with further studies showing increasing prevalence of obesity in older adults worldwide (Khaleghi et al., 2025; Pierse et al., 2018). Age-related reductions in resting metabolic rate, largely driven by decline in fat-free mass, contribute to increased adiposity and metabolic dysregulation (Esser et al., 2014; Júnior et al., 2021). Visceral fat promotes systemic inflammation via adipokine and cytokine secretion (Matilainen et al., 2024; Ouchi et al., 2011). Accordingly, obese participants in our study exhibited elevated plasma TNF-α and IL-10 compared to those with normal BMI. Tumor necrosis factor-alpha is a pro-inflammatory cytokine linked to systemic inflammation and insulin resistance (Khan et al., 2020; Song et al., 2023). In contrast, IL-10, traditionally viewed as anti-inflammatory, presents a more complex pattern with ageing such that it's concentration can increase with adiposity and sarcopenia in older adults (Rong et al., 2018; Valmorbida et al., 2023). Elevated IL-10 in this cohort may therefore reflect a compensatory anti-inflammatory response to chronic low-grade inflammation rather than a direct indicator of heightened systemic inflammation. While TNF-α is associated with cognitive decline in Alzheimer's disease (Plantone et al., 2023), we found no associations between TNF-α, other cytokines or BMI and performance on CANTAB cognitive tasks.
The cohort's mean physical activity was 4915 MET-min/week, exceeding WHO recommendations (Bull et al., 2020). Interestingly, higher plasma levels of the cytokines TNF-α, IL-6 and IL-10 were evident in participants with low IPAQ scores. Emerging evidence shows exercise reduces these inflammatory markers in older adults (Khalafi et al., 2023; Tayebi et al., 2025), suggesting physical activity helps counter chronic inflammation in ageing. Both obesity and low physical activity were associated with elevated TNF-α and IL-10, which may indicate a link between inflammation and metabolic factors, though this may reflect overlap between BMI and activity levels. Despite evidence that exercise protects against cognitive decline (Blondell et al., 2014; Kennedy et al., 2017), there was no association between IPAQ and cognition in the current pilot study.
In Europe, adherence to recommended macronutrient intake is generally poorer than for micronutrients (Rippin et al., 2017). In this cohort, the intakes of protein, total sugar, SFAs and total fat exceed DRVs. Compared to adults aged over 65 in the Irish National Adult Nutrition Survey, participants in this study consumed more kilocalories, protein, fat, carbohydrate and fibre (Bannon et al., 2011). Micronutrient intake was above recommended range for thiamine, niacin, iron, riboflavin, vitamin B6, vitamin C and calcium, while intake of vitamin D was below range. Elevated levels of plasma IL-8 were found in those whose fibre intake was below the DRV, consistent with studies showing inverse associations between dietary fibre and systemic inflammation (Leinig et al., 2019; Qi et al., 2023). Similarly, low vitamin B12 and magnesium intake correlated with higher plasma IL-8 levels, supporting evidence linking these nutrients to reduced pro-inflammatory cytokines (Alateeq et al., 2024; Domínguez-López et al., 2024; Samavat et al., 2018; Veronese et al., 2022) . These findings underscore the potential role of balanced nutrient intake in modulating inflammation, though more research is needed to fully understand the impact of these nutrients on systemic inflammation in ageing populations. Scores on tasks assessing PRM and visual learning and memory (PAL) were lower among participants with high carbohydrate intake and low kilocalorie consumption, respectively. Diets rich in refined carbohydrates have been associated with neurocognitive impairments (Hawkins et al., 2018) and an increased risk of cognitive decline, including mild cognitive impairment and dementia (Roberts et al., 2012). While moderate calorie restriction may provide cognitive benefits (Dias et al., 2020; Dorling et al., 2021; Witte et al., 2009), fasting and extreme caloric restriction have been associated with impairments in cognitive flexibility and psychomotor performance (O'Leary et al., 2025). These findings suggest that the effects of calorie restriction on cognition may depend on the degree and timing of the intervention. Combined with our study's finding of lower kilocalorie intake being associated with poorer visual learning and memory, evidence suggests a complex, context-dependent nature of calorie restriction in relation to cognitive health during ageing.
In the current study, higher scores in memory and executive function were found in those whose SFA and MUFA intake was above DRV, respectively. Conversely, those with PUFA intake above the DRV showed lower GNT percentage scores, a test of nominal function. While high SFA intake is associated with cognitive impairment and increased dementia risk (Cao et al., 2019; Ruan et al., 2018), likely in-part due to its role in cardiovascular disease and insulin resistance (Briggs et al., 2017; von Frankenberg et al., 2017), some meta-analyses have found no significant link between SFA intake and cognitive decline (Zhu et al., 2021). This unexpected association may reflect characteristics of the healthy older adult cohort and the limited sample size in this study, rather than indicating a true beneficial effect of saturated fat. Interestingly, emerging evidence suggests that SFAs may play a dynamic role in the brain, with increased levels observed during memory formation (Wallis et al., 2021). In contrast, MUFA intake has been linked to improved cognitive function in older adults (Jiang et al., 2020; Naqvi et al., 2011) while PUFAs, especially omega-3s, are associated with slower cognitive decline and reduced dementia risk (Bo et al., 2017; Dong et al.,2020; Jiang et al., 2020). Given these mixed findings, further research is needed to determine the optimal intake of specific fatty acids for cognitive health in ageing populations, taking into account the risk of comorbidities such as cardiovascular disease (Abdelhamid et al., 2020).
Older adults are particularly vulnerable to micronutrient deficiencies due to factors such as reduced intake, impaired absorption and altered nutrient utilization (Norman et al., 2021). In the current pilot study, lower manganese and copper intake levels below the DRV were associated with poorer scores in memory and executive function, respectively. Manganese plays a crucial role in both the developing and ageing brain (Balachandran et al., 2020), with higher plasma concentrations linked to cognitive impairment in older adults and those genetically predisposed to Alzheimer's disease (Barahona et al., 2022; Kim et al., 2023). Similarly, cognitive decline has been associated with low serum copper concentrations in older adults (Choe et al., 2022). These findings underscore the need for further investigation into the role of micronutrients such as manganese and copper in cognitive decline and their potential as therapeutic targets in the ageing population.
There are several factors that should be considered in future replication with larger cohorts. As this is a pilot study, there is a small sample size (n = 29), which limits statistical power to detect smaller effects and restricts the generalizability of the findings. Given the multitude of factors affecting the bioavailability and metabolism of nutrients in the older adults, a limitation of this pilot study is that circulating levels of nutrients were not measured. Although the FFQ is detailed and validated, self-reported dietary intake may be subject to recall bias. In addition, nutrient intake was estimated via FFQ and circulating levels were not measured, so reported intake may not fully reflect systemic availability or bioactive nutrient status. While this pilot study cannot establish causality, the possibility of reverse causation cannot be excluded, whereby systemic inflammation may influence dietary choices or cognitive performance. Indeed, higher dietary inflammatory potential has been independently associated with an increased risk of cognitive impairment; however, reverse causation remains a concern, as individuals with cognitive impairment may adopt more pro-inflammatory diets (Fang et al., 2025). Although years of education and baseline NART were collected as proxies for cognitive reserve, these variables were not included in our analytical models due to the limited sample size. Incorporating such covariates into multivariable or mixed-effects models would have substantially reduced statistical power and increased the risk of overfitting. However, both factors are known to influence cognitive outcomes and may moderate the impact of lifestyle or biological variables on cognition. Similarly, other potential confounders such as age, gender and socio-economic status were not adjusted for in the statistical models. While these factors were relatively balanced across the cohort, their potential influence on cytokine levels and cognitive performance cannot be ruled out. Future studies with larger sample sizes could incorporate these variables to more comprehensively account for potential confounding factors and improve interpretability.
Notably, all of the observed effect sizes were medium to large in magnitude. However, given the exploratory nature of the study, small overall sample size and wide confidence intervals, the effect sizes may overestimate the true population effects. In particular, comparison involving very small subgroups (n = 4) should be interpreted with caution. Nevertheless, the consistent observation of medium to large effect sizes across several outcomes suggests potentially meaningful relationships that warrant replication and further investigation in adequately powered studies.
Conclusion
The current findings support the wider literature that higher BMI and low physical activity are associated with systemic inflammation. This pilot study highlights potential associations between lifestyle factors, specific diet, physical activity, BMI, systemic inflammation and cognitive function in healthy older adults. While the findings align with existing literature, the small sample size and cross-sectional design limit causal interference and generalizability. These preliminary results provide a foundation for future investigations with larger cohorts, to validate and extend the findings.
Footnotes
Author Contributions
CO'D analysed and interpreted the data, prepared the figures and wrote the manuscript. CL-S conceptualised, designed and conducted experiments, collected and analysed the data and edited the manuscript. JMH and GC oversaw analysis and interpretation of data. ST conceptualised and designed experiments; oversaw analysis and interpretation of data. SG analysed and interpreted the data, supervised CO'D, prepared the figures and wrote the manuscript. YMN conceptualised and designed experiments; oversaw analysis and interpretation of data, supervised CO'D, acquired funding and wrote the manuscript. All authors reviewed the manuscript and approved the final draft.
Availability of data and materials
The data that support the findings of this study are available upon reasonable request.
Declaration of conflicting interests
The authors declared no potential conflicts of interest with respect to the research, authorship and/or publication of this article.
Ethical statement
The study was conducted according to the Declaration of Helsinki. Ethical approval was granted by the Clinical Research Ethics Committee of the Cork Teaching Hospitals (CREC) (CREC review reference number ECM 3; study number YN001).
Funding
The authors disclosed receipt of the following financial support for the research, authorship and/or publication of this article: This work was supported by Research Ireland (formerly Science Foundation Ireland) (grant numbers 14/ADV/IA5371, SFI/FFP/6820, and SFI/12/RC/2273_P2).