
Abstract
Introduction
Malnutrition is an independent predictor of poor outcome in the intensive care unit (ICU) setting. Therefore, nutrition status is a determinant of outcome in ICU patients (Lew et al., 2017). Nutrition support, close monitoring, and risk assessment are necessary for all patients staying longer than 1–2 days in the ICU (Hiesmayr, 2012).
A recent study of Kaddoura et al. figured out the prevalence of malnutrition in critically ill patients was 36%, using Patient-Generated Subjective Global Assessment (PG-SGA) (Kaddoura et al., 2020). Another study in China using Nutrition Risk Screening 2002 (NRS2002) tool showed that 39.81% of patients in the ICU had nutritional risk (Qiao et al., 2020). In Malawi, the rate of moderate and severe malnutrition among critical care patients was 62% by Mild-Upper Arm Circumference (MUAC) (Barcus et al., 2021). In Vietnam, a study conducted in Bach Mai Hospital presented that there were 18.9% of critically ill patients having low BMI, 27% were high nutritional risk by modified Nutrition Risk in Critically Ill (mNUTRIC) (Nguyen, 2016).
NRS2002 and mNUTRIC are two tools recommended by Asian American Society for Parenteral and Enteral Nutrition (ASPEN) for nutritional screening although European Society for Clinical Nutrition and Metabolism (ESPEN) said that no “gold standard” for nutritional assessment among patients in the ICU (McClave et al., 2016; Singer et al., 2019).
The nutrition support for critically ill patients meeting the recommended demands is challenging in developing countries like Vietnam where the equipment and nutrition products are lacking. Moreover, health insurance still does not cover nutrition care activities, and many hospitals have not established the department of nutrition. Therefore, we conducted this study to estimate the prevalence of patients with nutritional risk at admission and describe the diet of critically ill patients.
Methods
This observational cohort study was conducted at Department of Intensive Care Unit, General Hospital of Agriculture, Hanoi, Vietnam. Data was collected from April to December 2020 by convenience sampling method.
Inclusion criteria were adults aged 18–65 years with an expected stay in the ICU of at least five days. Patients were excluded if the information could not be obtained from the patients or their relatives.
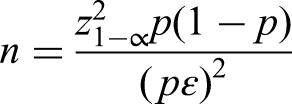
We used the formula for calculating the sample size for estimating a ratio in the population:
The recorded variables were general characteristics, nutritional status, and feeding regimen. Age (years), gender, primary diagnosis, co-existing comorbidities, and mechanical ventilation were gathered by directly interviewing patients’ relatives and taking from medical records. The height was estimated according to the Chumlea formula as follows (Berger et al., 2008; Chumlea and Guo, 1992):


The patients’ weight was measured by Healthometer 2000KL Stretcher Scale within 24 h of admission. Body Mass Index (BMI) was calculated as the weight (kg) divided by the square of the height (m). We used the cut-off value for low BMI in Asian populations: severely low BMI (<17.8 kg/m2), low BMI (≥17.8 to <20 kg/m2), normal BMI (20–22.9 kg/m2), overweight (≥23 kg/m2) (Akazawa et al., 2021). MUAC measuring tape with non-tear stretch-resistant material was used by clinical dietitians. In Vietnamese adults, women with lower than 23-cm MUAC and men with lower than 24-cm MUAC were assessed as malnutrition (Pham, 2012).
NRS2002 and mNUTRIC were used by clinical dietitians to determine the nutritional risk of all patients. NRS2002 consisted of three parts: nutrition status, the severity of disease, and age. The nutrition status was assessed from 0–3 points according to BMI, weight loss and food intake. The severity of diseases was scored according to disease classification. Adding 1 point if age ≥70 years. The scale of this tool was from 1 to 7. Patients had nutritional risk if the points were from 3 above, high nutritional risk if the points ≥ 5 (Gokcan et al., 2015). mNUTRIC tool is based on five indexes: age (years), the number of comorbidities, Acute Physiology and Chronic Health Evaluation II (APACHE II), Sequential Organ Failure Assessment (SOFA), and the number of days hospital before admission to ICU (Antonelli et al., 1999; Knaus, 1985). These indexes were classified from 0 to 3 points. Patients had high nutritional risk if the points were from 5 to 9 and low nutritional risk was from 0 to 4 (Heyland et al., 2011).
The nutrition regimen of all subjects was monitored and recorded by clinical dietitians from admitting time to the seventh day. It included all nutrition products which was used by the parenteral or enteral route.
Data processing and analysis: the data were imported into the computer with Epidata 3.1 software and analysed with STATA 15.0 software. The nutrients of patients’ regimens were analysed by utilising the Vietnamese Food Composition Table of the National Institute of Nutrition (Le, 2017) and the nutrition facts label on the product.
Results
Characteristics of patients were summarised in Table 1. The average age was 66.5 ± 15.4. Male patients accounted for most subjects (73.4%). Respiratory diseases were the most prevalent with 46.8%, followed by gastrointestinal (18.2%) and cardiovascular diseases (16.9%). More than haft of patients had ≥3 comorbidities. 27.3% of patients need mechanical ventilation.
Characteristics of patients on admission to intensive care unit.
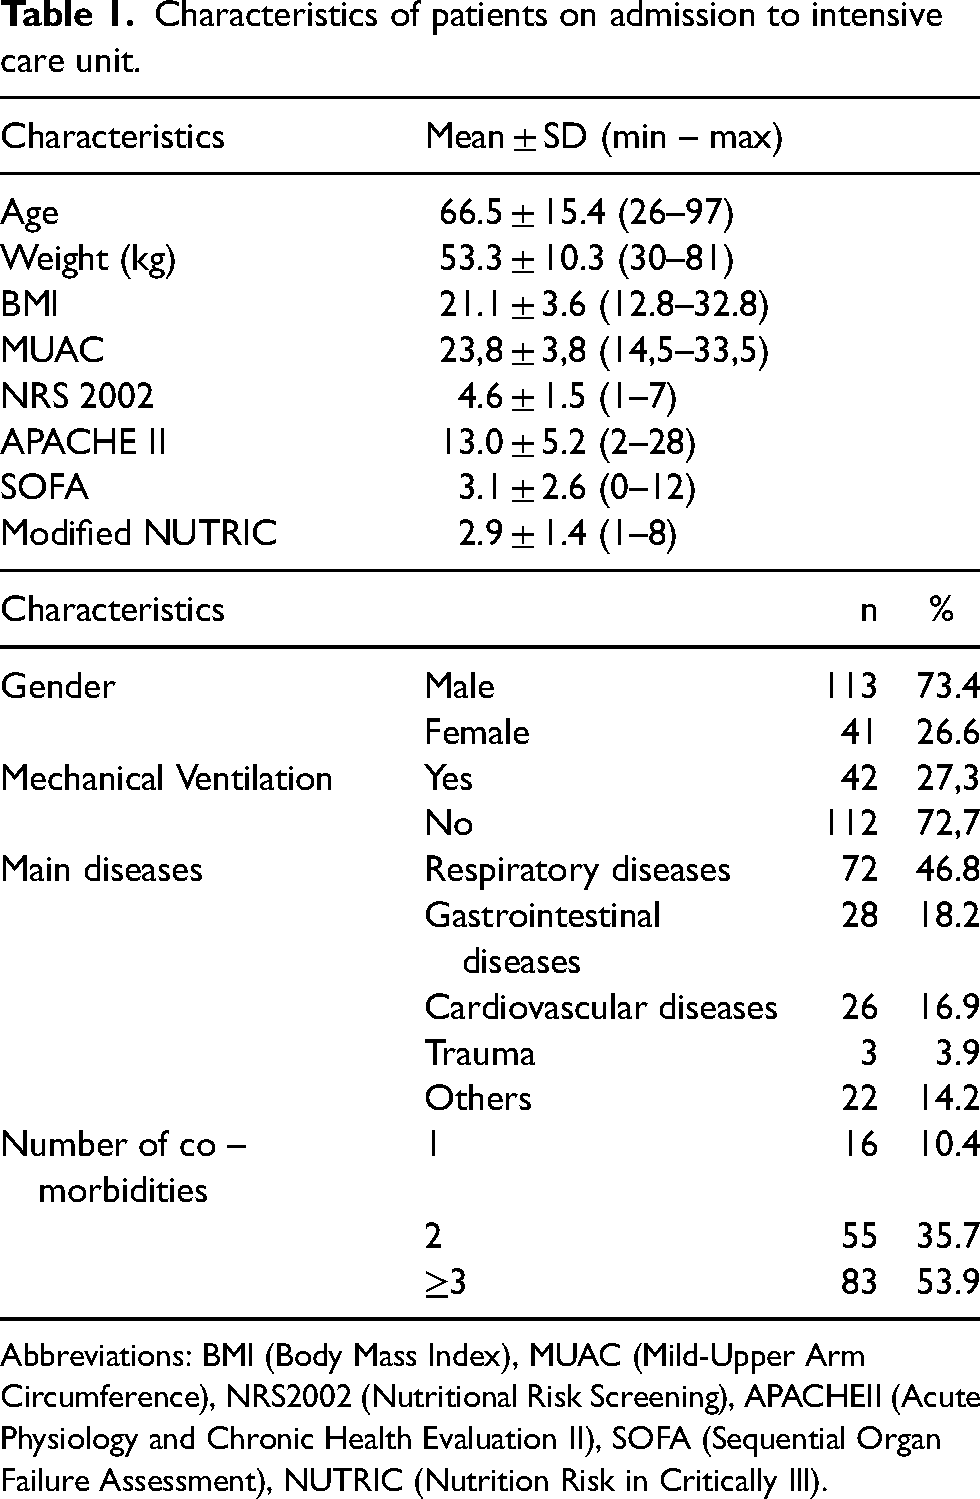
Abbreviations: BMI (Body Mass Index), MUAC (Mild-Upper Arm Circumference), NRS2002 (Nutritional Risk Screening), APACHEII (Acute Physiology and Chronic Health Evaluation II), SOFA (Sequential Organ Failure Assessment), NUTRIC (Nutrition Risk in Critically Ill).
Table 2 shows the percentage of malnutrition and nutritional risk of ICU patients. According to the anthropometric index, 47.4% of patients were malnutrition by MUAC; nearly 40% had BMI <20, including 16.2% had severely low BMI <17.8, 20.8% had BMI ≥17.8 to <20. The rate of patients with high nutritional risk assessed by two tools NRS and mNUTRIC were 53.9% and 13%.
Nutritional status and nutritional risk of patients at admission.
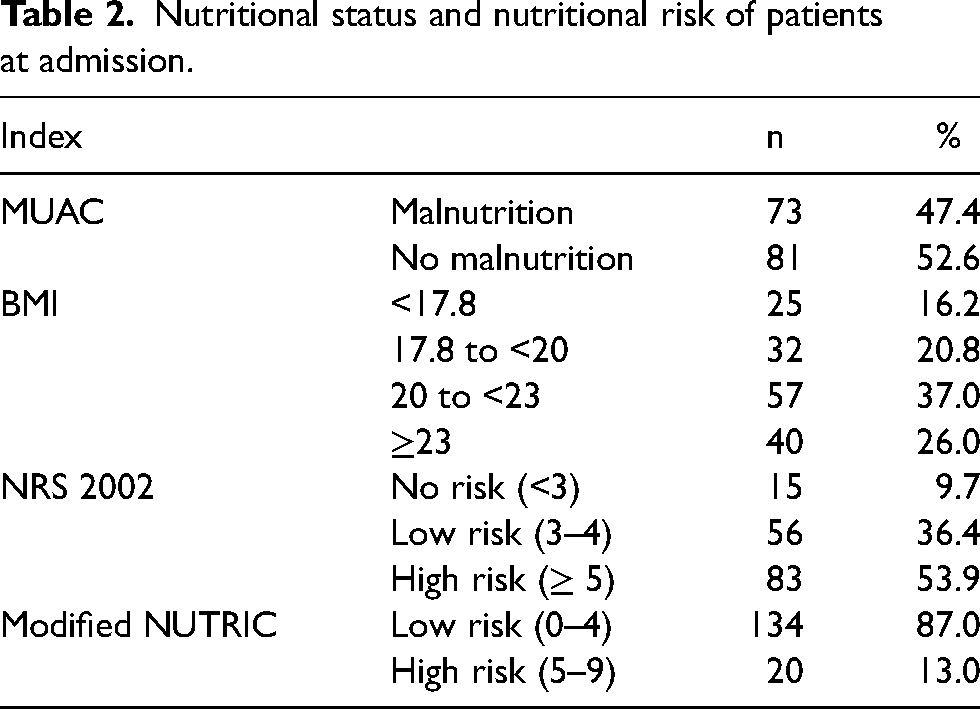
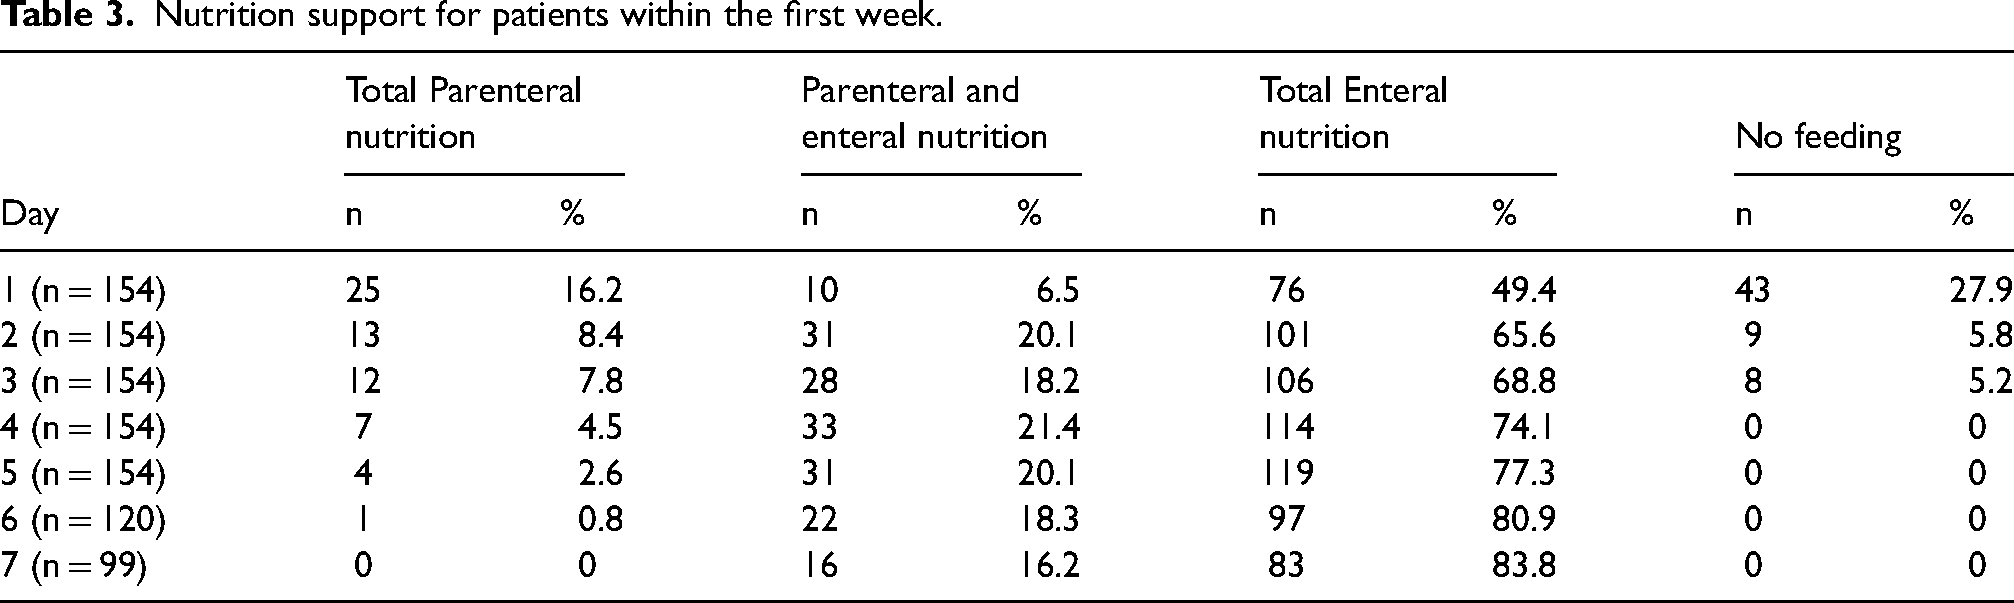
Table 3 presents the nutritional route of administration within the first week. The ratio of total parenteral nutrition (PN) gradually decreased from 16.2% on the first day to 0.8% on the sixth day. By the seventh day, nobody received total PN. In contrast, the ratio of total enteral nutrition (EN) gradually increased from 49.4% to over 80% between the first and seventh day. The combination of parenteral and enteral nutrition only accounted for 6.5% on the first day then rise to around 20% on the following day and down to 16.2% on the seventh day. 43 patients (27.9%) with no nutrition support when admission. This number rapidly reduced on the second and third days.
Nutrition support for patients within the first week.
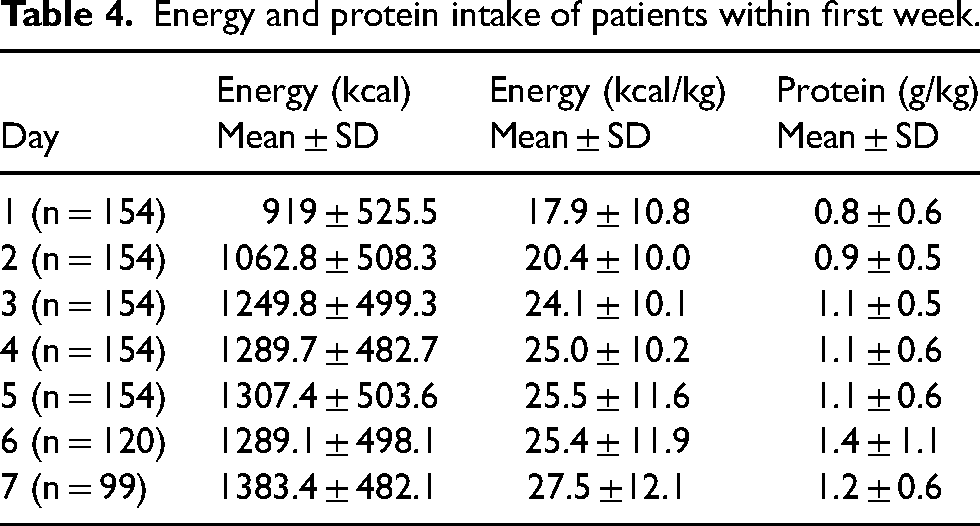
The energy and protein intake of patients were displayed in Table 4. There was a gradual increase in energy intake. It raised from 919 ± 526 kcal/day to 1383.4 ± 482 kcal/day (17.9 ± 10.8 kcal/kg/day to 27.5 ± 12.1 kcal/kg/day). On the first day, protein intake only was 0.8 ± 0.6 g/kg then this number increased and reached the highest level 1.4 ± 1.1 g/kg on the sixth day.
Energy and protein intake of patients within first week.
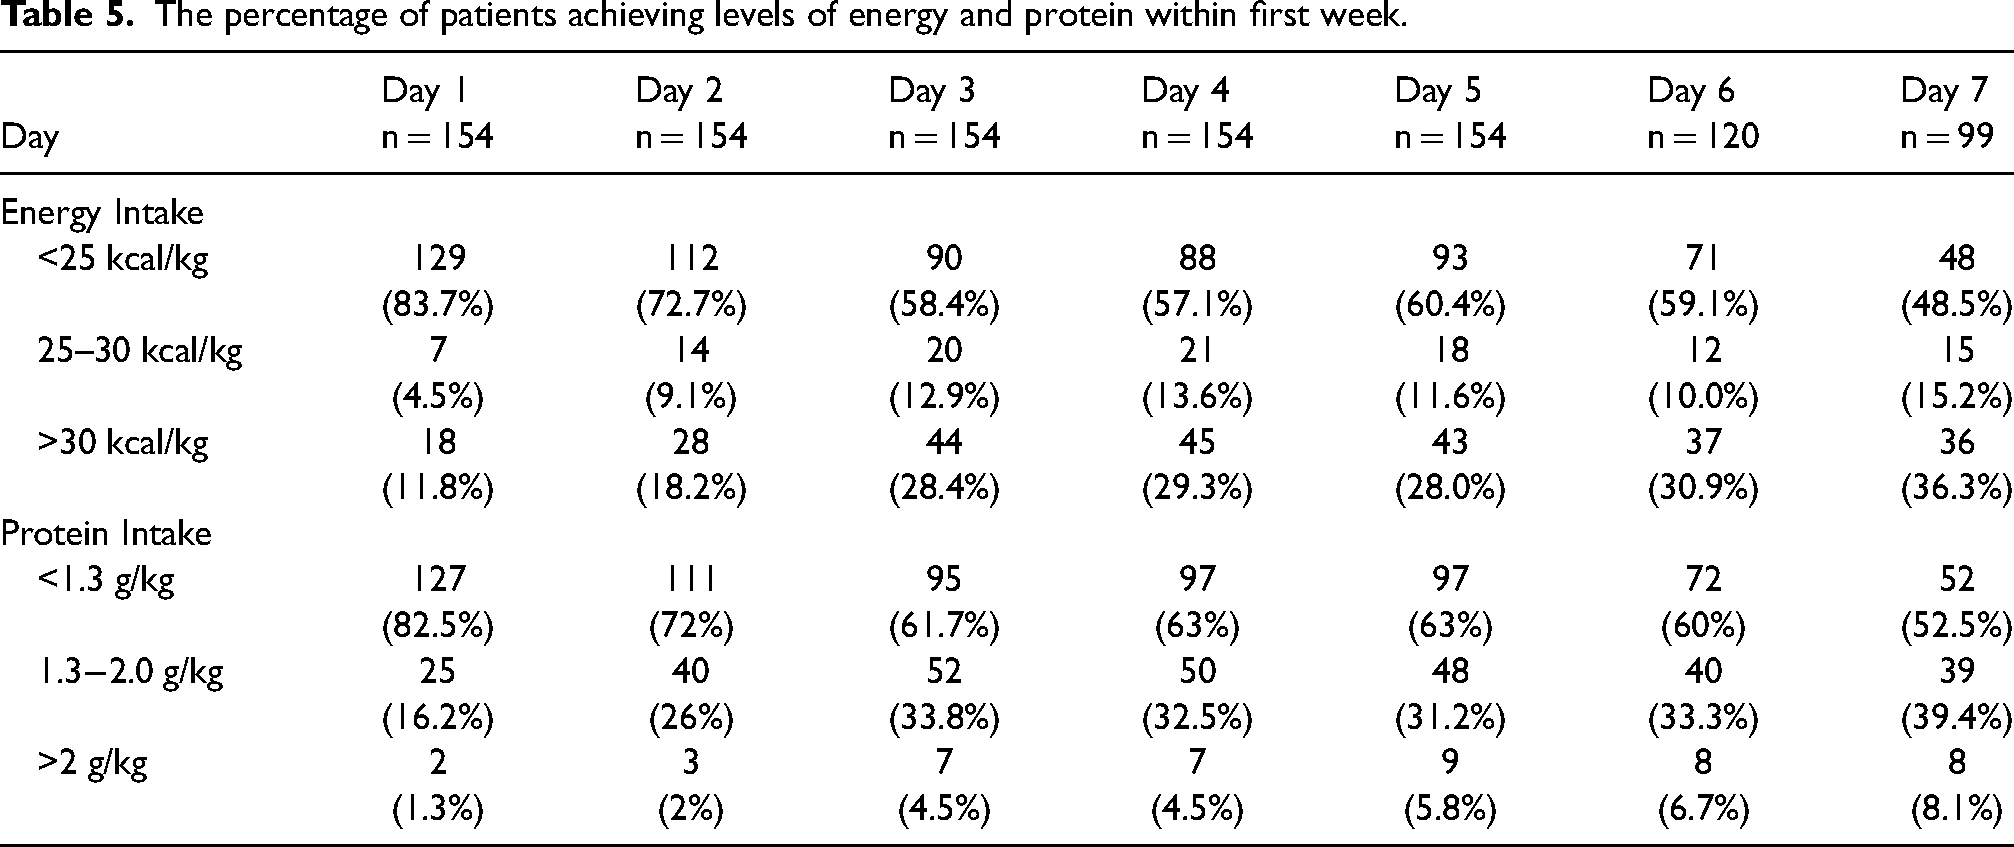
On the first day, 83.7% of subjects were nourished with energy intake less than 25 kcal/kg. This percentage reduced in the following days and there was only 48.5% on the seventh day. The proportion of subjects with protein intake less than 1.3 g/kg on the first day made up 82.5%, 72% on the second day, and then continuously decreased after that. However, this ratio was still over haft on the seventh day (52.5%). Around one-third of subjects reached the above 1.3 g/kg protein intake (Table 5).
The percentage of patients achieving levels of energy and protein within first week.
Discussion
An important finding is that a large proportion of the patients of this cohort was at high risk of being malnourished based on very low to low BMI (16.2% had BMI <17.8, and 20.8% a BMI ≥17.8 to <20). We found that 26% of subjects were overweight (BMI≥ 23), this number was similar to Ta's study (25.6%) and lower than Anthony's in Cleveland Hospital, Ohio (40%) (Anthony, 2008; Ta, 2017).
According to NRS2002, our study shows that 90.3% of patients were at nutritional risk, and 53.9% had high nutritional risk (NRS≥5). The average of NRS2002 was 4.6 ± 1.5. This result had a similarity to the studies of Qiao Sun (87.62%) and Nguyen Thi Trang (87%), but higher than Javid (41,0%) and Shpata (62.6%) (Javid Mishamandani et al., 2019; Nguyen, 2018; Qiao et al., 2020; Shpata et al., 2015). In contrast, our result was different from Nguyen Phuong Thao's study showed the percentage was 100% of patients with nutritional risk by NRS2002 (Nguyen, 2019).
According to mNUTRIC, only 13% of subjects were at high nutritional risk. The average score was 2.9 ± 1.4. This rate was much lower than the results of Nguyen Huu Hoan (27%), Ta Thanh Nga (83,7%), Nguyen Thi Trang (42%), and Nguyen Phuong Thao (50%) (Nguyen, 2016, 2018, 2019; Ta, 2017). This difference is probably explained by the characteristics of the patients included in our cohort, as our hospital admits patients with lower severity than central hospital. As the mNUTRIC score is based on the severity scores APACHEII and SOFA, the lower severity characterizing our cohort results in low mNUTRIC values. As the score does not include any nutritional variable this aspect cannot be integrated, which is the case in the NRS2002: the latter therefore better reflects the status of our cohort.
The percentage of high nutritional risk by NRS2002 (53.9%) was higher than the rate by mNUTRIC (13%). Some studies compared these two tools in clinical practices among critically ill patients, which showed different and inconsistent results (Canales et al., 2019; Coruja et al., 2020). A study of Qiao Sun et al. presented that NRS2002 was suitable for patients with low severity of disease and mNUTRIC was suitable for critically ill patients with coma due to its parameters were objective and easy to collect (Qiao et al., 2020). Although NRS2002 and mNUTRIC were recommended by ASPEN, ESPEN did not agree with ASPEN guidelines and suggested that a definition of acute critical illness with associated malnutrition still needs to be developed (McClave et al., 2016; Singer et al., 2019). Recently, the GLIM criteria were proposed by many experts to diagnose malnutrition in adults in clinical settings on a global scale. It combined phenotypic criteria (weight loss, low BMI, reduced muscle mass) and etiologic criteria (reduced food intake, inflammation, or disease burden) (Cederholm et al., 2019).
The mean energy delivery reached 919 kcal on day 1, 1250 kcal by day 3, and 1383 kcal by day 7, which is rather elevated. This energy intake was lower than Ngo Quoc Huy's result carried out at ICU, Bach Mai hospital (1365 ± 558 kcal/day to 1601 ± 358 kcal/day) and Duong et al. in Buu Dien Hospital (1444 ± 548 kcal/day to 1640 ± 450 kcal/day within first seven days) (Duong et al., 2021; Ngo, 2012). Another study of Alberda et al. showed the mean energy intake among ICU patients was 1034 ± 514 kcal/day (Alberda et al., 2009).
According to ESPEN guidelines, it was recommended that energy requirement during the acute and initial phase was 20–25 kcal/kg/day, during the anabolic recovery phase aimed to 25–30 kcal/kg/day (Sioson et al., 2018). In our study, 83.7% of patients with energy intake lower than 25 kcal/kg/day on the first day, 60.4% on the fifth day, and 48.5% on the seventh day. The rate of patients reached from 25 kcal/kg/day above increased from 16.3% to 51.5% within seven days. This rate was lower than Nguyen Thi Trang's study (70.6% on the seventh day) (Nguyen, 2018).
The critically ill patients have strong protein catabolism, and the patients may lose up to 2% of muscle mass per day during ICU stay (Puthucheary et al., 2013; Reid, 2004; Wandrag et al., 2019). ESPEN recommended the requirement of protein intake should be 1.3–2.0 g/kg/day for these patients (Dickerson et al., 2012; Singer et al., 2019; Sioson et al., 2018). A multicentre study showed that meeting protein requirements may be more important than meeting energy requirements (Nicolo et al., 2018). In our study, the patients only reached protein intake 0.80 ± 0.55 g/kg on the first day and then this number gradually increased to 1.43 ± 1.13 g/kg on the sixth day.
Our study also presents that the percentage of patients with protein intake lower than 1.3 g/kg/day was extremely high on the first day (82.5%). This number was 72% on the second day. By the seventh day, still over haft of patients had protein intake lower than 1.3 g/kg/day. This result was similar to Nguyen Phuong Thao's study carried out in Dong Da Hospital (Nguyen, 2019). Several patients received very high doses of protein (>2 g/kg/day) due to these patients being stage III and IV pressure ulcers or major burned patients.
On the first day, nearly haft of patients was nourished by total enteral nutrition. However, there was still a high rate of patients without nutrition support (27.9%). This may be explained by the fact that some patients had been not out of the acute phase, so the initiation of feeding was postponed until stabilization according to guidelines.
The percentage of patients with EN support increased gradually and accounted for over 90% on the fourth day, and 100% on the seventh day. Simultaneously, the rate of total PN support decreased gradually and reached 0% on the seventh day.
Our study shows that the combination of PN and EN made up approximately 20% since the second day. Only EN support aims to meet the energy and protein requirements, which is so difficult in the several first days. Therefore, many studies recommended that it is essential to combine PN and EN (Tran, 2016; Vallejo et al., 2017). The patients received the progressive feeding regimen from day 1 to day 7, which was the correct strategy, respecting metabolic changes associated with acute disease.
This research provided the first evidence at General Hospital of Agriculture for nutrition support in ICU. However, the study still has some limitations. The first is small sample size so it cannot be representative of the total population. Secondly, the follow-up period was only seven days, so it was impossible to fully determine the nutritional risk at discharge and clinical outcomes for further analysis.
In conclusion
Footnotes
Acknowledgments
We would like to thank all patients who agreed to participate in this study.
Authors’ contributions
Tuong Pham Duy worked as a mentor for this study. Diep Pham Thi was the main author and was responsible for study design, data analysis, and article preparation and revision. All authors agree with this manuscript and the content has not been published elsewhere.
Availability of data and materials
Data and materials will be made available upon request.
Consent for publication
The authors permit the Journal to publish this paper.
Declaration of conflicting interests
The author(s) declared no potential conflicts of interest with respect to the research, authorship, and/or publication of this article.
Ethical approval
This article was a part of the master thesis permitted by General Hospital of Agriculture and approved by Ethics Committee number 4752/QĐ-ĐHYHN of Hanoi Medical University. All patients or their relatives were carefully explained and signed the consent form before participating in this study.
Funding
The author(s) received no financial support for the research, authorship, and/or publication of this article.