
Abstract
Background:
Depression among the elderly is a growing public health concern, especially in India. This study aimed to investigate the predictive validity of physiological, psychological, and functional health factors in classifying the level of depressive symptoms among the elderly using the extreme gradient boosting (XGBoost) technique. Additionally, we compared the performance of models trained on original and resampled data.
Methods:
This study is entirely based on secondary data analysis of the Longitudinal Aging Study in India wave 1 data. We classified the observations into “high depressive symptom” and “low/no depressive symptom” groups based on the predictors, including physiological, psychological, and functional health factors, along with socio-demographic factors. We developed three models (Models 1, 2, and 3) trained on original, over-sampled, and under-sampled data, respectively. Model performance was evaluated using the metrics of balanced accuracy, sensitivity, specificity, and area under the receiver operating characteristics curve (AUC).
Results:
The study included 26,065 individuals aged 60 and above. Model 3, trained on under-sampled data, demonstrated the best overall performance. It achieved a balanced accuracy of 64%, with a sensitivity of 62.8% and specificity of 65.2%. The AUC for Model 3 was 0.692. Feature importance analysis revealed that life satisfaction, instrumental activities of daily living, mobility, caste, and monthly per capita expenditure quintiles were among the most influential factors in predicting the level of depressive symptoms.
Conclusion:
The XGBoost models demonstrate promise in predicting depressive symptoms among the elderly. These findings suggest that machine learning models can be envisaged for early detection and management of depression, especially in primary care.
Machine learning models, especially XGBoost, are effective tools for predicting depression among the elderly. Factors such as life satisfaction, instrumental activities of daily living, and mobility are key predictors of depressive symptoms, along with socio-demographic variables like caste and income. We compared the XGBoost models trained on both original and resampled data, and the model trained on under-sampled data showed the highest balanced accuracy and AUC score.Key Messages:
Home to 1.4 billion people, India is on the verge of a demographic shift with a growing elderly population due to increased life expectancy, reduced mortality, and declining fertility. 1 Globally, the elderly population constitutes around 10% of the world’s population and is expected to increase significantly in the coming decades. 2 As of 2022, India’s elderly population was approximately 10.5% of its total population. 3
Depression, a common mental disorder among this population, is observed to affect 13%–34.4% of the elderly population in India, with a higher prevalence in females. 4 Depression in the elderly arises from a complex interplay of social, psychological, and biological factors. 5 Physical health problems such as chronic medical conditions, reduced independence in daily life functioning, and negative life events such as the death of a spouse increase the risk of depression.6,7 Additionally, cognitive decline and diminished mobility, both commonly associated with the aging process, worsen the negative impact of the condition. 8 Various validated diagnostic tools are available to detect the presence and severity of depression among the elderly, including both interview-administered questionnaires and self-report rating scales. 9 Despite the popularity and clear advantage of these scales, detecting the problem of depression among the elderly is challenging and often undetected, mainly due to the complex symptomatology, poor patient insight, and co-occurrence of cognitive impairments. 10 Self-report scales rely heavily on the respondent’s ability to comprehend and accurately respond to questions. This may be compromised by factors such as low educational attainment and cognitive impairment, which are particularly relevant in the elderly population. On the other hand, structured interviews require significant time and specialized skills, which limit their practical utility, particularly in resource-constrained settings like many parts of India. There is a critical need for more accurate, efficient, and objective methods to assess depression among the elderly. Technological advances in machine learning models have made it possible to analyze large datasets with algorithms trained to predict the likelihood of depression based on various risk factors.11,12 One promising approach is the use of advanced machine learning techniques, such as extreme gradient boosting (XGBoost) models. 13 It has an established track record in predicting a range of health outcomes in previous studies, including heart disease, chronic kidney disease, diabetes, and thyroid disorders,14–17 and more recently, in mental health conditions such as depression.18–21
This study attempted to investigate the predictive validity of physiological, psychological, and functional health factors along with socio-demographic factors in the prediction of depressive symptoms among the elderly (60 years and above) using the XGBoost algorithm. Additionally, the study compared the performance metrics of different XGBoost models developed using original and resampled data. The XGBoost machine learning model is relatively new in the context of analyzing depression among the elderly in India, offering a sophisticated approach to classification compared to traditional statistical methods. 22 XGBoost significantly aids in predicting depressive symptoms by handling large datasets and identifying complex patterns. 19 It also highlights feature importance, providing insights into key factors contributing to depression. 23 With its ability to achieve high-performance metrics like accuracy and precision, XGBoost is robust and reliable. 13 Additionally, as an ensemble method, it reduces the risk of overfitting by combining multiple weak models to form a strong predictor. 13 These models offer the potential to overcome the subjective biases and logistical challenges associated with traditional diagnostic methods for depression. 24 By examining physiological, psychological, and functional health determinants, the study provides a more holistic view of both subjective and objective factors influencing depression among the elderly in India. By identifying key predictors and evaluating the performance of advanced machine learning models, this study contributes to the ongoing discourse on developing objective and efficient tools for identifying individuals at risk of depression. Insights from these models can help reduce healthcare costs by facilitating early and proactive identification of high-risk elderly individuals. 25 Integrating machine learning and artificial intelligence tools into electronic health records, primary care settings, or mobile health platforms to analyze patient data would assist in flagging individuals at high risk of depression, allowing for timely interventions that could potentially prevent the onset or progression of the condition. As a result, this approach can reduce healthcare costs and minimize the need for extensive clinical evaluations. Additionally, the study contributes to the existing literature by exploring new dimensions of depression determinants and offering a comparative analysis of advanced machine learning techniques against traditional methods, enriching the current body of research. The findings are particularly relevant to mental health professionals and researchers seeking innovative, more objective, and efficient approaches for early identification of depression risk in the elderly.
Methods
This study is a secondary data analysis of the Longitudinal Aging Study in India (LASI)- Wave 1 data. 26 The LASI was conducted between April 2017 and December 2018 and provided a comprehensive dataset of over 70,000 older adults aged 45 and above, representing all states and union territories of India. The survey utilized a multi-stage stratified area probability cluster sampling design to ensure representation across diverse geographic and socio-economic strata. Detailed information on the survey design, sampling procedure, and data collection methodologies are available on the data source website. 26 The LASI wave I data is freely available in the public domain and accessible upon request. 26 We followed the “Strengthening the Reporting of Observational Studies in Epidemiology (STROBE)” cross-sectional reporting guidelines to ensure comprehensive and transparent reporting of our study findings. 27 The STROBE checklist has been presented in the supplementary file (see Table S1).
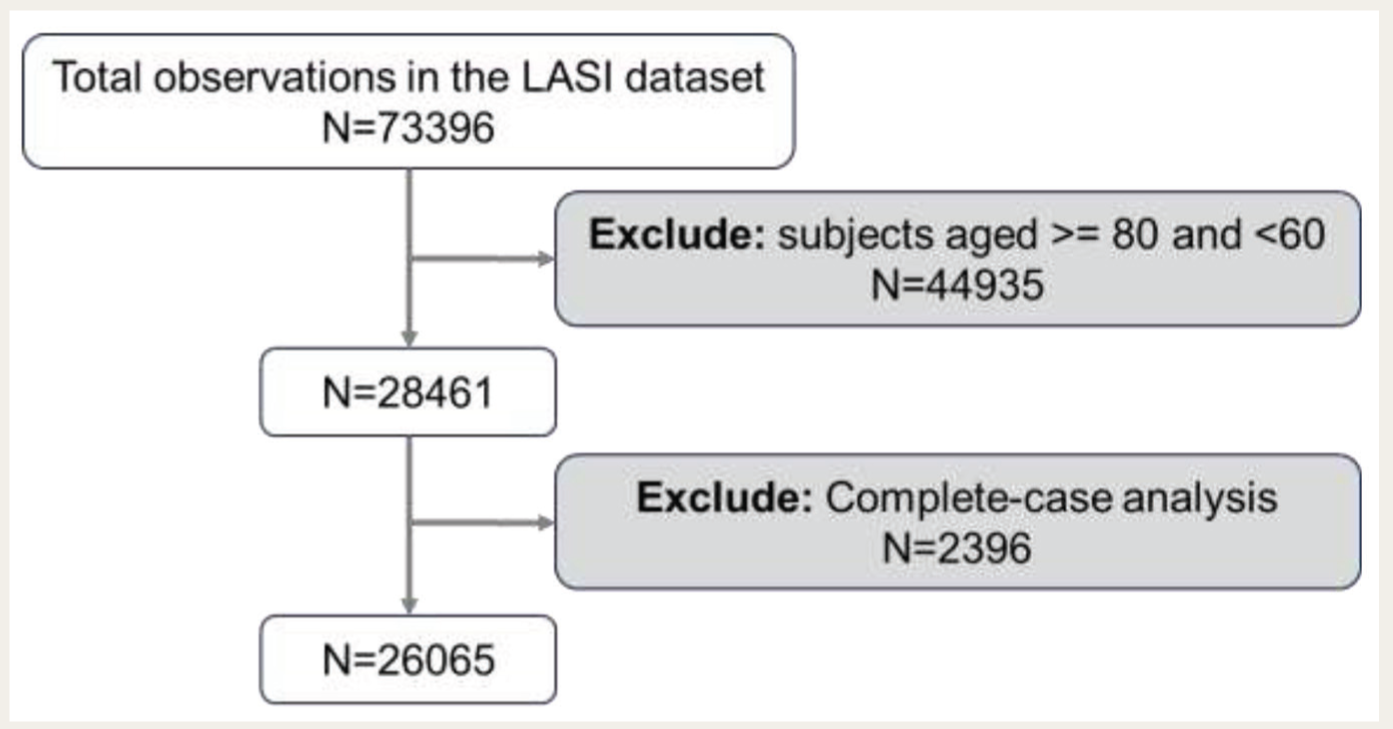
Figure 1 outlines the flowchart for the sample selection process in this study. The LASI dataset initially includes 73,396 observations. The study focused on individuals aged 60 years and above, which aligned with the definition of senior citizen given by the “Maintenance and Welfare of Parents and Senior Citizens Act, 2007.” 28 However, we excluded those aged 80 and above to ensure a more homogeneous sample, avoiding the distinct health challenges of the oldest-old population. We applied complete-case analysis to handle missing data, excluding any cases with missing values for relevant variables. 29 This resulted in a final sample size of 26,065 observations.
The Flowchart of Participant Selection for the Study.
Predictor and Outcome Variables
The outcome variable in this study is the participants’ depressive symptom status, classified as a binary variable with two groups: the “high depressive symptom” and “low/no depressive symptom” groups. The “high depressive symptom” group in this study refers specifically to participants who screened positive for depressive symptoms, and those who screened negative were categorized to the “low/ no depressive symptom” group. Depressive symptoms in the LASI were assessed using the Composite International Diagnostic Interview - Short Form (CIDI-SF).30,31 Developed by the World Health Organization, the CIDI is a structured interview used to assess the presence and severity of various mental health disorders, including depression, anxiety, and substance abuse, based on the criteria outlined in the Diagnostic and Statistical Manual of Mental Disorders (DSM). A shorter version, the Comprehensive International Diagnostic Interview-Short Form (CIDI-SF), exists, making it more suitable for large-scale studies. The CIDI-SF uses a two-step process to screen for depressive symptoms, and it is known to be a useful tool for identifying probable major depressive episodes.32,33 First, participants are asked, “During the last 12 months, was there ever a time when you felt sad, blue, or depressed for two weeks or more in a row?”. If the answer is “yes,” the participant is asked seven more questions about specific symptoms of depression—loss of interest, low energy, loss of appetite, trouble concentrating, feelings of worthlessness, thoughts of death, and trouble falling asleep. Based on these assessments, individuals were classified into “high depressive symptom” and “low/no depressive symptom” groups. A flowchart outlining the assessment process of depressive symptoms has been given in the supplementary file (see Figure S1). The predictors for classifying the level of depressive symptoms include physiological health (diagnosis of nine chronic conditions), psychological health (life satisfaction and cognitive ability), functional health (activity of daily living (ADL), instrumental ADL (IADL), and mobility difficulties), and socio-demographic factors (gender, monthly per-capita consumption expenditure, age groups, residence, religion, and caste/category). The supplementary file provides details of predictor variables included in the study (see Table S2).
Statistical Analysis
XGBoost is a highly regarded supervised machine learning technique known for its efficiency and scalability. 13 XGBoost implements the gradient boosting algorithm, where multiple decision tree-based models are generated sequentially. Each model in the sequence is built by evaluating the residuals of the previous model to minimize error. Essentially, XGBoost is a sequential ensemble learning algorithm that enhances predictive power by aggregating multiple weaker models. 34
In this study, we investigated the predictive validity of physiological, psychological, and functional health factors along with socio-demographic factors in identifying the elderly with high depression risk using the XGBoost algorithm. In our study, the dataset was split 80:20 for training and testing. To address the class imbalance in the training data, we employed resampling methods, including over-sampling and under-sampling. 35 In the over-sampling approach, observations from the smaller “high depressive symptom” group were duplicated to match the larger “low/no depressive symptom” group. Conversely, the under-sampling technique involved randomly reducing the “low/no depressive symptom” group to equal the size of the “high depressive symptom” group. The distribution of the “high depressive symptom” and “low/no depressive symptom” groups in the balanced and original samples is presented in the supplementary file (see Table S3). We built three XGBoost models using both the original and resampled training data: Model 1 used original data; Model 2 used over-sampled data; and Model 3 used under-sampled data to ensure that the machine learning model does not become biased toward the majority class (“low/no depressive symptom” group in this case). This allows the model to learn patterns from both classes more effectively. This results in improved classification performance, especially for the minority class. The testing set was utilized to measure the performance across all models. Additionally, we compared the performance metrics of the three models in the classification of participants into “high depressive symptom” and “low/no depressive symptom” groups among the elderly.
We conducted hyperparameter tuning on the training data, both original and resampled, to obtain the optimal set of parameters for the XGBoost models. 36 Within the training set, a 10-fold cross-validation procedure was used to fine-tune and optimize the algorithm. The details of the parameters tuned and the resultant optimal values are provided in the supplementary file (see Table S4). The classification of participants into “high depressive symptom” and “low/no depressive symptom” groups among the elderly was evaluated using confusion matrices, which are 2x2 tables summarizing model results. 37 These matrices include components such as “True Positives” (correctly identified as “high depressive symptom” group), “False Positives” (incorrectly identified as “high depressive symptom” group), “True Negatives” (correctly identified as “low/no depressive symptom”), and “False Negatives” (incorrectly identified as “low/no depressive symptom”). From there, we reported accuracy, no information rate (NIR), sensitivity, specificity, positive prediction value (PPV), negative prediction value (NPV), and balanced accuracy. 38 The detailed definition of these evaluation metrics is provided in the supplementary file (see Table S5). We also plotted the receiver operating characteristic (ROC) curve for each model to compare performance, showing the relationship between sensitivity and 1-specificity. 39 The curve closest to the top-left corner indicates the best balance between sensitivity and specificity. We also reported the values of the area under the ROC curve (AUC). The ROC curve with the highest AUC value indicates the model with the best overall performance in terms of distinguishing between the “high depressive symptom” and “low/no depressive symptom” classes. 40 To assess each predictor’s contribution to model accuracy, we calculated feature importance. 41 This metric indicates the degree to which a variable enhances accuracy, with higher scores given to features that improve classification accuracy or reduce error.
The R package “xgboost” (version 1.5.2.1) was used to develop and validate the XGBoost models. 13 The R-script for the statistical analysis is available on GitHub. 42 The data visualizations of the ROC curve and feature importance of different XGBoost models were done using Microsoft Excel 2019.
Result
Table 1 presents the socio-demographic, physiological, psychological, and functional health characteristics of the study participants across the depressive symptom status groups. The total sample size was 26065, with 6.5% (n = 1,684) of individuals identified with high levels of depressive symptoms. Among the participants, 66.1% (n = 17,241) resided in rural areas. The distribution across the Monthly Per-Capita Expenditure (MPCE) quintiles revealed that the highest proportion of participants, (20.7%; n = 5,408) was in the poorest quintile, while the lowest proportion, (18.7%; n = 4,875) was in the richest quintile. The majority of the participants (68.1%; n = 17,759) were in the 60–69 years age group. Additionally, 74.5% (n = 19,429) of the participants were Hindu, and the remaining 25.5% (n = 6,636) categorized to other religions. In terms of caste, the majority of participants (39.5%; n = 10,293) were from the OBC category, while the lowest proportion (16.9%; n = 4,411) was from the ST category. The gender distribution showed that a majority of the participants were female, accounting for 51.3% (n = 13,361).
Characteristics of the Study Participants (
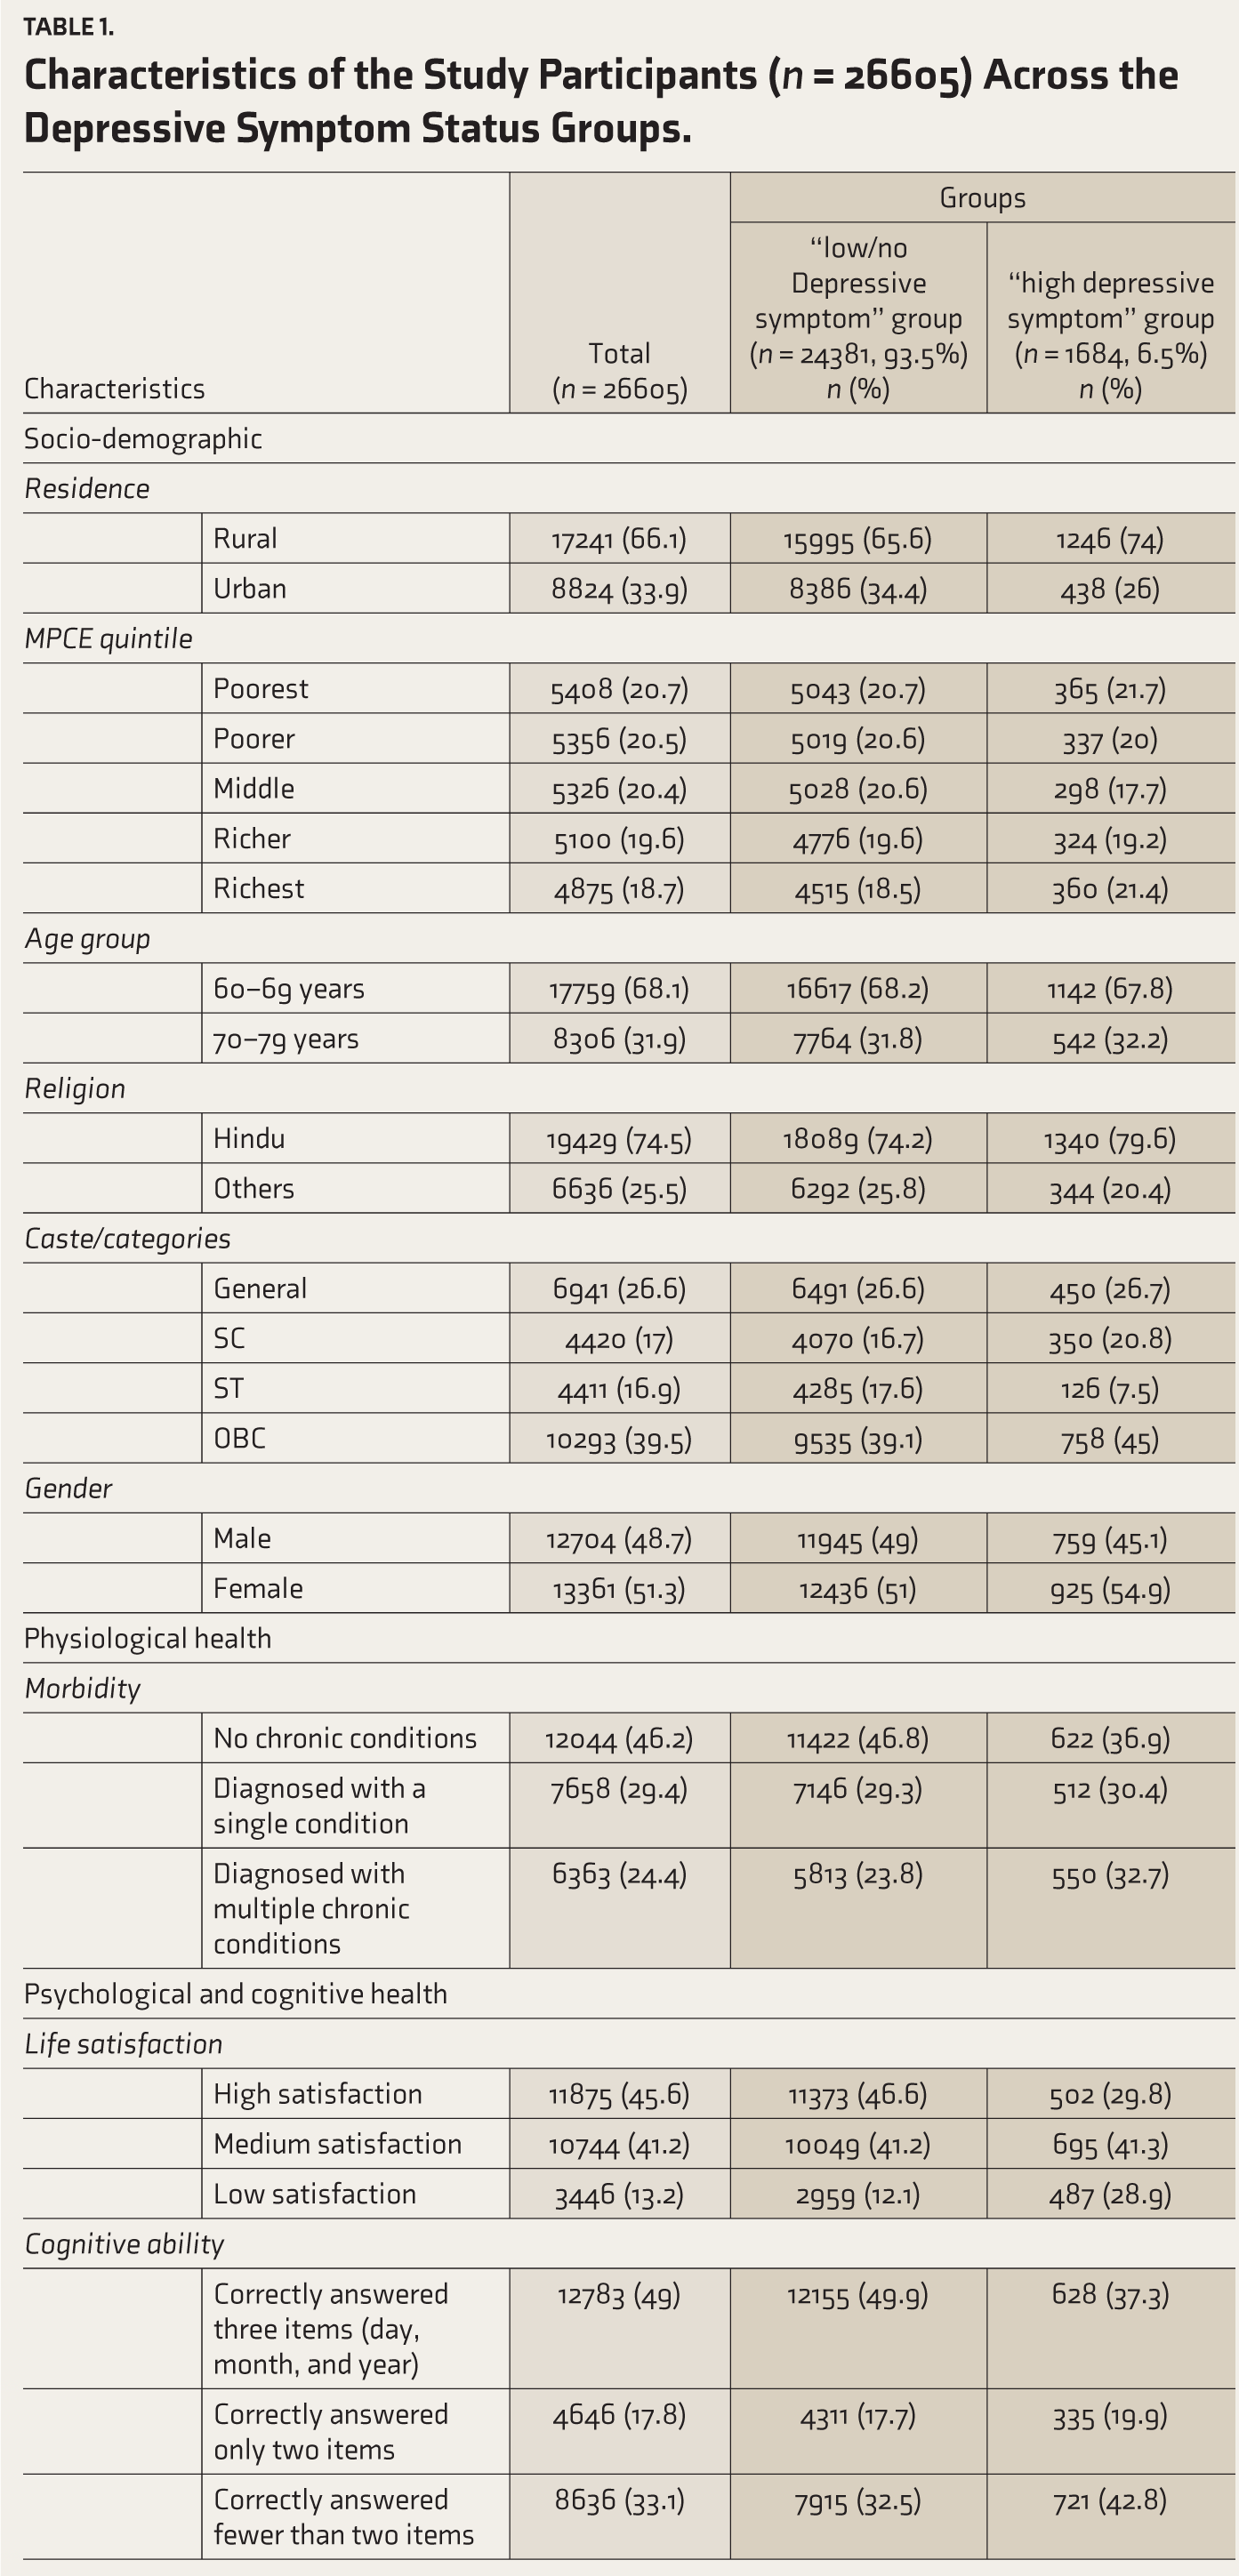
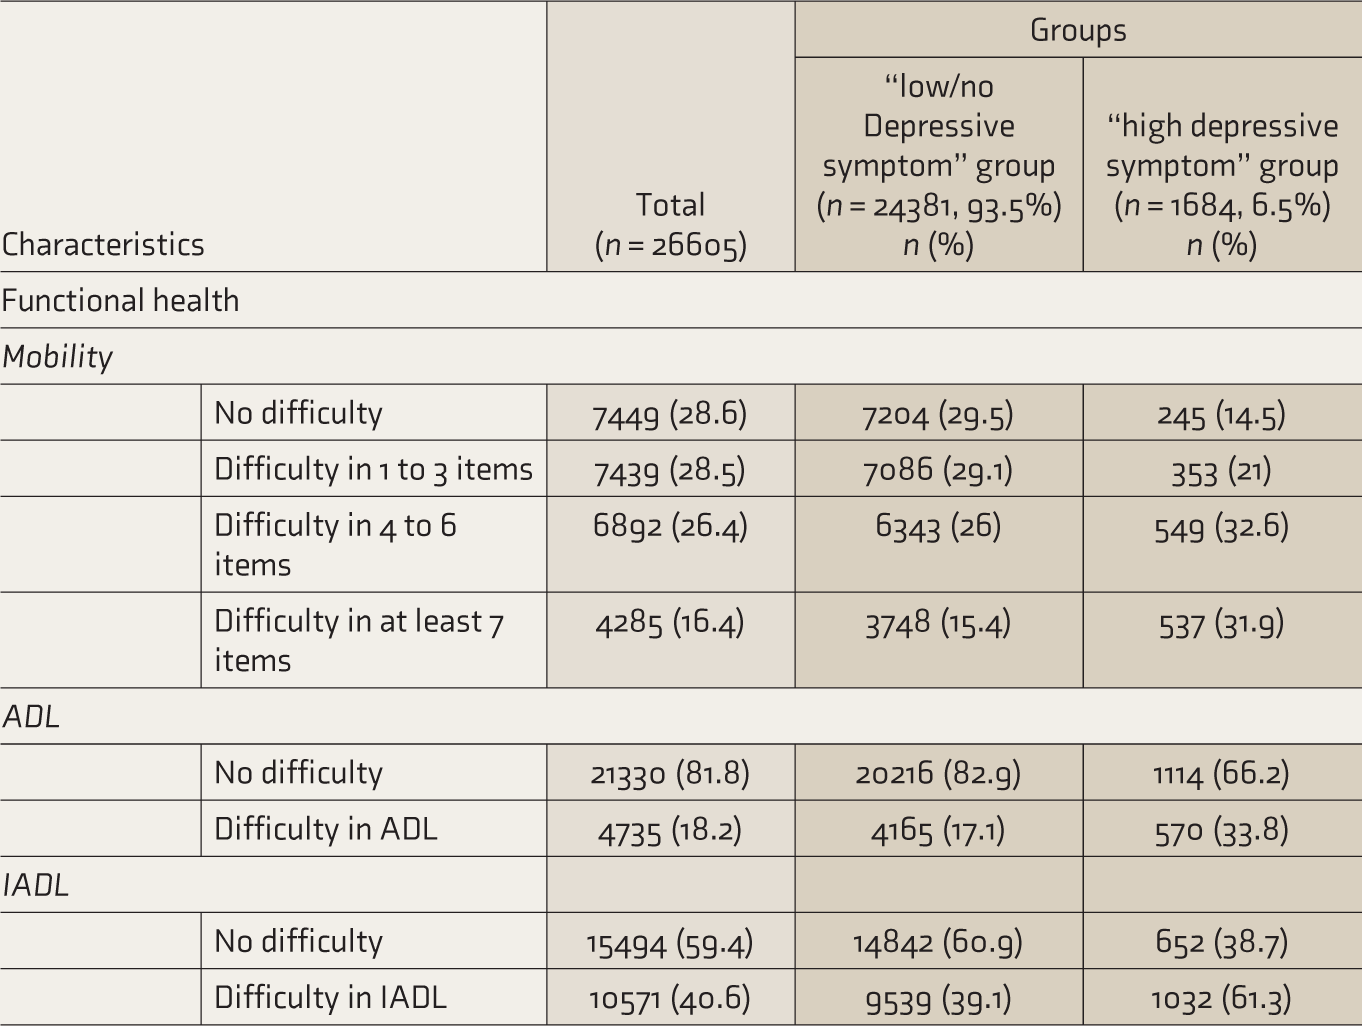
Of the participants assessed for physiological health status, 46.2% (n = 12,044) reported having no chronic conditions, while 24.4% (n = 6,363) had multiple chronic conditions. In terms of psychological health, 45.6% (n = 10,744) of the participants reported a high level of life satisfaction, while 13.2% (n = 3,446) reported a low level of life satisfaction. A majority of the participants (49%; n = 12,783) demonstrated adequate cognitive function by correctly answering all assessment items of cognitive ability. However, 33.1% (n = 8636) of the participants answered at least two items incorrectly. In terms of functional health, mobility issues were reported by a significant number of participants, with 71.4% (n = 18616) reporting some difficulty in mobility. Furthermore, 18.2% (n = 4,285) of the participants reported difficulty in ADL, and 40.6% (n = 10,571) reported difficulty in IADL.
Within the “high depressive symptom” group (n = 1,684), 74% (n = 1,246) resided in rural areas. The highest proportion (21.7%; n = 365), belonged to the poorest quintile; 67.8% (n = 1,142) of the participants were in the 60–69 age group. Individuals who belonged to the OBC category made up 45% (n = 758), while the ST category was the smallest at 7.5% (n = 126). The gender distribution was balanced, with 54.9% (n = 925) females and 45.1% (n = 759) males. The physiological health status indicated that 36.9% (n = 622) of the “high depressive symptom” group had no chronic conditions, and 32.7% (n = 550) were diagnosed with multiple chronic conditions. Regarding life satisfaction, 41.3% (n = 695) of the participants in the “high depressive symptom” group reported a medium level of life satisfaction. The majority (42.8%; n = 721) of the participants in the “high depressive symptom” group answered fewer than two items in the assessment of cognitive ability. Mobility issues were significant, with 64.5% (n = 1,086) reporting difficulty in at least 4 out of 9 mobility items. For ADL, 33.8% (n = 570) of the participants reported having difficulty. Additionally, in the “high depressive symptom” group, approximately 61.3% (n = 1,032) of the participants reported difficulties with IADLs.
Table 2 summarizes the confusion matrices of three classification models (Model 1, Model 2, and Model 3), and evaluation metrics were estimated from the components of the confusion matrix for each model.
Confusion Matrices of the Models (Models 1, 2 and 3).
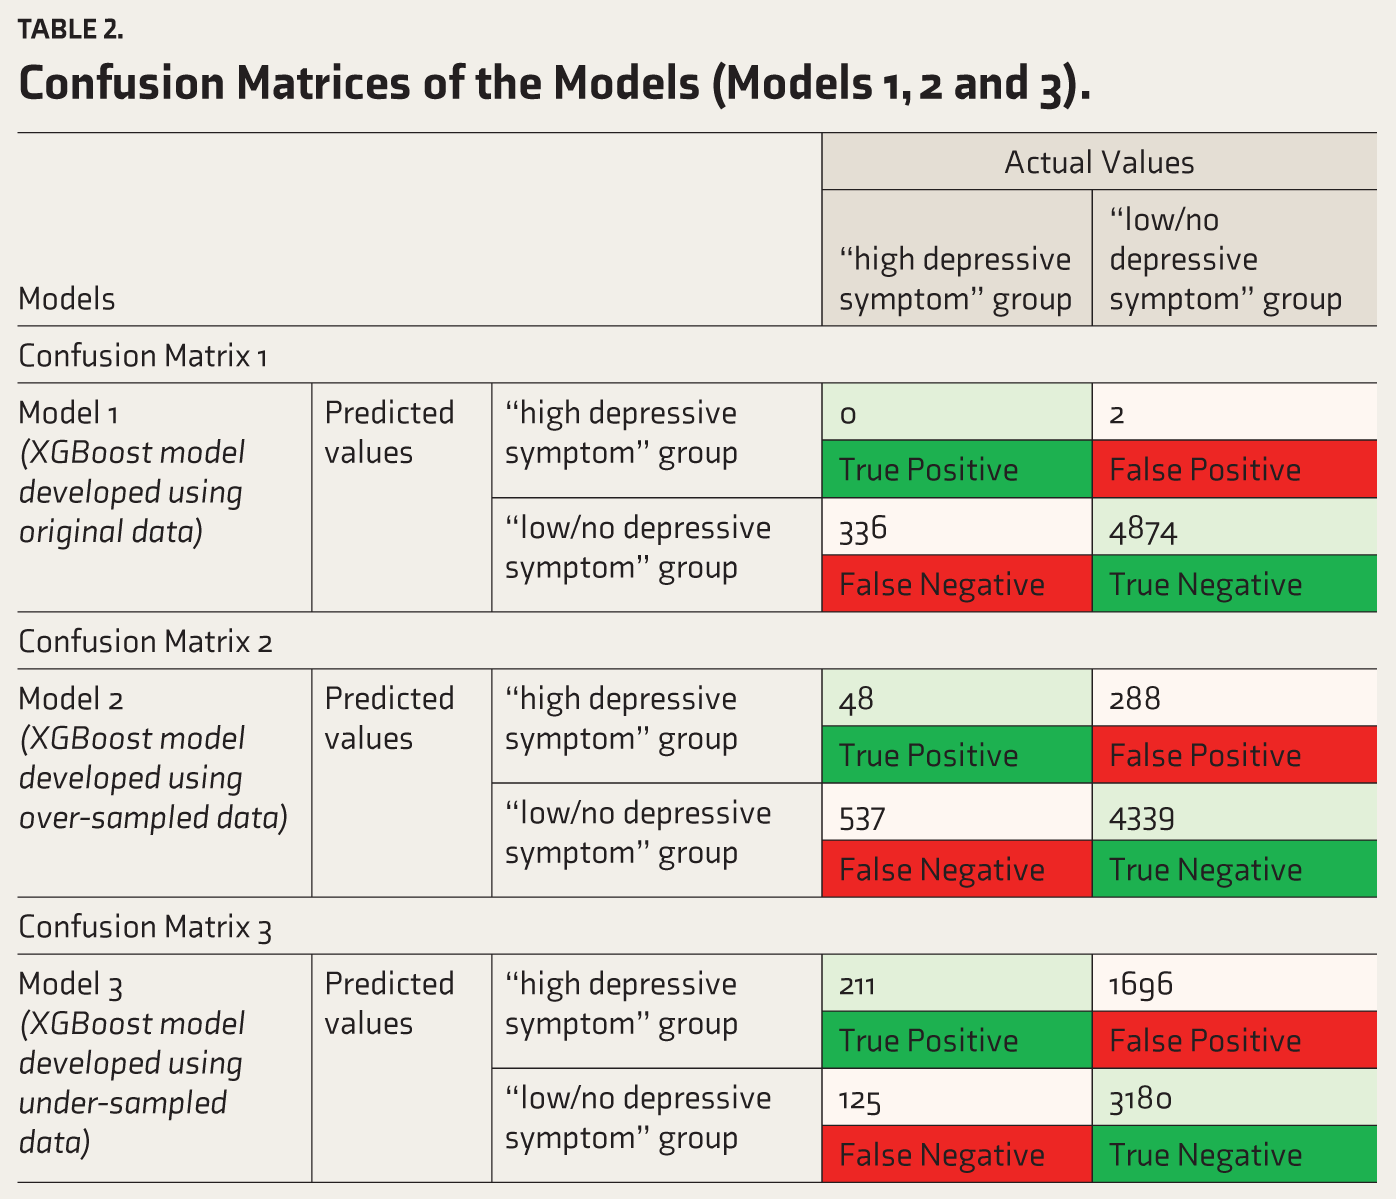
Table 3 outlines the predictive performance metrics, including accuracy, NIR, sensitivity, specificity, PPV, NPV, and balanced accuracy for these three models. The Model 1 with the original dataset registered high accuracy (93.5%, 95% confidence interval (CI): [92.8%–94.2%]) and specificity (99.96%). However, the model’s sensitivity was estimated to be zero percent, failing to detect any true cases in the “high depressive symptom” group. This imbalance in the model’s performance is further highlighted by the balanced accuracy of 50%, indicating that the model’s overall ability to differentiate between individuals having high and low/no depressive symptoms is equivalent to random guessing. The ROC curve for Model 1 shows an AUC value of 0.69 (see Figure 2).
Predictive Performance Metrics of the XGBoost Models.
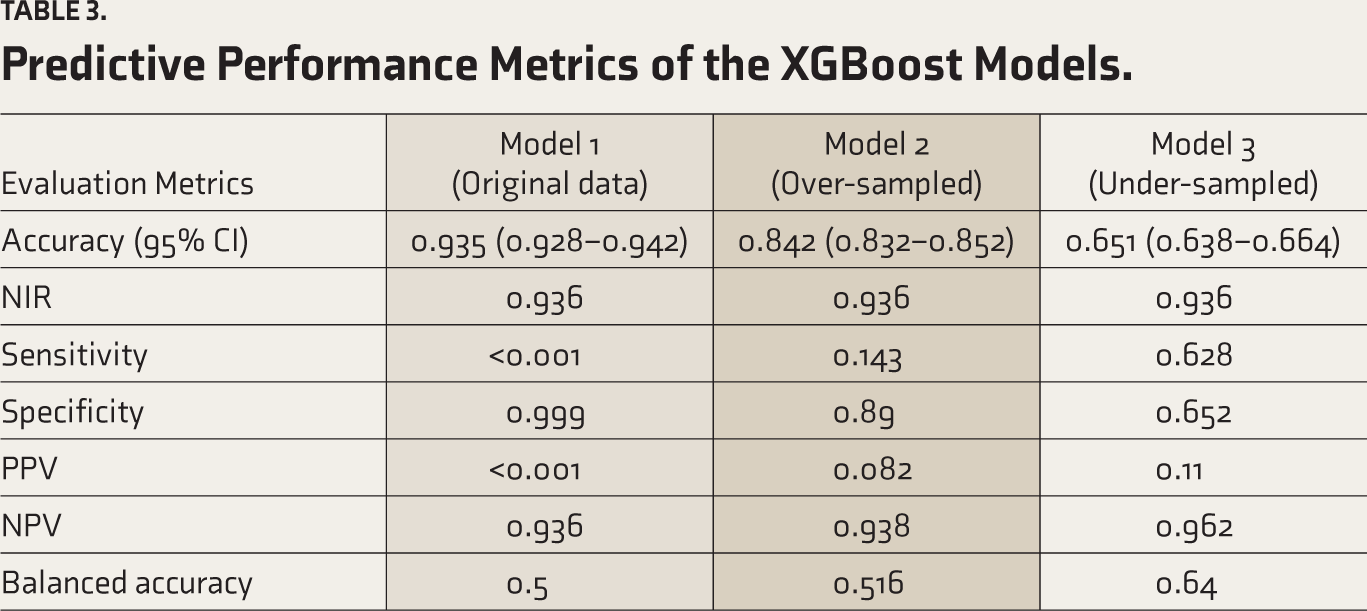
The XGBoost model trained on the over-sampled data shows some improvement in sensitivity (14.3%) and balanced accuracy (51.6%) compared to Model 1. However, the model’s accuracy (84.2%, 95% CI: [83.2%–85.2%]) is lower than the NIR (93.6%). While the model has high specificity (89%) and NPV (93.8%), the low sensitivity (14.3%) and PPV (8.2%) indicate that Model 2 struggles to correctly identify and predict participants in the “high depressive symptom” group. Overall, the over-sampling approach improved the model’s ability to detect true positive cases. The ROC curve for Model 2 shows an AUC value of 0.583, lower than that of Model 1 (see Figure 2).
The XGBoost model trained on the under-sampled data shows a significant improvement in sensitivity (62.8%) and balanced accuracy (64%) compared to Models 1 and 2. However, the overall accuracy (65.1%, 95% CI: [65.1%–66.4%]) is lower than the NIR (93.6%). While the model has improved sensitivity and NPV (96.2%), the model is estimated to have a relatively low specificity (65.2%) and PPV (11.1%). Overall, the under-sampling approach enhanced the model’s sensitivity and balanced accuracy, making it more effective at detecting true positive cases. The ROC curve for Model 3 shows an AUC value of 0.692, which is higher than that of both Models 1 and 2. Overall, Model 3 offers a better classification based on the AUC value and balanced accuracy, giving optimum sensitivity and specificity values compared to Models 1 and 2 (see Figure 2).
Comparison of ROC Curves of the XGBoost Models.

Factors are plotted based on their feature importance score in different XGBoost models in Figure 3. The variables, namely life satisfaction (16.4%), IADL (14.9%), mobility (13.9%), caste (11.6%), and the MPCE quintile (10.1%), were observed to contribute significantly to the predictive power of Model 1, indicating that they are significant in identifying participants with “high depressive symptom” group. Conversely, the bottom features, which have the lowest importance scores, include age (3.1%), place of residence (3.5%), religion (3.8%), gender (4.3%), and ADL (5%). These features play a relatively minor role in Model 1 in identifying participants in the “high depressive symptom” group. The socio-demographic factors (combination of age groups, residence, MPCE quintile, religion, caste, and gender) recorded the highest feature importance of 36.4% in Model 1, followed by the functional factors (combination of mobility, ADL, and IADL) with a feature importance of 33.8%. Physiological factors recorded the lowest feature importance, 6.7%, in Model 1.
Feature Importance Scores of Predictors in Different XGBoost Models of the Study.
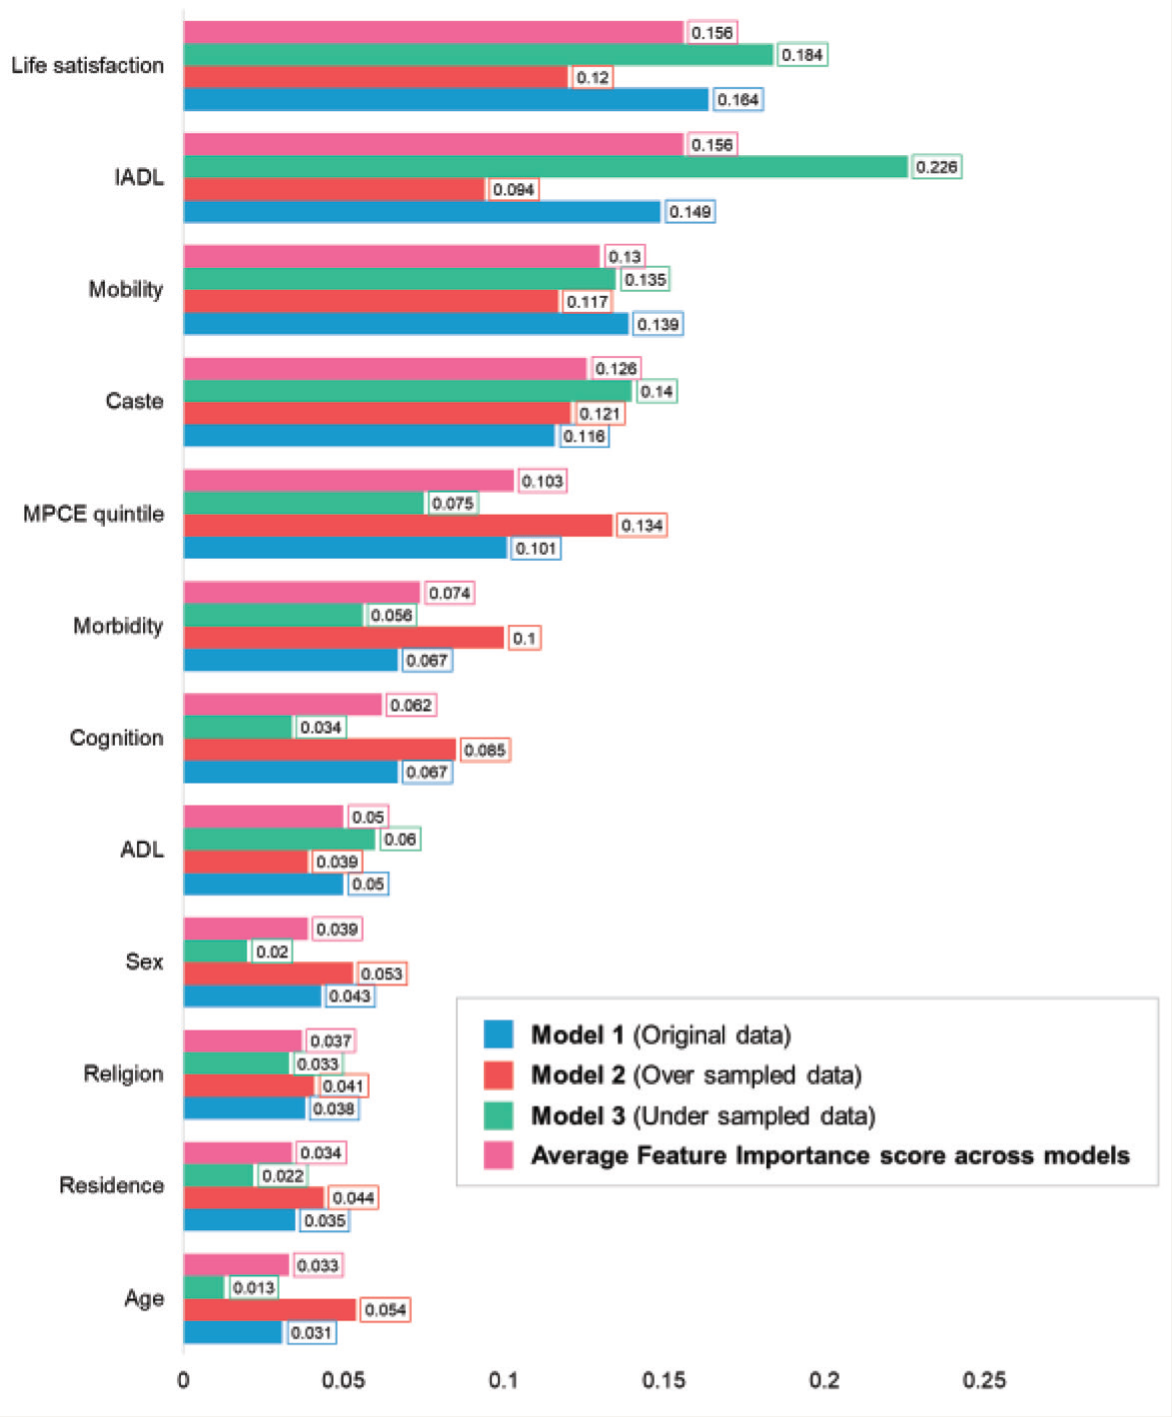
The top features in Model 2 are the MPCE quintile (13.4%), caste (12.1%), life satisfaction (12.0%), mobility (11.7%), and morbidity (10.0%). In contrast, the bottom features, with lower importance scores, include ADL (3.9%), religion (4.1%), residence (4.4%), sex (5.3%), and age (5.4%). The socio-demographic factors recorded the highest feature importance of 44.7% in Model 2, followed by the functional factors with a feature importance of 24.9%. Physiological factors recorded the lowest feature importance of 9.97% in Model 2. The most significant features in Model 3 are IADL (22.6%), life satisfaction (18.4%), caste (14.0%), and mobility (13.5%). On the other hand, the least important features include age (1.3%), sex (2.0%), residence (2.2%), and religion (3.3%). The functional factors recorded the highest feature importance of 42.2% in Model 3, followed by the socio-demographic factors with a feature importance of 30.4%. Physiological factors recorded the lowest feature importance, 5.6%, in Model 3.
Overall, the variables such as life satisfaction, IADL, mobility, caste, and MPCE quintiles were consistently ranked among the top features across all three models, with an average feature importance of 15.6%, 15.6%, 13%, 12.6%, and 10.3%, respectively. In contrast, the average feature importance across the models for features including age (3.3%), residence (3.3%), religion (3.7%), and sex (3.9%) was less than 5%. The socio-demographic factors registered the highest average feature importance score of 37.2%, followed by functional and psychological factors with feature importance of 33.6% and 21.8%, respectively.
Physiological features have the lowest average importance score of 7.4%, indicating they contribute the least to the predictive accuracy across the models.
Discussion
Our study investigated the physiological, psychological, and functional health determinants of depressive symptoms among the elderly (60–79 years age group) in India, using XGBoost for classification. Out of the three models we built, Model 3 (based on the under-sampled data) offered better classification based on AUC and balanced accuracy. The top predictors, accounting for over 67% of feature importance, were life satisfaction, IADL, mobility, caste, and MPCE quintiles. Age group, residence, religion, and sex collectively contributed 14.3% to feature importance across the models.
From the psychological factors, “life satisfaction,” with a feature importance of 15.6%, emerged as a key predictor of depressive symptoms. This amplifies prior work highlighting life satisfaction’s role in predicting depression among the adult population. 43 The study aligns with findings that lower life satisfaction correlates with a higher risk of depression.44,45 Given the pivotal role of life satisfaction in subjective well-being and quality of life, the study suggests that improving life satisfaction could serve as a preventive measure for depressive episodes. 46 Additionally, existing research has identified the mediating and moderating effects of “social participation” in the relationship between life satisfaction and depression. 47 Based on these findings and the results of this study, it is essential to focus on improving subjective well-being and quality of life by promoting and enhancing social connectedness among the elderly and preventing depression.
Among the functional health factors, IADL and mobility were significant predictors of depressive symptoms, with feature importances of 15.6 and 13, respectively. The study found that 61.3% of participants having “high depressive symptoms” reported difficulty with IADL, aligning with past research linking impaired IADL to depressive symptoms.48,49 Elderly adults with mobility limitations have an unfavorable trajectory in terms of depressive symptoms compared to those without mobility limitations. 50 In this study, we observed that 85.3% of the participants in the “high depressive symptoms” group were having some trouble with mobility. The stress process theory suggests that such dysfunction may impede the fulfillment of social roles, possibly leading to depression. 51 Additionally, memory, perceived stress, purpose in life, and resilience mediate the relationship between depression and independence in the IADL.49,52 Enhancing psychological support to improve perceived stress may help prevent functional decline and thereby reduce the incidence of depression among the elderly.
In socio-demographic factors, caste and MPCE quintiles had significant feature importances of 12.6% and 10.3%, respectively. The caste system is a social stratification based on hereditary social roles and occupations. Historically, it has restricted access to resources and opportunities for lower castes in India. 53 There is a paucity of literature on the relationship between caste and mental health. We observed a higher prevalence of depressive symptoms among participants belonging to scheduled castes and other backward classes compared to the general and scheduled tribe categories. Previous research conducted in India and Nepal, both following caste systems, observed similar findings of a higher prevalence of mental health disorders among individuals from lower castes than the general category.54,55 Notably, we observed comparatively lower depressive symptom prevalence among the tribal population. This aligns with the previous literature on the elderly of the Chakhesang tribe from Nagaland, India, which reported a depression prevalence of 0.2% and 2.1% among male and female participants. 56 We can attribute this trend to higher physical activity, a healthy diet lifestyle, and engagement in the spiritual and cultural activities of the tribal population.57,58 Factors such as poverty, lack of social support, substance use, and stress mediate the relationship between caste and depression. 59 Another major socio-demographic factor associated with depressive symptoms is the MPCE quintile. Previous studies have linked higher income levels to improved depressive symptoms.60,61 However, our study found that depressive symptoms were highly prevalent among both the poorest (21.7%) and richest (21.4%) quintiles. The mental health burden among the poorest quintile can be explained by the mechanisms of the “social causation pathway” 62 Stressful or unfavorable financial circumstances can contribute to poor living conditions, malnutrition, unhealthy lifestyles, and reduced social capital, all of which are potential risk factors for depression. 63 This study observed that depression is not exclusive to the affluent. Increased awareness about mental health issues and access to mental health services are potentially the reasons behind the increased prevalence of depression among the richest quintile. Furthermore, the association between depression and the “Diseases of affluence” such as obesity, overweight, and reduced physical activity have a significant impact on depression. 64 Additionally, a competitive social environment and social isolation may contribute to an increased prevalence of depression among the elderly population in the richest quintile.
We performed the XGBoost models by utilizing original and resampled data. Model 3 used the under-sampled data shown to be the best model by considering the importance of identifying the “high depressive symptoms” group against the “low/no depressive symptoms” group. However, the overall accuracy of this model could be higher compared to the model performance in the previous literature. Sharma and Verbeke (2020) predicted depression among the general population using biomarkers by employing XGBoost analysis, achieving an accuracy of 97.3% accuracy with their best model. 19 Handing et al. (2022) used a random forest machine learning technique to predict depression among middle-aged and older adults in Europe, yielding an accuracy range between 76 and 82.4%. 65 The limited number of predictors in this study may have contributed to the model’s lower accuracy.
This study has several strengths. The XGBoost analysis is a widely used machine learning technique that has a proven record in past literature.13–16,18,20,65 To the best of the author’s knowledge, limited research has explored the application of XGBoost analysis in predicting depressive symptoms among the elderly population. Furthermore, the study employed an XGBoost model to analyze three different datasets: original, sampled, and under-sampled data; this approach, along with the use of a large dataset, allowed for a robust analysis of depression. We addressed depressive symptoms from both objective and subjective perspectives by incorporating a range of social, physical, psychological, and functional variables. Both of these objective and subjective measures are top predictors for depressive symptoms in this study.
Despite these strengths, our study has some limitations. Since the assessment used in the study is based on symptom screening, which may not equate to a clinical diagnosis of depressive disorder. Therefore, readers should exercise caution when interpreting and generalizing the conclusions. Since the model showed moderate accuracy, sensitivity, and specificity in identifying participants with depressive symptoms, caution should be exercised when applying it in practical mental health screening settings. Moreover, to have a comprehensive predictive validity of the physiological, psychological, functional, and socio-demographic factors in classifying the level of depressive symptoms, multiple machine learning methods such as random forest, support vector machine classification, and other similar methods need to be employed. While the XGBoost model performed well, it is essential to validate its applicability across different populations and settings. Future research should also explore the integration of other machine learning models and hybrid approaches to enhance classification performance. The number of variables in this study across the different domains is 12, and more is needed to give a robust prediction. We did not follow the selection procedure to recruit variables in the XGBoost models. While the use of a large, nationally representative dataset supports the generalizability of our results within India, the findings may not be directly applicable to other countries or cultural contexts due to variations in demographic, socio-economic, and health characteristics.
Additionally, since we used complete-case analysis, the exclusion of participants with missing data may limit generalizability to populations with similar missing data patterns. The cross-sectional nature of the data limits causal inferences between the identified determinants and depressive symptoms.
Our study’s findings have important implications for public health policy and interventions. To prevent depression among the elderly, it is crucial to enhance subjective well-being and quality of life by fostering social connectedness. Addressing broader issues like poverty, lack of social support, and stressful life events through a coordinated, multisectoral approach is essential. Policymakers should focus on reducing income inequality via progressive taxation and universal basic income. The identification of key determinants of depressive symptoms among the elderly can inform the development of targeted prevention and treatment programs. For instance, addressing chronic health conditions through integrated care models that combine physical and mental health services can potentially reduce depression rates. Additionally, enhancing life satisfaction and cognitive health through social support and cognitive training programs could mitigate the risk of depression.
Conclusion
This study points to life satisfaction, functional health, and social factors as key determinants of depressive symptoms among the elderly in India. Furthermore, the XGBoost model proved to be a valuable tool in classifying the level of depressive symptoms, offering the potential for its application in mental health screening programs among the elderly. Continued research and policy efforts are essential to tackle the growing challenge of depression in this demographic.
Supplemental Material
Supplemental material for this article available online.
Footnotes
Data Availability
The study used data from LASI Wave 1, which is freely available in the public domain and accessible upon request. 26
Declaration of Conflicting Interests
The authors declared no potential conflicts of interest with respect to the research, authorship, and/or publication of this article.
Declaration Regarding the Use of Generative AI
None used.
Declarations of Statements
The manuscript being submitted has not been published, simultaneously submitted, or already accepted for publication elsewhere. The manuscript has been read and approved by all the authors, that the requirements for authorship as stated earlier in this document have been met, and that each author believes that the manuscript represents honest work. The manuscript, to the best of the author’s knowledge, does not infringe upon any copyright or property right of any third party.
Ethics Approval
This study is based on secondary data derived from LASI Wave 1 (2017–2018), which received ethical approval from the Indian Council of Medical Research, Ethics Committee. As the data are publicly available and do not involve direct interaction with participants or human subjects, no additional ethics approval was required.
Funding
The authors received no financial support for the research, authorship, and/or publication of this article.
Informed Consent
The LASI-wave I data is freely available in the public domain, and the agencies responsible for conducting the field survey ensured that respondents provided informed consent prior to participation. Additionally, the privacy of participants was safeguarded throughout the data collection process. 26
Statement on Prior Presentations
This study has not been presented at any conferences or meetings.
References
Supplementary Material
Please find the following supplemental material available below.
For Open Access articles published under a Creative Commons License, all supplemental material carries the same license as the article it is associated with.
For non-Open Access articles published, all supplemental material carries a non-exclusive license, and permission requests for re-use of supplemental material or any part of supplemental material shall be sent directly to the copyright owner as specified in the copyright notice associated with the article.