
Abstract
Background:
Rosenberg’s Self-esteem Scale (RSES) has been widely used without proper translation, cultural adaptation, and testing psychometric properties in Indian studies. The study aimed to translate and culturally adapt the 10-item Rosenberg Self-esteem Scale into Hindi and find psychometric properties.
Material and Methods:
We have translated the scale using World Health Organization (WHO) guidelines. Using a cross-sectional design, the translated scale was administered to 143 undergraduate nursing students randomly selected. Content validity index (CVI) was used to assess content validity. Exploratory factor analysis (EFA) with principal axis factoring was used to estimate the construct validity. Cronbach’s alpha (α) and intraclass correlation coefficient (ICC) were used to check internal consistency and test re-test reliability.
Results:
The S-CVI for the Hindi RSES was 0.98. Kaiser-Meyer-Olkin (KMO) (=0.79), and Bartlette’s test for sphericity was significant (χ2 = 425.06, df = 45, P < .001). EFA extracted three common factors, explaining 62.62% of the total variance. The factor loading of all items suggests a good representation of their underlying construct; all items >0.47, except item 1 (= –0.373). The test re-test, an ICC was r = 0.76 (P < .001), and Cronbach’s alpha (α) after deletion of item 1 was 0.81, suggesting excellent reliability.
Conclusion:
The Hindi Rosenberg self-esteem scale is a psychometrically tested scale to assess self-esteem in the Hindi-speaking adult population. These findings provide empirical judgment for using the translated Hindi RSES to measure self-esteem among the adult population. The authors recommend verifying the psychometric properties in a more extensive and varied population.
The Rosenberg Self-esteem Scale is a globally used measure to assess self-esteem among adults. The scale has been translated into different languages for its wide use in different countries globally. In the current technology era, self-esteem has become a common topic of discussion and measurement. India is a diverse country with a rich culture and traditional values. In India, researchers use the Rosenberg Self-esteem Scale without proper translation and psychometric properties. The study is a modest attempt to translate the scale into Hindi and measure the psychometric properties. The translated scale reported excellent psychometric properties for adults in the Indian setting.Key Message:
Self-esteem is the emotional reaction to the variations between the ideal and actual selves. 1 The concept of self-esteem is diverse and has different meanings across cultures. Self-worth, self-regard, self-respect, and self-integrity are the commonly used synonyms for self-esteem. 2 Self-esteem is typically defined as one’s overall sense of worthiness, which can be positive or negative. 3 It has been proved in multiple studies that positive self-esteem plays a significant role in one’s own personal and professional development. 1 In the current era, self-esteem has become a common topic of discussion, thought about, and acting upon social relations and ourselves. 4
Self-esteem is a vital component of psychological health. It is associated with many psychological attributes, such as psychological well-being, 5 body image appreciation, 6 locus of control, 7 learning strategies, 8 and academic performance. 9 Indeed, promising self-esteem enables an individual to fulfill the different demands during training, facilitate healthy social and professional relationships, 10 and enable them to fight different physical (i.e., stroke, cancer)11,12 and mental disorders (i.e., anxiety, depression, and attention problems). 13
Furthermore, Rosenberg’s Self-esteem Scale (RSES) has been translated and adapted to different other languages, such as French, 14 Nepali, 15 Chinese, 16 Italian, 17 Persian, 18 and Portuguese. 19 In addition, the fewer items, free-to-use, easy availability, and good psychometric properties facilitate more expansive use of RSES across all cultures. 20 A comprehensive literature search revealed that RSES has been used without proper translation by language experts to establish psychometric properties. Furthermore, India has diverse cultures and backgrounds that need studies on the conceptualization of self-esteem.
Nursing students come from diverse backgrounds and undergo training at institutes that follow varied norms and cultures. They represent a significant proportion of the country, considering the job profile and working opportunities across different healthcare sectors. Furthermore, nursing students are frequently involved in small and more significant research projects during the courses and are ideal candidates to conceptualize the concept of self-esteem. Additionally, self-esteem is one of the most frequently explored topics in research among nursing students.21–23 Translation and adaptation of the RSES into the Hindi language will further encourage more expansive scale use among the Hindi-speaking population.
In this sense, it is crucial to have an adapted instrument with adequate psychometric properties to measure self-esteem in our environment. Therefore, we planned to translate and culturally adapt the RSES into Hindi. In addition, we planned to do factor analysis to test the revised version’s psychometric properties and facilitate its use among other native-speaking populations in India.
Methodology
Design, Population, and Sampling
This cross-sectional survey was conducted on 143 randomly selected undergraduate nursing students at a tertiary care teaching hospital in Uttarakhand, Northern Himalaya. We have used a table of random numbers to select the desired sample from the population. Based on the number of items in this research questionnaire, a sample size of 143, with a minimum of 10 participants per item, was required to detect at least 95% of the test efficacy.24–26 Therefore, 143 students studying in classes 2, 3, and 4 years who were willing to participate were included in the study. Researchers use General Health Questionaire-12 (GHQ-12) 27 to screen out the general well-being of nursing students. The main reason for this is to avoid the influence of poor well-being on the psychometric properties of the Hindi-translated questionnaire. The students who scored ≥ 12 on GHQ-12 were included in the study, and those who were unwilling and on leave during data collection were excluded. The data of all participants was used in reliability analysis, construct validity, and internal consistency analysis. A second assessment was conducted 1 week after the primary assessment to check test re-test reliability.
Instruments
The RSES consists of 10 items (five positive and five negative statements) on a four-point Likert scale: 1 = strongly disagree, 2 = disagree, 3 = agree, 4 = strongly agree. 28 The scale has total score ranges from 10 to 40, where higher scores indicate higher self-esteem and vice-versa. For positive items (1, 3, 4, 7, and 10), the responses need to be rated as follows: strongly disagree, 1; disagree, 2; agree, 3; and strongly agree, 4. The response for the negative items (2, 5, 6, 8, and 9) needs to be reverse coded. The scale was initially developed in English and is available in the public domain for free use with excellent reliability indexes. 29
Ethical Consideration
The study was approved by the Institutional Ethics Committee (IEC) of the Institute (XXXX/IEC/23/382). All participants were asked to provide written informed consent before participating in the research. Participants were assured of privacy and confidentiality at each phase of the research.
Procedure
The study was completed in the following three phases:
Translation and Cultural Adaptation
We used World Health Organization (WHO) guidelines for cross-cultural adaptation to translate the RSES.15,30 These guidelines provide a series of actions, including forward translation, backward translation, expert panel discussion, and questionnaire testing.
Phase 1: Forward Translation
In this first phase, two independent bilingual experts translate the original instrument from the standard original language to the target Hindi language. It was ensured that experts from the mother tongue, Hindi, would be chosen to detect errors, local slang, and other interpretations while translating from original English to Hindi.
Phase 2: Synthesis of the Translations
The researcher added a third unbiased translator whose mother tongue was Hindi to compare the two translations and find discrepancies between the first translator (T1) and the second translator (T2) in the translated versions. With the opinions of the third translator (T-12), a consensus was generated for the translated Hindi version. This translated (T-12) version is used in the next phase of back translation.
Stage 3: Back Translation
Researchers used a translated version (T-12) to back translate the original English language. Two independent and blind experts (BT1 & BT2) helped in the translation process to translate the questionnaire back into the original language. Researchers ensured that the translators, who were non-medical experts, should remain blind and not be informed on any concepts of the questionnaire. This process ensured the avoidance of information bias and eliciting unexpected meanings of the items in the translated questionnaire into the original language.
Stage 4: Cultural Adaptation
The translated Hindi version of the questionnaire was used for cultural adaptation. We planned a focus group discussion (FGD) with 4th year undergraduate nursing students. Twenty-six students were divided into three focus groups (Groups A, B, and C) and a scale to indicate equivalence for each item between the original English version. They translated the Hindi version to develop a prefinal of the questionnaire for field testing. Groups A and B have 9, and Group C has eight participants. FGD using cognitive interviewing with a verbal probing approach was conducted. 31 Each student in the group was asked to read the questionnaire loud enough and respond to the new questionnaire, followed by a series of questions. The questions in FGD were: “Can you repeat the question in your language?” “Do you think any modifications/alternative words are best suitable for this specific item?” and “Are there any words found difficult for you to understand?” Students were asked to suggest an alternative word for a tricky word, paraphrase, and address other comprehension or language issues with each item. Each focus group continues for 15–20 minutes to discuss each item of the translated Hindi questionnaire for its relevancy, use, and feasibility for nursing students in the Indian setting. A follow-up discussion was carried out with translators, and opinions sought to resolve the discrepancies before developing a prefinal version of the translated scale. Substantial modifications were made after focused group discussion before proceeding to validity and reliability testing of the translated RSES (Table 1).
Original RSES, Forward Translation, and Focused Group Discussion and Experts’ Recommendations.
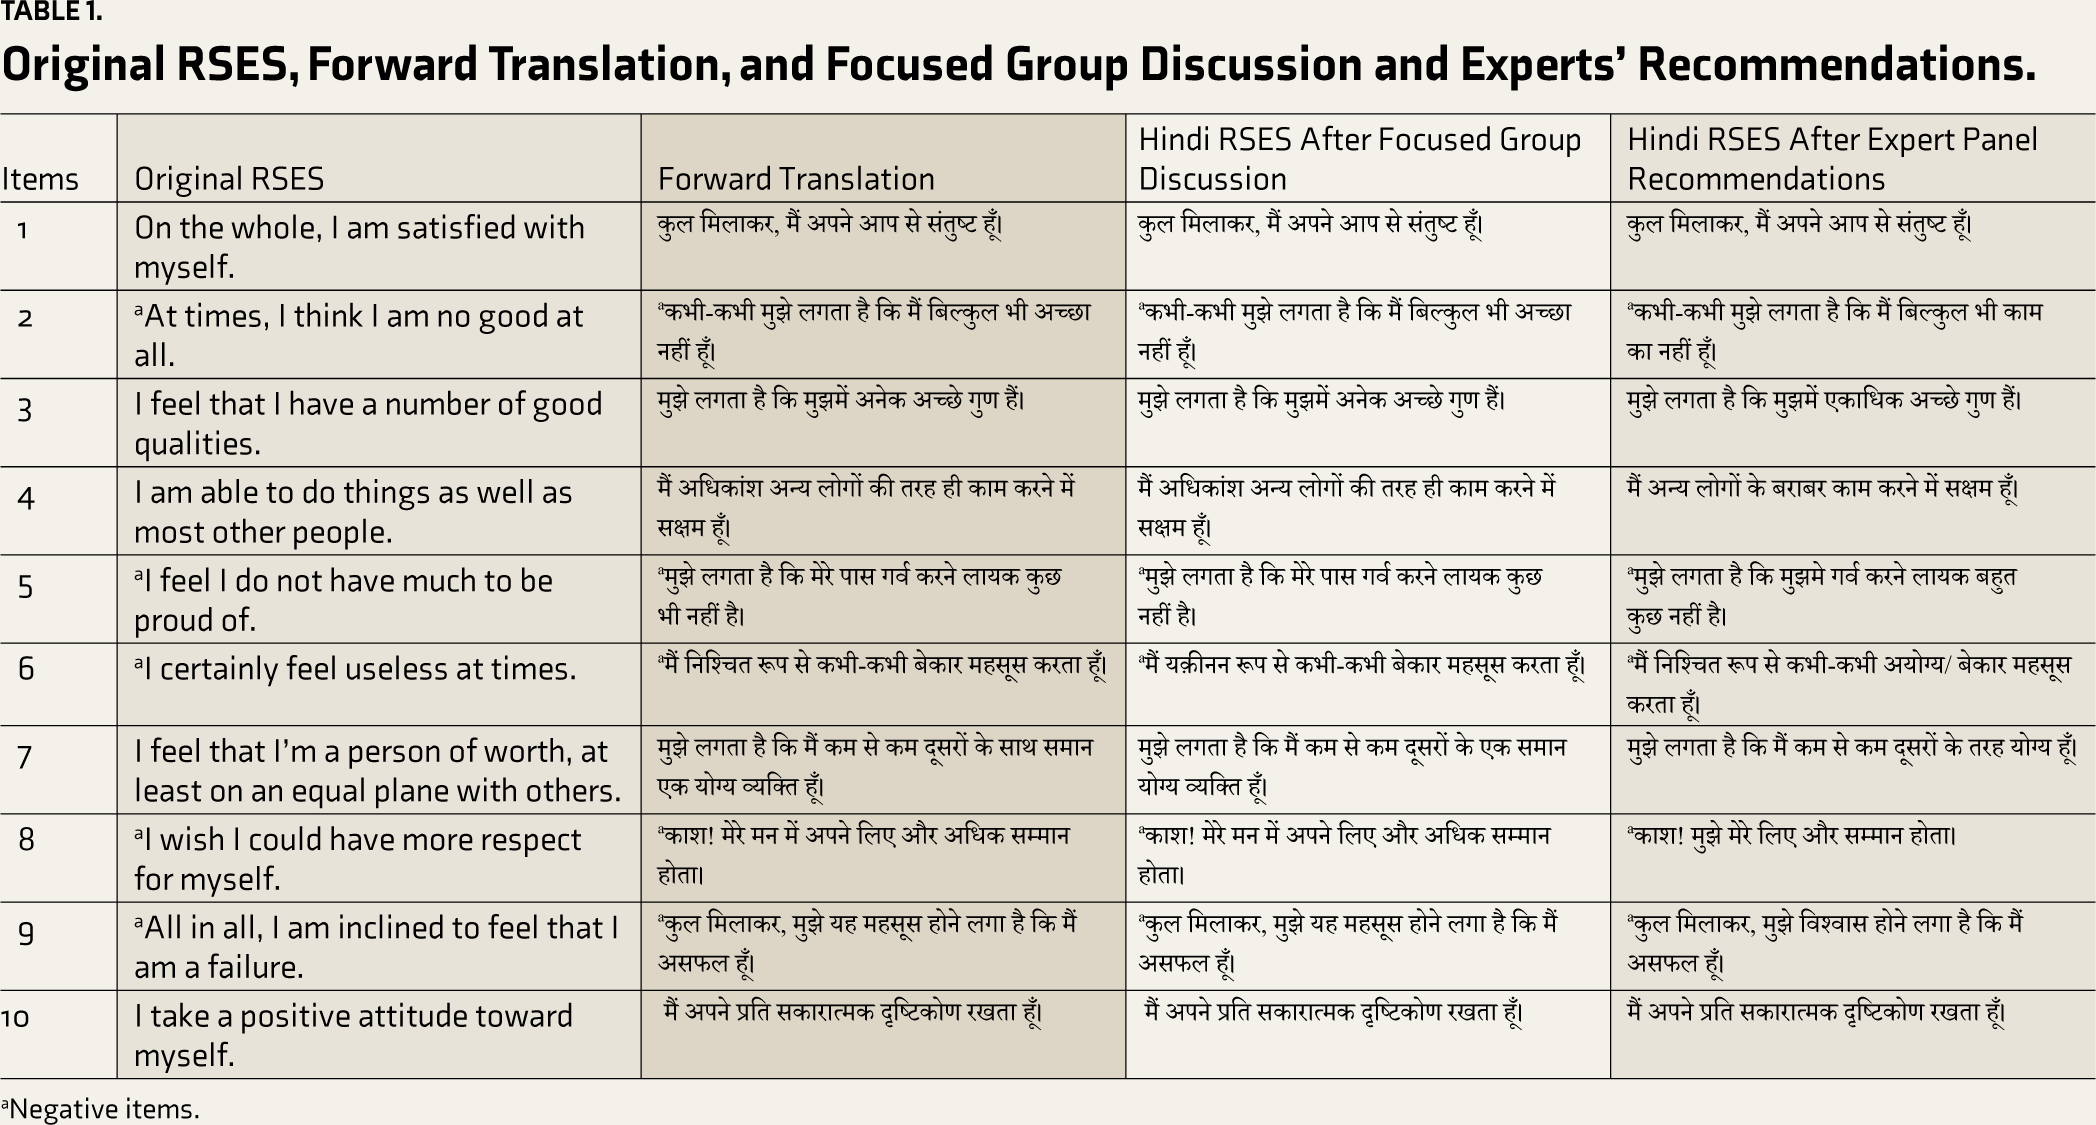
aNegative items.
Furthermore, a pre-testing of the translated Hindi version of RSES was conducted to ensure translation and cultural adaptation. A pilot test was conducted on 15 students of BSc nursing IV year to identify potential ambiguities in items and wordings. The primary purpose of the pre-testing is to ensure clarity and comprehension of the translated questionnaire. Participants took 5–8 minutes to complete the questionnaire and did not report any ambiguities in reading and understanding the questionnaire. No change was incorporated after the pilot testing of the translated RSES.
Validity and Reliability Testing
Face Validity
The face validity of the translated scale was assessed by taking opinions, feedback, and comments on the individual item’s wording, comprehension, relevance, and ambiguity. We used both qualitative and quantitative approaches to ensure face validity. The translated scale was given to randomly selected 26 undergraduate 4th-year nursing students and three experts (two nursing faculty and one psychiatrist) familiar with the concept. In the qualitative approach, the nursing students asked for their opinions regarding ambiguity and comprehension of individual items by asking a single question, “Does the questionnaire look relevant and suitable to measure self-esteem among nursing students?” the response was recorded as “Yes” and “No.” 32 The desired modifications were incorporated into the translated scale based on the feedback of the students and experts.
Content Validity
The content validity of the scale was established using the following steps: First, the seven experts from the field (two experts in nursing, two experts in medicine, two experts in public health, and one expert in psychiatry) were contacted, and consent was obtained to validate the Hindi version of the RSES. Second, a criteria rating scale is prepared to seek the comments and modifications of the experts on the content validation of the scale: (1) Unclear (4) Clear; “Unclear, needs to be discarded (1) Clear, needs major revisions, (2), Clear, needs minor revisions (3) and Clear, no revisions required (4). 33 Third, we planned to calculate the content validity index (CVI) at the item level to ensure items” appropriateness, explicitness, representativeness, and scale content validity (S-CVI) for an overall agreement of the experts to the composition of the scale. Fourth, I-CVI was calculated using the number of experts, rating 3 or 4, on the “relevancy” rating scale divided by the total experts. S-CVI is calculated using the average calculation method (S-CVI/Average). I-CVI of the scale item should be ≥0.78, and S-CVI/Ave should be equal to or more than 0.90.34,35
Construct Validity
Exploratory factor analysis (EFA) was used to confirm the construct validity of the translated scale. The recommended steps of EFA have been used to explore the dimensions of the translated RSES as suggested in previous literature. 36 A Pearson’s correlation coefficient was used to confirm item-to-item relations and a value above 0.3 was considered acceptable for a reasonable level of inter-item correlation. 37 Eigenvalue and total variances were calculated. Communalities were checked, and a cut of value <0.2 was used to examine commonality. 38 Kaiser Criterion was applied to understand each item’s variance and needs to be retained in the analysis. Eigenvalue and total variance were used to retain the item in the analysis. As per the Kaiser Criterion, a component with an eigenvalue >1 is acceptable to retain, 39 and a Scree plot represents the eigenvalues’ graphical representation. 40 50% of the variance explained in the case of the total variance is acceptable for a factor. 41
Further, the translated 10-item questionnaire was analyzed using the Promax rotation method, which considers a non-normal data distribution and assumes some relation between the items.
Reliability
The internal consistency was checked using Cronbach’s alpha, and the test re-test reliability of the scale was checked by administering the translated Hindi version of the questionnaire to 143 undergraduate nursing students two times with the same researcher on an interval of 7 days (1st and 7th seventh day).
Results
The data were entered, cleaned, and analyzed using the Statistical Package for the Social Sciences (SPSS) software for Windows. Version 23.0 Armonk, NY: IBM Corp. 42 Descriptive statistics, including mean and standard deviation, compare scores of translated Hindi versions of RSES between day 1 and day 7. EFA with principal axis factoring with Promax rotation was used to estimate the effectiveness of the scale structure. Content validation index (I-CVI), Scale CVI (S-CVI), Cronbach’s alpha (α), and intraclass correlation coefficient (ICC) were used to measure content validity and reliability indexes. All hypotheses are tested at P < .05 (two-sided).
The mean age of the participants was 21.27 (SD = 1.01) years. All the participants were female (100%), considering female as an admission criterion for undergraduate nursing courses in all the country’s Institutes of National Importance (INIs). 45.2% of the participants belong to the upper-middle-class economic status as per the Modified Kuppuswamy scale. 43 Other details on the participants’ characteristics are presented in Table 2.
Participant Demographics (n = 143).
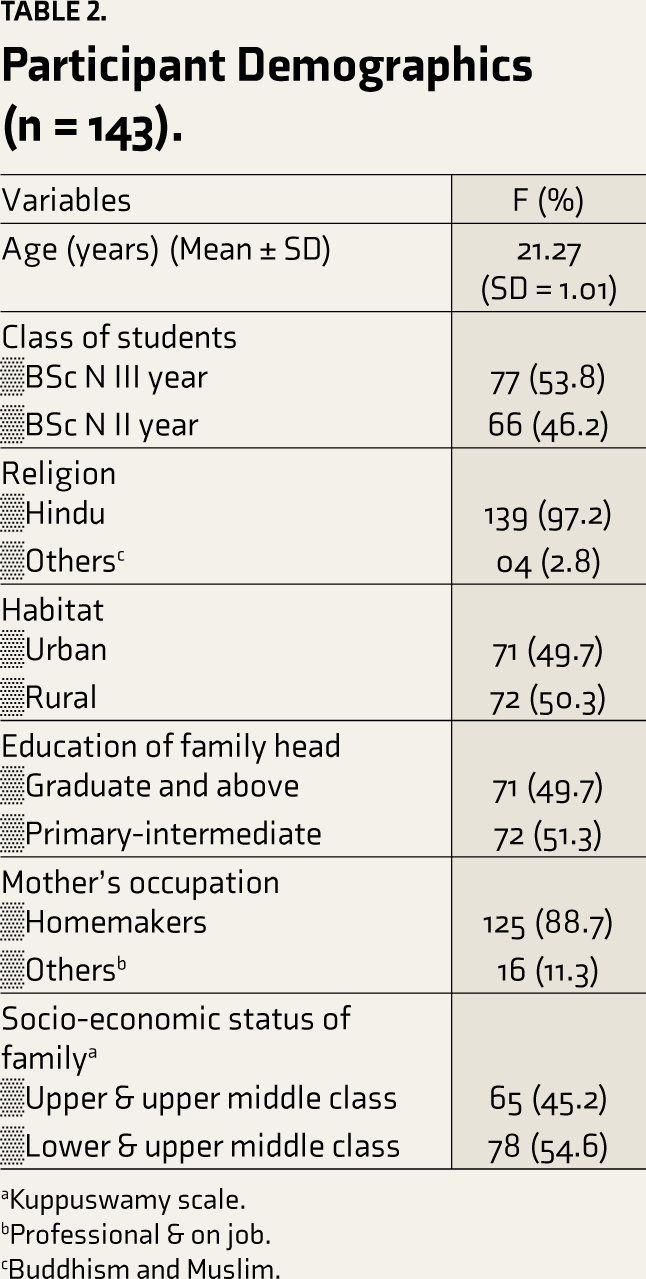
aKuppuswamy scale.
bProfessional & on job.
cBuddhism and Muslim.
First Modifications
We planned three FGD (eight to nine members in one group) with 4th-year nursing students to gather input and feedback on the translated version of RSES as described in methodology: Stage 4—Cultural Adaptation. Students reported problems in the wording of items 5, 6, and 7 and suggested alternative and more suitable words for clarification and ease of comprehension. However, this feedback was the only feedback sought from the students.
Second Modification
A panel of seven experts was invited to comment on content validation of the translated version of the RSES. 44 As described in the methodology, the experts reported problem wording of items 2, 3, 4, 5, 6, 7, 8, and 9. However, the comments were very specific for a few words to replace them with more suitable Hindi words for better semantic, experiential, and conceptual clarity. All the desired modifications are credited into the final translated copy of the RSES (Table 1).
The seven experts gave input on the translated RSES and rated each item’s clarity on a given rating scale. The average I-CVI score was 0.98 for clarity. Based on the experts’ agreement, all items are approved. All items meet the criteria of the I-CVI for approval. We calculated the I-CVI based on the number of experts’ agreement divided by the number of experts; for example, the I-CVI of Q2 is 6 divided by seven experts, equal to 0.85. Further, S-CVI was calculated by considering the I-CVI of each item; for example, the S-CVI/Ave [(7+6+7+7+7+7+7+7)/10 is equal to 0.98. Most items were approved for relevancy based on the I-CVI, which was good and within acceptable limits (Table 3).45,46
The Relevance Ratings on the Item Scale by Seven Experts.
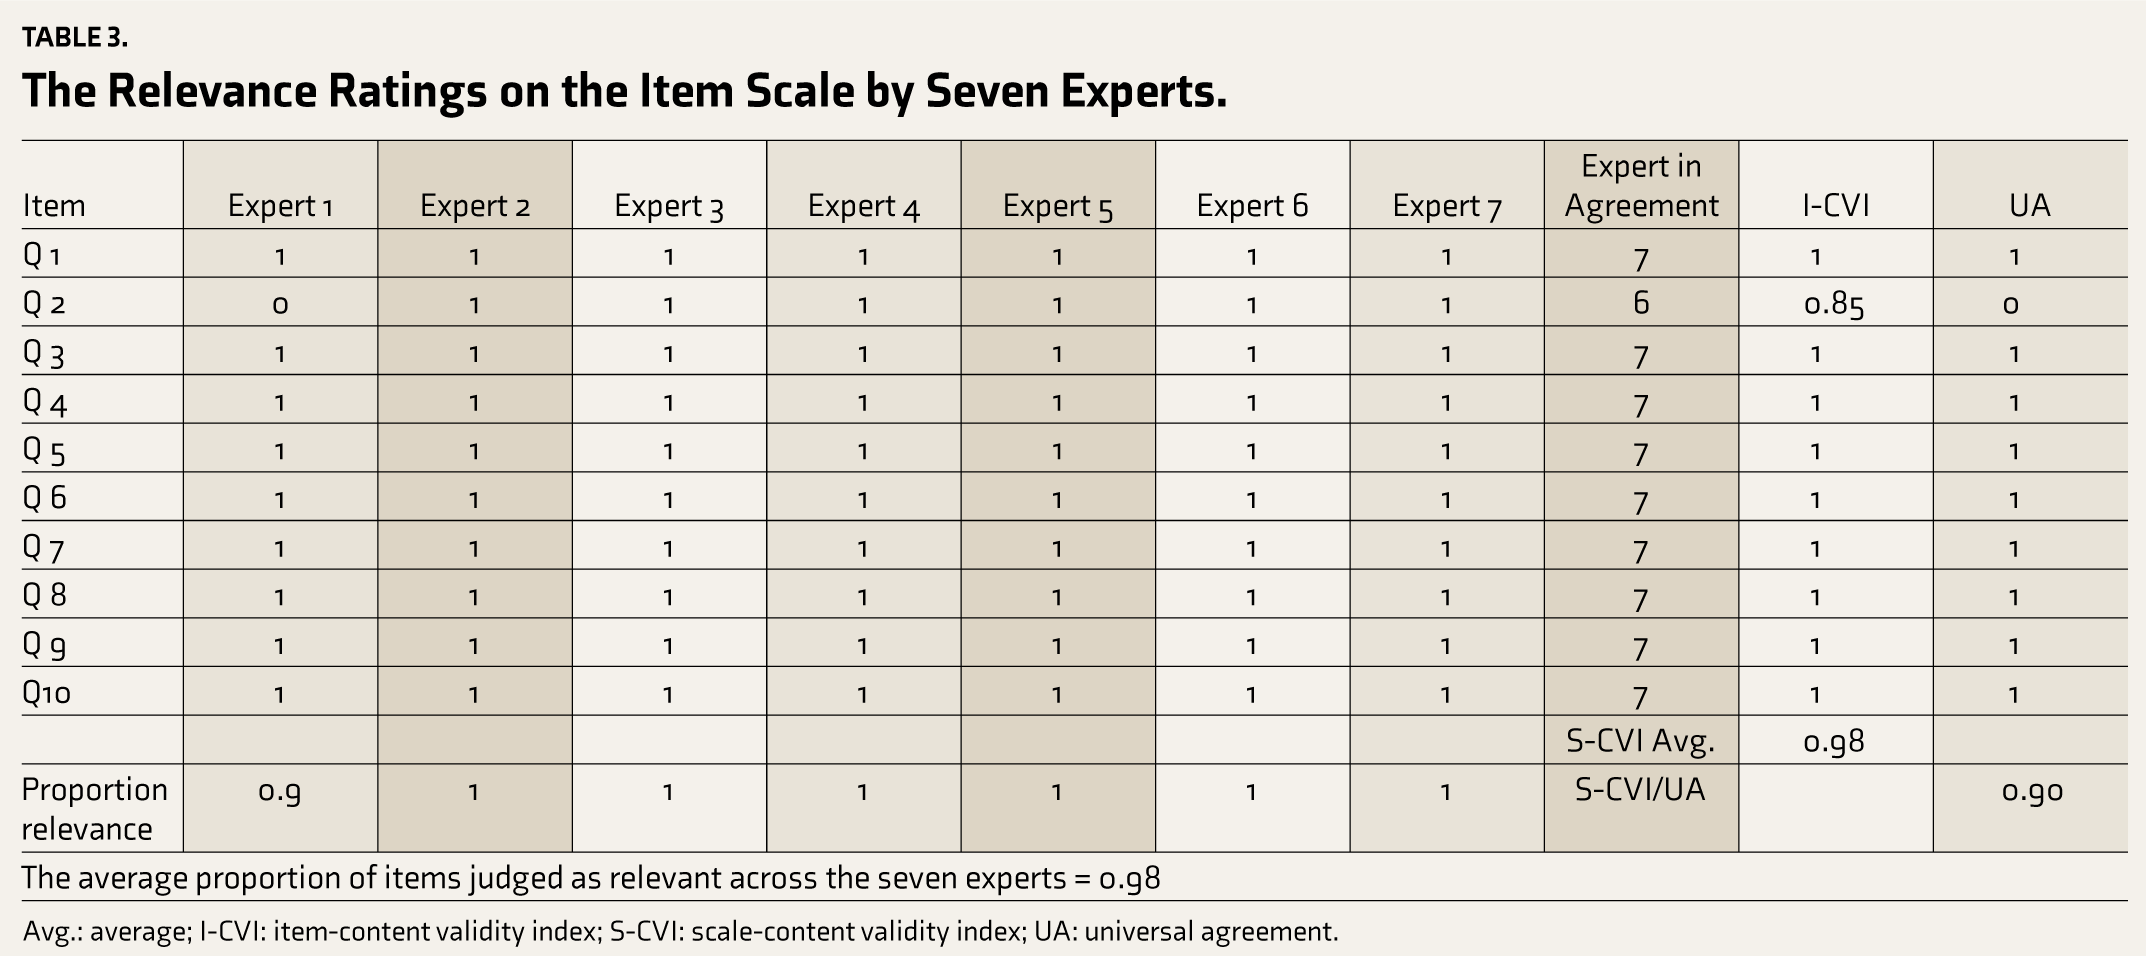
Avg.: average; I-CVI: item-content validity index; S-CVI: scale-content validity index; UA: universal agreement.
Data Preliminary Analysis
Psychometric Testing
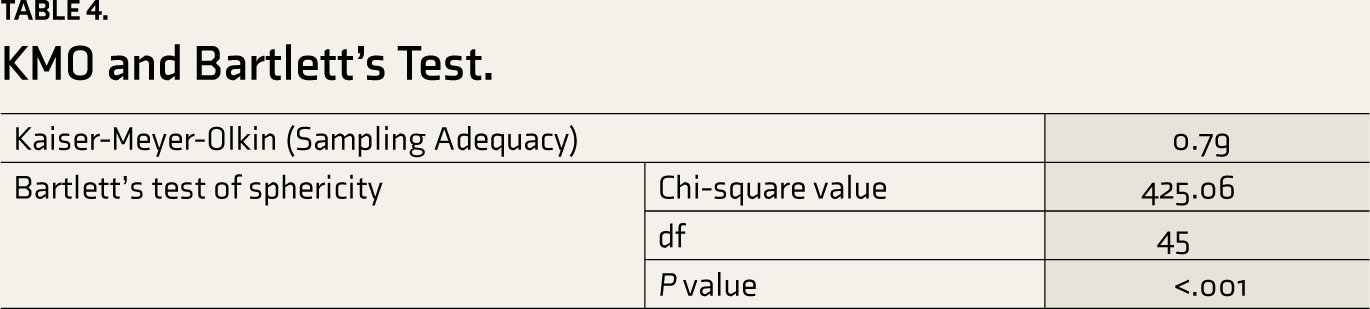
EFA was carried out using principal axis factoring with Promax rotation. This technique helps to test the validity of the translated scale and extract the indexes initially. Further, sampling adequacy was checked to apply factor analysis using Kaiser-Meyer-Olkin (KMO), and the Bartlette test was applied to ensure sphericity. The findings of KMO and the Bartlette test values are presented in Table 4.
KMO and Bartlett’s Test.
The pattern matrix was used to demonstrate the item loadings and the structure matrix presented the contribution and correlation of each item with the individual factors (Supplementary Files).
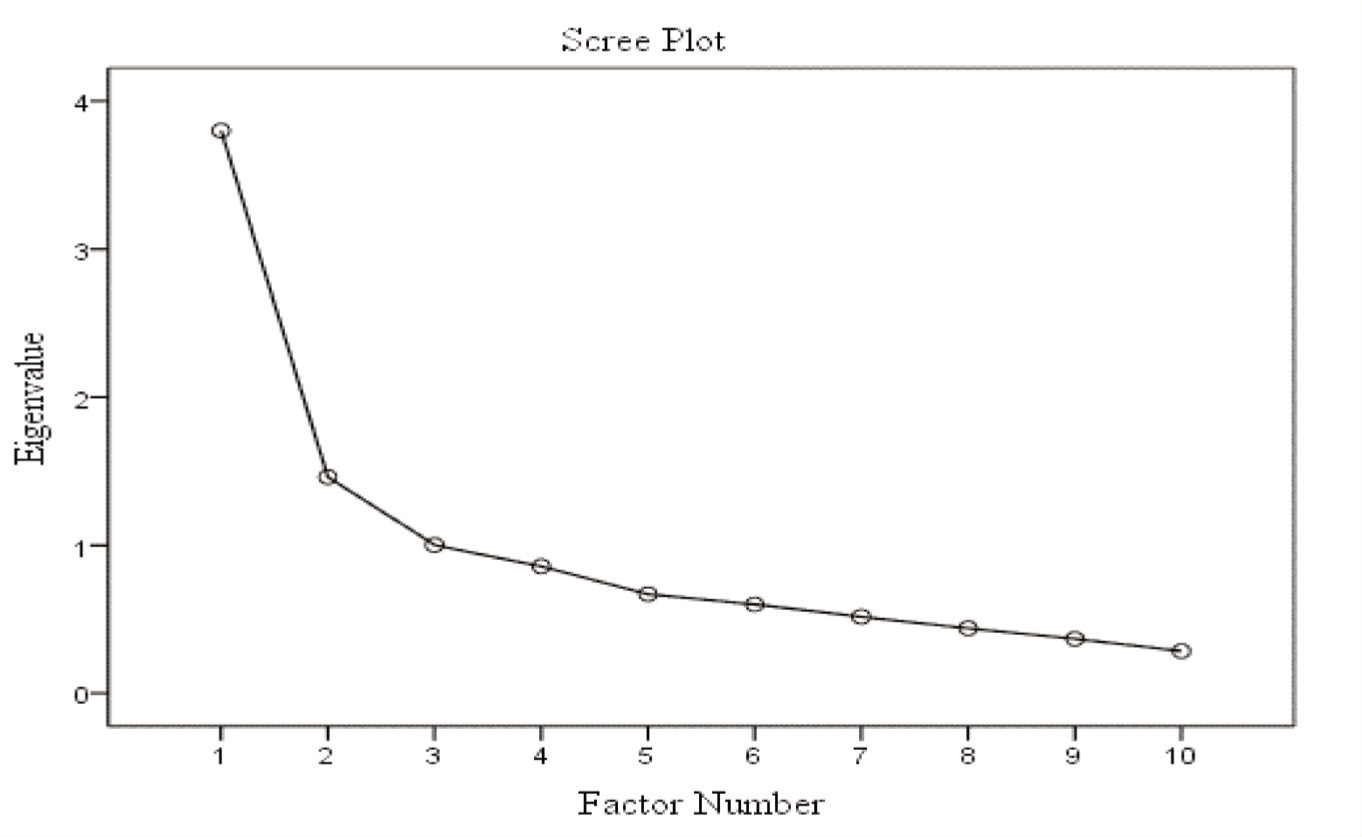
Table 5 presents the factors’ eigenvalue, percentage variance, and cumulative percentage variance of the 10 Hindi versions of RSES items. The findings indicate that the first three factors have an eigenvalue of more than 1, a cumulative variance of 62.62%, and an eigenvalue range between 0.26 and 3.80, indicating near-acceptable results. Three principal component factors were selected based on the descending slope of the eigenvalue in the scree plot (Figure 1).
Principal Axis Factoring Results of Translated RSES.
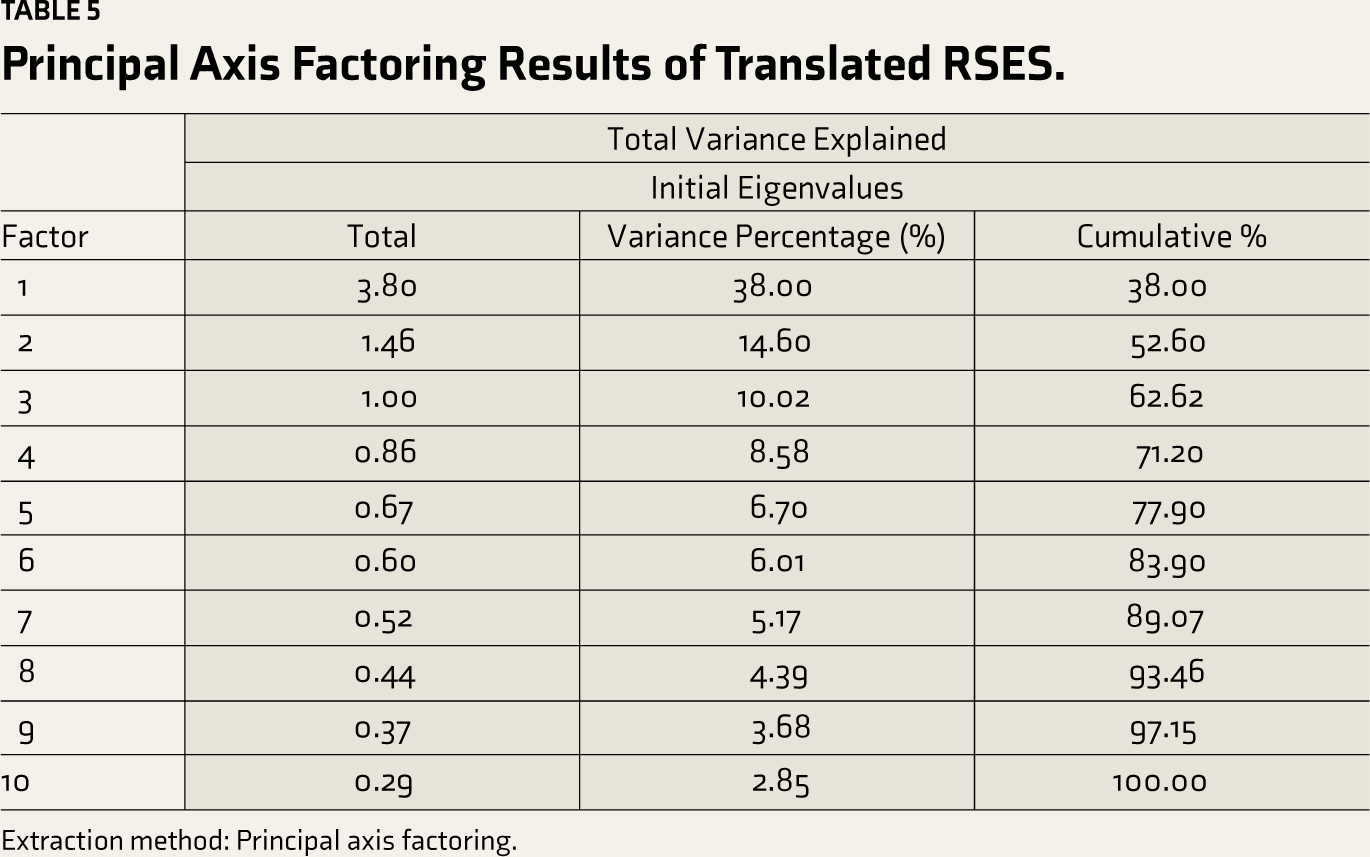
Extraction method: Principal axis factoring.
Scree Plot of the Eigenvalue of Items in Rosenberg Self-esteem Scale.
Analysis of Item Psychometric Properties and Reliability
Cronbach’s alpha coefficient is used to test the internal consistency of the translated version of the scale. A value of more than 0.70 suggests a high internal consistency. 47 Table 6 shows that the scale indicators generally fall in the normal range and are adequate. The translated version of the RSES has good psychometric properties that can be used in the population’s interest. The Cronbach’s alpha value was reported to be 0.73, indicating an acceptable reliability value. Further, eliminating item 1 from the scale increased the internal consistency value from 0.73 to 0.81. Also, item 1 negatively correlates with the rest of the items in the scale and significantly impacts the overall internal consistency, suggesting rechecking the internal consistency in other larger cohorts. Further, the ICC was used to check the test re-test reliability of each item of the translated scale. The test re-test analysis was performed on data obtained from 143 nursing students at 1-week intervals. A type C two-way mixed-effects model was based on a single measurement, and the average measure was used to determine the test re-test reliability. 48 The test re-test reliability of all items lies between 0.43 and 0.91, indicating good to acceptable reliability. However, items 1, 4, and 10 reported reliability of 0.44, 0.43, and 0.44 in our study data, indicating poor reliability, and suggested to be checked in more extensive data with different time intervals to reach a consensus (Table 6).
Item Analysis of the Hindi Version of RSES, Internal Consistency, and Test Re-test Reliability.
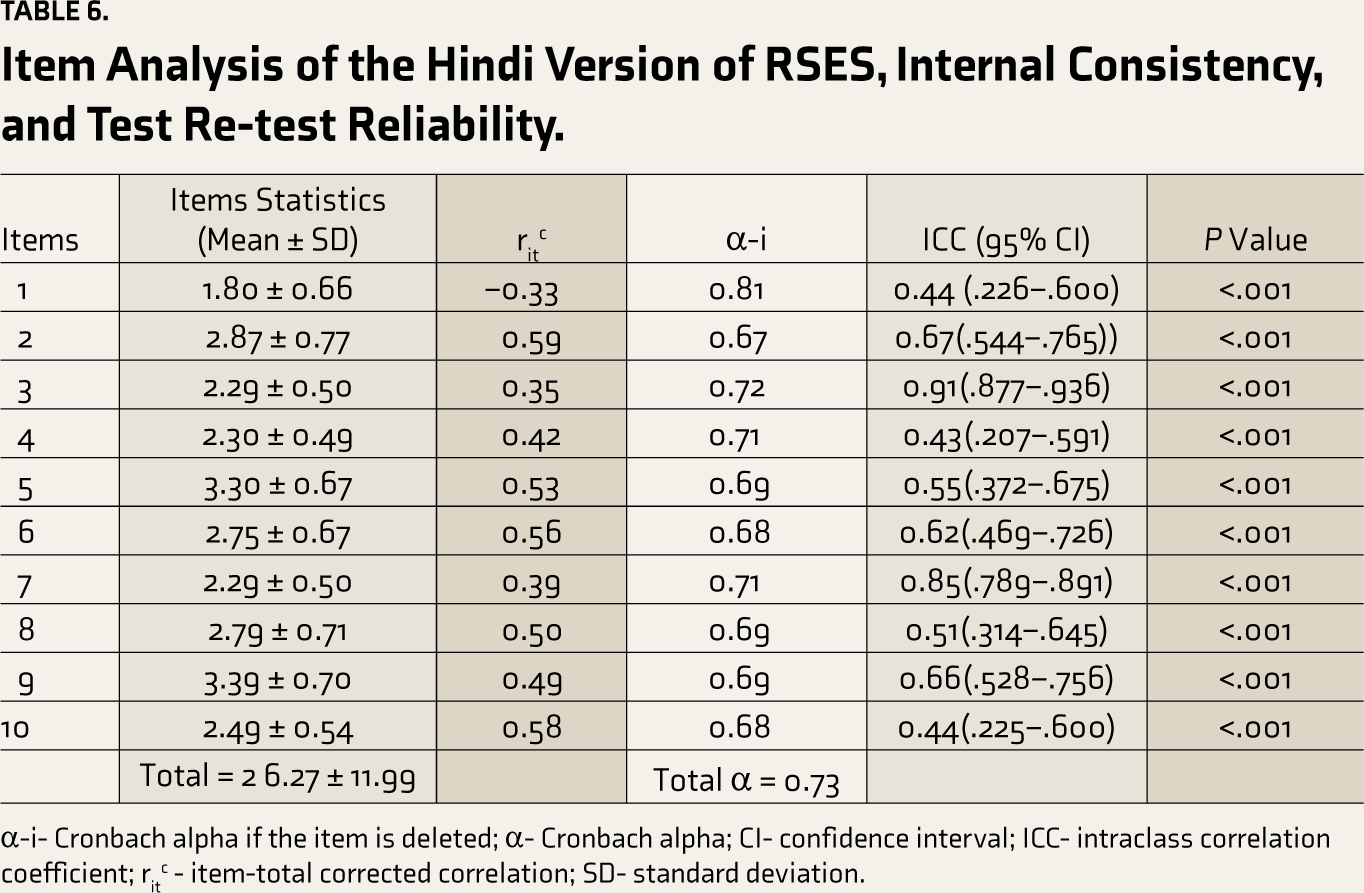
α-i- Cronbach alpha if the item is deleted; α- Cronbach alpha; CI- confidence interval; ICC- intraclass correlation coefficient; ritc - item-total corrected correlation; SD- standard deviation.
Corrected item-total correlation always remains more than 0.30 for the item of the Hindi-translated version of RSES. The Cronbach alpha values remain consistent or demonstrate marginal changes after removing the items. Furthermore, the standard deviation values remain near 1, indicating adequate response variability (Table 5).
Internal Consistency of the Hind RSES: Pearson’s Correlation Coefficient
The internal consistency of the questionnaire was measured by calculating the correlation coefficient between each item with the total score of its elements at the significance level of 0.05. Pearson’s correlation matrix reported that 51.1% of the item pairs had an r-value of >0.3, of which 11 item pairs had a value of >0.4. The finding suggested that the items were associated at the significance level (0.05), except item 1, which negatively correlates with all the other items in the scale (Table 7). The authors presumed that undesirable response or response bias, impulsivity, or straight-line response patterns could be potential reasons for these erroneous findings. Hence, the authors suggest rechecking these findings in other studies on a larger, more homogenous cohort.
Pearson’s Matrix for Inter-item Correlation Coefficient.
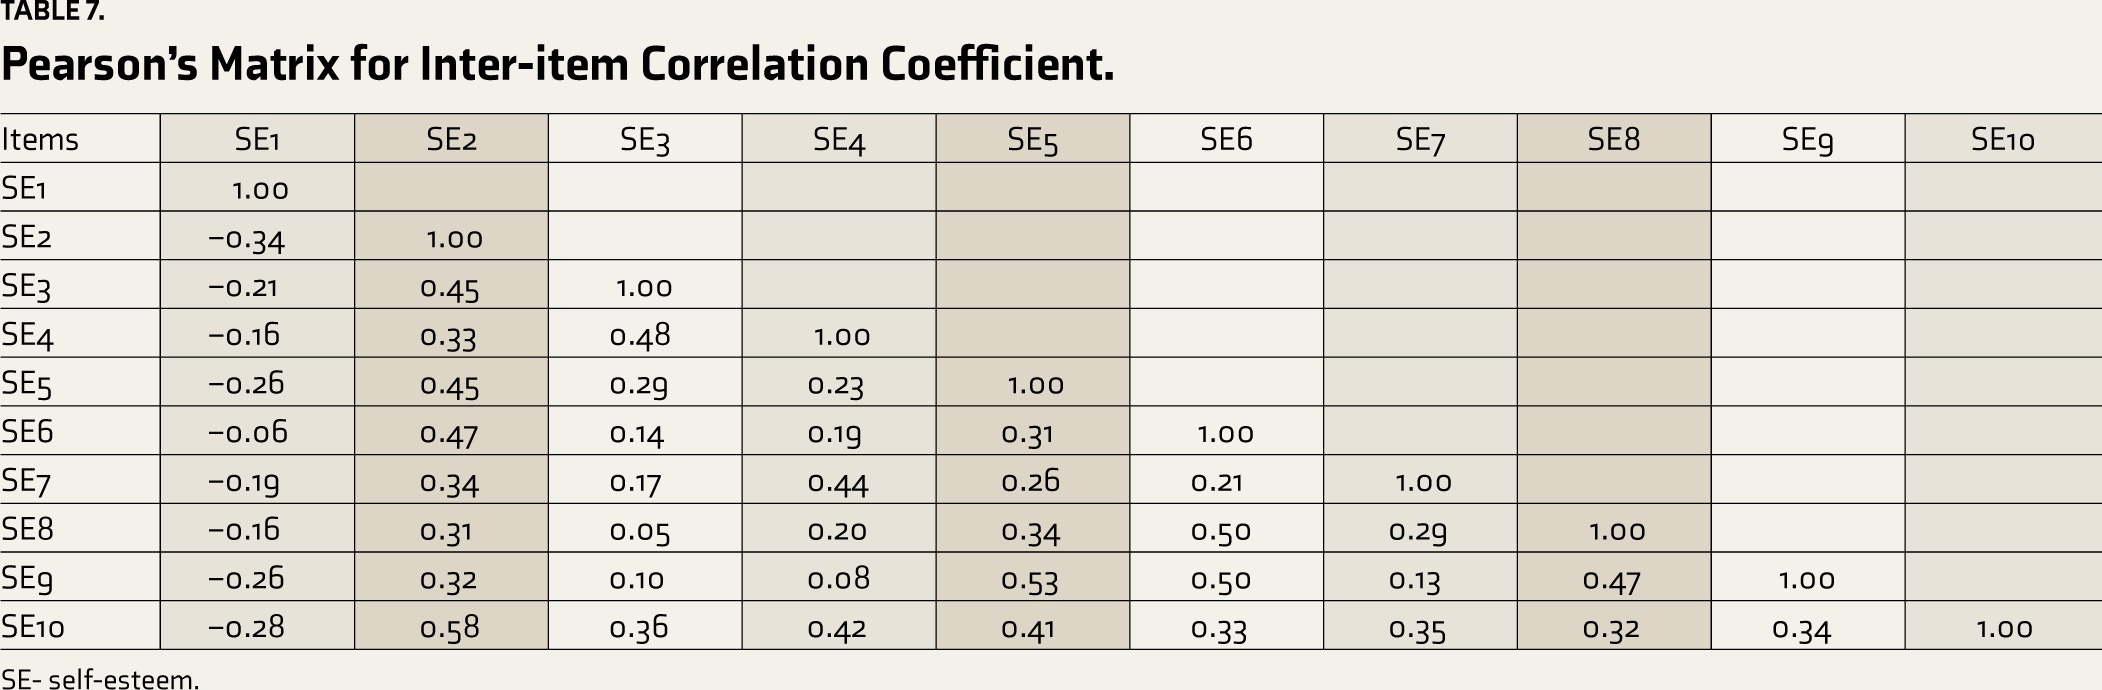
SE- self-esteem.
Discussion
The Rosenberg self-esteem scale is the gold standard for measuring self-esteem among adult populations around the globe. The RSES have been translated and validated, and psychometric properties have been checked in multiple languages for broader use,15,49–51 with no relevant literature on Hindi translation in Indian subcontinents. The study sought to translate, adapt, and test the psychometric properties of the RSES in a sample of undergraduate nursing students. The translation process of RSES followed the guidelines proposed by the WHO, 30 including forward translation, back translation, and expert consultation. We adopted the validation process suggested in the literature for scale developments.52,53 Overall, the scale demonstrated acceptable validity and psychometric properties, including internal consistency and test re-test reliability.
The qualitative evaluation of the translated RSES was reported to be satisfactory in that all items meet the criteria of clarity, representativeness, and relevancy except for a few items. Items 2, 7, 8, and 9 are suggested to be reworded with more suitable and user-friendly words in the Indian context. These findings on rewording a few items, including 8, align with the previously published work from other countries.15,54,55 However, in a Chinese study, it has been argued that I should drop item 8 considering the nonavailability of comparing the word to “wish.” A similar problem also appeared for item 8 in Polish, 56 which was encountered by administering the RSES to a sample of college students in New Zealand. 57 However, no satisfactory consensus was generated on the final inclusion of item 8, and it was explained that amputation or keeping item 8 would not change the scoring substantially. 55
The study’s primary objective is to check the psychometric properties of the Hindi version of RSES using factor analysis. A foremost Pearson’s correlation matrix reported that 51.1%% of the item pairs had an r-value of >0.3, of which 11 item pairs had a value of >0.4, suggesting the common relation to the scale concept. The communalities score of almost all items reported >0.20, except item 1, signifying that all items, except item 1, shared some common variance. These findings concur with the earlier facts, where item 1 reported a communality score <0.20. Nevertheless, item 1, with a communality score of less than 0.20, was advised to be dropped after the factor analysis. 30 However, the authors retained item 1 in the final translated Hindi scale based on the items’ qualitative rating and normal factor loading in EFA.
Primitively, the original format of the 10-item Rosenberg self-esteem scale consists of five positively worded (1, 3, 4, 7, 10) items and five negatively worded (2, 5, 6, 8, 9) items, representing overall feelings and thoughts of an individual about oneself. Further, multiple earlier research studies have rigorously studied the scale’s dimensionality but have not reached a consensus on one dimension. Researchers have proposed a one-dimensional structure, high or low self-esteem,58–60 or a two-dimensional structure (i.e., positive and negative self-esteem) for an extended period.55,60,61 Two-dimensional supporters claimed a better fit of the two-factor model because of reverse or negatively worded statements. 62 Simultaneously, one-dimensional proponents argued and supported that the two-factor structure may invite different responses due to negatively loaded words. 58 However, there needs to be more consensus on the scale’s dimensionality.
The factor structure of the scale was determined through EFA. Factor loading displayed that all the items had loaded an acceptable limit except item 1, which reported negative factor loading. This indicates an acceptable correlation among different items and their respective factors, except item 1, which is intended to measure the opposite construct on the scale. 63 However, there is a discrepancy in factor loading for other items in the previously published research, where findings reported factor loading <0.30 for item 8 15 or negative factor loading 64 for item 8 in different countries (i.e., Mexico, Japan, Botswana, Romania, South Korea, and Zimbabwe), indicating dubiety in factor structure for item 8 in the scale. However, the authors also pointed out that the difference in the factor loading could be attributed to a cultural effect on the concept of self-esteem, as self-esteem is perceived differently in various cultures.54,64 Additionally, the authors explained these differences in the current study as a consequence of impulsivity, straightlining or non-differentiation, speeding, and inaccurate responses by the participants during administration. Hence, researchers recommended an additional investigation into these problems in the sizable, homogeneous, multivariable population.
Cronbach’s alphas demonstrated excellent reliability for RSES after removing item 1. This finding supported previous findings that translated and validated RSES into the Nepali language and reported higher internal consistency after deleting item 1. 15 The findings on the scale’s internal consistency remain moderate to excellent in other translations.15,49,50,64 Likewise, test re-test reliability is acceptable, except for a few items, which also concur with the earlier literature that reported moderate to good reliability.60,61
Strengths, Limitations, and Recommendations
To our knowledge, this is the first published research conducting Hindi translation, adaptation, and validation of RSES in the adult population using standard WHO guidelines.
Although our study results are promising, the study should be appraised under many limitations. First, participants were only female nursing students from a selected nursing institution rather than the community or general population. Hence, it may restrict the broader use of the translated scale in the general population. However, the translation is carried out by blinded bilingual translators, making it unique to use the adult population in the Indian setting. Also, the self-reported nature of the response could cause response bias that might cause inaccuracy and a lack of precision in the findings. Besides, item 1 reported a poor psychometric index and needs to be rechecked in the larger cohort. Still, the authors recommended testing the psychometric properties of the translated scale on more extensive and diverse populations in future studies, especially test re-test reliability. Likewise, the authors recommended checking the empirical validity (concurrent and predictive) in future studies.
Conclusion
In conclusion, the RSES Hindi version has proven to be a reliable and valid scale for assessing self-esteem among the Hindi-speaking population in India and other corners of the globe. The findings may encourage other researchers to use the translated scale in future research.
Supplemental Material
Supplementary material for this article is available online.
Footnotes
Acknowledgements
The authors would like to acknowledge all the experts who helped with the scale’s Hindi translation, back translation, and content validation and Dr Ashok Kumar, Faculty, Postgraduate Institute of Medical Education & Research (PGIMER) Chandigarh, for his statistical inputs in the analysis.
Declaration of Conflicting Interests
The authors declared no potential conflicts of interest with respect to the research, authorship and/or publication of this article.
Ethical Approval
The Institutional Ethics Committee (IEC) All India Institute of Medical Sciences (AIIMS) Rishikesh, Uttarakhand approved the study (AIIMS/IEC/23/382).
Funding
The authors received no financial support for the research, authorship and/or publication of this article.
Informed Consent
A written Informed consent was obtained from Individual participant after a brief description about the aims and objectives of the study.
References
Supplementary Material
Please find the following supplemental material available below.
For Open Access articles published under a Creative Commons License, all supplemental material carries the same license as the article it is associated with.
For non-Open Access articles published, all supplemental material carries a non-exclusive license, and permission requests for re-use of supplemental material or any part of supplemental material shall be sent directly to the copyright owner as specified in the copyright notice associated with the article.