
Abstract
Introduction:
Substance-use disorders (SUDs) are a public health problem. The Global Adult Tobacco Survey (GATS) and National Family Health Survey (NFHS) provide evidence of high usage. Hence, the National Mental Health Survey (NMHS) WB data were analyzed to estimate the prevalence, pattern, disability burden, and service utilization of SUD.
Methodology:
The usual NMHS methodology was used. Four districts were selected, and thereafter, a multistage random sampling was done. The validated Bengali version of the Mini International Neuropsychiatric Interview (MINI) and other instruments like the Fagerstrom Test for Nicotine Dependence (FTND), disability, and health care utilization modules were used.
Results:
A total of 2,646 eligible members (age >18 years as per 2011 census) were interviewed. It was found that alcohol use as per MINI at least 3 drinks of alcohol within 3 hours on 3 or more occasions was 3.9%, and the weighted prevalence of alcohol-use disorder (AUD) and tobacco-use disorder (TUD) was 3.04% and 14%, respectively. The AUD and TUD prevalence was lower than the national prevalence, yet they were more prevalent in urban areas than in the national trend. The ratio of women to men suffering from AUD in WB (1:5) was one of the highest in the country (all India average 1:18). Also, the treatment gap of 89.2% was more than the national average.
Discussion:
SUDs are an important public health problem in the state of WB, which requires further research, particularly among women, comorbid psychiatric disorders, and in urban areas.
The burden of substance-use disorder is high in the state of West Bengal, with tobacco and alcohol being the primary substances of use. At the same time, the treatment gap is also higher compared to the national average. So, planning, strengthening, and implementing different district-level, state-level, and national-level programs are the call of hour in the state.Key Message:
Substance use in the community at large has significant implications for public health. The national survey on the extent and pattern of substance use in 2019 has reported alcohol as the most common psychoactive substance used by Indians (14.6%), followed by cannabis (2.8%) and opium (2.1%). 1 As per the results of the Global Adult Tobacco Survey (GATS) 2016–2017, 28.6% of Indians are currently using tobacco in any form (smoking or smokeless). 2 Drug seizure data by the Narcotics Control Bureau revealed that reportedly 2,865 kg of heroin were seized from January to July 2021, and more than 4,000 cases were registered, reflecting indirectly the burden of substance use in India. 3 Previous studies have shown that there is considerable variation among Indian states in terms of the prevalence of substance use––for example, for current tobacco use, as per the GATS survey, it ranges from 9.7% in Goa to 64.5% in Tripura. 2 Hence, the pattern of substance use and the related public health burden needs to be researched in West Bengal (WB), one of the most populous states, which has a strategic geographical situation sharing international borders with three countries.
WB pioneered research in mental health epidemiology in India. 4 Nandi et al. conducted an extensive mental illness survey in both rural and urban clusters but excluded any form of substance-use disorder (SUD).5,6 However, later studies that included substance use were mostly limited to cross-sectional community-based studies like that by Sau et al., which revealed that cannabis (42.96%) was the most commonly used drug, followed by alcohol (35.92 %) in WB. 7
The first representative national survey on substance use by Ray et al. 8 performed a Rapid Assessment Survey (RAS) in Kolkata, WB. Another focused thematic study (FTS) at Lalgola and Bhagawangola, Murshidabad, identified SUD as a public health problem in WB. It has been seen that as per the National Family Health Survey-5(NFHS-5) (2019–2020) of WB, 48.1% and 18.1% of men above 15 years are using tobacco and alcohol, respectively, while 10.8% and 1.1 % of women are using tobacco and alcohol, respectively. 9 As per the GATS-2 survey, the percentage of current tobacco users in WB is higher than the national average. 2 However, the NFHS-5 did not record the problem burden, SUD, or the percentage of the population requiring treatment. Because of the paucity of studies, it was necessary to analyze the National Mental Health Survey (NMHS) 2016 WB data in depth so that SUD’s real burden comes to light. NMHS in WB was conducted under the guidance of NIMHANS, Bengaluru, in collaboration with the Institute of Psychiatry, Kolkata (Registration number ECR/35/Inst/WB/2013/RR-1). The objective here is to estimate the prevalence, pattern, disability burden, and service utilization of SUD in WB. The study was executed after obtaining administrative permission and ethical approval from the institutional ethics committee, Institute of Psychiatry, Kolkata.
Methodology
The methodology of NMHS is described elsewhere in detail. 10 In brief, initially, a National Technical Advisory Group (NTAG) planned a pilot study and implemented it in the district of Kolar in 2014, which formed the basis of a larger survey coordinated by NIMHANS in collaboration with the partnering states. 11
Instruments
The following instruments collected household information about substance use.
Socio-demographic Details
Socio-demographic data included completed age, gender, educational status, occupation, religion, marital status, individual and family income.
Fagerstrom Test for Nicotine Dependence (FTND) 12
In this survey, after screening individuals with tobacco use (both smoking and smokeless), the clinical details such as the age of initiation, duration, regularity, and expenses were asked and they were interviewed with an adaptation of the FTND to assess tobacco dependence.
Mini International Neuropsychiatric Interview (MINI)13,14
It is a brief structured interview schedule mainly covering the major axis one psychiatric illness. It has a structured questionnaire for assessing alcohol dependence/abuse and non-alcohol substance dependence/abuse except tobacco. In non-alcohol substances dependence/abuse, MINI has covered a wide range of substances, that is, stimulants, cocaine, narcotics, hallucinogens, phencyclidine, inhalants, cannabis, tranquilizers and miscellaneous substances such as cough syrup and steroids.
Sheehan Disability Scale 15
The Sheehan Disability Scale measures symptoms’ impact on family, work, and social functioning. An individual’s impairment in life is rated either on a 10-point visual analog scale or on a five-point Likert scale. The scoring is 0, 1–3, 4–6, 7–9, and 10 on the visual analog scale, corresponding to “not at all,” “mildly,” “moderately,” “markedly,” and “extremely” respectively.
Measuring Treatment Gap
The treatment gap is the difference between the number of people with an illness who need treatment and people seeking adequate treatment (expressed as a percentage). 16
For the current study, the above instruments were translated into Bengali, ensuring that there was no significant change in the original and translated questionnaire.
Sample Size Estimation
As per the standard formula and the pilot study findings, it was finalized to 2,857, which was later rounded to 3,000 (details described elsewhere).10,11
Sampling Design
A multistage stratified random sampling technique was adopted, with random selection based on probability proportional to size at each stage.10,11 Finally, 654 Households were selected based on the systematic random sampling technique, making the households the Final Sampling Unit (FSU). A total of 2,646 eligible members (age >18 years as per the 2011 census) in the identified household were interviewed for final data collection.
Data Collection
To ensure quality and uniform data collection, training was conducted at all levels, from core investigators to Field Data Collectors (FDCs). In West Bengal, 7 FDCs were trained in interviewing and data collection, which was mostly done with Handheld Electronic Devices (HHEDs).
Record Keeping and Quality Assurance
Detail records were maintained at various levels, and a 3-tier monitoring mechanism was set up to ensure quality through rigorous training of the data collectors, timely review, supervision, spot checks and field visits from the field to the central level.
Statistical Analysis
After cleaning the dataset, it was explored with Statistical Package for Social Sciences (SPSS) version 28 for analysis and descriptive statistics were used to enumerate the study findings. The weighted prevalence of SUDs was illustrated and multiple logistic regression analysis was used to determine the magnitude of the problem, keeping the significance level at <0.05. In multiple logistic regression, socio-demographic variables were independent and the SUD was the dependent variable.
Qualitative Methodology
Focus Group Discussions (FGDs) and Key Informant interviews (KII) were conducted as part of a standardized qualitative methodology for understanding drug use and abuse characteristics.
Results
Across WB, 654 households were identified and 2,646 eligible individuals were interviewed (individual response rate of 93.9%). The socio-demographic details of the total sample have been described elsewhere.
Among 2,646 respondents, 3.9% had taken at least 3 drinks of alcohol within 3 hours on 3 or more occasions. The weighted prevalence of AUD, TUD, and other(illicit) SUDs were 3.04%,14.3%, and 0.8%, respectively (see Table 1). The weighted prevalence of alcohol dependence and harmful use were 2.9% and 0.2%, respectively.
Prevalence Estimates of Substance-use Disorder.
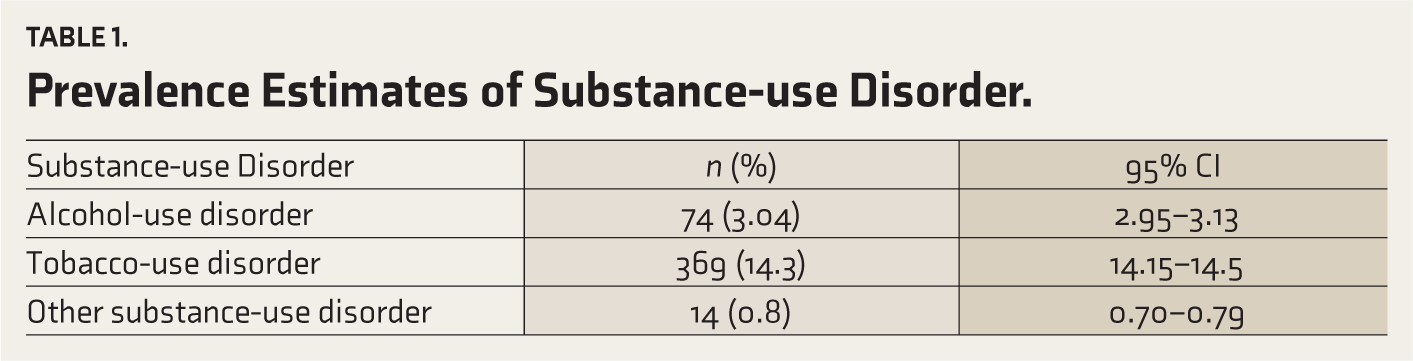
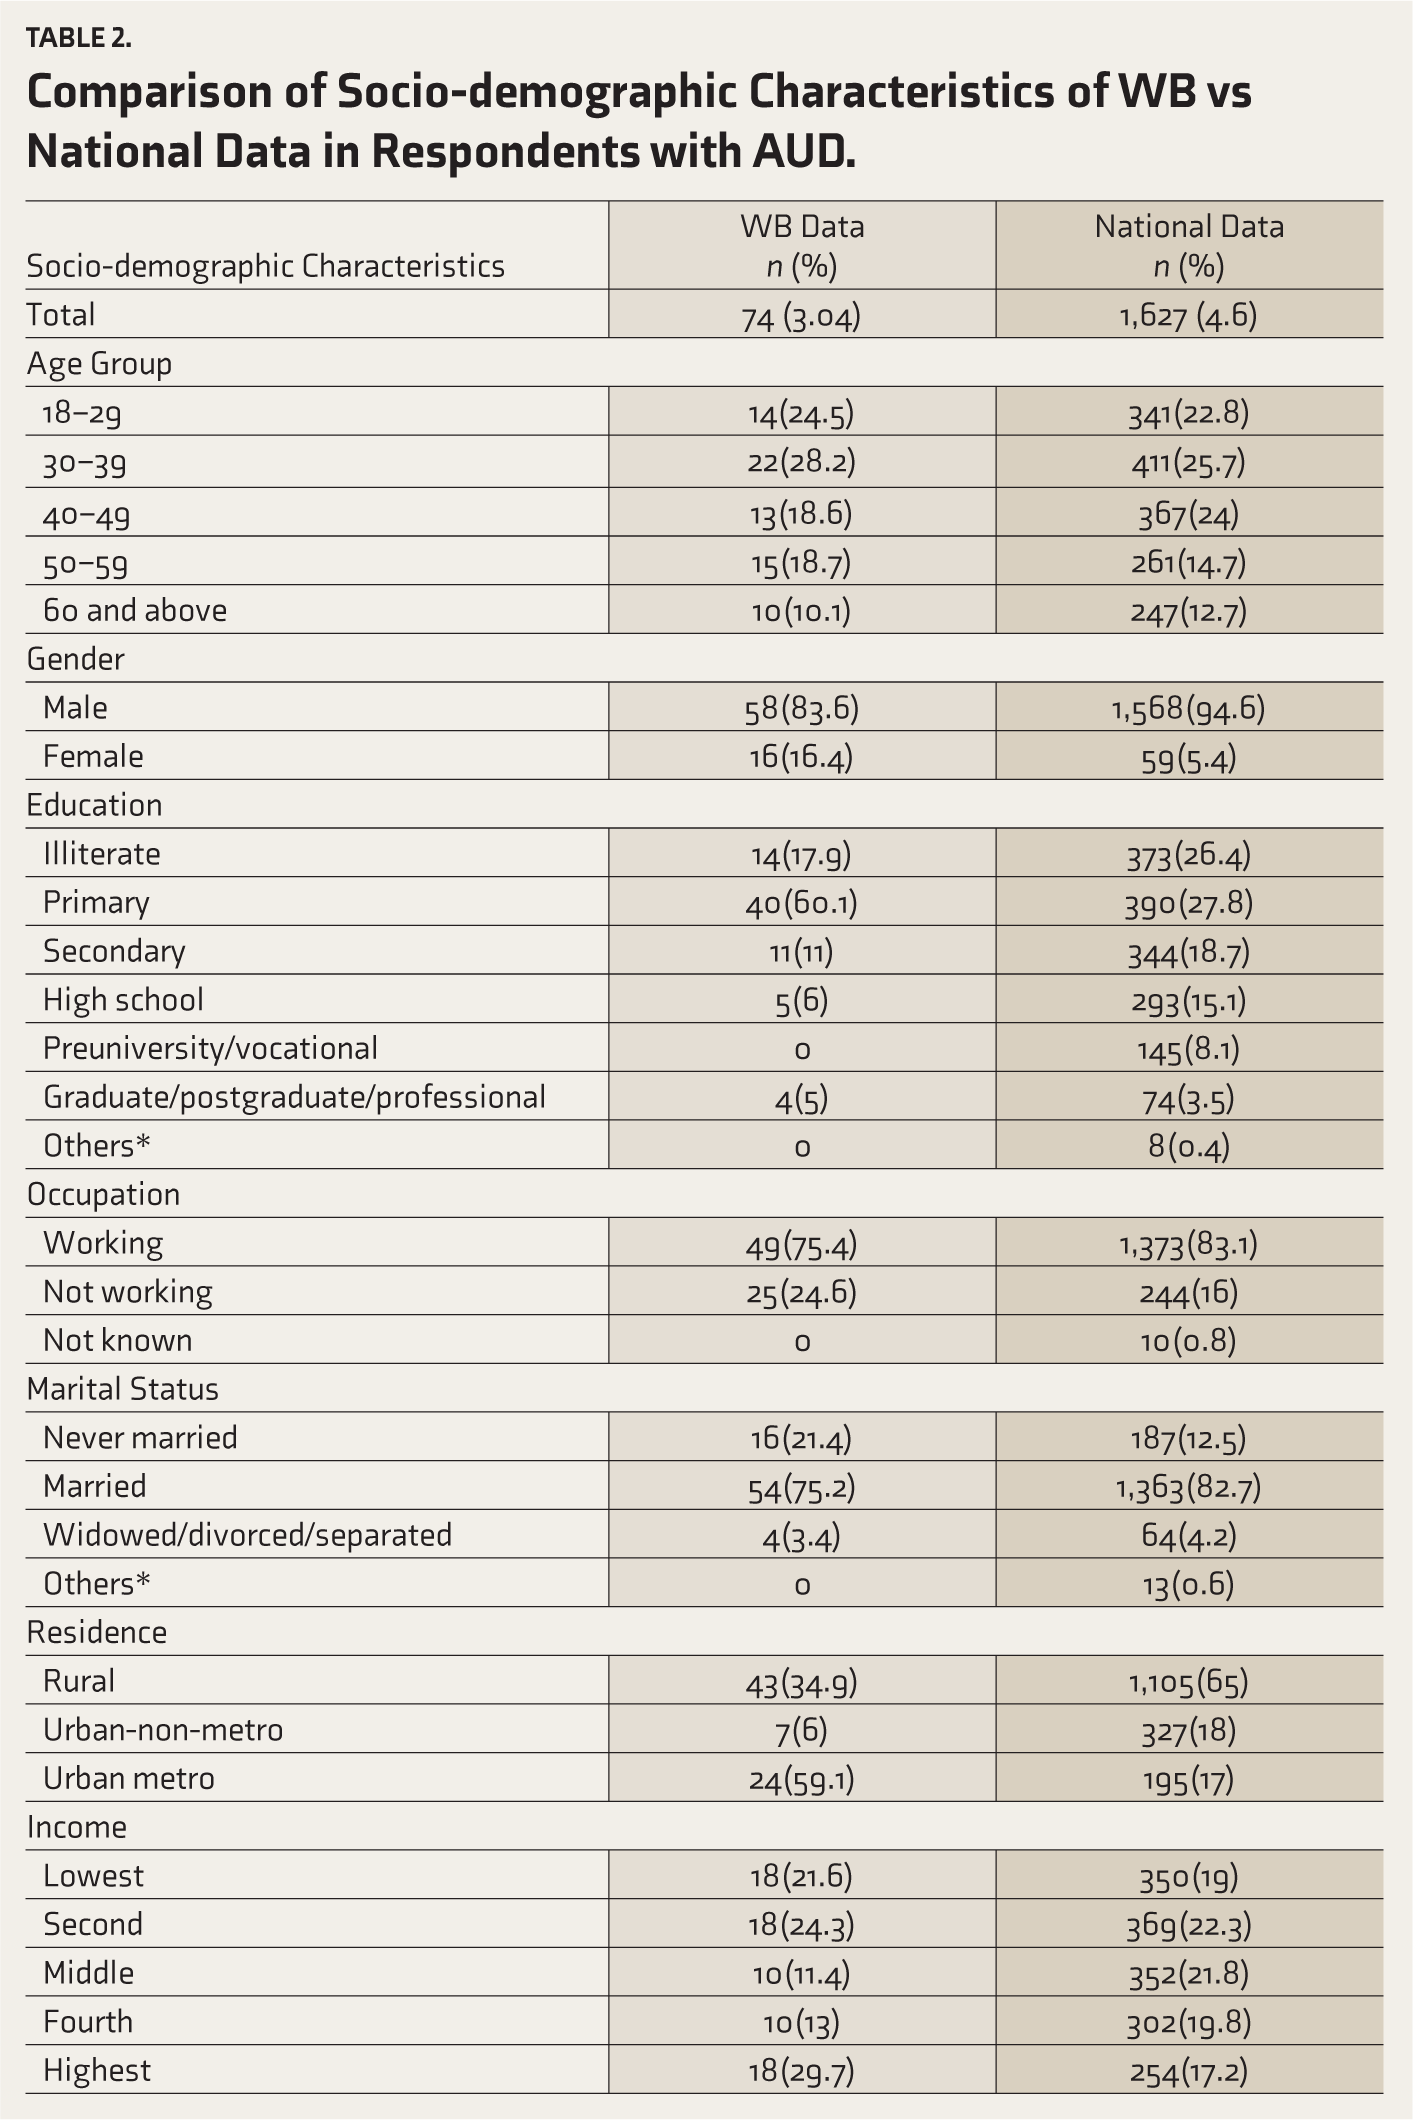
Table 2 shows the socio-demographic characteristics of respondents with AUD compared to the national data. Among the different age groups, 24.5% belonged to the 18–29 years group, and 28.2% were in the 30–39 years group. As far as sex distribution is concerned, 83.6% were males, and 16.4% were females. The proportion of women with AUD was higher than the national data (see Figure 1). Regarding residence, a higher proportion of persons with AUD were residing in urban metros (59.1%), which is in contrast to the national data
Comparison of Socio-demographic Characteristics of WB vs National Data in Respondents with AUD.
Comparative Weighted Prevalence of Alcohol Use Disorders Concerning Gender in Different States of India.
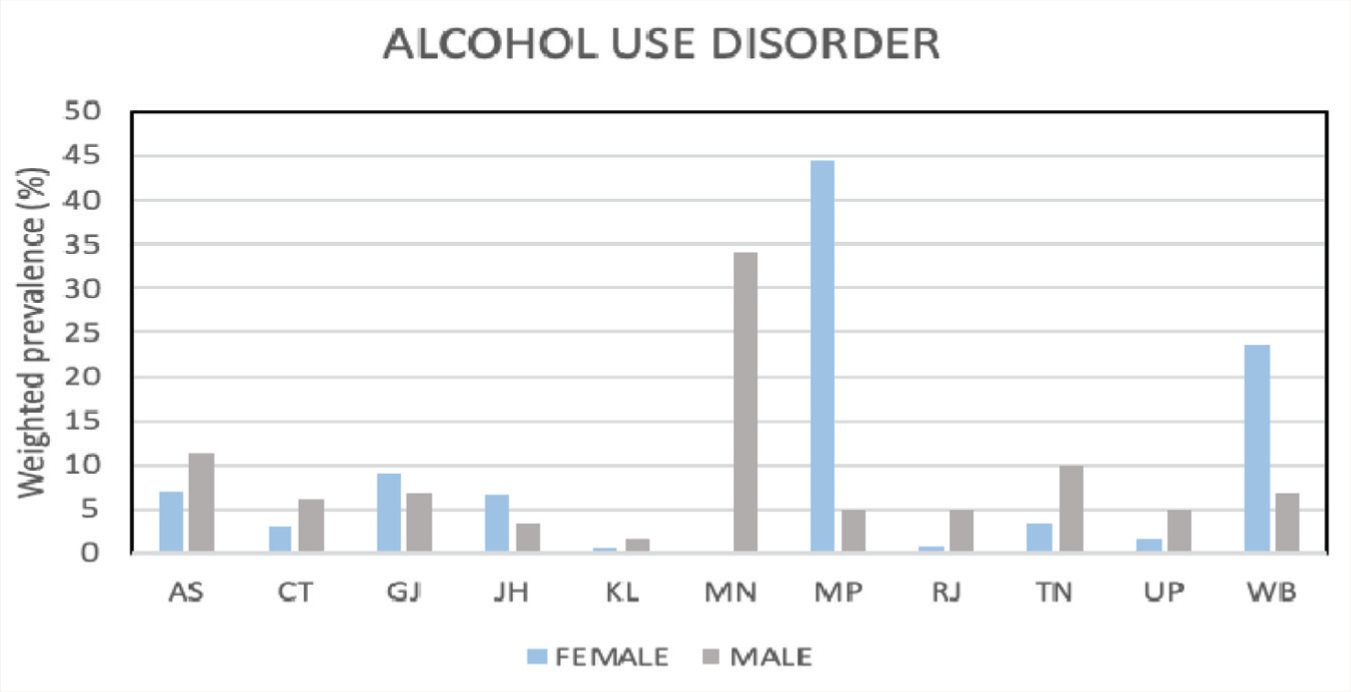
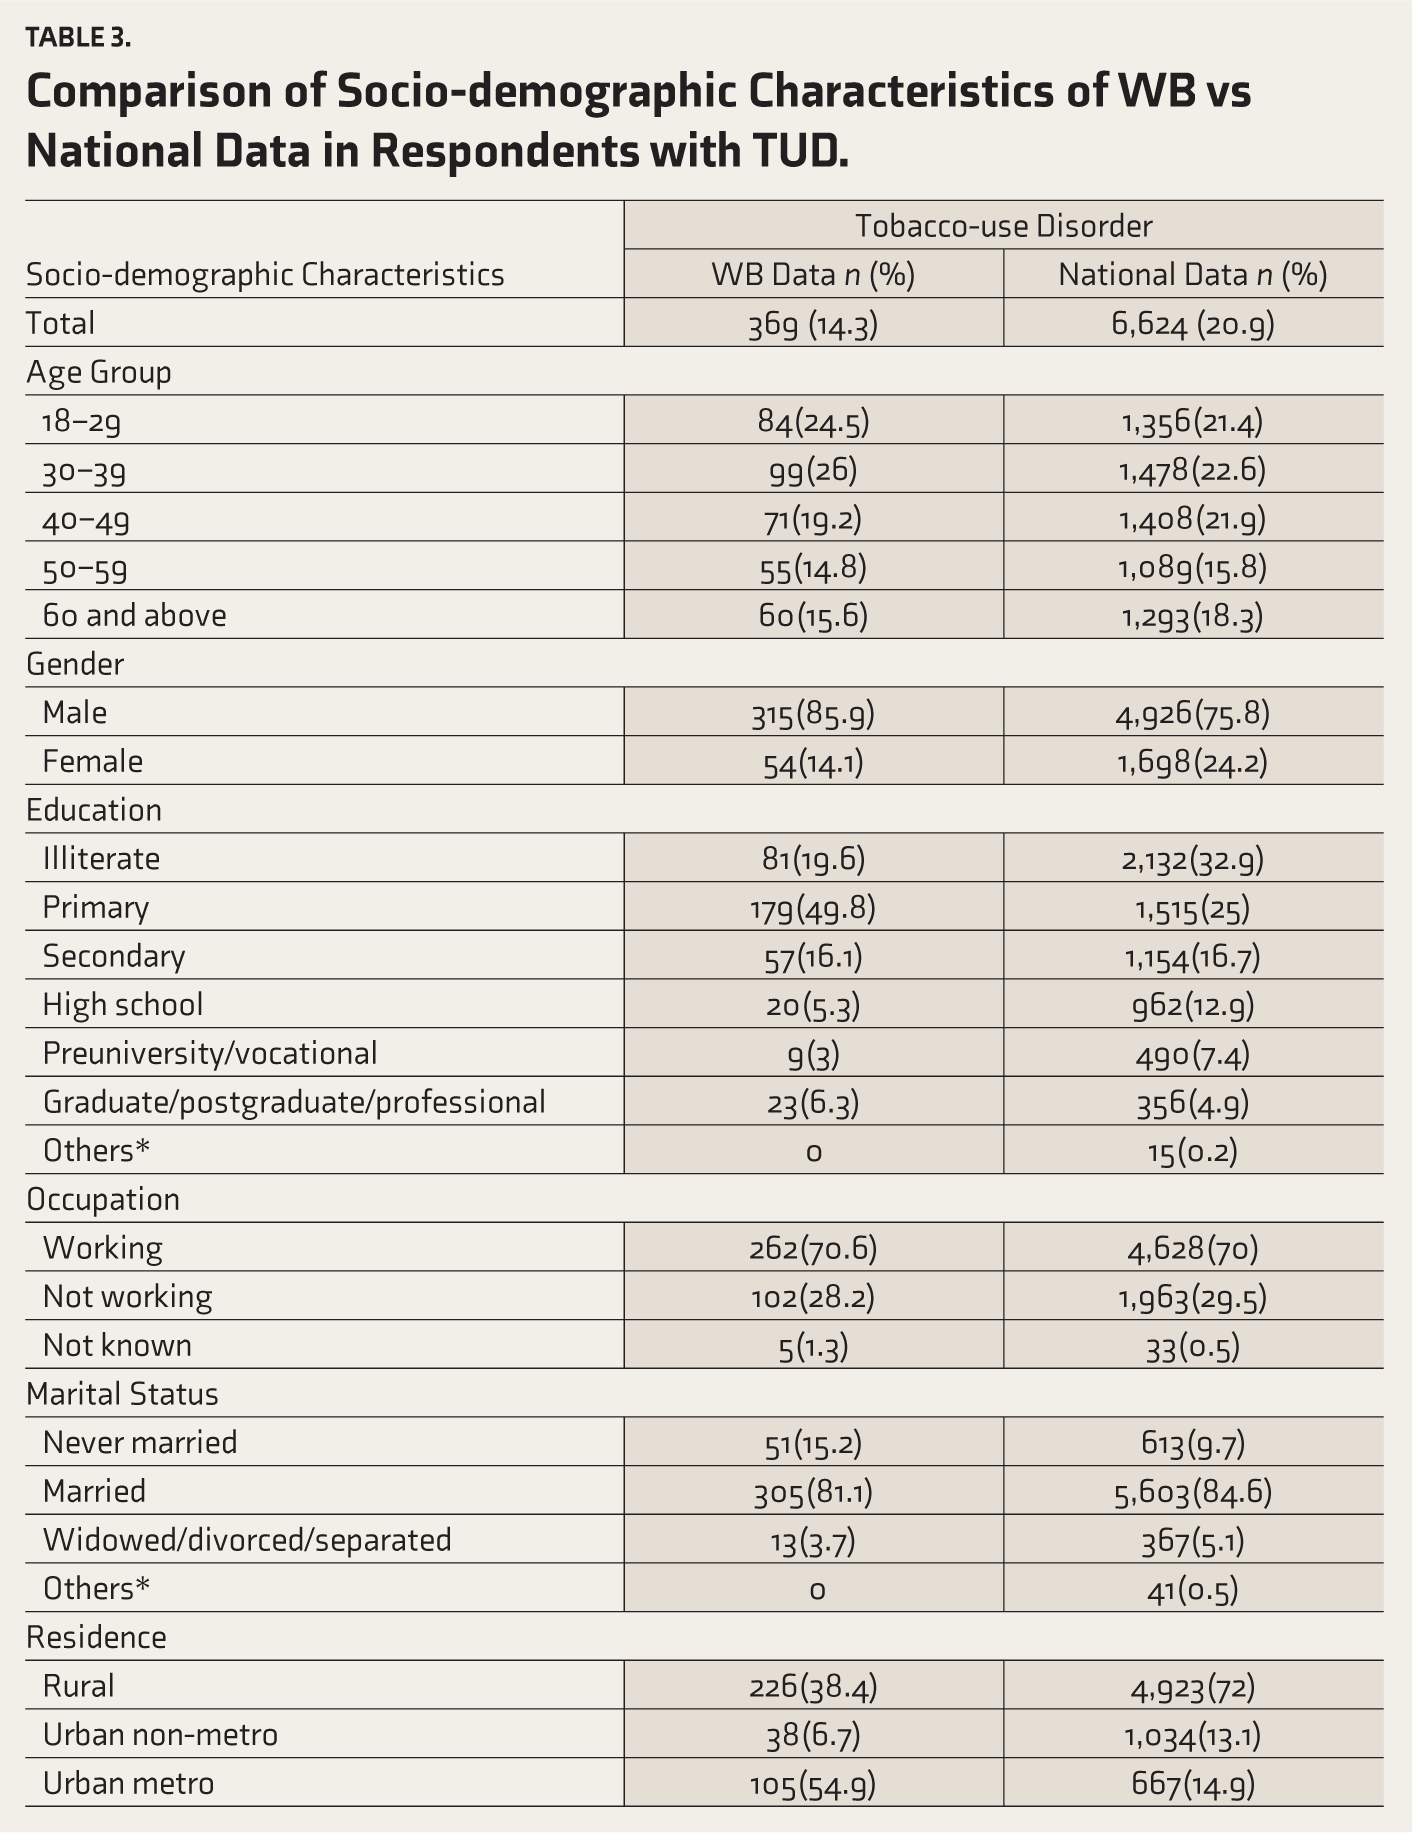
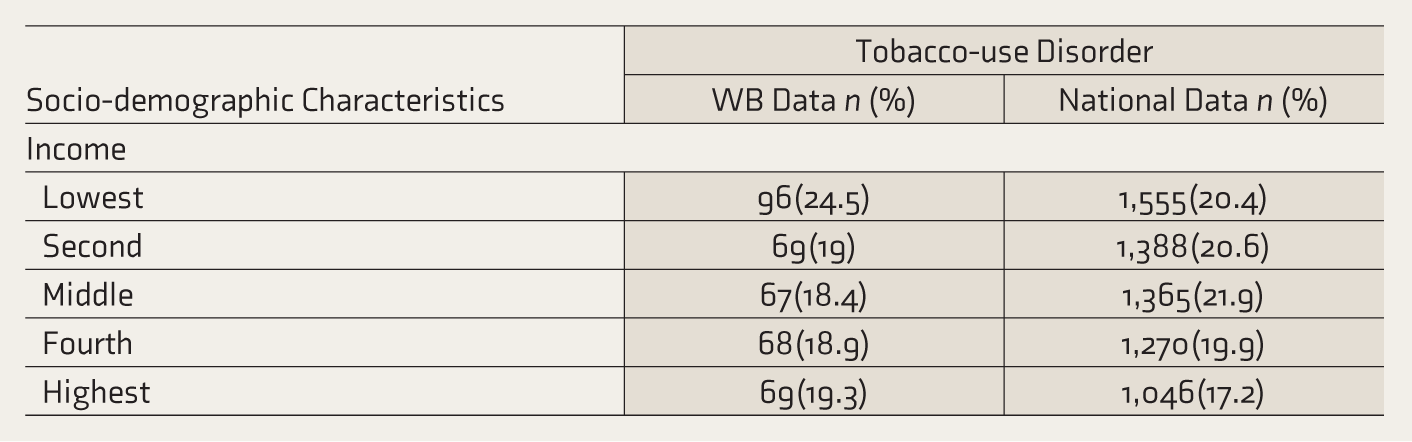
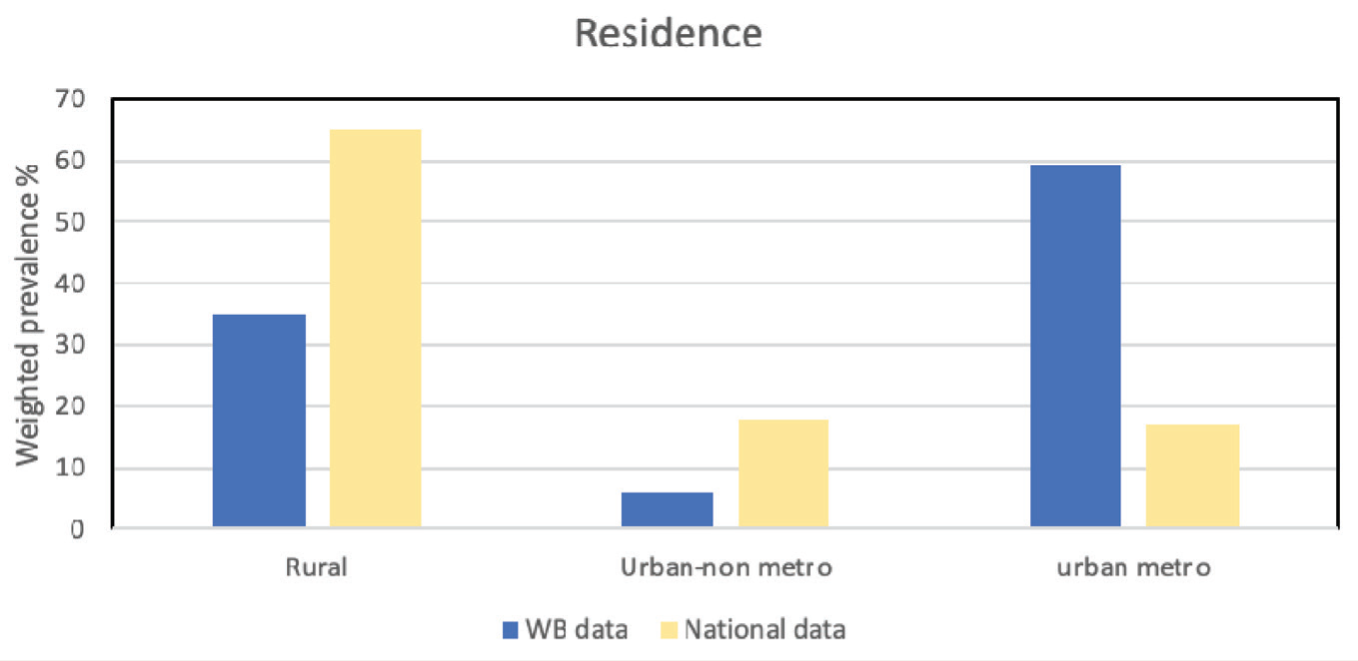
Table 3 shows the socio-demographic characteristics of TUD in WB and its comparison with the national data. Concerning residence, a higher proportion of TUDs reside in urban metros (54.9%), which is in contrast to the national data (see
Comparison of Socio-demographic Characteristics of WB vs National Data in Respondents with TUD.
Place of Residence-wise Distribution of Prevalence (Weighted Prevalence %) of Alcohol Use Disorders with a Comparison of National Data.
The most common mental disorders among persons with SUDs (including alcohol, opioids, cannabis, and benzodiazepines) were depression (4.5%) and psychosis (4.5%), followed by neurotic and stress-related disorders (3.1%). Among SUDs, around 6.4% had suicidality of varying severity (assessed as per the suicidality module in M.I.N.I).
In the multiple logistic regression analysis, the risk of AUD, TUD, and other SUD was significantly higher among males than females. The risk of AUD was significantly higher among the 30–39-year age group (adjusted OR—2.8) and 50–59-year age group (adjusted OR 4). Other socio-demographic variables such as employment status, marital status, residence, and education did not attain significant risk in any category.
Table 4 shows the disability in respondents with AUD across work, family, and social domains.
Disability in Respondents with AUD.
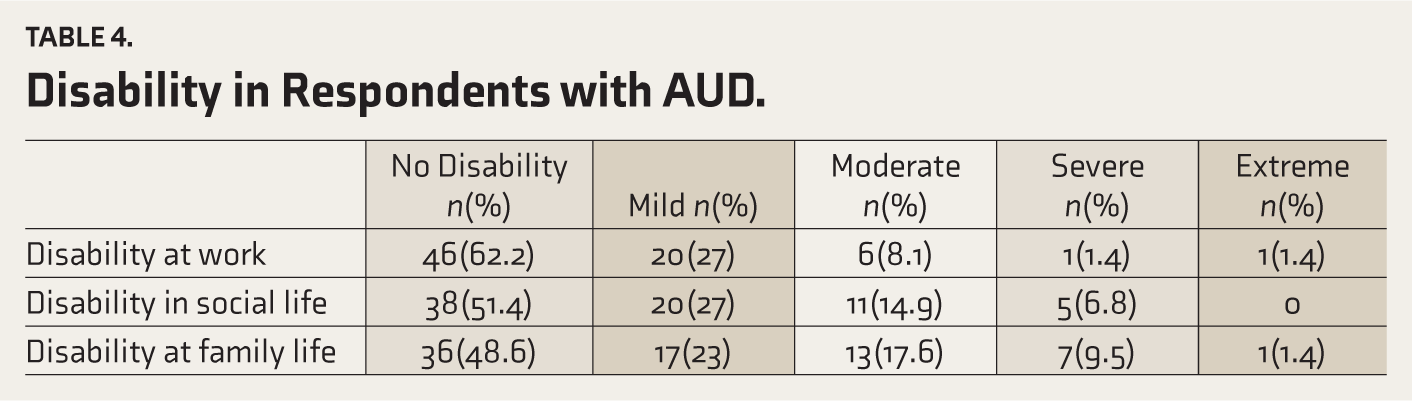
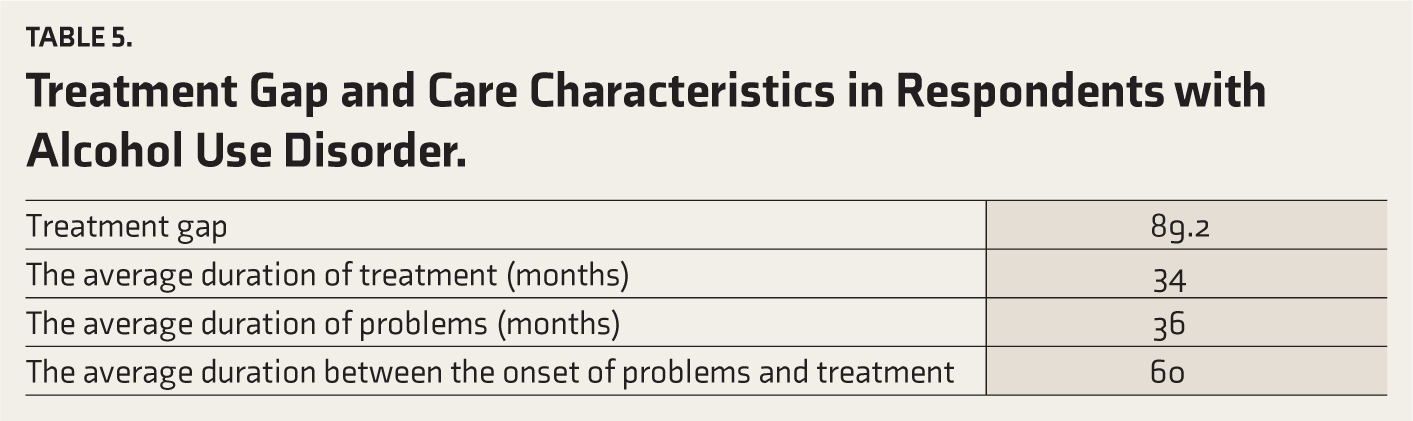
Table 5 shows the treatment gap and care characteristics in respondents with AUD. The treatment gap was found to be 89.2%, slightly higher than the national data (86.8%). The average duration between the onset of problems and seeking treatment was 60 months, which was higher than the national data (11 months).
Treatment Gap and Care Characteristics in Respondents with Alcohol Use Disorder.
Discussion
The NMHS was one of India’s landmark studies in mental health epidemiology, and WB was one of the 12 centers.10,11 The important findings were that the weighted prevalence of SUD in the state of WB in a representative population with validated instruments was 15.71% (15.53–15.89; 95% CI). The weighted prevalence of TUD of 14.34% (14.17–14.52; 95% CI) in WB is less than the national average of 20.9% (20.82–20.96; 95% CI). Prevalence of AUD (dependence and harmful use combined) of 3.04% (2.96–3.13; 95% CI) is less than the national average of 4.65% (4.61–4.69; 95% CI). Moreover, an in-depth analysis of the substance use scenario in WB reveals several important issues.
The above data is considerably different from other national surveys. The recent study “Magnitude of Substance Use in India 2019” puts the prevalence of alcohol use in India at 14.6% (state-level data yet not available till December 2021), problem use at 5.2%, dependence use at 2.7% and the NFHS-5 (2019–2020) reveals that in WB, 18.1% of men (>15 years) and 1.1 % of women (>15 years) consume alcohol.1,9 However, as per NMHS in WB, the prevalence of alcohol use is 3.9%, AUD is 3.04%, dependence is 2.9%, and harmful use is 0.2%. The difference in prevalence among these studies stems from the fact that in NMHS, MINI was used, which considers “use” to be “ In the past 12 months, 3 or more alcoholic drinks within -3 hours, on 3 or more occasions, while in the recent national survey of substance use, “Alcohol Smoking and Substance Involvement Screening Test (ASSIST) was used which carries the option of “ever life-time use” irrespective of the quantity. 1 Hence, it is obvious that the NMHS prevalence of alcohol use will be similar to AUD or problem users of the national survey rather than “use.” Corroborating this observation, the national substance use survey found that 5.7% are “problem alcohol users, “ similar to the NMHS prevalence of 4.65% at the national level.
In WB, the GATS prevalence of current tobacco users is 33.5%, whereas in the state NFHS prevalence is 48.1% among men (>15 years) and 10.8% among women (15 years), and this is much higher than the NMHS prevalence of TUD of 14.34%. Again, the difference is due to differential methodology––GATS and NFHS considered “current tobacco users,” whereas NMHS considered TUD as per FTND with a different scoring pattern leading to low, moderate, and significant dependence. An important finding was the gender distribution of AUD in West Bengal—the female-to-male ratio is 1:5. This is much higher than the national figure—the male-to-female ratio of 18:1. Among the states, only Madhya Pradesh has a higher gender ratio for women. This is a worrying trend in narrowing the gender gap, warned by preliminary studies.15,17
Also, in West Bengal, the distribution of AUD and TUD is higher in the urban metros than in rural or urban non-metros, in contrast to the national trend revealed by the NMHS and GATS-2 survey. The distribution trends of AUD may have policy implications for the excise department in WB, which has recently introduced several reforms to provide transparency in distribution and supply and exercises control over quality by selling liquor to licensed retail vendors who sell it to designated retail outlets.16,18 For controlling TUD, the state needs to focus on a balanced approach––a combination of supply reduction and demand reduction by implementing various provisions of the Cigarettes and Other Tobacco Products Act (COTPA Act 2003), introducing tobacco cessation clinics and developing web-based treatment interventions which may have a wider reach. 19
NMHS is the only study at the national level where psychiatric co-morbidities have been assessed. Neither the first national survey related to substance use by Ray 8 nor the recent one by Ambekar et al. assessed the co-morbidities. 1 In terms of comorbid disorders, it has been observed that depression and AUD co-morbidity was 17.6% (unweighted prevalence) at the national level. For WB, the co-morbidity of SUD and psychiatric disorders was 12.1%.20,21,22
The limitation of this study was the methodology used, that is, multistage random sampling, which is not properly used to report substance use. This may lead to difference in prevalence rates in various epidemiological studies.
One of the most important findings of the analysis of substance use data of WB-NMHS was that 89.2% have a treatment gap in WB for AUD, while the national average is 86.3%. (Three) 3 % of the population of WB having AUD translates to a population of 27.38 lakhs in WB considering total population of WB 9.1 crore as per census of India, 2011, require interventions. This emphasizes the need to strengthen the District Mental Health Program (DMHP) Drug-De-Addiction Program (DDAP), and IRCAs (Integrated Rehabilitation Centres for Addicts) and other facilities for addiction treatment in the state of WB. 23 ,26
Conclusion
Hence, it can be concluded that tobacco and alcohol are the predominant substances in WB, though other substances, including illicit drugs, are also available. The male-to-female ratio among AUD is 5:1, in contrast to the national average of 18:1. Though the burden is high––the treatment gap is more than the national average. Also, the distribution of TUD and AUD is higher in urban areas than in rural areas. This important information provides directions for further treatment planning and research.
Footnotes
Acknowledgements
NMHS collaborators group include Pathak K, Singh LK, Mehta RY, Ram D, Shibukumar TM, Kokane A, Lenin Singh RK, Chavan BS, Sharma P, Ramasubramanian C, Dalal PK, Saha PK, Deuri SP, Giri AK, Kavishvar AB, Sinha VK, Thavody J, Chatterji R, Akoijam BS, Das S, Kashyap A, Ragavan VS, Singh SK, Misra R and investigators as listed in the report: “National Mental Health Survey of India, 2015–2016: Prevalence, Patterns and Outcomes” available at
Declaration of Conflicting Interests
The authors declared no potential conflicts of interest with respect to the research, authorship and/or publication of this article.
Declaration Regarding the Use of Generative AI
None used.
Funding
The authors disclosed receipt of the following financial support for the research, authorship, and/or publication of this article: The data used for analysis in this publication is from the National Mental Health Survey (NMHS) funded by the Ministry of Health and Family Welfare, Government of India and was implemented and co-ordinated by National Institute of Mental Health and Neurosciences (NIMHANS), Bengaluru, INDIA in collaboration with state partners. NMHS phase 1 (2015–2016) was undertaken in 12 states of India across the 6 regions and interviewed 39,532 individuals (