
Abstract
Background:
Earlier research on internet addiction (IA) in the adult population in India has concentrated on isolated prevalence surveys conducted nationwide. A systematic grasp of pooled prevalence necessitates a meta-level evaluation of all prior literature. This study aims to investigate the prevalence of IA and its correlates among adults in India.
Methods:
We searched EBSCOhost, PubMed, PsycInfo, PsycArticles, and ProQuest for the studies published from 1990 to 2022 and included studies using Young’s Internet Addiction Test criteria (age range 18–40 years). The authors obtained a total of 358 non-duplicate records after a thorough search, and they found 10 pertinent epidemiological studies involving 12,286 adults.
Results:
The pooled prevalence for mild, moderate, severe, and any level of IA was 36.33% (95% confidence interval [CI]: 30.72%–42.13%), 18.04% (95% CI: 13.49%–23.08%), 0.88% (95% CI:0.50%–1.36%), and 58.34% (95% CI:49.34%–67.07%), respectively. The review of correlates suggested psychosocial factors like male gender, single-parent families, co-morbidities like depression, stress, anxiety, interpersonal issues, andmediating factors like loneliness.
Conclusions:
Based on the synthesis of findings, this review underlines the common factors of IA and emphasizes the significance of psycho-social factors in IA; thus, to promote healthy use of technology and to manage IA, a multi-modal psychotherapeutic intervention module for mental health practitioners needs to be developed in line with this review.
Keywords
Worldwide internet use has drastically increased in the last 2 decades. 2 Internet use has been described to be on a spectrum starting from use, problematic or excessive use, and addiction. 3 While research has shown that the boundaries between these categories are not always clear, these terms have been used synonymously to characterize the phenomenon of internet addiction (IA).
The ICD 11 4 and DSM-5 5 have included “Internet Gaming Disorder (IGD)” as a “disorder due to addictive behaviors” and “diagnosis wanting more research,” 6 respectively. Even though many studies7–9 have tried to include the gaming criterion for IA, some studies have claimed that IA is different from IGD.3,10,11 IA is defined as “Excessive or uncontrolled preoccupations, urges, or behaviours regarding the use of computers and the internet which can result in impairment or distress.” 12 The Young’s Internet Addiction Test (YIAT), which has been translated and adapted into several languages, is a valid, and credible tool to assess IA. The YIAT has also shown good psychometric properties in the Indian population. 13 The construct of IA has many overlapping concepts 14 (like social media addiction, mobile phone addiction, or technology addiction) and there is a difficulty in the demarcation of the factor of Internet addiction 3 (excessive or problematic internet use) which might lead to confusion in the diagnosis, so for the sake of continuity the authors have decided to include studies that have used YIAT as an assessment tool for the diagnosis of IA.
Prevalence Studies for IA
Research published in January 2021 estimated that 4.66 billion people, or 59.5% of the world’s population, regularly use the internet. 15 These figures are consistent with studies indicating exponential online user growth over the last few decades. The worldwide pooled prevalence of IA in 2014 was 6%. 16 A meta-analysis 17 published in 2019 revealed an increasing trend for IA, comparing 101 studies with 204,352 total participants from 34 countries and regions, and also revealed that Asia has the most significant effect size (g = 0.21), followed by Europe, Africa, and North America. Furthermore, a meta-analysis of 133 epidemiological studies revealed that the weighted average pooled prevalence rates for IGD and generalized IA were 2.47% and 7.02%, respectively. 14 According to a meta-analysis of seven Southeast Asian countries, 7 the pooled prevalence rates for IA and gaming disorders were 20% and 10.1%, respectively. This reveals that the global prevalence rate has risen in the last decade, that IA is more prevalent than IGD, and that the prevalence is highest in Asia compared to the United States and European countries. Similarly, Asia showed the greatest gender disparities and mood disorders related to internet use. 17 The authors did remark, however, that the research included in these meta-analyses was primarily from East Asian nations such as the Republic of Korea, China, Taiwan, and Japan. 18 One study 19 reported prevalence of severe addiction ranged from 0% to 47.4% in college-going students in the Southeast Asian region, which indicates a higher prevalence for IA in students but the authors have reported these results could not be verified quantitatively due to heterogeneity of assessments and differing cut-offs for IA. Hence, it is necessary to include studies that have used the same assessment criteria for better quantitative results.
India is one of the countries with the most online users worldwide. As previously reported IA is positively associated with mood disorders in international studies, and it would be interesting to study the manifestation of IA in a collectivist culture like India. As other Asian studies reported there is a high chance that there would be a higher prevalence of IA in India. There have been studies that have reported prevalence in the Indian context previously.19–21 Therefore, there is a need to systematically explore the extent of IA in the population and identify associated factors. IA can manifest differently in India compared to other regions due to diverse cultural, social, and economic factors. One meta-analysis has been done on estimating prevalence among college students, 22 but no studies have, however, attempted to understand the general prevalence of IA among adults in India. Adults constitute 60.7% of the total population 23 with an estimated 1.2 billion users of the Internet in India 24 indicating a high possibility of IA amongst this population. Additionally, adults use the Internet for work and recreational purposes hence research has shown that their pattern of usage is different as compared to the college-going population. 25 Thus, in addition to the already established prevalence of college students, research into the overall prevalence rate and correlates of IA is necessary to provide a thorough understanding of the phenomenon in a diverse sociocultural milieu that is context-specific to India.
Methods
We formulated the research question using the Patient/Population, Intervention, Comparison, and Outcomes guidelines.
26
The study was carried out according to the Preferred Reporting Items for Systematic Reviews and Meta-analyses (PRISMA) guidelines:
27
The following are the research questions:
What is the prevalence rate of IA amongst adults in India using the
1
criterion? What are the correlates of IA among adults in India?
Inclusion Criteria
Studies considered in this review were: (a) peer-reviewed original articles; (b) examined prevalence rates of IA; (c) conducted using a sample from India; (d) conducted on adults from age 18–40 years; (e) papers published in the English language; (f) studies that have adopted a formal definition of IA based on the YIAT 1 and assessment criteria. The total scores of IA are in the range of 0.30 which indicates a normal level of internet usage; 31–49 indicated a mild level, 50–70 showed moderate and 80–100 showed a severe level of IA. 28
Exclusion Criteria
Studies not included in this review: (a) Only abstracts, short communications, case studies, chapters written in books, commentaries, papers presented at conferences, validation studies, and pilot studies, (b) studies where correlates were not assessed or reported even if the prevalence was reported (co-relates were defined as psychosocial factors like mood, anxiety, loneliness, interpersonal relationships, etc.), and (c) conducted on special populations (severe mental health disorders, autism, ADHD or neurological conditions).
Search Strategies
Literature searches were conducted in EBSCO-host, PubMed, PsycInfo, PsycArticles, and ProQuest for the studies published from the 1990s to 2022 as after the initial review the authors found more relevant studies after the 1990s. The keywords included in this study were “internet addiction,” “problematic internet use” “Internet” “problematic” “pathological” “excessive” “dependence” “addictive behaviour” “prevalence” “epidemiological” “correlates” “psycho-social factors” “co-morbidities” “determinants” AND “India” AND “Adults”. Using advanced search options in databases, a combination of main keywords, Medical Subject Headings (MeSH terms), truncations, and Boolean operators were used to write the search terms.
Selection of Studies
The results of this review were reported using the PRISMA guidelines, checklist, and flow chart. Search results from the electronic database were integrated into citation management software using search terms. Duplicate articles were removed using Rayyan software, and those that were rejected were given an explanation. 29 If full-length articles were not available, the authors were contacted. The title of the article and abstracts for the initial screening were reviewed by independent coders (AT and MKS). Next, the full-text articles were reviewed and thoroughly checked by at least two independent coders (AT, MKS, SA, and GD). The discrepancies were resolved by reading the text and via discussion to reach a common consensus between all the authors (AT, MKS, SA, and GD).
Data Extraction andPreparation
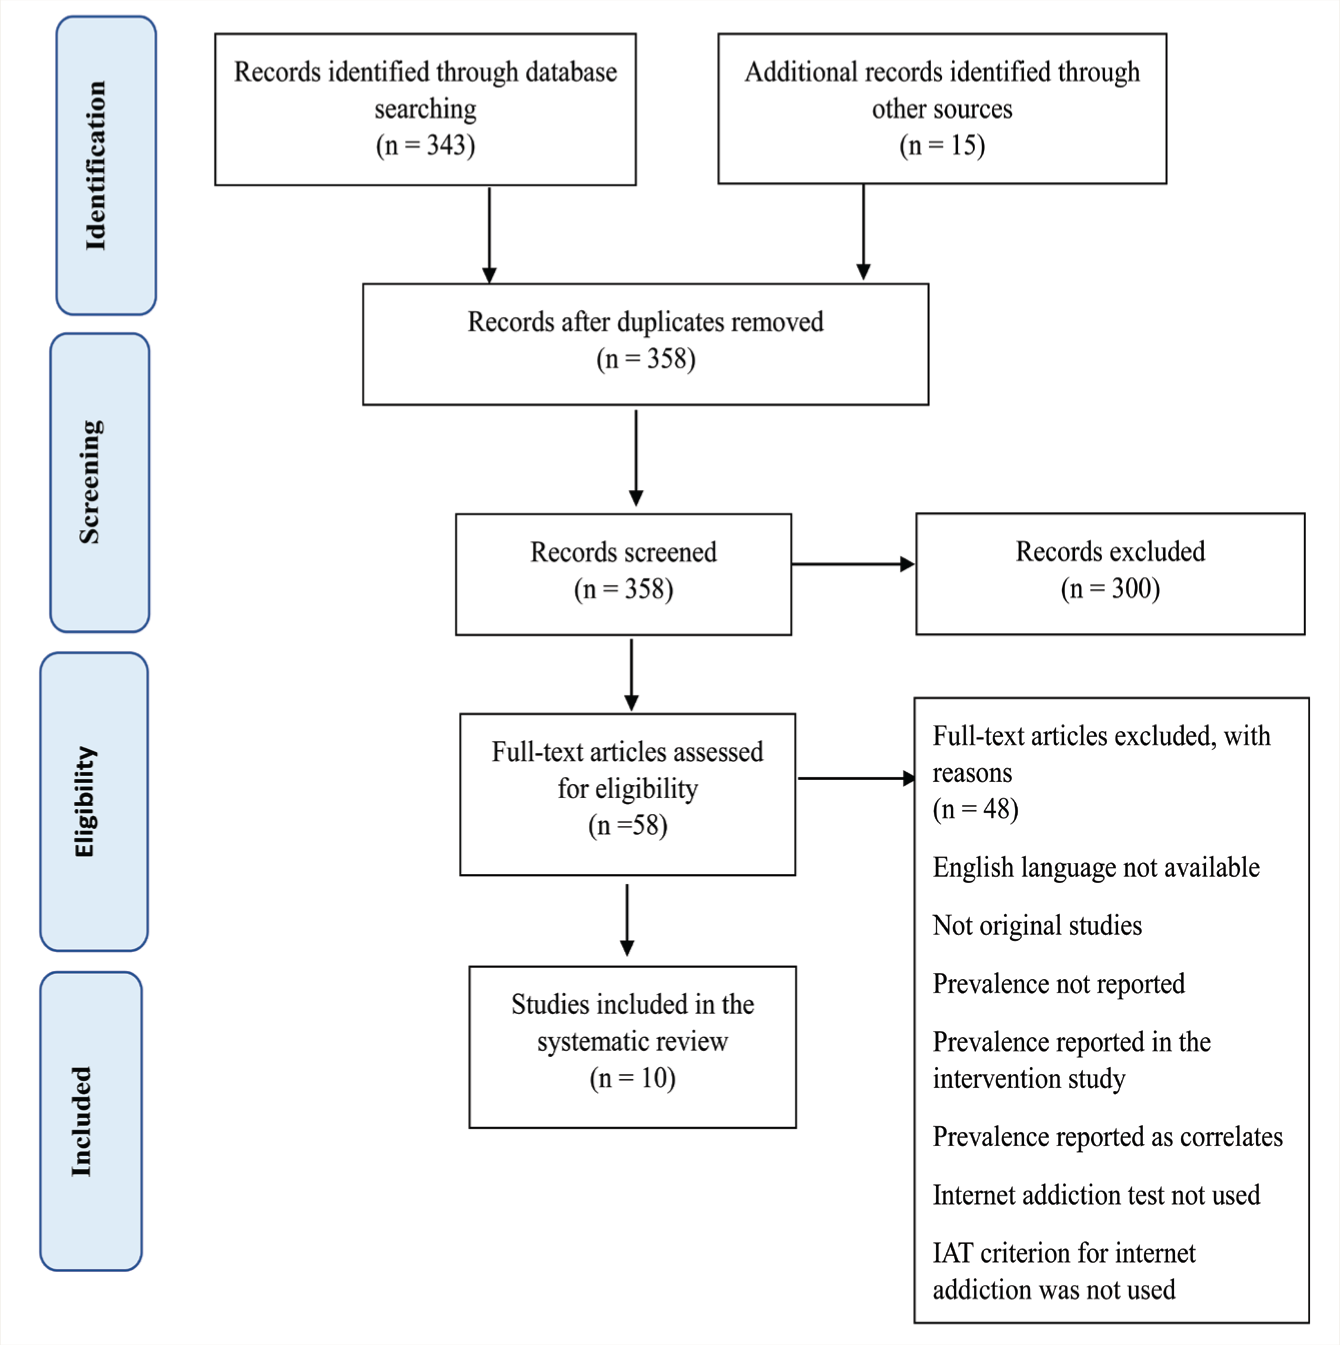
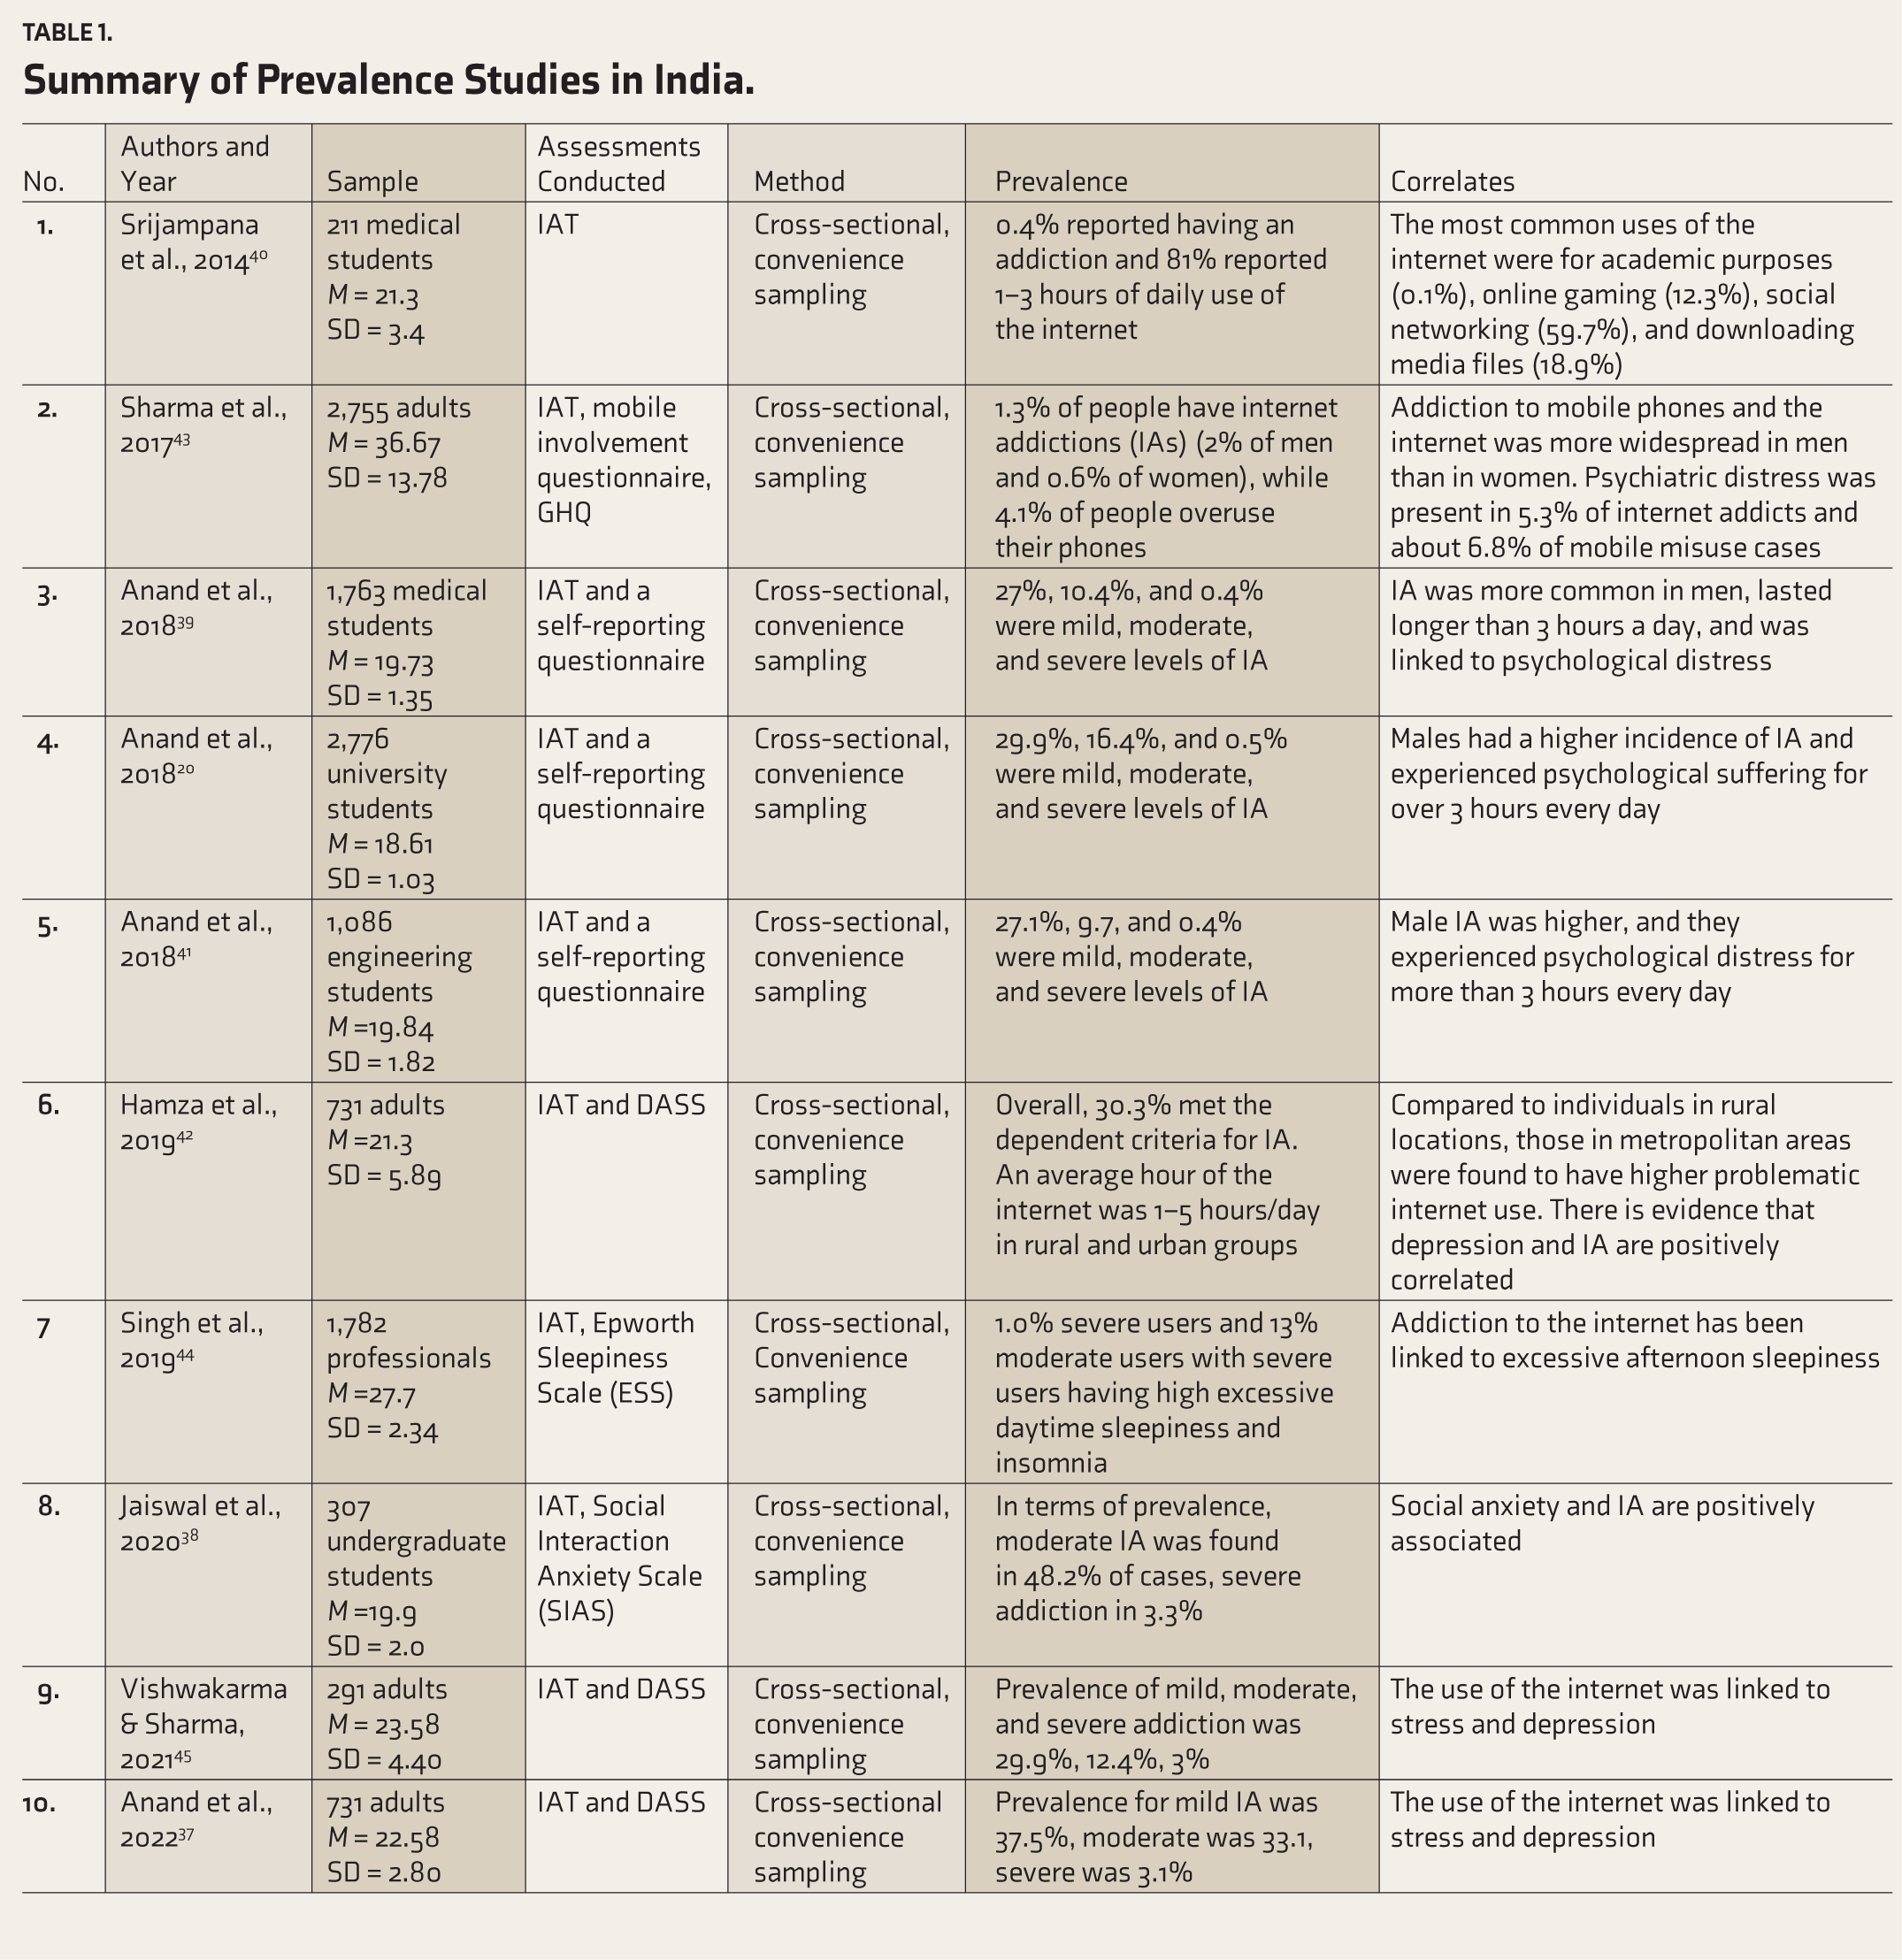
The PRISMA Flow diagram (Figure 1) was used in the selection of reviewed articles. After all pertinent papers were reviewed, information was obtained using criteria such as the author, year of publication, journal, type of study, technology used, and outcomes. After AT and MKS finished extracting the data, SA and GD reviewed the studies to ensure they followed the inclusion and exclusion criteria. After reading through each paper, AT and MKS organized all the study details according to the aforementioned criteria, and discrepancies were resolved after careful evaluation and discussion between all authors. Through this process, the methodology utilized in the studies which were highlighted in Table 1, contributed to enhanced understanding, and increased external validity of studies. The quality of the studies chosen for the evaluation was the primary focus of the authors, who also placed special attention on the sample size, the use of reliable data collection instruments, and accurate statistical reporting.
The PRISMA Flowchart Illustrating the Selection of Review Articles.
Summary of Prevalence Studies in India.
Analysis
A meta-analysis was performed utilizing Stata 16’s “Metaprop” tool. 30 Effect size of interest was the proportion of individuals with mild, moderate, severe, and any level of IA determined by IAT. The variances were stabilized by Freeman–Tukey double arcsine transformation and exact confidence intervals (CIs) were calculated. 30 We employed the DerSimonian–Laird random effects model for meta-analyses, taking into account potential heterogeneity, and presented pooled prevalence with 95% CIs. Heterogeneity was reported using I 2 statistic and an I 2 value >50% indicated a high heterogeneity. 31 Egger’s regression tests and a funnel plot were used to assess publication bias. The statistical significance was set at p value <.05. Meta-regression was not considered as there are fewer than 10 studies in the meta-analysis. 31 Sensitivity analyses were performed by discarding studies with smaller sample sizes (size < 500).
Quality and Risk of Bias Assessment
For prevalence studies, 32 the Joanna Briggs Institute (JBI) checklist was used to assess the bias risk and study quality, as further elucidated in Table 2. The nine-item checklist includes aspects of sample size, sampling frame, sampling and method of data collection tools for assessment, etc. A color coding in green, red, yellow, and blue was carried out to indicate aspects that were yes, no, unclear, and not applicable, respectively. Two reviewers rated the quality assessment on the scale and the final consensus was taken after consensus between all reviewers. The JBI is known to be widely used for quality assessment in systematic reviews and meta-analysis, 33 but there is no uniform scaling measurement given to rate the quality of each study. For this study, after rating 1 for yes it was divided into low = 0–4; moderate = 5–7; high = 8–9 based on previous studies.34,35 The GRADE framework, which stands for Grades of Recommendation, Assessment, Development, and Evaluation, was utilized to evaluate the quality of evidence for the correlates which is given in Table 3. 36 The recommendations are classified as strong, moderate, or various based on the strength of the supporting evidence and the balance of desired and unfavorable effects. Strong evidence was evaluated when more than four studies reported the same outcome, moderate when three studies reported similar outcomes, and diverse/conflicting when one or more studies reported differing outcomes.
Shows the JBI Checklist for Prevalence Studies for Mythological Quality and Risk of Bias Assessment.
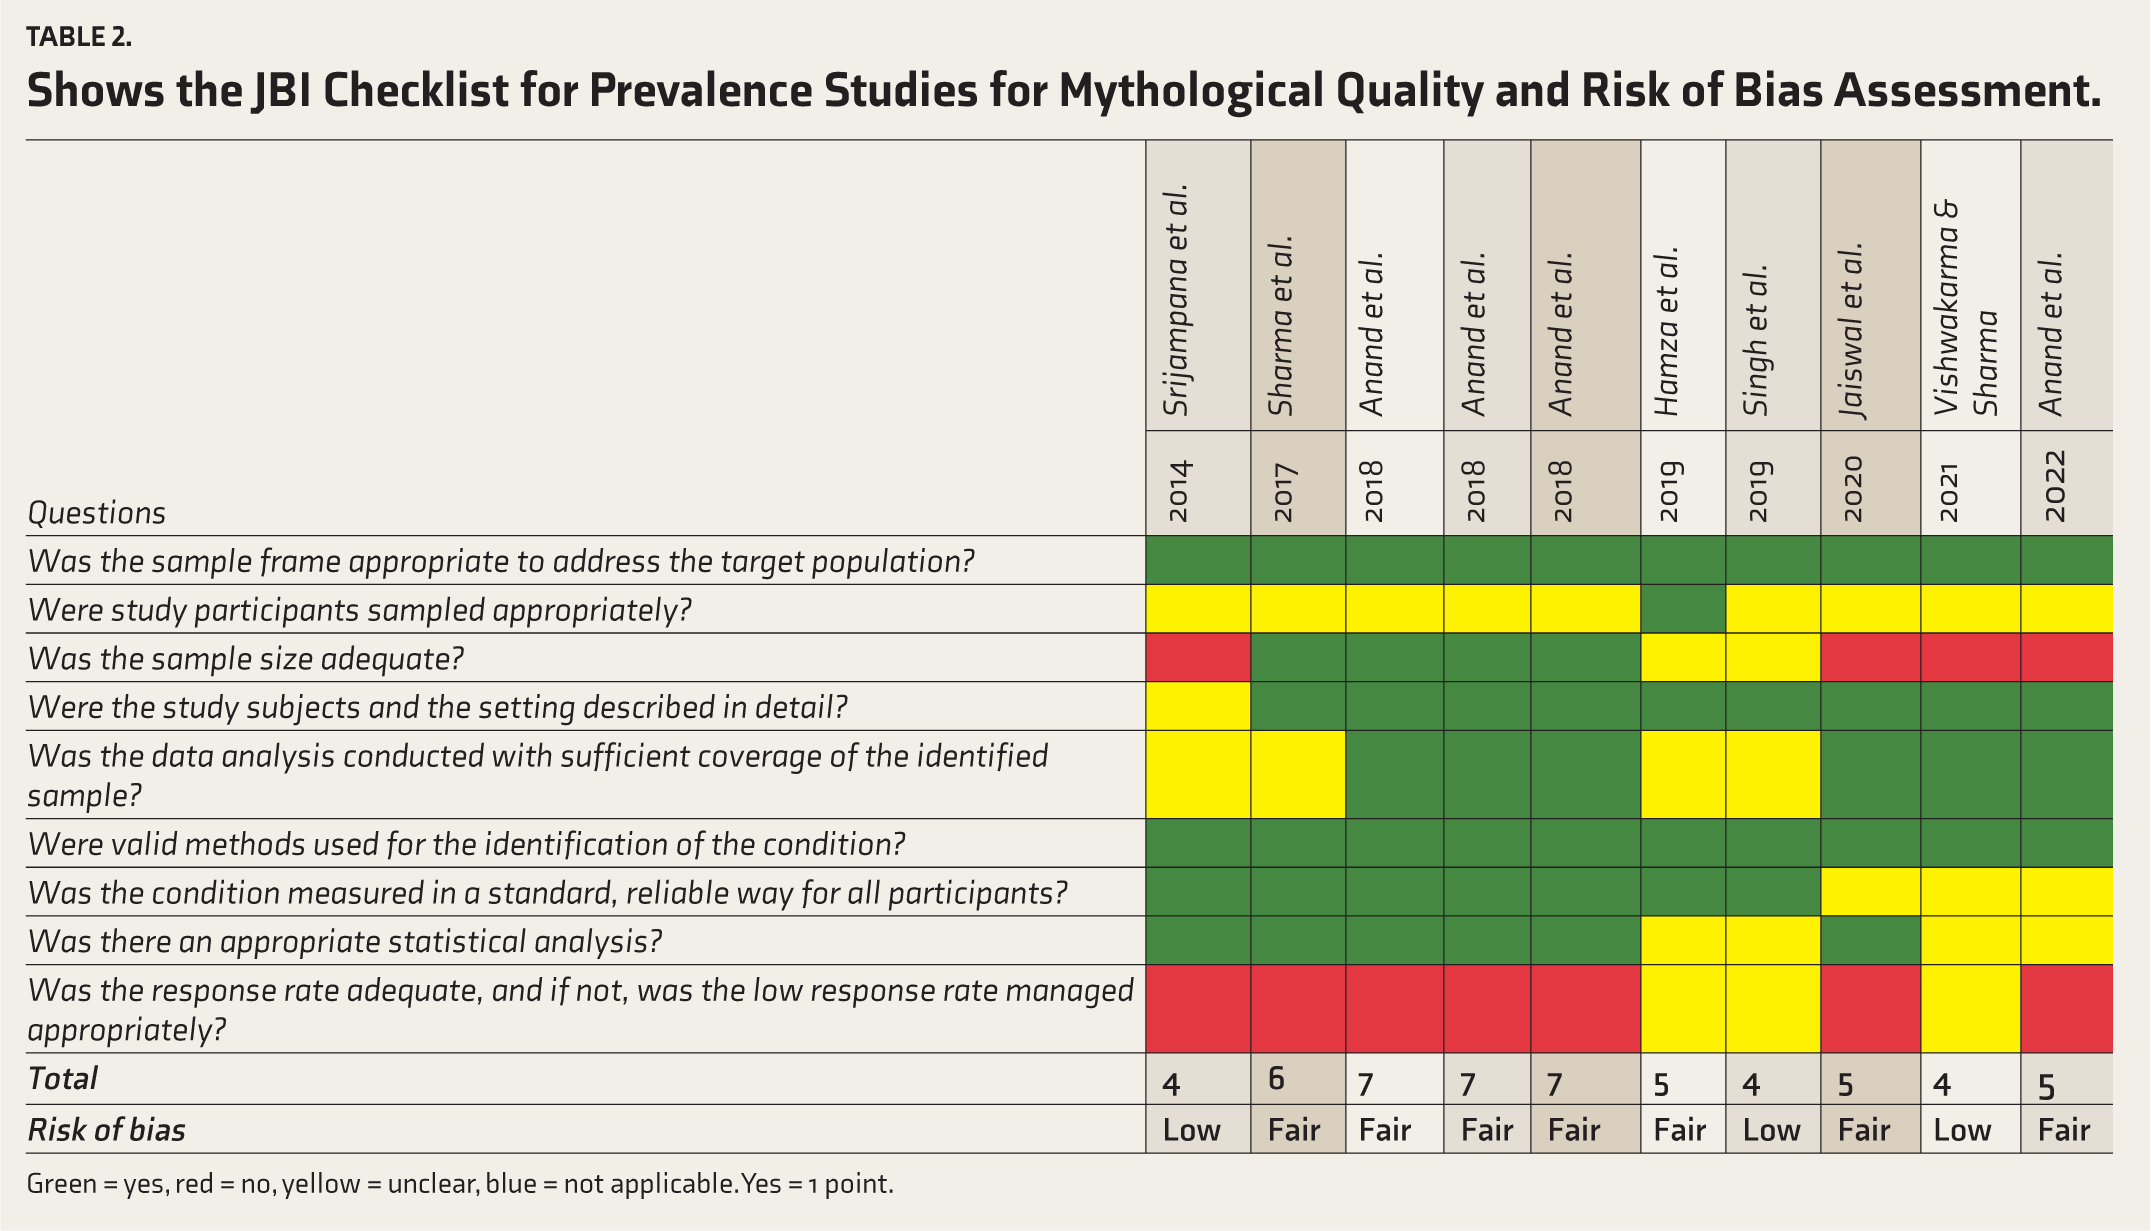
Green = yes, red = no, yellow = unclear, blue = not applicable. Yes = 1 point.
Table Shows the Strength of Evidence Rated for the Correlates of IA.
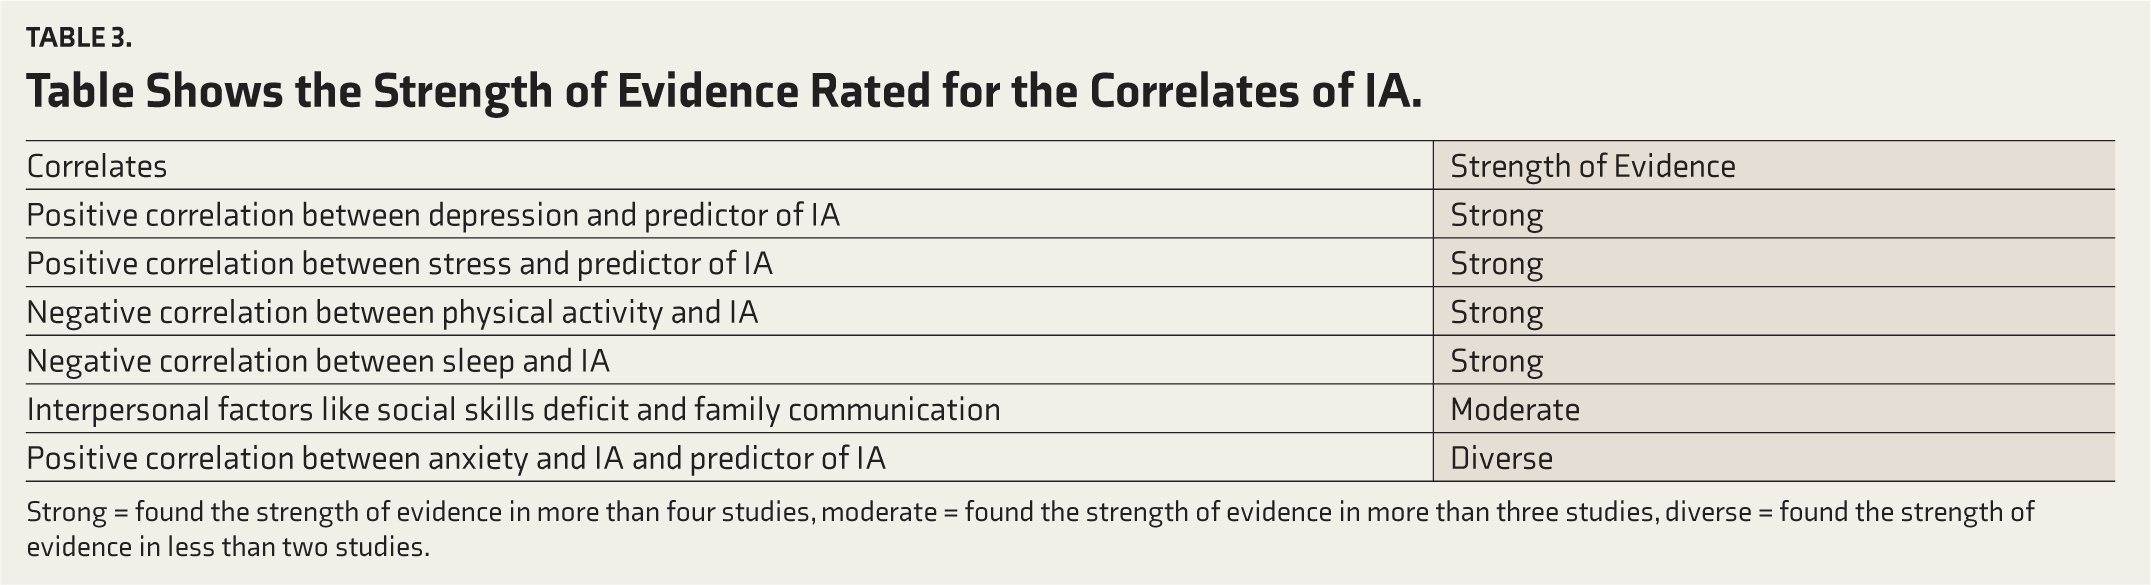
Strong = found the strength of evidence in more than four studies, moderate = found the strength of evidence in more than three studies, diverse = found the strength of evidence in less than two studies.
Results
The keywords were typed into the databases using advanced search methods. After removing the duplicates, 350 studies were identified for initial screening. After screening the abstracts, 300 researchers were discarded because they did not meet the inclusion and exclusion criteria. After careful consideration of 58 studies and going through each study in detail and consensus between the authors; a total of 10 studies were selected for the study. According to the JBI criteria for prevalence studies, of the 10 papers that were included in this review, three were graded as low quality and seven as fair in terms of methodological quality and bias risk. Based on the risk of bias evaluation, no study was eliminated from this analysis. The GRADE approach showed a strong association between psychological issues (depression, anxiety, stress), moderate association between interpersonal relationships, and diverse predictors of IA.
Meta-analysis of the Studies
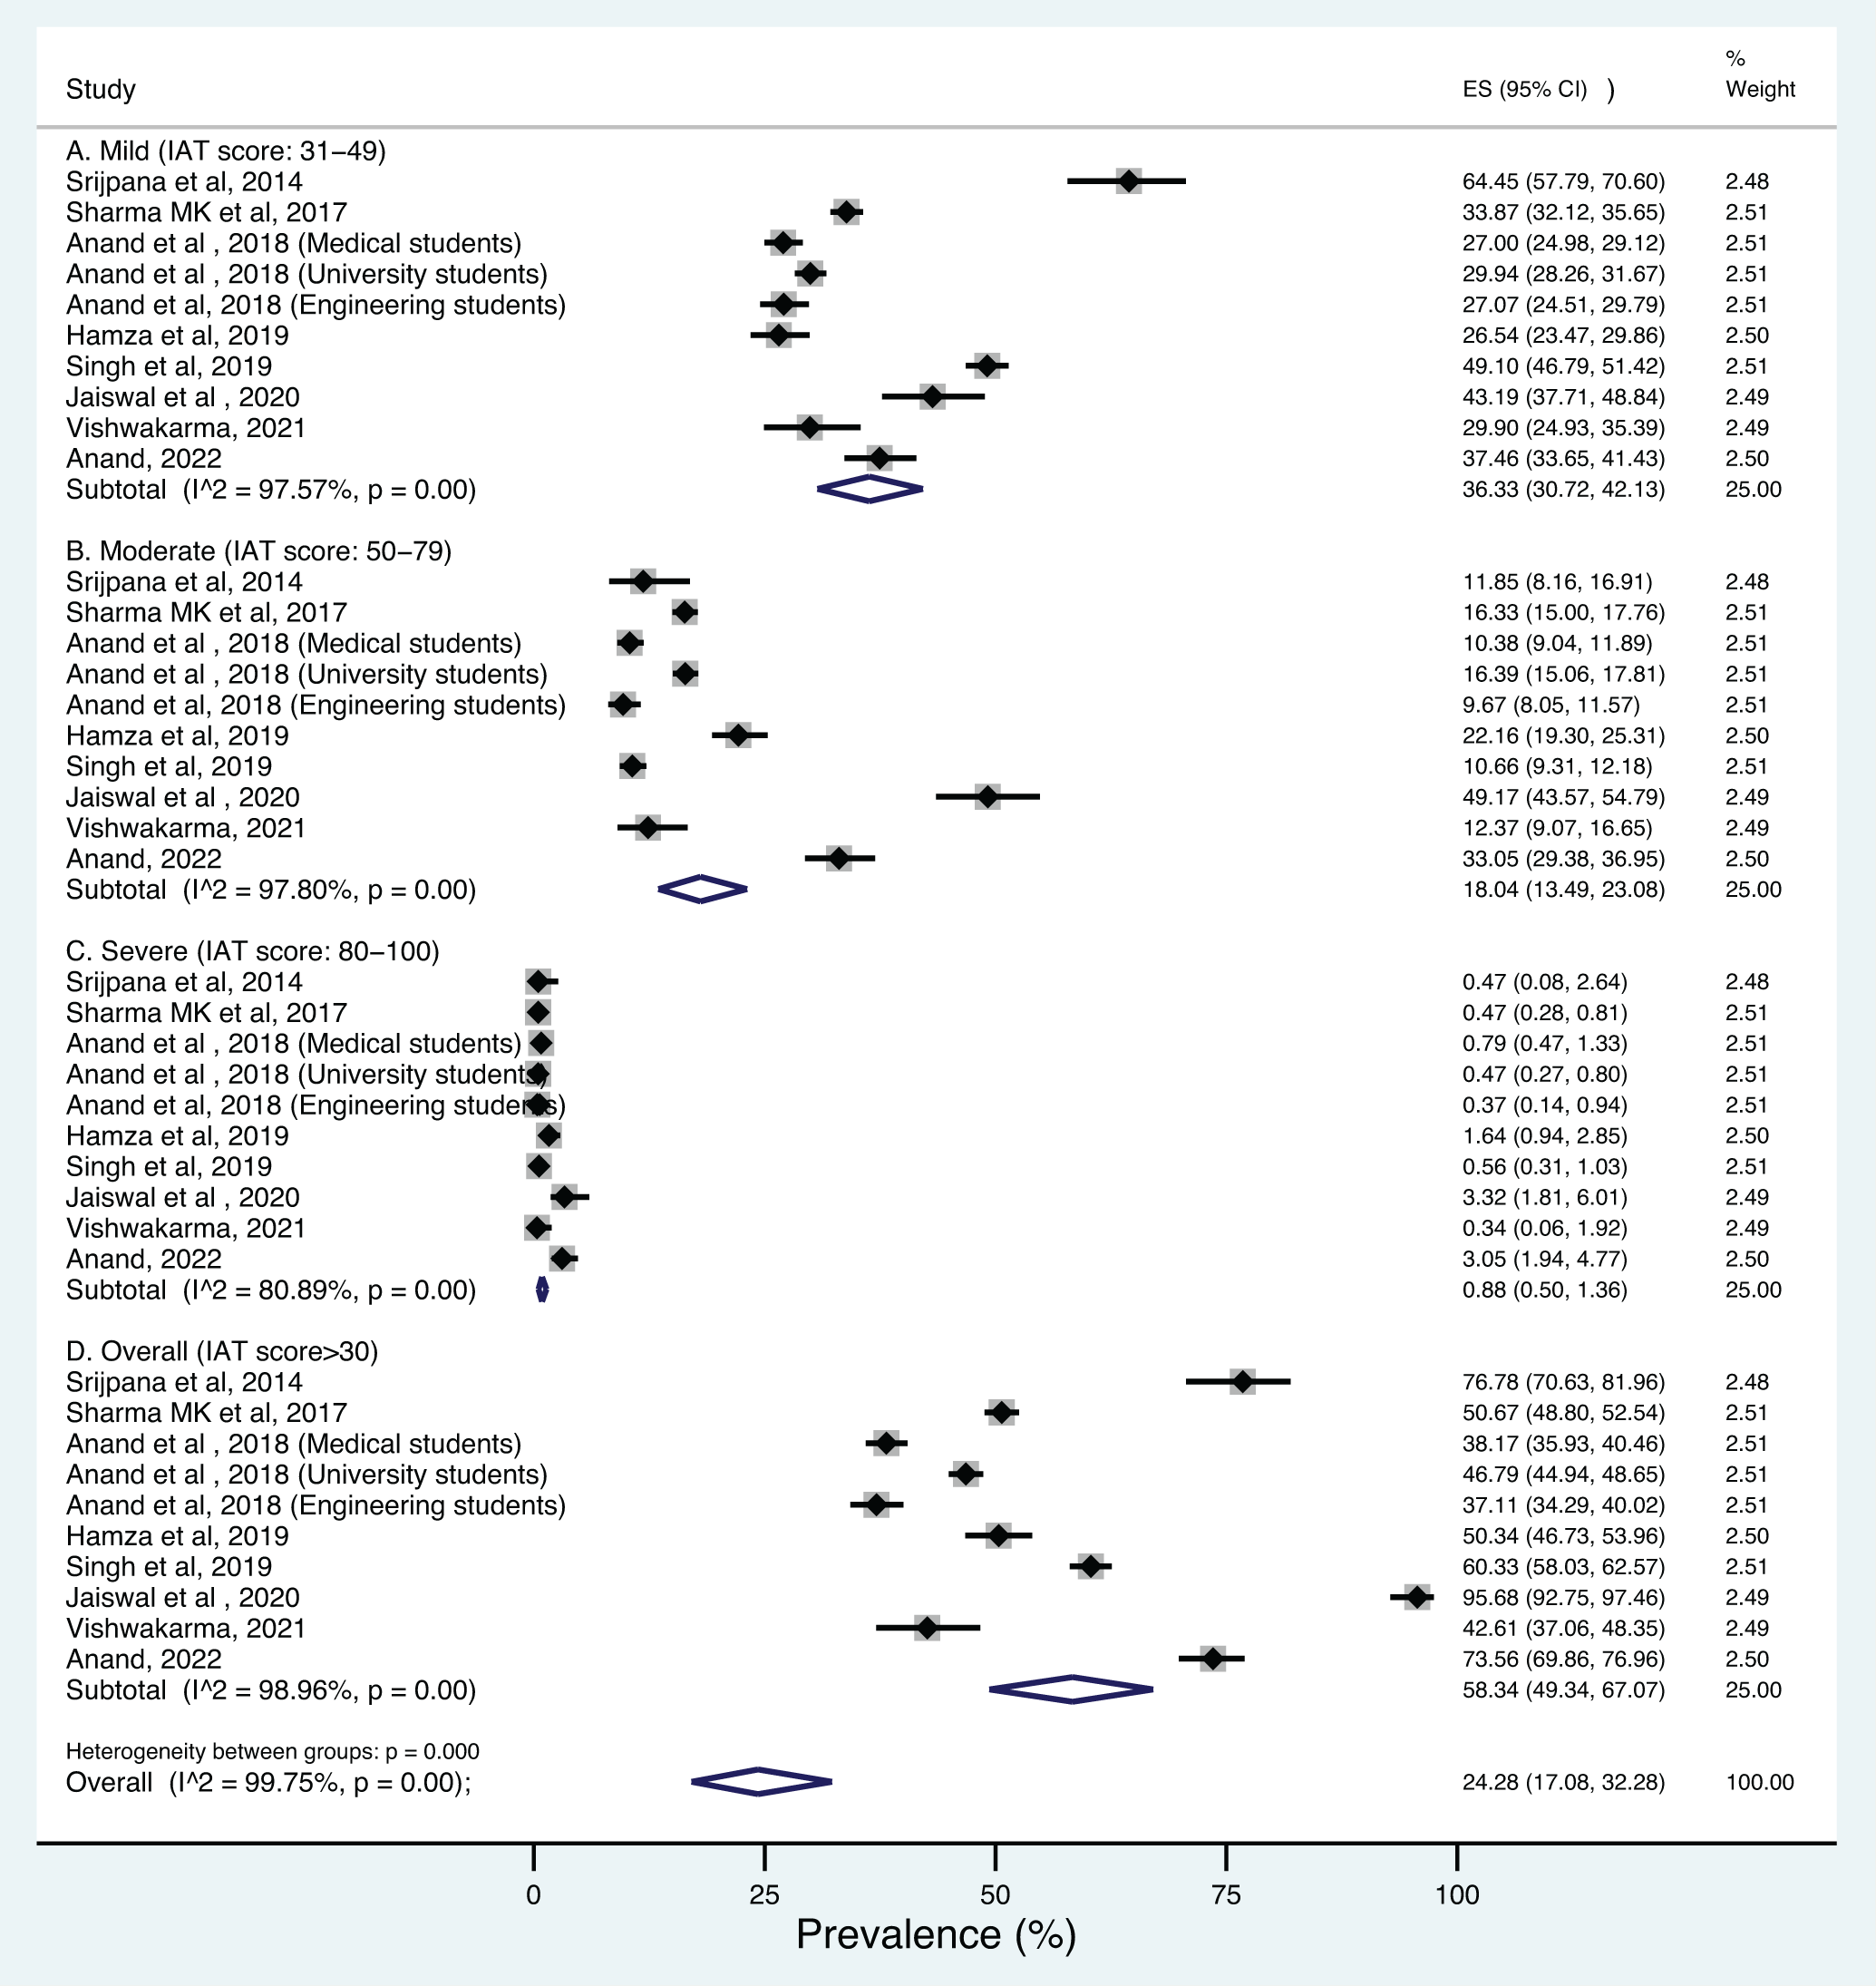
Meta-analysis of 10 eligible studies yielded a summary prevalence of 36.33% (95% CI: 30.72%–42.13%), 18.04% (95% CI: 13.49%–23.08%), 0.88% (95% CI:0.50%–1.36%), and 58.34% (95% CI:49.34%–67.07%) for mild, moderate, severe and any level of IA determined by IAT, respectively. Studies showed marked heterogeneity, with I 2 values ranging from 80.89% to 98.96%. After sensitivity analysis eliminated studies with small sample numbers, the prevalence of mild, moderate, severe, and any level of IA declined to 32.83% (from 36.33%), 16.23% (from 18.04%), 0.83% (from 0.88%), and 51.03% (from 58.34%). The heterogeneity measures did not differ much from the main analyses, except for severe addiction, where there was an increase in heterogeneity (from 80.89% to 82.36%). The forest plot is given in Figure 2. The funnel plot was less asymmetric and Egger’s regression tests suggested no evidence of substantial publication bias for the prevalence of severe addiction (B = 0.36, SE = 0.81, p = .65) but with only 10 studies the power of the test may be poor to detect real asymmetry. For mild, moderate, and any level of IA, the funnel plot was more asymmetric and Egger’s regression tests suggested some evidence of small-study effects and publication bias.
Forest Plot Showing Internet Addiction Prevalence in India According to the Mild, Moderate, Severe, and Overall Usage.
Study Characteristics
The studies were mostly focused on the student population; three studies focused on students (university graduates or post-graduates)20,37,38; two studies on medical students39,40; one study on engineering students 41 and four studies on adults and professionals.42–45 The mean age range was from 18 to 40 years, with no gender differences between the age ranges of the samples. The sample size ranged from 104 to 2,800 students or professionals. The correlates were assessed using different tests, like the General Health Questionnaire 46 and the Patient Health Questionnaire, 47 to assess overall health, Beck Depression Inventory 48 ; Beck Anxiety Inventory, 49 and Epworth Sleepiness Scale 50 to assess day time sleepiness. The research design used was a cross-sectional survey method design with online or offline surveys conducted with one study using a multi-cluster sampling technique and simple random sampling technique.
Indian Prevalence Studies
A study of 40 medical students showed 64.4% of respondents identified as average users, 11.8% as potential addicts, and 0.4% as addicts with a high mean usage duration. A series of studies,37,39,41 found that among medical students, the prevalence of mild, moderate, and severe IA was 27%, 10.4%, and 0.4%, respectively. Among university students, there were mild, moderate, and severe levels of IA at 29.9%, 16.4%, and 0.5%, respectively, and 27.1%, 9.7%, and 0.4% were mild, moderate, and severe levels of IA in engineering students with high correlation between problematic internet use, disturbed sleep, and depression. On the other hand, studies conducted44,45 to assess the level of technology usage in adults found that participants spent 2 hours per day for nonessential use (pornography, gaming, gambling) and 1½ hours on mixed-use (including activities such as shopping, chatting, and social networking). This goes with recent research indicating that the incidence of IA has increased in the past few years. 51
Socio-demographic Factors
A study found 43 that technology addictions are more common among single-parent families and less common in nuclear and joint families. A different study 42 examined the differences in use patterns between rural and urban locations and discovered no statistically significant differences in either group’s hours of usage or gender distribution. This means internet penetration has reached the most secluded places in the country and the varied geographical picture of India does not affect usage. Male gender has proved to be the biggest predictor of IA, with additional moderating variables of unemployment, single child, low socio-economic status, unmarried, and younger age. 52 This connects with research about gender differences and having difficulty with self-identity and self-acceptance. 53 Studies conducted in India for gender differences suggested that 60% of males reported playing online video games, 15% watching pornography, 10% online gambling, and 10%–15% net surfing and binge-watching.39,43 This could be because males reported a higher need for aggression, power, and dominance and females reported a higher need for recognition, love, and acceptance. 54
Correlates of IA
Studies were rated according to the grade approach for strong, moderate, and diverse evidence. Research has looked at relationships between IA and psychological health, and interpersonal problems.55,56 Research has revealed that there are intermediate correlations between IA and interpersonal problems (such as poor social skills and low-income family communication) and substantial correlations between IA and psychological issues (such as depression, anxiety, stress, and sleep disruptions).37,43 There were diverse outcomes for the predictors of IA wherein depression and stress strongly predicted IA but there were diverse reports about anxiety being the predictor of IA. A total of three studies reported a positive correlation between IA and anxiety however, studies also reported that anxiety is not a strong predicting variable for IA.37,45. Studies have found that although depression and stress are positively correlated with IA, the mediating factor across studies between IA and psychological issues was loneliness. Additionally, loneliness has a more robust and extensive effect on IA than vice versa in urban as well as rural populations.37,38,42,45
Along with mood changes studies have also found that there is an association between physical activity, daytime sleepiness, sedentary lifestyle, and IA. Lifestyle changes can have an effect as most people work either in front of the computers or spend leisure time on the internet. In a study on adults, 44 researchers tried to understand the association between physical activity, daytime sleepiness, sedentary lifestyle, and IA. They discovered that individuals who did not engage in regular physical exercise had higher total scores and frequencies of IA than those who did and that these individuals also experienced higher levels of daytime sleepiness. Personal attributes are important factors for predisposition but some researchers have highlighted social factors and mainly poor interpersonal relationships due to a lack of communication between family members, less offline leisure time spent, and a lack of clear rules and boundaries with people and IA. 57 Studies have shown a positive correlation between anxiety especially social anxiety and IA which is higher in males as compared to females, however, some studies reported that anxiety does not predict IA. 45
Discussion
Cross-cultural studies on IA conducted in continuous time periods and in many nations have demonstrated that the disorder’s overall incidence is rising and that it has to be treated differently from other substance-related disorders with psycho-social implications. 14 In this study, the researchers have summarized the prevalence of IA and its correlates in India. After rigorous screening, the researchers found the pooled prevalence of mild, moderate, severe, and any IA to be 36.33% (95% CI: 30.72%–42.13%), 18.04% (95% CI: 13.49%–23.08%), 0.88% (95% CI:0.50%–1.36%), and 58.34% (95% CI:49.34%–67.07%), respectively. This is in line with the recent international meta-analysis on South Asian countries, which found similar results for severe internet usage in the range of 0.60%–1.96%.58–60 The overall prevalence of 58.34% is higher as compared to the USA and European countries. 59 Additionally, studies have suggested multiple cut-off points like >2 hours or >4 hours or daily time duration or weekly or monthly duration.39,41 However, most studies in this review have a common consensus that more than 2 hours or equal usage of non-interrupted essential or nonessential use can be considered as a cut-off for excessive technology usage. 45 Some international authors have argued that the duration of technology should not be taken as an indicator of addiction exclusively, as technology is a necessary commodity that requires the use of technology sometime during the day for work or recreational purposes.8,61 Indian researchers are focused on a wholesome approach to diagnosing IA, wherein, along with duration and intensity they have also looked at associated psychosocial factors. Some studies have focused on individual psychological variables like mood (depression, stress, anxiety).37,38,44,45,62 This is in line with previous literature on IA. Indian studies have also concluded that internet penetration and the manifestation of IA are similar in rural and urban areas, given the diverse geography of India which is a novel finding as compared to other countries. Some studies have focused on deficits in social skills and reduced family communication.21,38 The Indian collectivist culture aspect wherein changing family system, values, and communication seems to be mediating technology use. 57 Social anxiety is positively correlated but anxiety was not found to be predicting IA. 38 This somewhat contradicts international literature. 55 One reason could be because anxiety has different kinds of coping mechanisms and technology could probably not be one of them. The above-reported findings have to be taken with some limitations as the authors found three studies with low and seven studies with fair quality assessment and risk of bias. This could be because of inconsistent findings in the area of technology addiction research. A meta-synthesis of 63 quantitative research conducted from 1996 to 2006 indicated that studies conducted on IA used inconsistent criteria for defining the term with a wide range of assessments and different cut-off scores, so the reliability and generalizability of the studies were doubtful. Similar reviews have criticized studies for sampling errors, inconsistent methodologies, and lack of consistent knowledge.3,12,64
The Common Factor Model of Technology Use
India is a collectivist culture with the main emphasis on interpersonal relations, and due to changing times, the internet entered our lives and alerted our ways of living. The researchers have tried to postulate and present a theoretical model shown in Figure 3 with the integration of the internet in collectivist Indian culture through certain common factors. The main aim for postulating a common factor model was the ease of access available for the internet and how that has changed overall interactions in our lives.
Common Factors Affecting Internet Addiction.
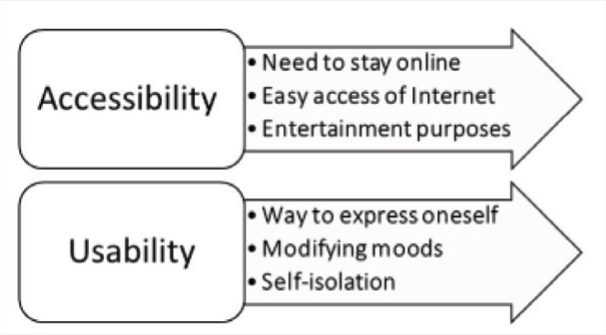
A study 65 indicated that some common factors can help explain why many people choose to spend more time online. First is the desire for a user to stay online for school or work-related purposes. Second, an increasing number of individuals are able to access the Internet whenever and wherever they want thanks to its accessibility from locations including homes, workplaces, and schools as well as public spaces like Internet cafés, coffee shops, and libraries. Because of this simplicity, a lot more individuals will use the internet and could unintentionally develop an addiction. In the Indian context, studies are postulating that there is a perceived shift to an individualist culture with more emphasis on isolated activities with easy access to the internet. The findings can be divided into accessibility; ease of availability, convenience entertainment, and usability. There is a tremendous incentive for users to stay connected online for extended lengths of time, and one of the key reasons is for entertainment, particularly when people have free time. Some people could use the internet as a means of self-expression and to manage mood changes. Nonetheless, some use the internet as a means of self-isolation or as a means of avoiding face-to-face interactions with others.62,66,67 Since social withdrawal is not accepted in Indian culture it could lead to criticism and shame in the social context thereby increasing isolation and technology use.
Limitations
This is one-of-a-kind research that summarizes the prevalence rates of Indian adults from 10 studies. Following the PRISMA guidelines, the authors tried to review and summarize significant amounts of data. This study will shed light on the worrying problem of IA in India, as well as provide recommendations for mental health specialists in diagnosing and treating it. However, the majority of the studies in this study exhibit a low to moderate risk of bias, reducing external validity. Most of the studies have used cross-sectional surveys with purposive sampling and mostly focused on the student population with gender disparity on YIAT hence the results could have shown higher prevalence rates. So, a more consistent and robust assessment of YIAT with common cut-offs should be used in future studies. Although the study’s scope was restricted to additional analysis may have been undertaken to assess the effect sizes of age, gender, depression, loneliness, and anxiety on the pooled prevalence of IA. Furthermore, the study could have included the quantitative analysis of the GRADE approach for further strengthening the confidence in reporting correlates of the study. Although the study did not include Google Scholar (which is primarily a search engine) due to its limitations in structured scientific literature retrieval, 68 this review was made more systematic and comprehensive by using robust academic databases like EBSCO-host, PubMed, PsycInfo, PsycArticles, and ProQuest. Additionally, the study did not include some databases that have Indian journals which could have narrowed down the research.
Implications
This study has significant implications for mental health professionals treating and assessing IA. For future research increased sample size, multi-stage sampling methods, and reliable, valid, and multilingual assessments across all age groups should be prioritized. Tools should also cover different types as well as levels of IA and be adapted in multiple languages so that there will be consistency in the assessment across populations.
Conclusion
The prevalence of IA amongst adults in India was reported to be 58.34% out of which 0.88% was found to have severe addiction. This indicates a higher prevalence of IA in India, where the prevalence of substance use disorder is also reported to be high compared to the Western countries. 69 Cross-cultural research suggests that there is a higher prevalence of IA in Asia because of collectivist social demands and overall criticism of time spent in isolated activities like internet use. However, it was discovered that the pattern of internet usage was more than 2 hours per day and more than 14 hours per week, divided between necessary and non-essential use which is corroborated by studies conducted in other countries. 56 This could be because of ease of accessibility, rapid technological advancement, and higher internet penetration across rural and urban areas in India. Additionally, Indian studies have found strong evidence of a positive correlation between depression, stress, and anxiety; and a negative correlation between sleep and physical activity. Furthermore, Indian studies differ in the aspect of interpersonal relationships and social withdrawal which are the indicators of IA as compared to Western countries.18,70 Indian studies also differ on ways of coping as anxiety was not seen as a predictor of IA. Furthermore, cultural expectations within families may impact the balance between online and offline activities and influence the idea of internet use being problematic. Hence, cultural sensitivity and awareness of local dynamics are crucial when assessing and interpreting patterns of IA using tools like Young’s IAT. Researchers and practitioners should take into account the unique sociocultural context of India to develop effective interventions and support systems.
Footnotes
Declaration of Conflicting Interests
The authors declared no potential conflicts of interest with respect to the research, authorship, and/or publication of this article.
Declaration Regarding the Use of Generative AI
None used.
Funding
The authors received no financial support for the research, authorship, and/or publication of this article.