
Abstract
Background:
Schemas help with the organization and interpretation of information. Adaptive schemas indicate positive predisposing thinking patterns in an individual. This study aimed to develop a psychometrically robust tool to assess adaptive schema in a nonclinical sample.
Method:
This research comprises two independent studies. Study I was multiphased. In Phase I (n = 70), 36 open-ended items were generated following the Young schema therapy model and qualitatively analyzed. This facilitated the generation of 144 items in Phase II (n = 152) which were evaluated for content validity and subjected to rigorous item analysis. Exploratory factor analysis was performed in Phase III (n = 751). Confirmatory factor analysis was conducted in Study II (n = 244).
Results:
Exploratory factor analysis resulted in a six-factor solution comprising 25 items. These factors correspond to the six adaptive themes, namely, adequate, secured, self-reliant/autonomous, resistant, successful, and self-assured. The newly developed Adaptive Schema Questionnaire demonstrated adequate reliability (α = 0.86). Significant correlations between the obtained factors and Early Maladaptive Schemas, depression, big five personality factors, and positive and negative effects established the concurrent validity. Confirmatory factor analysis indicated acceptable goodness of fit for the obtained model.
Conclusion:
The developed Adaptive Schema Questionnaire is a reliable and valid instrument with promising utility in psychotherapy and research context.
ASQ is a reliable and valid instrument that assesses positive schema to facilitate a balanced approach in psychotherapy.Key Message:
Schemas aid in the organization and interpretation of information. 1 Schemas are dimensional. Adaptive (or positive) or maladaptive (or negative) schema in an individual can predict the direction of thoughts and consequent behavior (functional or dysfunctional). Thus, they can contribute to an individual’s resilience, 2 or conversely, to the development of mental illness. 3 Schemas lie dormant until activated by experiences congruent with that schematic belief.3, 4
The maladaptive nature of the schemata may become apparent in the future as they continue to persist and influence information processing regardless of inaccuracies in perceptions, thus misconstruing the events in an individual’s life. 5 Young’s schema therapy model identified 18 Early Maladaptive Schemas (EMS) corresponding to core unmet needs in an individual. 5 For example, the Failure Schema comprises all memories consistent with experiences of failure. 5 Young’s Schema Questionnaire (YSQ 6 ) assessing the 18 EMS is validated across various cultures.7–11 The validity of EMS as a relatively stable trait (personality) has been established.12–14 Their impact on mental illnesses such as depression4, 15–19 and their relationship with affect (positive and negative) have also been studied.6, 20, 21
In contrast to the EMS, adaptive schema (or positive schema 22 or Early Adaptive Schema 4 ) forms after a psychosocial stage is positively resolved by gratifying an individual’s growing basic psychological or emotional needs.22, 23 Hence, positive schemas constitute the beliefs, memories, and sensations in cognizance of an individual’s experiences with others. 22 A handful of measures such as the Automatic Thoughts Questionnaire, 24 the children-focused Positive Schema Questionnaire, 25 and a qualitative study on successful entrepreneurs 26 have tried to assess positive thinking. A recent study established the cross-cultural validity of the Young Positive Schema Questionnaire 4 (YPSQ), which was validated in German culture. 2
In the field of clinical psychology, over the years, the focus has predominantly been on studying the maladaptive dimension of schema. In contrast, there is a dearth of literature on how, beyond just the presence of negative cognitions, the positive characteristics of behavior play a significant role in the genesis of psychopathology. 27 Thus, in the therapeutic context, the emphasis should be extended to enhancing the positive dispositions and not be restricted to the “reduction” of negative qualities alone. Even with the advent of positive psychological factors like grit and resilience that have been thoroughly studied, the concept of adaptive schema remains under-explored. The “modifiable” nature of schema can have far-fetched consequences.28–31 Particularly, once systematically identified and assessed, specific interventions can be directed to enhance adaptive schemas contributing to wellbeing. This study aimed to develop a psychometrically robust tool to assess adaptive schema.
Methods
We conducted two independent studies. Study I was multiphased. Each phase had a different objective and an independent sample. First, we generated the item pool (Phase I) followed by establishing the content validity and item analysis (Phase II). Then we established the concurrent validity and conducted exploratory factor analysis (EFA) in Phase III. Study II evaluated the confirmatory factor analysis (CFA) for our obtained model on a new sample.
We utilized convenience sampling using survey methodology. The multiphased Study I was part of the PhD dissertation work of the first author. The data for the three phases of this study were collected between March 2011 and September 2015. The sample was drawn from various states of India. To confirm the model obtained in Study I, we collected data for Study II on a new sample as recommended, 32 between November 2020 and April 2021. Voluntarily consenting adult participants were screened using the General Health Questionnaire (GHQ-12). 33 Participants who reported being free of diagnosed mental and chronic physical health conditions were included. Data were gathered in the English language. The sample size was more than five times the number of items on the longest scale in the study.
The survey procedure in the study was exempted from the Institute Ethics Committee approval under 45 CFR 46.101(b) Categories of Exempt Human Subjects Research. 34 As a precondition for the exemption, the information obtained was recorded and analyzed anonymously and the subjects were not identified directly or through identifiers linked to the subjects. There was no disclosure of the human subjects’ responses outside the research which could reasonably place the subjects at risk of criminal or civil liability or damage the subjects’ financial standing, educational advancement, employability, or reputation. 34 All procedures involving human participants were as per the ethical standards of the Institutional Research Committee and with the 1964 Helsinki Declaration and its later amendments. Written informed consent stating anonymity, confidentiality, and volunteer participation was taken from all participants.
Study I—Development of Adaptive Schema Questionnaire (ASQ)
Phase I—Item Pool Generation
Phase I aimed to gather pertinent information for adaptive schemas following the 18 EMS as described by Young’s schema therapy model. 5 To do this, we generated 36 open-ended items that correspond to the 18 EMS. We utilized the existing literature and clinical experience from the field to generate these items. The interview schedule comprising 36 items was administered to the sample, in addition to the informed consent form and demographic information datasheet, in a single setting. The 36 items formed an open-ended interview schedule to help gather more culturally relevant information, which was qualitatively analyzed. The sample in Phase I comprised of 70 voluntarily consenting undergraduate student participants from Delhi, India (males = 82.9% and females = 17.1%) ranging in age from 18 to 22 years (M = 19.04 years, SD = 0.99). The 36 open-ended items represented themes as per Young’s model, such as “mistrust” and “abandonment.” The designed items appeared like—“How would you describe having someone to guide you in most times of need?,” “How confident do you feel in facing emotional setbacks alone?,” and “What qualities about yourself make you feel proud?” The average time estimated for completing the interview schedule was 20 min to 30 min. Following the thematic analysis approach, data obtained from Phase I were qualitatively analyzed for keywords and phrases indicating meaningful patterns corresponding to each schema. For example, keywords and phrases such as love, care, support, family, friends, and “accepting as I am” were used by respondents in response to items for the secured schema. Keywords/phrases corresponding to each schema that occurred with the highest frequency across all participants and conveyed the relevant information were selected and utilized to develop new items in Phase II of our study.
Phase II—Content Validity and Item Analysis
Phase II had two specific goals—establishing the content validity and conducting a pilot study to analyze the psychometric properties of the generated items. In Phase II, the 18 adaptive schemas corresponding to the 18 EMS were named and operationally defined. This was done using the keywords and phrases gathered from Phase I and item information from YSQ S3 35 and other relevant literature. A total of 144 items that included four mirroring negatively and positively coined items for each of the 18 adaptive schemas were generated to observe the emerging patterns. Items such as “I feel blessed with good friends,” “I feel I do not have dependable friends,” “I am competent,” and “My shortcomings make me feel incompetent” were included. We envisioned that the mirroring in the items would help us understand the various patterns between the items and help our understanding of how the data may correspond to the validity variables. We utilized the feedback from a panel of six experts (SMER; subject matter experts) to establish the suitability and content validity of these items. These experts comprised a psychiatrist (MD), a positive psychologist (PhD), two clinical psychologists (PhD), a psycholinguist (MA), and a psychometrician/personality psychologist (PhD). The experts evaluated the items on a five-point Likert rating scale (0 to 5) from “least relevant” to “most relevant” to assess the items for their clarity, readability level, and appropriateness in representing and measuring the construct. 36 The experts provided their critique on the coined adaptive schema names, their operational definitions, and the corresponding generated items. The experts unanimously gave a rating of 4 (relevant) or 5 (most relevant) to all items. This ensured that all items had an adequate face and content validity and allowed us to retain the 144 items. The overall content validity ratio (CVR) varied from 0.66 to 1.0, as supported by Lawshe. 37
In addition, as part of the pilot study to understand the psychometric properties of the questionnaire, the 144 items revised as per the expert suggestions were administered to 152 participants (males = 69.1% and females = 30.9%) from the Delhi NCR region, between the age range of 18 and 32 years (M = 23.7, SD = 4.3). Our main study was targeted to have more than 900 participants. We estimated the sample size for this pilot work to have at least 10% of the expected participants projected for the main study. The majority of the participants were undergraduate students (62.5%), single (73%) from a perceived middle socioeconomic background (83.6%). Demographic and informed consent sheets and the 144 items (systematically randomized) were administered to the participants. A five-point Likert rating scale was used to gauge the responses from the participants. After that, we performed item analysis on the responses using IBM SPSS Statistics for Windows, version 20.0 (IBM Corp., Armonk, NY, USA). The item analysis was used to calculate the item mean, standard deviation, corrected item-total correlation, skewness, kurtosis, reliability if item deleted, and the alpha reliability of the scale. The statistical analysis helped screen the items and facilitated the retention of statistically suitable items for the next stage. As part of the data analysis, no missing values were found in the participants’ responses. We screened the items for their propensity to produce extreme mean values. Our analysis indicated the mean values of the items to range between 2 and 4.54 (SD ranged from 0.71 to 1.26). The two outlier items with a mean value of >4 were removed from the analysis, and the retained mean ranged from two to four. 38 Further, as part of the analysis, we removed 53 items because the corrected item-total correlation values for these items were <0.20, as the acceptable range is between 0.20 and 0.30.39, 40 Therefore, the overall range of item-total correlation of retained items was 0.20 to 0.55. Ranges of skewness (–2 to 1.09) and kurtosis (–1.17 to 4.5) were within the acceptable range (skewness <2 and kurtosis <7 41 ). The scale showed adequate reliability if the item deleted (Cronbach’s α = 0.89 to 0.90), which was above the recommended cutoff of 0.70. 42 Therefore, no item was deleted based on alpha reliability if item deleted. At this stage, the items constituted a mixture of positively and negatively coined items, and a total of 89 items were retained based on item analysis.
Phase III—Exploratory Factor Analysis
The goal for Phase III was to evaluate the factor structure and retain statistically robust and theoretically meaningful items for the scale.
Sample
The sample for Phase III constituted 751 participants (males = 48.5% and females = 51.5%) from Delhi, Haryana, and other states, who consented to voluntarily participate and complete the self-reported questionnaires (Table 1, Figure S1). The age range of the participants was 16 to 55 years (M = 20.7, SD = 4.6).
Measures
Based on the statistical analysis in Phase II, the ASQ under development in Phase III included 89 items. It had a mixture of positively and negatively coined items aiming to measure the 18 adaptive schemas. Participants were instructed to respond to statements concerning how they have felt for most of their lives. Responses were scored using a five-point Likert type rating scale that ranged from “strongly disagree” to “strongly agree” In Phase III, we used the following validity measures to establish the newly developed scale’s validity.
Young Schema Questionnaire, Short Form 3 (YSQ S3)
YSQ S3 35 (Schema Therapy Institute, NY, USA) measures the 18 EMS and comprises 90 items. Items are rated on a six-point Likert scale. The higher the score, the greater the presence of the respective EMS in the individual. As part of this study, all schemas had alpha reliability within the range of 0.53 to 0.76. 11
Big Five Inventory (BFI)
BFI 43 is a 44-item scale assessing the big five personality factors. The higher the score on a subscale, the greater the tendency of the respective personality dimension in the concerned individual. In this study, Cronbach’s α for extraversion was α = 0.59, for agreeableness α = 0.54, for consciousness α = 0.65, for neuroticism α = 0.67, and for openness α = 0.57.
Beck Depression Inventory-II (BDI-II)
BDI-II 44 is a 21-item self-report rating scale measuring the severity of depression among adolescents and adults (13–80 years). 44 High scores on this scale indicate a greater endorsement of depressive symptomatology in the individual. In this study, Cronbach’s α for BDI-II was 0.86.
The Scale of Positive and Negative Experience (SPANE)
SPANE 45 is a 12-item scale measuring three subscales. Within the scale, six items measure positive feelings (SPANE-P), and the remaining six items measure negative feelings (SPANE-N). The scale also yields an overall affect balance score (SPANE-B) obtained after subtracting SPANE-N from SPANE-P. Higher the score of a subscale, the greater the presence of respective experience for the individual. In this study, Cronbach’s a for SPANE-N, SPANE-P, and SPANE-B were α = 0.75, α = 0.74, and α = 0.82, respectively.
General Health Questionnaire 12 (GHQ-12)
GHQ 46 is a 12-item scale that measures current mental health. It is widely used in different cultures and settings.33, 47 The scores for GHQ range from 0 to 36 following the Likert scoring method (0–1–2–3). Scores >15 indicate distress, and those >20 indicate severe problems and psychological distress. GHQ-12 46 is a consistent and reliable instrument for the general population. 33 The Cronbach’s a for GHQ-12 in this study was 0.78.
Procedure
In Phase III, participants were given a booklet containing the informed consent form, demographic information sheet, the 89-item questionnaire, and the various validity scales previously described. Participants were recruited from various academic institutions in India using convenience sampling. They were contacted in person and via email with links to Qualtrics forms containing the questionnaire. The average time taken to respond to the booklet was estimated to be 40 min to 50 min.
Study II—Validation of ASQ Using Confirmatory Factor Analysis (CFA)
In Study II, CFA was conducted to evaluate the goodness of fit of the model obtained from EFA in Phase III of Study I.
Sample
The sample for Study II constituted 244 voluntarily consenting participants (males = 51.6% and females = 48.4%). Those aged 16 to 64 years (M = 26.1, SD = 10.4) were included as per the inclusion criteria and for wider applicability. Using convenience sampling, the sample was drawn from Delhi and other states (Table 1, Figure S2).
Procedure
Consenting participants were given the 25-item ASQ to respond on a five-point Likert type scale ranging from “strongly disagree” to “strongly agree.” Data were collected online using the snowball technique with the help of Google forms. No identifying information was collected. Data were screened for missing values, and no missing values were found. The obtained data were subjected to CFA using Linear structural relations software package (LISREL) version 8.8. 48 The ASQ is available as an online-only supplementary file.
Results
Study I
Data were analyzed for item analysis, mean and standard deviation, corrected item-total correlation, reliability if item deleted, skewness, and kurtosis. Cronbach’s a reliability was computed for each item, all factors, and the total scale. EFA was computed to analyze the factor structure for the scale. Concurrent validity of the scale was analyzed by computing correlational analysis between the developed questionnaire and BFI, SPANE, YSQ S3, GHQ-12, and BDI-II. This analysis was performed using the data of 681 out of the 751 participants who completed all validity scales in the study.
For Phase III of our work, <0.1% of the data had missing values that were random in nature. Moreover, a missing rate of ≤5% is considered inconsequential. 49 As a common practice, these missing values were replaced by the neutral score of “3” (i.e., “neither agree nor disagree”). For item analysis, we followed the same norms as used in Phase II. The item means for all items ranged between 2.18 and 4.35. One item with a mean value of 4.35 was removed as part of the screening of extreme mean responses. The means of final retained items ranged between 2.18 and 4.08 (range of SD = 0.72 to 1.29). We retained two items for their theoretical significance, specifically, item no. 24 (M = 4.08) and item no. 83 (M = 4.06) that had means outside the recommended range. Except for these two items, our range of means of final retained items is as per the recommendation of two to four. 38 We discarded 39 items based on their item-total correlation value. The range of corrected item-total correlation of retained items ranged between 0.20 and 0.48 at this stage. The skewness (–1.33 to 0.81) and kurtosis (–1.12 to –2.72) were within a suitable range. Cronbach’s α if item deleted was 0.84 to 0.85. Therefore, no items were deleted based on alpha reliability if item deleted norms.
After the screening, the selected 49 items were used for EFA. Data were subjected to EFA with a principal component with varimax rotation and Kaiser normalization. The eigenvalues were set to be >1, and the factor loading cutoff was set as 0.40. We chose this method because skewness and kurtosis for our data showed adequate normality patterns.50, 51 From the analysis, the Kaiser normalization value (KMO-MSA) was 0.91 (χ2 = 4315.57, df = 300, P < 0.001); which exceeded the recommended cut-off value of 0.60. 52 The KMO-MSA is a measure of sampling adequacy that indicates that patterns of correlations are comparatively compressed, and hence factor analysis would yield distinctive and reliable factors.52, 53 Because the KMO-MSA for our data exceeded the recommended cutoff, the data were found suitable for factor analysis. A 13-factor solution with eigenvalues >1 was extracted, but the data did not rotate. Several factor solutions were reviewed with 12 to 7 factors solutions. For some of these factor solutions, the data did not rotate, whereas for others, the factor loadings were scattered over several factors, with the bulk loading on factor 1. Moreover, there were redundant items that did not load on any factor, and on some factors only one or two items loaded. Because retaining factors that have little theoretical basis can lead to inaccurate interpretation and may not yield replicable results,32, 54, 55 24 redundant items with no clear interpretation were systematically removed. We also observed that the negatively coined items were scattered but the positively coined items clustered together meaningfully. Thereafter, analysis of the remaining 25 items with eigenvalues >1 suggested that the extraction of six factors was most suitable, with each factor having ≥3 items (Table 2). The decision of going for a factor solution with a minimum of three items loading per factor is supported by several studies.32, 54, 56
Sociodemographic Characteristics of the Participants in EFA Study I Phase III (n = 751) and CFA (n = 242)
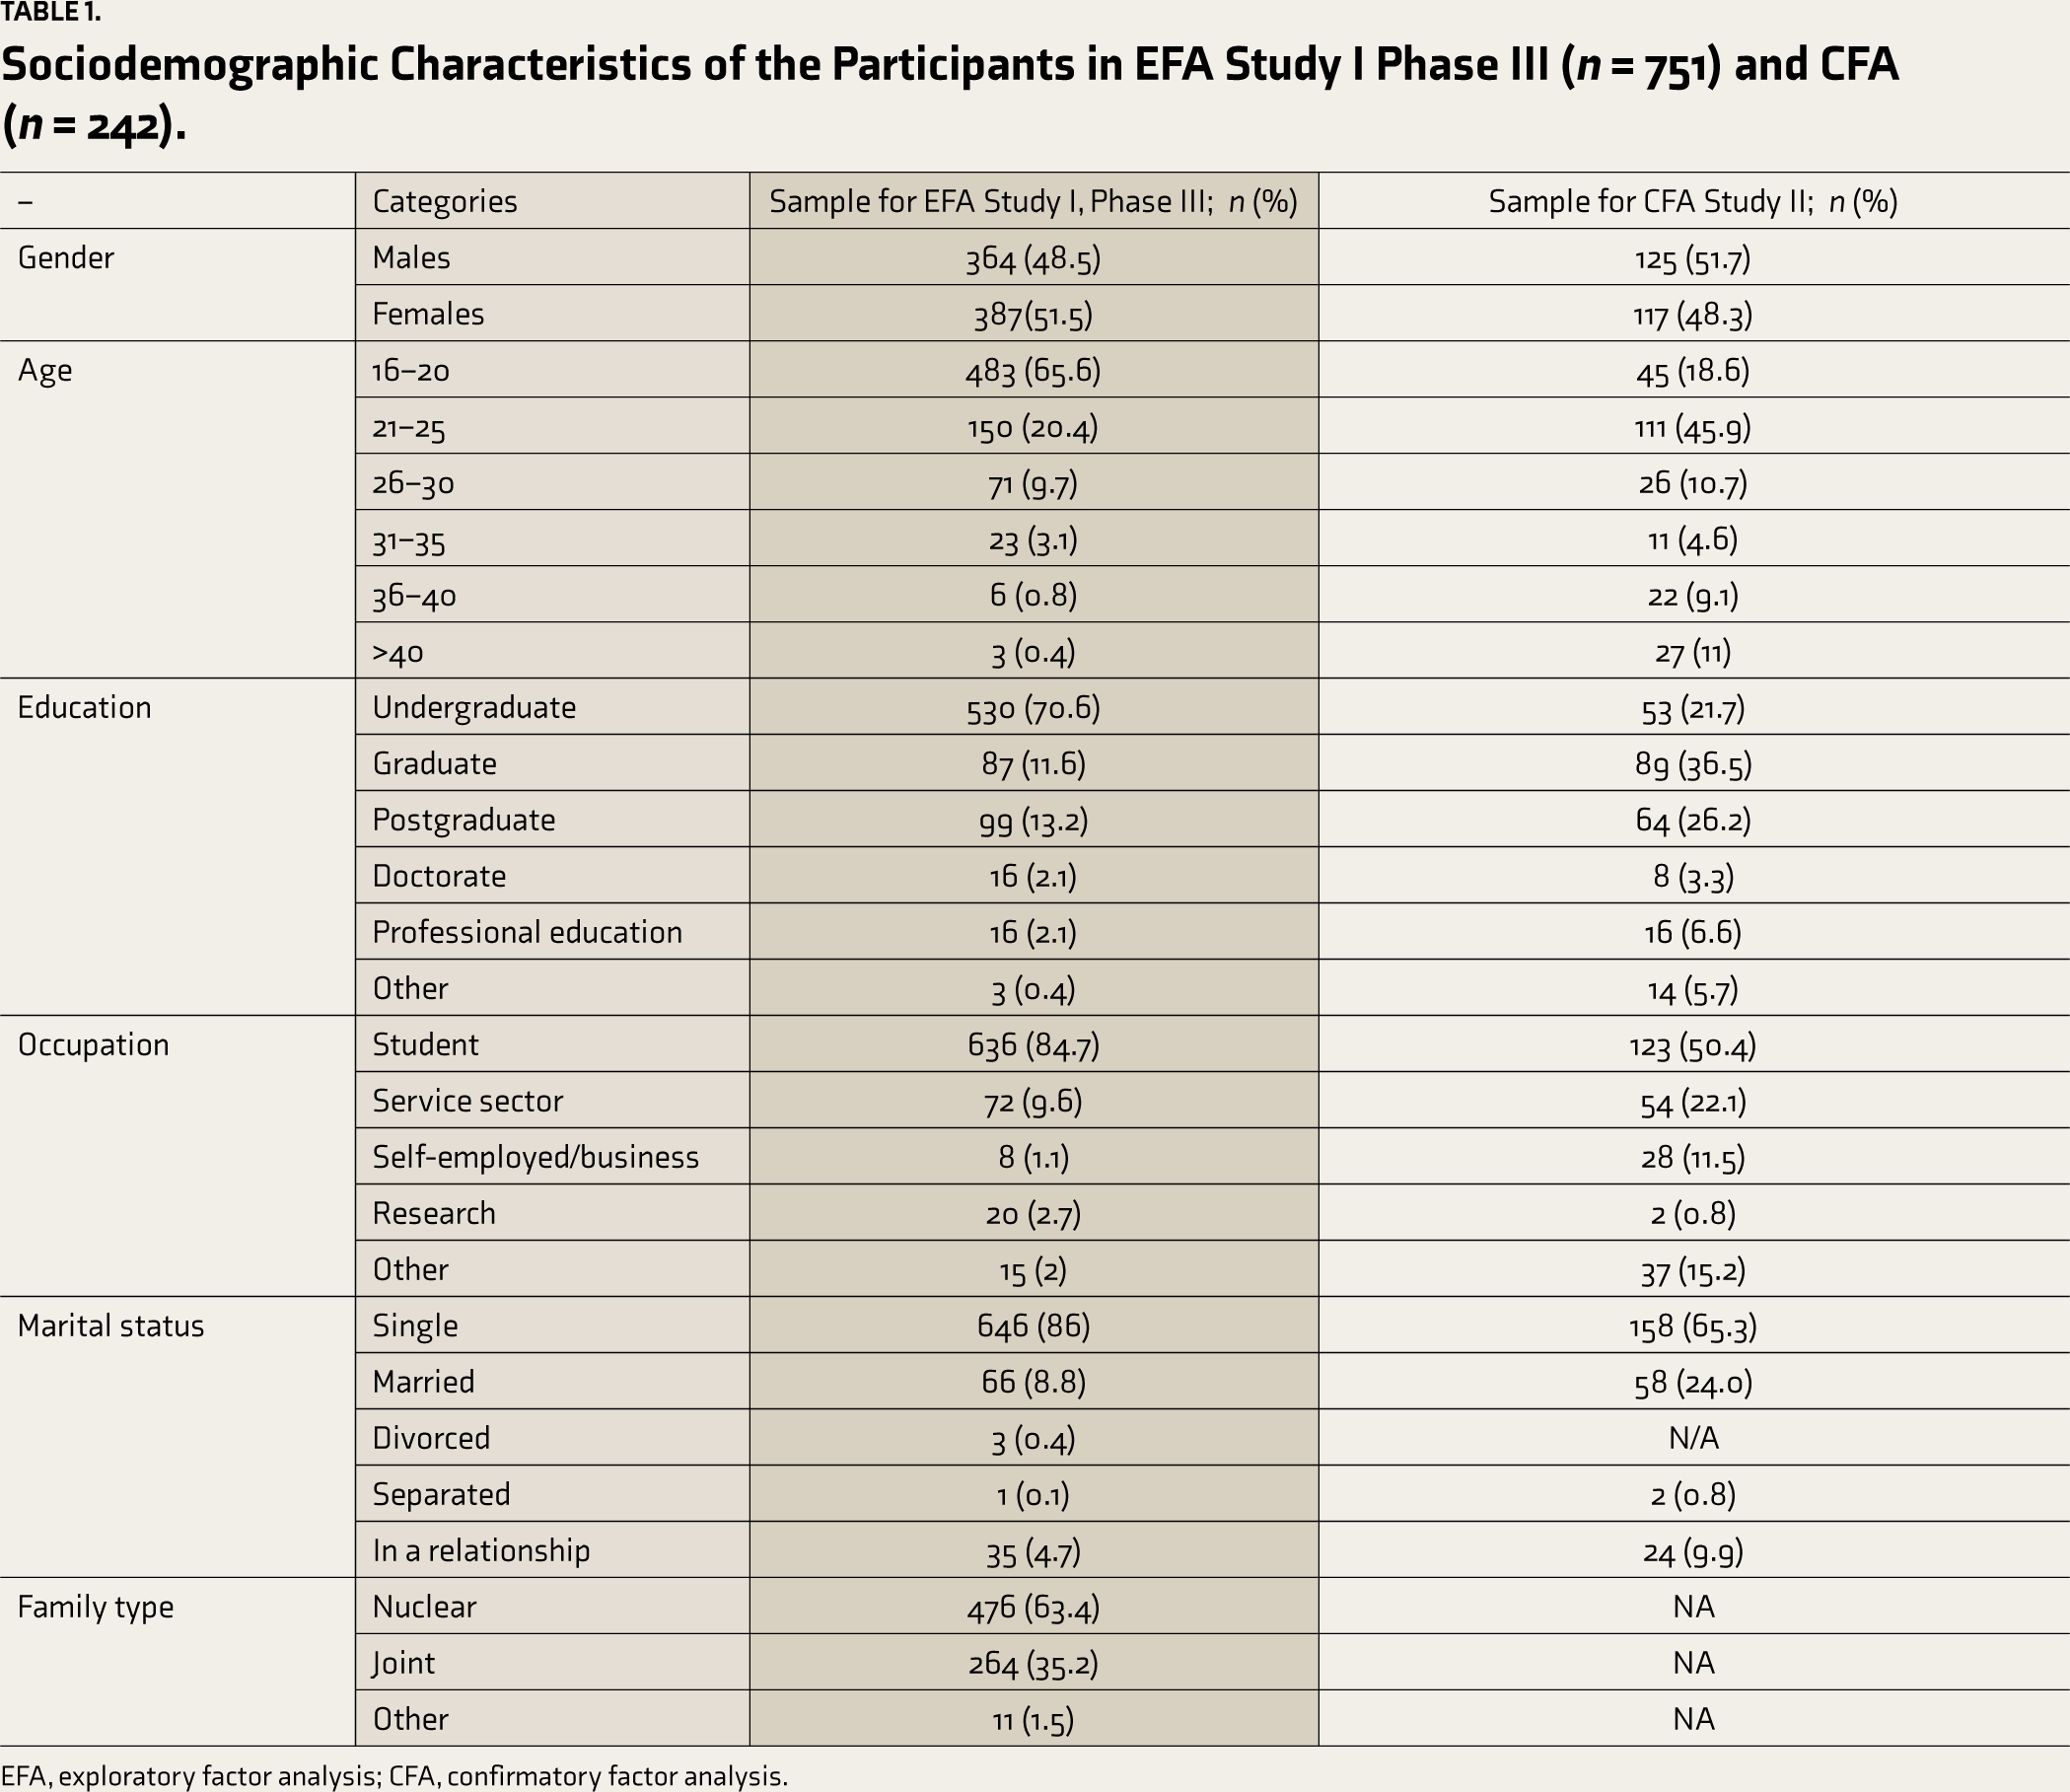
EFA, exploratory factor analysis; CFA, confirmatory factor analysis.
For our six-factor solution, Bartlett’s test of sphericity was significant (P < 0.001). Therefore, the six-factor solution was considered befitting and meaningful. The six-factor solution consisting of 25 items accounted for 50.7% of the variance. Thus, a legitimate solution where the minimum number of factors would account for the maximum amount of variance was met. The Cronbach’s α coefficient for the 25 final positively coined items was 0.86, in conformity with the cutoffs of 0.80 and 0.90 42 and 0.70 to 0.90. 57 All retained items on the six-factor solution (factor loading range = 0.41 to 0.81) confirmed their suitability by loading to their respective factors (Table 2). The obtained six factors were named in accordance with the clustering of the items. The obtained six factors were: adequate schema, secured schema, autonomous or self-reliant schema, resistant schema, success schema, and self-disciplined or self-assured schema (Table S1). The six factors were significantly correlated with each other, ranging from 0.18 to 0.47 (P < 0.01). The mean values of the items ranged between 3.32 and 4.08, and the SD was between 0.73 and 1.15. The skewness was <2 (range of skewness = -1.14 to -0.36) and kurtosis was <7 (range of kurtosis = -0.90 to 2.72). The corrected item-total correlations were within the range of r = 0.20 to 0.58. The alpha reliability if item deleted ranged between 0.85 and 0.86. The overall alpha reliability of the scale was 0.86.
EFA—Six-Factor Model with Factor Loadings for Final 25 Items with Mean and Standard Deviations
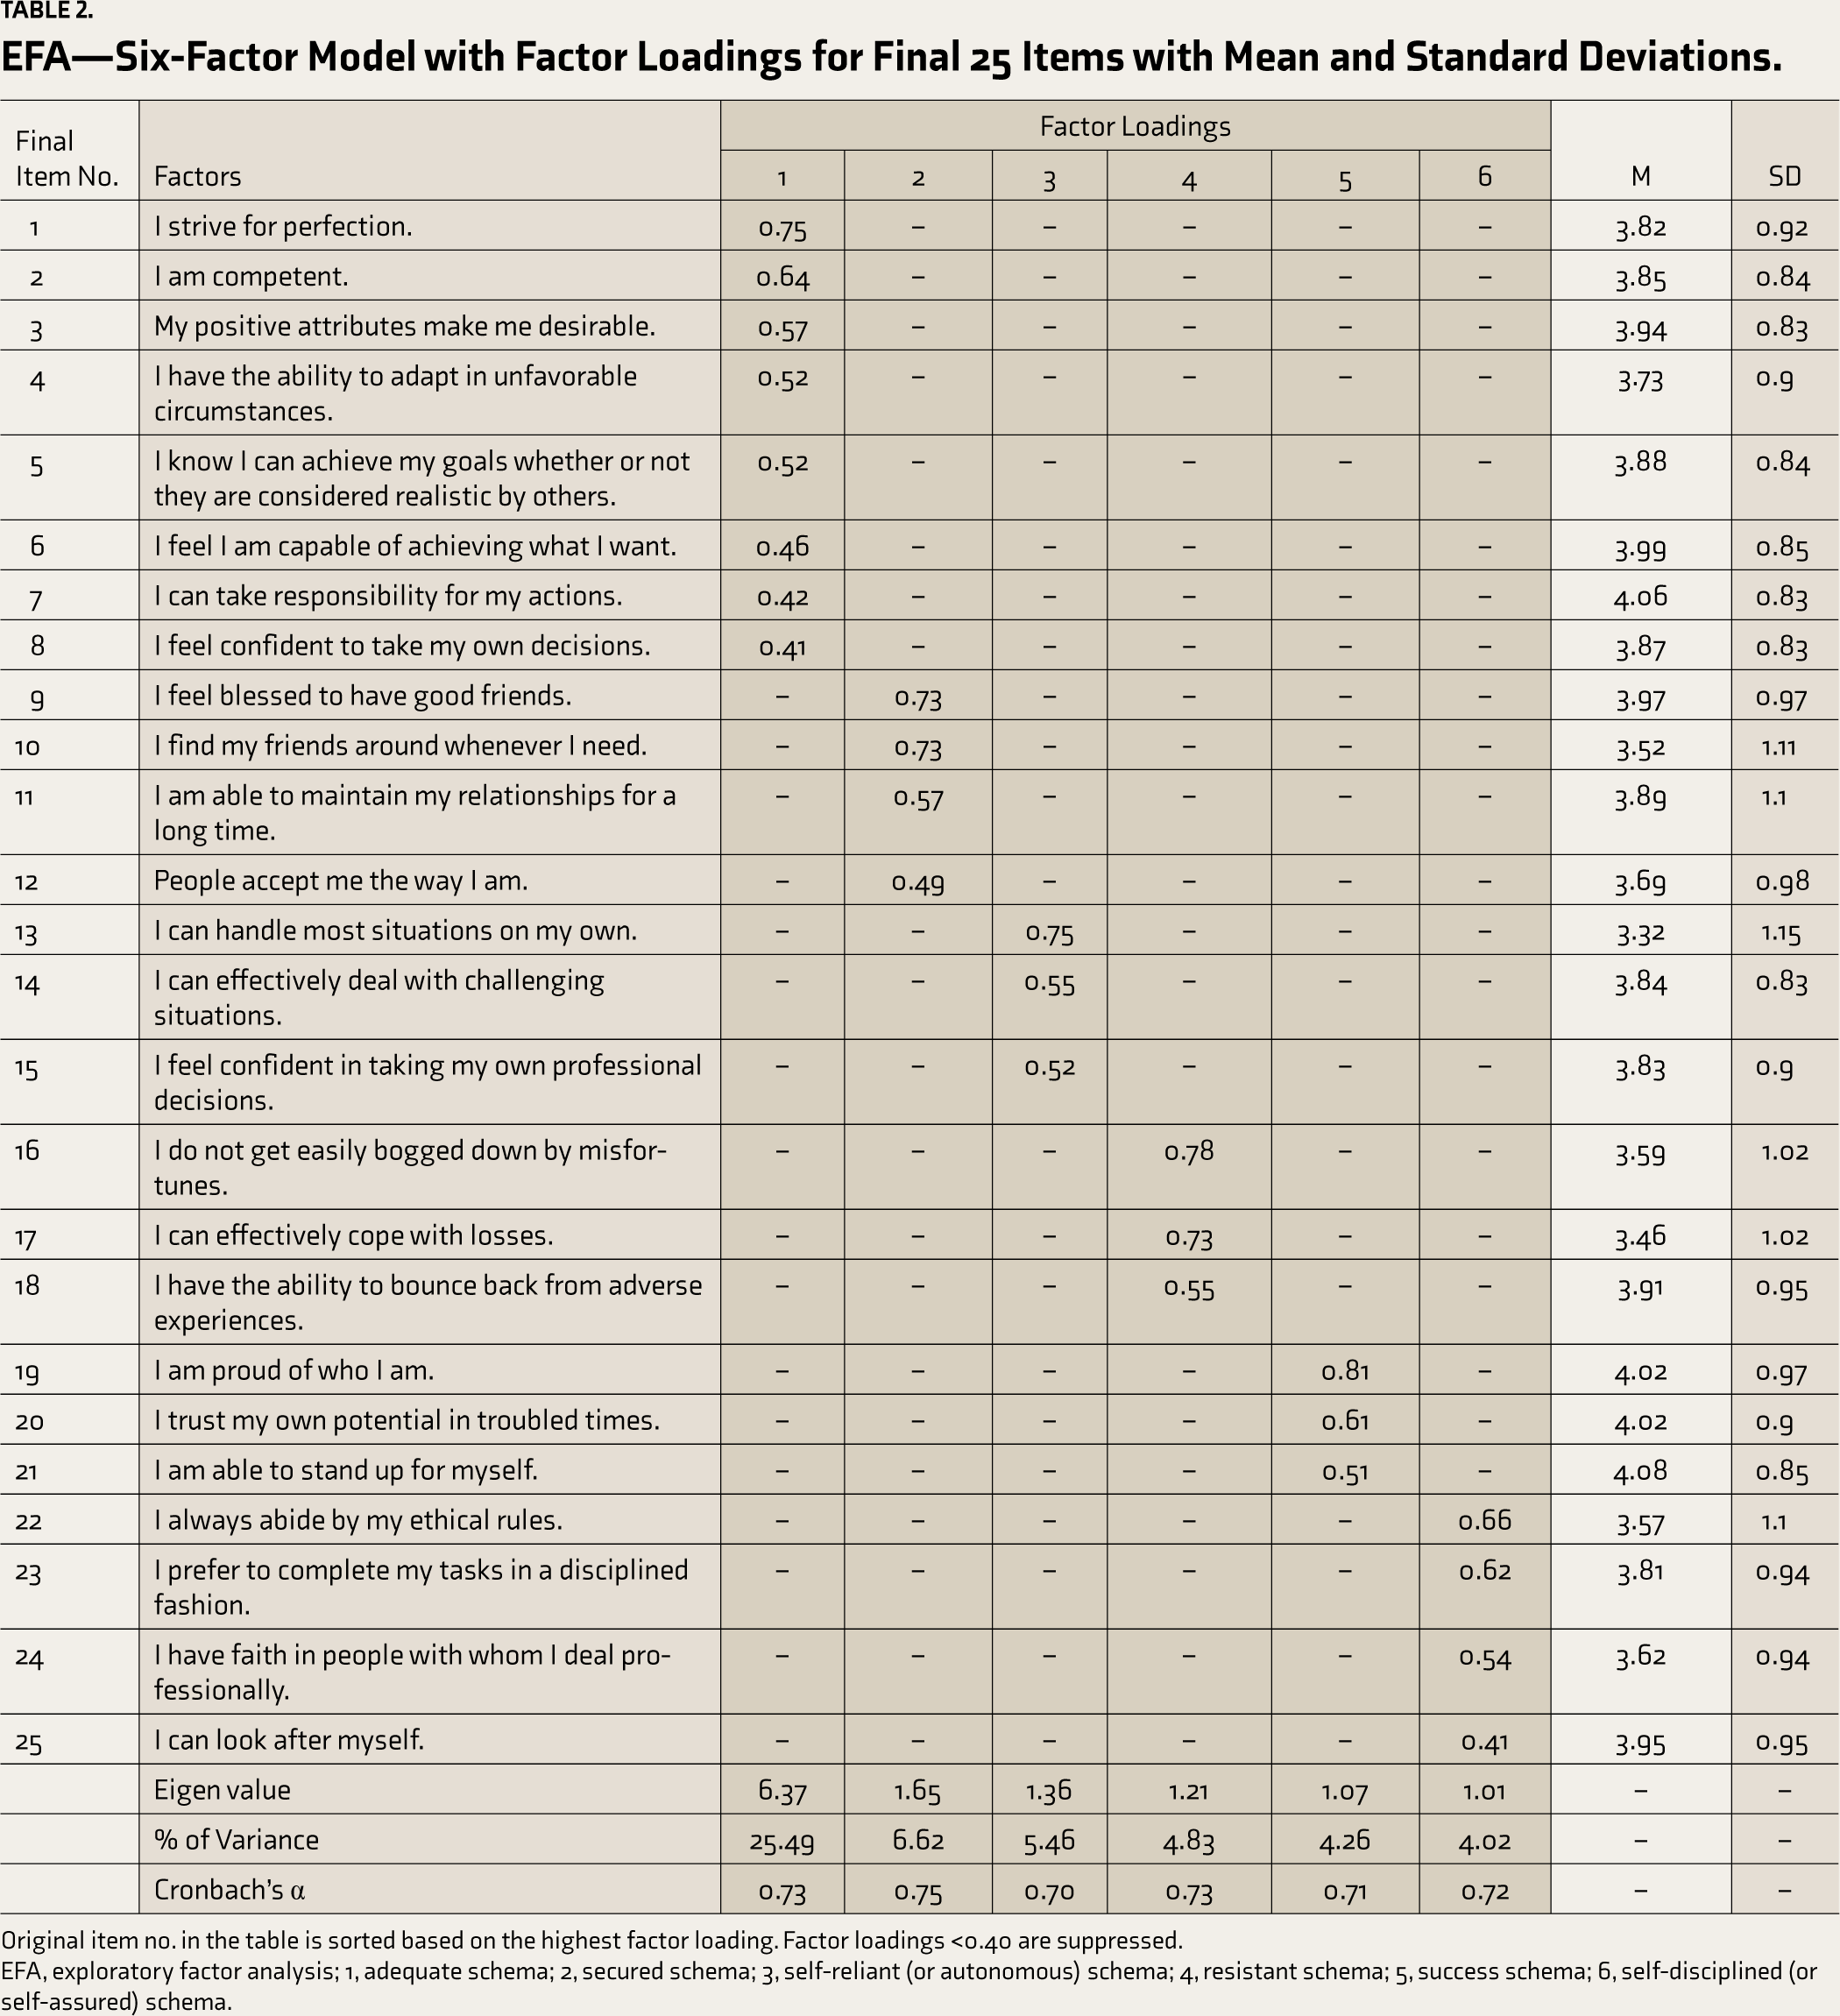
Original item no. in the table is sorted based on the highest factor loading. Factor loadings <0.40 are suppressed.
EFA, exploratory factor analysis; 1, adequate schema; 2, secured schema; 3, self-reliant (or autonomous) schema; 4, resistant schema; 5, success schema; 6, self-disciplined (or self-assured) schema.
The concurrent validity of the ASQ was established by correlating its factors’ total score with the following well-established scales—BDI-II, BFI, SPANE, GHQ-12, and YSQ S3 (Table 3). All six adaptive schemas or factors significantly positively correlated with positive experience, affect balance, agreeableness, extraversion, conscientiousness, and openness to experience, and significantly negatively correlated with negative experience, neuroticism, general health, and depression (Table 3). The obtained factors of ASQ correlated significantly negatively with most of the 18 EMS except for enmeshment and recognition-seeking schema (Table 3).
Correlation Between Six ASQ Factors and Validity Scales: SPANE, BFI, GHQ-12, BDI-II, and YSQS3 (n = 681)
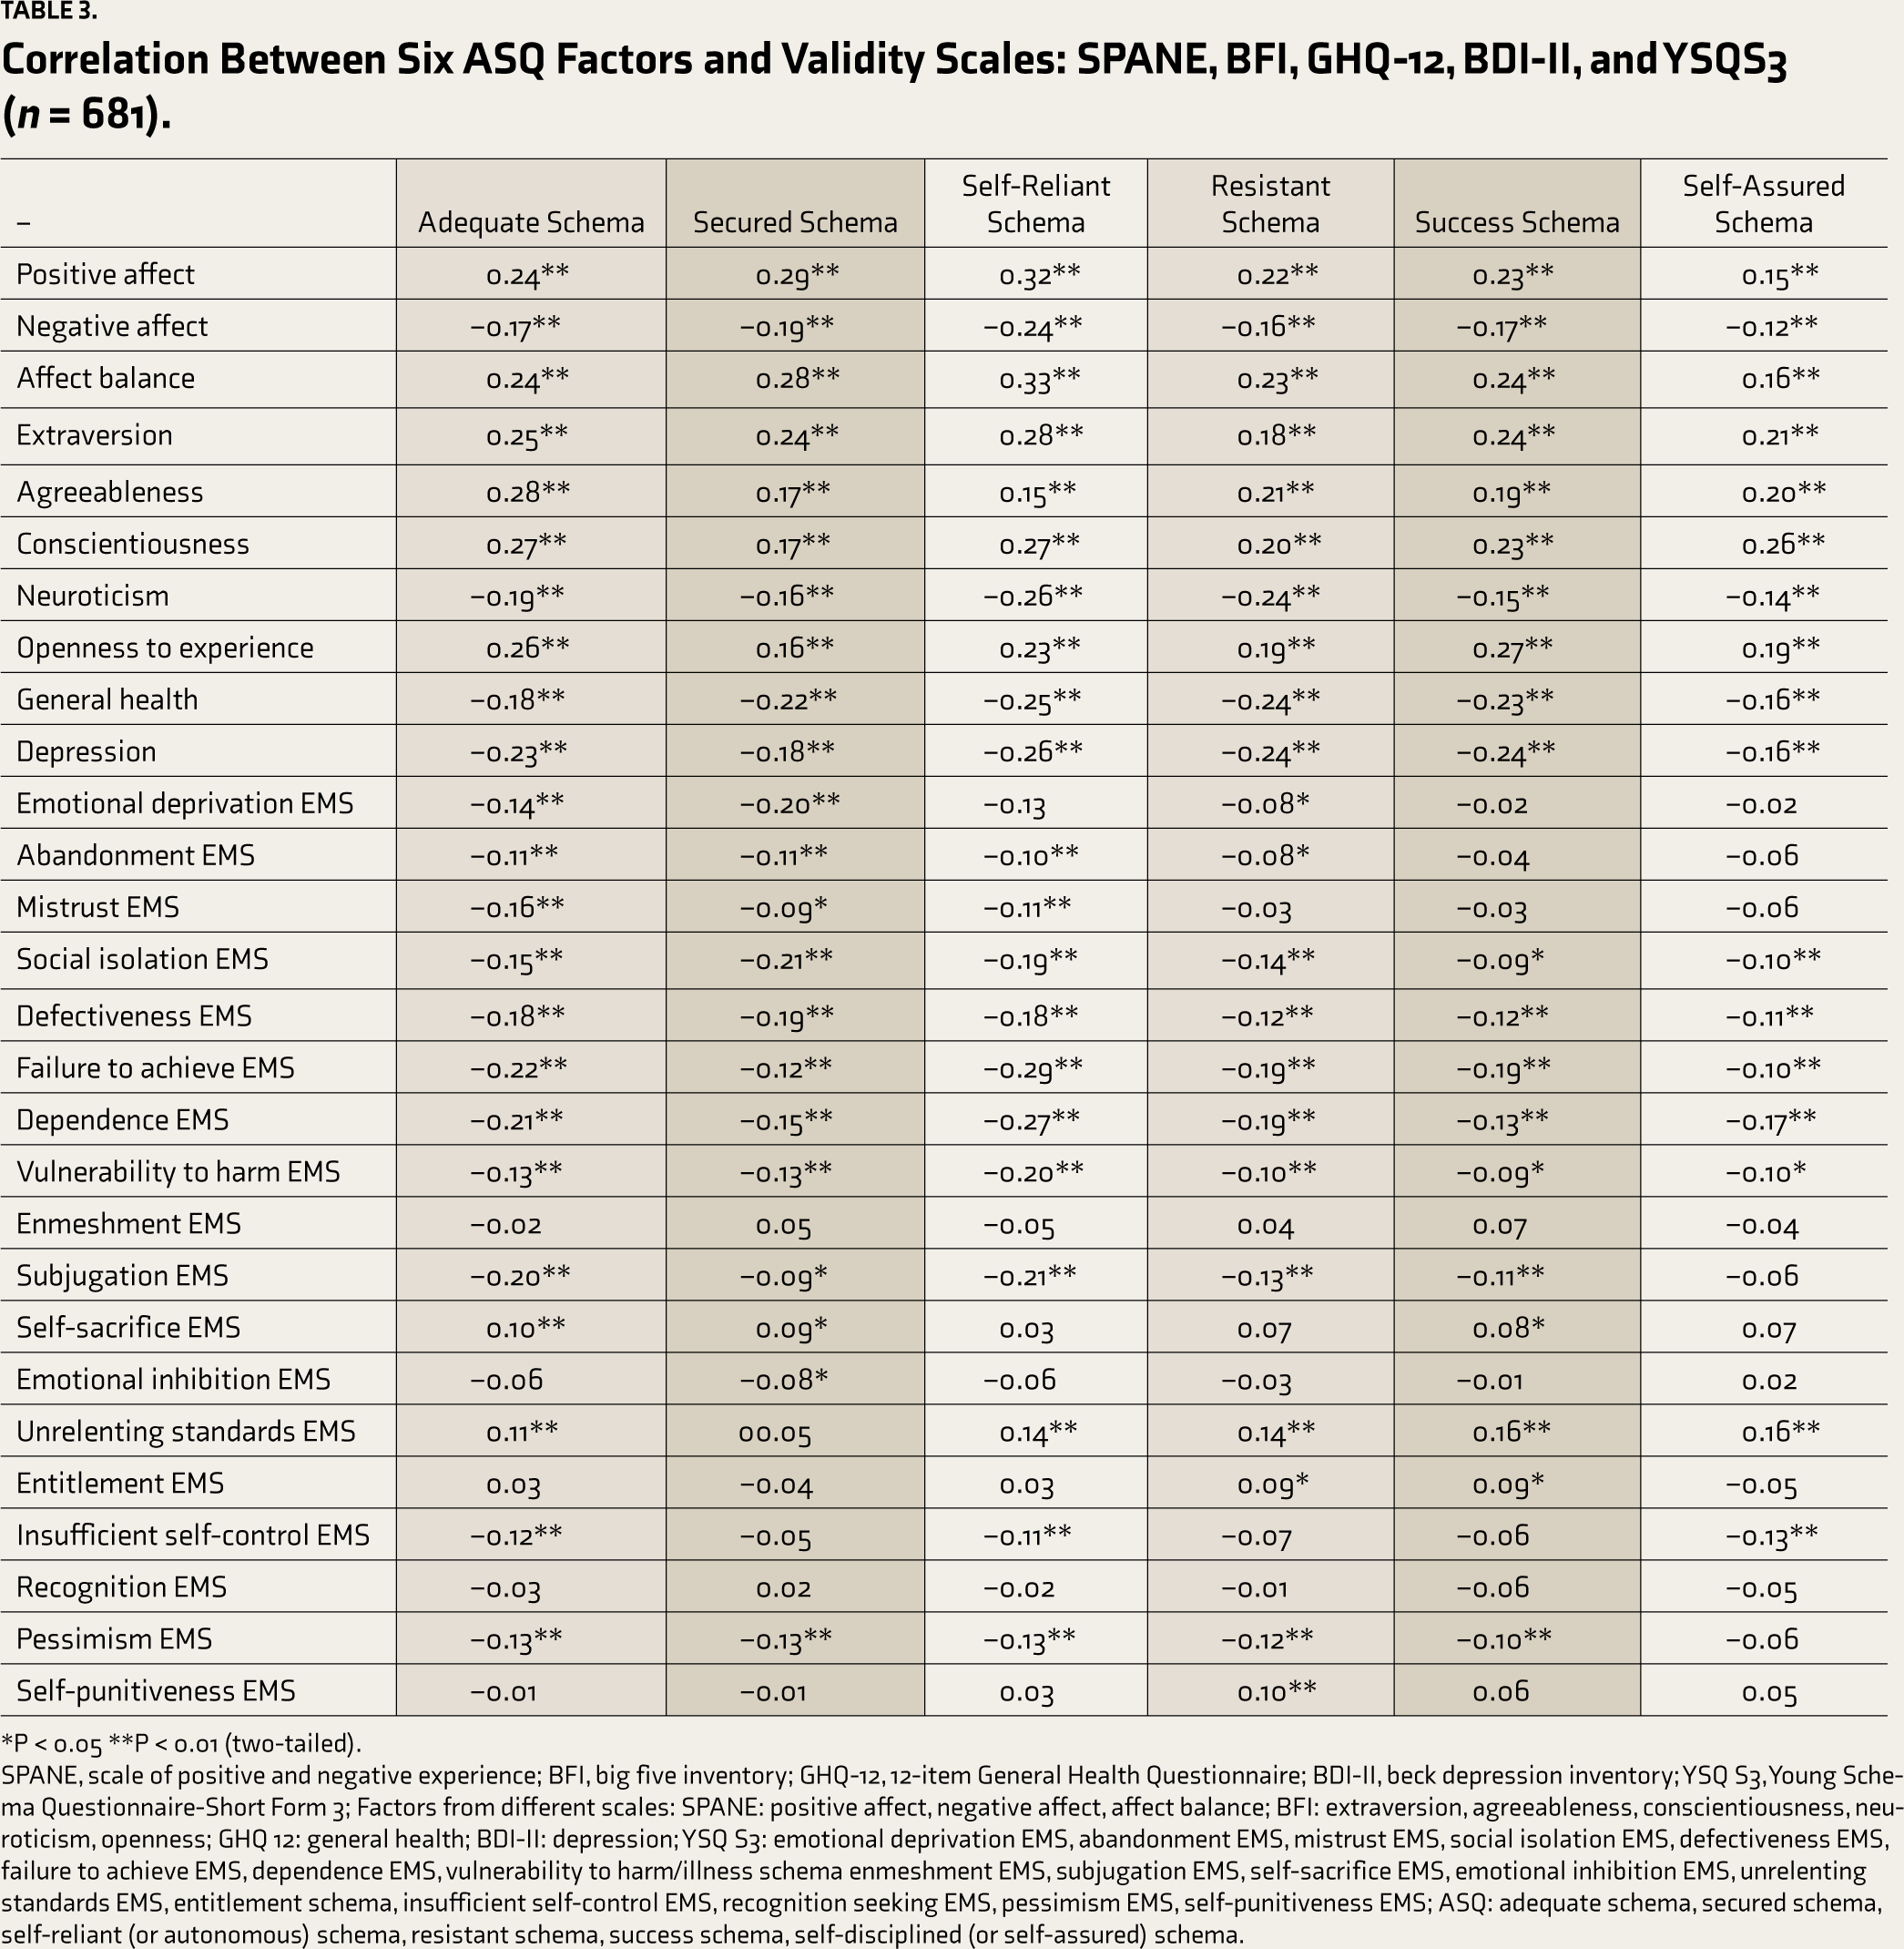
*P < 0.05 **P < 0.01 (two-tailed).
SPANE, scale of positive and negative experience; BFI, big five inventory; GHQ-12, 12-item General Health Questionnaire; BDI-II, beck depression inventory; YSQ S3, Young Schema Questionnaire-Short Form 3; Factors from different scales: SPANE: positive affect, negative affect, affect balance; BFI: extraversion, agreeableness, conscientiousness, neuroticism, openness; GHQ 12: general health; BDI-II: depression; YSQ S3: emotional deprivation EMS, abandonment EMS, mistrust EMS, social isolation EMS, defectiveness EMS, failure to achieve EMS, dependence EMS, vulnerability to harm/illness schema enmeshment EMS, subjugation EMS, self-sacrifice EMS, emotional inhibition EMS, unrelenting standards EMS, entitlement schema, insufficient self-control EMS, recognition seeking EMS, pessimism EMS, self-punitiveness EMS; ASQ: adequate schema, secured schema, self-reliant (or autonomous) schema, resistant schema, success schema, self-disciplined (or self-assured) schema.
Lastly, to understand the gender differences, we performed an independent t-test by grouping our data based on gender. The gender analysis indicated that males scored significantly higher on self-reliant and resistant schema than their female counterparts (Table 4).
Gender Differences on ASQ
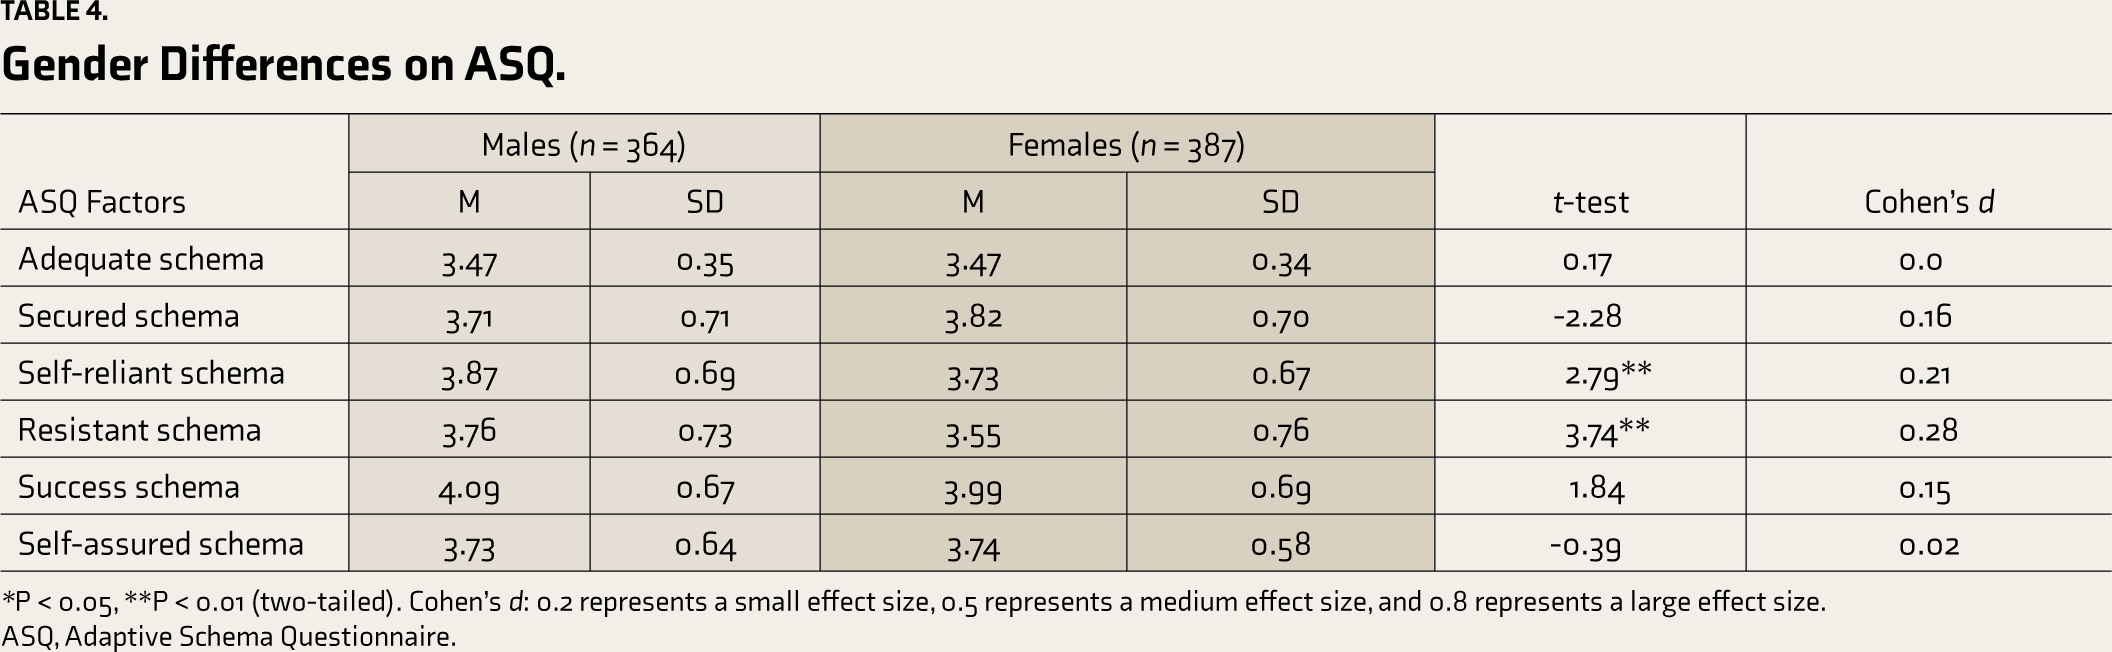
*P < 0.05, **P < 0.01 (two-tailed). Cohen’s d: 0.2 represents a small effect size, 0.5 represents a medium effect size, and 0.8 represents a large effect size.
ASQ, Adaptive Schema Questionnaire.
Study II
CFA was computed on an independent sample to estimate the goodness of fit of our obtained six-factor model (Figure S3). Data adequately converged and displayed how well the model fits. 58 Values of the chi-squared test (χ2), root mean square error of approximation (RMSEA), comparative fit index (CFI), and standardized root mean squared residual (SRMR) are commonly recommended when reporting goodness of fit indices.57, 59 Table 5 indicates the obtained values corresponding to the acceptable indices. Obtained χ2 in the study was 858.53, and the degrees of freedom (df) was 260. This was significant at P < 0.001. It is known that the χ2 value is sensitive to sample size; hence χ2/df value was examined. 48 Our χ2/df was 3.30, suggesting an acceptable (moderate) fit. Obtained RMSEA value of 0.098 and CFI value of 0.90 are also within acceptable ranges, suggesting a moderate fit.59, 60 However, obtained SRMR value was not within the recommended range. Therefore, it was concluded that our obtained model was a moderately acceptable fit.
CFA Indices for the ASQ Six-Factor Model (n = 242)
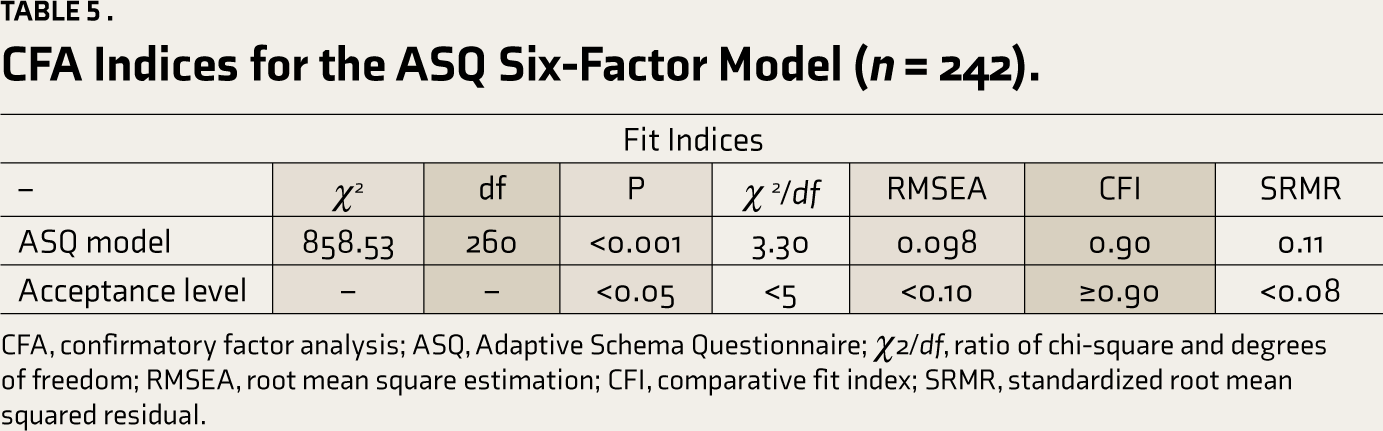
CFA, confirmatory factor analysis; ASQ, Adaptive Schema Questionnaire; χ2/df, ratio of chi-square and degrees of freedom; RMSEA, root mean square estimation; CFI, comparative fit index; SRMR, standardized root mean squared residual.
Discussion
With the advancement of clinical psychology, there has been extensive research on tools to assess maladaptive schema and its impact on mental health. Several cross-cultural studies have further validated the maladaptive schema scales. However, to the best of the authors’ knowledge, only a few tools exist to assess the positive or adaptive schema.4, 25 Moreover, it is well known that there is a need for culturally valid tools when considering psychological assessment, including for positive schema. 2 Given the fact that positive schema influences perception and information processing, thereby impacting wellbeing, developing a robust tool to assess adaptive schema was considered noteworthy. In a cross-cultural study for the development of YPSQ, 4 a sample from India was used. However, in the YPSQ study, the Indian sample was gathered from one state/urban sector in the country, which does not appropriately represent the characteristics of the diverse Indian population. In this study, a sample from wider geographic distribution was collected. A careful process beginning with the generation of adaptive themes corresponding to the Young EMS model was utilized following the opinion of SMER and subsequent rigorous item and factor analysis. This process allowed for the generation of items more closely representative of culturally relevant adaptive schematic themes in reference to the sample characteristics of the study.
In our study, extensive factor analysis resulted in retaining statistically most suited positive items to assess the adaptive schemas meaningfully. We used mirroring items to study how they correlate with the data and the correlating factors. It is not uncommon to use mirroring items in test development. 4 The presence of positivity bias (need of a person to present self in a positive light) may also explain the inconsistent clustering of negatively coined items with respective schemas and their eventual removal. This is also in congruence with the hallmark of schema-congruent information processing bias. 61
The final six factors (or schemas) in our study (namely adequate, secured, autonomous or self-reliant, resistant, success, and self-disciplined or self-assured) are similar to the positive factors that emerged in other studies such as self-efficacy, optimism, trust, success, 25 stable attachment, healthy self-reliance, and healthy self-control/self-discipline. 4
The developed ASQ showed adequate reliability and validity. The validity of ASQ was established by correlating it with EMS as measured by YSQ S3. 35 The six factors obtained correlated significantly negatively with most other EMS (Table 3). For instance, in our findings, secured schema significantly negatively correlated with emotional deprivation EMS. This suggests that those who are not emotionally deprived while growing up would potentially develop a secured schema as opposed to developing emotional deprivation EMS. Similarly, most of the six adaptive schemas correlated significantly positively with the self-sacrifice schema and unrelenting standards EMS. This can be understood in the cultural context where self-sacrifice, in contrast, is often considered a positive attribute and not an undesirable attribute. Additionally, in a related study, adaptive schemas such as freedom (subjugation), learning (perfectionism), and resilience (failure) accounted for the success of entrepreneurs. 26
Interestingly, contrary to expectation, our results identified a significant positive correlation between success schema and entitlement EMS. This is supported by other studies focusing on the relationship between adaptive-maladaptive forms of perfectionism and academic achievement.62–64 The ASQ did not correlate with enmeshment and recognition EMS. One plausible explanation for these findings could be that young adults (forming the majority of the participants in our study) are known to be transitioning from dependent to the autonomy phase of life, where the process of individuation is ongoing, and they may not have any clear goal yet. Similar to our findings, in another study, the Enmeshment schema did not emerge as hypothesized. 65
The negative correlation of our positive ASQ factors with depression also establishes its concurrent validity. Another study found that positive schema accounted for unique variance with measures of depression and resilience. 25 The six factors of ASQ correlated positively with measures of personality such as conscientiousness and extraversion, suggesting their tendency to be stable dispositional dimensions.
Six factors of ASQ positively correlated with each other. This suggests an overlap between factors and that they are not mutually exclusive. This is also commonly seen among various maladaptive schemas.4, 66 However, the clustering of items with respective schemas indicates them to be discrete categories or schematic themes.
The gender differences (binary) in our study show males scored significantly higher (with a small effect size) on self-reliant and resistant schemas than females (Table 4). Such findings can also be understood in the cultural context where more emphasis is given to male dominance and male autonomy, though increasingly more female participation is seen across professional fields. In a study comparing gender differences, male adolescents were more resilient (similar to the resistant schema in this study) than their female counterparts. 67
Furthermore, the goodness of fit index we obtained from CFA indicated that the obtained six-factor model was acceptable with a moderate fit. CFA findings confirm the generated original six-factor model by the authors for the first time as tested and developed in Indian culture as a promising model.
The generated adaptive schema framework helps seize the schema pertinent to Indian culture through a statistically sound instrument. It provides a reference point for how Indians (16–64 years) may be predisposed to think, affecting their psychosocial functioning. We believe that ASQ can be used to investigate adaptive schemata in settings such as counseling/psychotherapy and research. This may help identify strengths that can be built upon, beyond the predominant focus on reducing dysfunction. ASQ assesses the adaptive aspect of cognition and, therefore, can find its application in establishing treatment goals and testing the efficacy of treatments used to promote wellbeing and mental health. The use of ASQ can thus enable a more balanced approach during clinical evaluations and interpretations. We envision that ASQ can be replicated and used for screening, research, and monitoring progress in varied applied settings as well.
Limitations and Future Directions
The developed tool is a reliable and valid measure to assess adaptive schema in the general population. However, caution is required for the generalization of findings. In future research, random sampling and double-blind data collection methods can be used to reduce biases. Regarding sociodemographic variables, most participants were undergraduate students (mode = 18 years of age). It should be noted that there was a higher representation of males in Phase I and II of this study. To ensure that there is no gender-based bias, in the main study where we performed EFA and in Study II, where we confirmed our model, we had an equitable gender distribution. In the future, a more diverse and normal distribution of participants may be gathered to investigate age-related differences. The current model can also benefit from testing for cross-cultural validity and from translation to different regional languages. This is important considering that data in this study were gathered in the English language, which is different from the several different languages used in the country. Additionally, the model can be tested on a clinical sample for wider applicability.
Supplemental Material
Supplemental material for this article is available online.
Supplemental Material
Supplemental material for this article is available online.
Footnotes
Acknowledgements
The authors would like to acknowledge the contribution of Professor Dalbir Singh, Associate Professor, Pt. N.R.S. Government College, Rohtak, India, for his support with data collection. Also, the authors would like to thank Shilpa Bandhopadhyay, MSc for technical assistance and Ankit Gupta, Ph.D., Scientist III, Arcellx, Inc. for his assistance with language and proofreading of the manuscript.
Declaration of Conflicting Interests
The authors declared no potential conflicts of interest concerning this article’s research, authorship, and publication.
Funding
The authors received no financial support for the research, authorship, and publication of this article.
References
Supplementary Material
Please find the following supplemental material available below.
For Open Access articles published under a Creative Commons License, all supplemental material carries the same license as the article it is associated with.
For non-Open Access articles published, all supplemental material carries a non-exclusive license, and permission requests for re-use of supplemental material or any part of supplemental material shall be sent directly to the copyright owner as specified in the copyright notice associated with the article.