
Abstract
Grandchildren of post-World War II immigrants have started entering the labor market in Western Europe. Are they on a multigenerational path toward full economic assimilation, much like the European migrant groups in US classical assimilation theory? This paper assesses the degree of economic assimilation of third-generation descendants of immigrants with divergent initial socioeconomic positions in the Netherlands. Given the diversity in starting positions of various migrant groups, we fully account for parental (economic) disadvantages from an intergenerational mobility perspective by making use of rich register data. Looking at adult children aged 20–30 and their (grand)parents, we quantify the Dutch-third-generation gap in incomes and wealth by employing a rank–rank analysis to identify ethnic disparities in absolute and relative intergenerational income mobility. Our analysis reveals that third-generation descendants of immigrants generally reach parity with their native-Dutch counterparts, regardless of their initial position when we control for socioeconomic conditions. The results signify a diminishing role of group-specific barriers across generations for all groups. As such, the third-generation descendants of disadvantaged migrants appear to be on a track toward economic assimilation, regardless of their ethno-national origin. Our conclusion highlights implications for policy and public debates on ethnic disparities.
Introduction
In the post-World War II (WWII) period, Western European countries saw increasing flows of immigrants from low-income countries. The postwar economic boom attracted a large number of “guest workers” to work unskilled jobs in industry and manufacturing. Around the same time, a wave of decolonization triggered many people to migrate to their former metropoles. Given their background, many of these immigrants have faced substantial disadvantages in the host countries (Alba and Foner 2015; Zorlu and Hartog 2012). Their children, the “second generation,” tend to do better than their parents, but they often remain disadvantaged compared to their native counterparts (Algan et al. 2010; Heath, Rothon, and Kilpi 2008). This indicates that economic assimilation seems to progress over generations. Yet, little is known about how the children of the second generation, i.e., third generation (grandchildren of immigrants), is performing in Western Europe (Verhaeghe et al. 2017). This study provides empirical evidence on the evolution of ethnic disparities across three generations in the Netherlands.
Initial disparities in education, labor skills, language, cultural norms, ethnicity, and religion may all affect the disadvantaged starting position of migrants in a host country, and likely shape the pace of assimilation across generations. The second generation typically inherits some of these parental disadvantages and is unable to abolish many disadvantages due to stigmatization in host societies as well as their ongoing strong connections with their countries of origin through among others family reunification and union formation (Alba and Nee 2003; Huschek, de Valk and Liefbroer 2012; Portes and Rumbaut 2001). The ‘third generation’ builds on the advancement of their parents who must have struggled the disadvantages of their immigrant grandparents. Hence, they should deal with a smaller ethnic gap in intergenerational socioeconomic and cultural differences. Moreover, the third generation is more likely to have weaker social and religious ties with their grandparents’ ethnic communities and countries of origin, and to be culturally indistinguishable from the majority- at least at first sight. Their rootedness can attenuate any prejudice or discrimination toward “immigrants.” Consequently, economic outcomes of third-generation groups are expected to converge to that of native Dutch while we may still see differences between ethnic groups. The literature has mainly been limited to the first and second generation, and often fails to include the effect of intergenerational mobility. Up to now, data limitations have prevented any attempt to study the progress of the “third generation” in relation to their parents (Jiménez, Park and Pedroza 2018; Tran 2018).
Our study seeks to assess to what extent the grandchildren of immigrants have inherited the (dis)advantages of their parents, and the degree to which the economic inequalities between ethnic and majority groups can be explained by (a lack of) intergenerational mobility. As such, we present a first comprehensive assessment of whether grandchildren of post-WWII immigrants to Western Europe follow similar assimilation paths as European migrants to the New World at the turn of the twentieth century did, or whether we see variations between groups (Alba and Foner 2014; Alba and Nee 2003; Jiménez, Park, and Pedroza 2018; Tran and Valdez 2017). More specifically, our paper contributes to the migration literature in two ways. First, this study evaluates the economic assimilation of third generation from an intergenerational perspective, which allows us to account for the high degree of diversity in the starting positions of (grand)parents. Second and relatedly, it will evaluate competing theoretical predictions about the pace of economic assimilation of distinct ethnic groups in Europe that are facing various degrees of barriers to integration in the Netherlands, a country with a generos welfare state. Often, the assumption is that the pace is dictated by social and cultural factors associated with country of origin, yet it may also be related to family disadvantage.
We compare the economic assimilation of ethnonational origin groups with substantially different initial socioeconomic positions (SEPs) and migration histories. The SEPs of large migrant groups in the Netherlands may be ranked as follows from low to high: Moroccan, Turkish, Surinamese, and Western migrants (Van Tubergen, Maas, and Flap 2004; Yao and van Ours 2015; Zorlu and Hartog 2012). Surinamese migrants have a colonial history, while the other groups typically entered the Netherlands as labor migrants. Grandchildren of Turkish and Moroccan immigrants are still small in number but sharply increasing. We also examine the income outcomes of the grandchildren of German and Indish migrants and of native-born Dutch. The German migrants are arguably the most comparable to the Dutch because of the shared national border, and because of the linguistic and cultural similarities between the two groups. Indish 1 migrants were born in colonial-era Indonesia, and represent the immigrant group with the longest history in the Netherlands in the post-war era.
To gauge the effects of intergenerational mobility on the economic success of the descendants of immigrants, our study compares the income ranks of the grandchildren of immigrants and non-immigrants in the Netherlands (“third generation,” aged 20–30), while taking into account parental income. We examine intergenerational income mobility using data from the system of social statistical datasets, which is an integrated database of various registers provided by Statistics Netherlands (Bakker, Van Rooijen and Van Toor 2014) and conducting regression and decomposition analysis. Our individual-level register data covering the entire population enable us to get a first assessment of the economic assimilation of these third-generation origin groups.
The remainder of the paper is structured as follows. We first discuss the relevant literature on intergenerational mobility in relation to migration and assimilation in the “Intergenerational Mobility, Migration, and Assimilation” section. The “Measurement of Intergenerational Mobility” section presents the conceptual framework used to evaluate intergenerational mobility. The “Data” section describes our data and variables. In the “Results of Intergenerational Income Mobility” section, the results of empirical analysis are presented. The “Conclusions” section summarizes and discusses the significance of our findings.
Intergenerational Mobility, Migration, and Assimilation
Multiple studies have documented large differences between immigrants from the former colonies, “guest workers,” and refugees on the one hand, and immigrants from Northern countries and the majority population on the other (e.g., Algan et al. 2012; Fleischmann and Dronkers 2010; Yao and van Ours 2015; Zorlu and Hartog 2012). These disparities may be driven by differences between origin and destination countries in terms of the educational system, income distribution, language, institutional structure, and geographical distance; as well as by the migration policies and institutional context. Moreover, it is often shown that immigrants from developing or war-torn countries and former colonies tend to lag behind the majority population in terms of educational levels, employment rates, and earnings. While their descendants typically do better, members of the so-called “second generation” also tend to lag behind socioeconomically, despite having been exposed to the same cultural values, or despite having grown up in households with intermarried parents, educational system, and institutional context as their majority-descendent peers (Jiménez, Park and Pedroza 2018; Tran and Valdez 2017).
There are various explanations for this persistent lag, with discrimination by the host country and/or the deviant cultural values of non-European immigrant groups often being mentioned in integration debates (see Bonjour and Duyvendak 2018; Koopmans 2013). However, these disparities may also be attributed to the effects of intergenerational mobility, meaning that the transfer of the social, economic, and cultural capital of the parents structures the socioeconomic success of the children. Newly arrived immigrants, particularly when they are relatively poor and have limited cultural knowledge, may be less able to help their children achieve success in labor markets that value formal education, social interaction, and cultural knowledge. However, after families have settled and lived in a country for multiple generations, these inequalities may vanish. Indeed, canonical intergenerational models of inequality have indicated that ethnic disparities in income are persistent in the long run only if these disparities do not fully arise from parental income differences (Becker and Tomes 1979). The restraining effect of intergenerational transfers is implicitly recognized in classical assimilation theory (Alba and Nee 2003), which holds that immigrant families and groups experience a slow process of upward mobility over generations. As life in the home country and the event of immigration become more distant, each new generation may reach a more advanced stage of adjustment to the mainstream host society, and thus move toward economic assimilation, or integration. This reasoning suggests that a “third generation” may be expected to surpass their parents and grow closer to the majority population.
Generational Transfers in Immigrant Families
It has long been recognized that an individual's socioeconomic status may be structured and determined by family status and that inequalities can reverberate through multiple generations (Mare 2011). This inherited status may come in the form of direct transfers of wealth and income (Henretta, Van Voorhis, and Soldo 2018; Woodman 2020). Family wealth may also act as a lever. It can buy children access to high-quality education and tutoring. Indeed, in the United States, family wealth is a strong predictor of educational attainment (Pfeffer 2018). Parental wealth can also broaden residential opportunities (Arundel 2017), which can, in turn, shape environmental factors in childhood (Hedman et al. 2015; Pais 2017) and in young adulthood (Hochstenbach and Boterman 2017; Manley, van Ham and Hedman 2020). As mentioned, such advantages are typically not awarded to low-skilled labor immigrants and citizens from former colonies who are engaged in low-income employment. After their arrival in the host country, they often live concentrated in deprived urban areas, which can negatively impact labor market integration over time (Andersson, Musterd, and Galster 2019; Wimark, Haandrikman, and Nielsen 2019). As most low-income immigrants make only modest gains, they often have few resources to transfer. Moreover, financial hardships can also have negative effects on the school performance of their children (Antman 2011).
Sociological studies have shown that intergenerational mobility is based on more than material transfers. Parents and family members may engage in social reproduction through the transmission of values and norms, the organization of daily life, their efforts to expose their children to valuable social networks, their use of language, their modes of supervision and intervention, and their involvement in their children's formal and informal education (Lareau 1987, 2011). Regardless of income or education level, most immigrants will initially be unfamiliar with the language, social norms, and institutional frameworks of the host country, and have limited local social networks (Lancee 2010; Pinkster 2009). As such, this may impede the socio-economic success of their children and possibly their grandchildren. Conversely, migrants may also transmit to their children values of collectivism (conformity) and strong achievement (Nauck 2011). This line of reasoning suggests that despite low SEP, some immigrant families are more motived and better equipped to help their children to achieve socio-economic success (Alba and Foner 2015), and that such values, or lack thereof may explain group differences in mobility.
Intergenerational transfers may also be related to demographic processes. In addition to migration, families influence the well-being of subsequent generations through differential fertility and assortative matching (Mare 2011). For migrant communities, deprivation or social isolation can be maintained by traditional and mono-ethnic family structures. A vast majority of low-income immigrants are often married to a partner from the same ethnic origin. Although the intermarriage rate among the second generation is relatively high, most second generation are still in mono-ethnic households (CBS 2017; Huschek et al. 2012). Assimilation theories consider that migrant households with mono-ethnic couples are microsocial units to preserve ethnic identity, cultural values and ethno-racial ties while interethnic marriage is seen as one of the final stages of societal integration (Alba and Nee 2003; Jimenez, Park, and Pedroza 2018).
Explanations of ethnic disparity that rely on intergenerational transfers tend to regard relative deprivation as temporary and, as mostly associated with the first generation and their children. Likewise, classical assimilation theory predicts that native-immigrant differences in socioeconomic outcomes decline from generation to generation as immigrant families adapt to the host society (Alba and Nee 2003). Yet, such an upward linear trend is not a given. Generational stasis or downward mobility can also be a route for some migrant groups (Portes and Rumbaut 2001; Portes and Zhou 1993). Mobility may be constrained by social stigmatization and exclusion, or by institutional racism and discrimination. Also, some intergenerational transfers, and the lack of other transfers, may also produce negative outcomes (see above).
Expectations
Overall though, little is known about the long-term effects of migration in the context of Western Europe. The existing literature on assimilation is mainly limited to the second generation and does not extend to the grandchildren of migrants. Yet, based on the literature, we expect the following three economic outcomes for members of the third generation after migration:
Like their parents before them, the third generation will perform better than their parents. When doing better, the third generation will close the gap between ethnic groups and the majority native population. As different groups follow different trajectories based on their country of origin, their migration history, and their position in the new home country, members of the third generation will perform differently based on their origins.
The third generation may profit from the inroads made by their parents and grandparents. This success is not just related to the economic transfer. Members of the third generation grew up in households that are more familiar with their country of residence. So, other than their parents, they will not face any problems related to lack of language proficiency, insufficient cultural knowledge, and unfamiliarity with institutions. We expect that the third generation will suffer much less from the factors that have complicated integration of their parents, in particular their grandparents such as weak starting position as unskilled immigrant, cultural, linguistic, and religious differences, lack of relevant social networks. Their skills, ambition, and perseverance will play a bigger role in their performance and achievements. It remains an open question to what degree specific family origins do still play a role for the third generation. Classic assimilation theories suggest convergence while critics have noted that groups may follow different trajectories (Alba and Nee 2003; Portes and Zhou 1993). For instance, Drouhot and Nee (2019) argue that religious difference is the most prominent social factor complicating assimilation of immigrants in Europe. This suggests different outcomes for families originating from non-European and non-Christian countries.
Migrants in the Netherlands
After WWII, a significant number of immigrants from the former Dutch colonies in Indonesia and later Suriname arrived in the Netherlands. In the 1960s, “guest workers” from Turkey and Morocco were attracted by the availability of low-skilled jobs. In addition, a significant number of immigrants from neighboring Germany crossed the border, as the narrow cultural and linguistic distance between the two countries made it easy for them to move to the Netherlands. Immigrants from the former colonies and the Mediterranean countries were disadvantaged in the labor market (Zorlu and Hartog 2012). An initial lack of productive skills and a tendency to adapt slowly to the host society has arguably led to a persistent ethnic gap among immigrants. This disadvantage has been passed on to members of the second generation, many of whom have improved their position but have been unable to catch up in terms of employment, job quality, and income to their native counterparts (Ali and Fokkema 2015; Crul and Doomernik 2003; Jongen et al. 2019; Van Ours and Veenman 2003). Ethnic disparities vary by the immigrants’ country of origin though. Most immigrants from Turkey and Morocco are in a poor SEP, and their children, the second generation, still appear to suffer from a substantial share of the disadvantages experienced by their parents (Van Ours and Veenman 2003). The children of immigrants from former colonies have been able to substantially improve their SEPs relative to those of their parents (Falcke, Meng, and Nollen 2020).
So, our question is whether the grandchildren of migrants with various migration histories and cultural backgrounds have caught up to their parents and their native Dutch counterparts, to see whether there are any remaining disparities due to ethnic affiliation. Compared to the earlier generations, the “third generation” is relatively small in numbers. Particularly Moroccan-Dutch and Turkish-Dutch origin groups have only recently started to enter the labor market. Yet, we may gauge their position at a younger age, and see whether they further improve their position compared to their elders. In addition to family status, the timing of their entry may also matter. Like many European countries, the Netherlands has an aging population and the baby boomer generation has mostly retired from paid labor. This demographic transition leading to new labor market shortages may provide new opportunities for the grandchildren of immigrants, mitigating the adverse effects of historically rooted social, political, and economic structures (Alba and Foner 2014).
Measurement of Intergenerational Mobility
We aim to assess to what extent children from low-income families improve their position relative to children from low-income families and how this relative mobility varies across ethnic groups. To measure this relative income mobility, we apply the rank-rank estimation, similar to that of Chetty et al. (2014, 2020). This approach has become increasingly popular in recent empirical studies (Jongen et al. 2019; Mogstad and Torsvik 2022), compared to the canonical measure of relative mobility, i.e., the intergenerational income elasticity (IGE); the elasticity of the child's income with respect to the parents’ income. 2 The rank-rank approach allows to include children and parents with very small and zero income in the analysis and, produces stable estimates of intergenerational income mobility, as opposed to the IGE (Chetty et al. 2014, 2020). In addition, this approach is insensitive to changes in inequality within a generation and performs well when the incomes of children and parents are measured in different life cycle stages, i.e., at early ages for children and older ages for parents (Mogstad and Torsvik 2022).
An established method of measuring relative intergenerational mobility is regressing child 's income percentile rank (

Chetty et al. (2020) show that the mean rank of children from migrant group m converges in the long run to a steady state (SS), assuming the absolute and relative parameters do not vary across generations.
3
This SS mean income rank is given on the bases of linear function (1) for migrant group m as

Essentially, the differences in the relative mobility parameter
Data
Our empirical analysis uses the population registers data from Statistics Netherlands (CBS) from 2017 and 2018, which include population and tax registers. Second-generation individuals are identified on the basis of their parents’ country of origin. If an individual has at least one immigrant parent, this individual is identified to be second generation. Subsequently, children from families in which at least one parent belongs to the second generation are characterized as belonging to the third generation. So, this selection includes children from intermarriages. Acknowledging the role of intermarriages in the assimilation process, we distinguish between third-generation children from fully second-generation families (both parents are immigrants from the same country of origin) and those from mixed second-generation families, i.e., second-generation parent and a second-generation parent of another origin or of Dutch origin. 4 Children growing up in households with intermarried parents may benefit from this marital assimilation since intermarriage is linked to weaker ties to ethno-racial identification and a higher socioeconomic status (Jiménez et al. 2018). Intermarriage rates are typically low for low SES-groups and their children (second generation) but it is growing across generations (CBS 2017).
For this study, we focus on a custom-made dataset of the children of the second generation; i.e., the third generation. Relevant characteristics of their parents and grandparents are taken into account as background variables of these third-generation “children.” In addition, a 5 percent sample of “Dutch” individuals is used as a reference group. Since we are interested in income outcomes, we restrict our analysis data to a sample of individuals aged 20–30 who are not co-residing with their parents. The use of age restrictions is important when conducting our comparative analysis, as the age distributions of the third generation vary across origin groups, with the third generation from the Moroccan and Turkish origin groups being relatively young. The number of third-generation children from the Moroccan and Turkish origin groups who are older than 30 is still very small, making it difficult to perform a meaningful statistical analysis.
Variables
Most variables are measured for two generations in our data: namely, for the children of the second generation and their parents. Since the age distribution of demographic groups is different despite the relatively narrow age range of our study population, we also include mothers’ age in the analysis.
Migrant (ethnic) origin
We distinguish six demographic groups: native Dutch (i.e., Netherlands-born grandparents) and five groups of the third generation: German, Indonesian (Indish), Surinamese, Turkish, and Moroccan. For some of our analyses, we split up the third-generation groups into two subgroups: “full third generation” (both parents are members of the second generation from the same country of origin) and “mixed third generation” (one parent from another ethnic origin—Dutch or other ethnic groups). Our data do not suffer from the problem of ethnic attrition, as pointed by Duncan and Trejo (2011), since the third generation (and also second generation) is drawn from the population registers, rather than from a self-reported ethnicity questionary. To be clear, these young adults are nearly all Netherlands-born Dutch citizens, and it is solely for the sake of clarity that our findings refer to them based on their grandparents’ countries of origin.
Income and wealth
The data include three measures of income by percentile rank for the children and the parents: Personal income, household income, and wealth. Personal income includes income from employment and self-employment, and disability and social security benefits (with the exception of child allowance and child budget). Premiums for disability benefits have been deducted from personal income. Household income refers to the standardized disposable income of the household. Another key variable is the wealth variable, which refers to the balance of assets and liabilities. The assets consist of financial assets (bank balances and securities), real estate, and business assets. The debts include mortgages for an owner-occupied home and consumer credit. This variable covers registered assets in the Netherlands and does not cover any credit built up in savings or life mortgages, pension or annuity entitlements, or unregistered assets like jewelry of antiques (CBS). 5 We use income in percentiles to evaluate relative intergenerational income mobility.
Socioeconomic position
The variable SEP is determined on the basis of each individual's main activities in a calendar year. SES is recoded into four categories: employee, self-employed, student, and other.
Educational level
Educational achievements include 18 categories defined according to ISCED-F 2013, with one being the lowest level and 18 being the highest level. Taking these categories as a proxy of years in education, we use this variable as a continuous variable. The variable is also aggregated to four categories.
Household and spatial variables
There are several variables that reflect the household status and the social and built environment. The “household members” variable reflects the number of persons in the household. The “position in household” variable identifies the role of the individual. The “spatial distance” variable indicates the distance in kilometers from the parents’ neighborhood. The “share of own group” variable measures the concentration of co-ethnics (first-generation immigrants) in the neighborhood. Lastly, the “urbanization degree” variable measures the degree of urbanization of the municipality and is constructed based on address density. This variable has five levels: urbanized areas with 2,500 or more addresses per km2; urbanized areas with 1,500–2,500 addresses per km2; moderately urbanized areas with 1,000–1,500 addresses per km2; less urbanized areas with 500 to 1,000 addresses per km2; and nonurbanized areas with fewer than 500 addresses per km2.
Descriptive Statistics
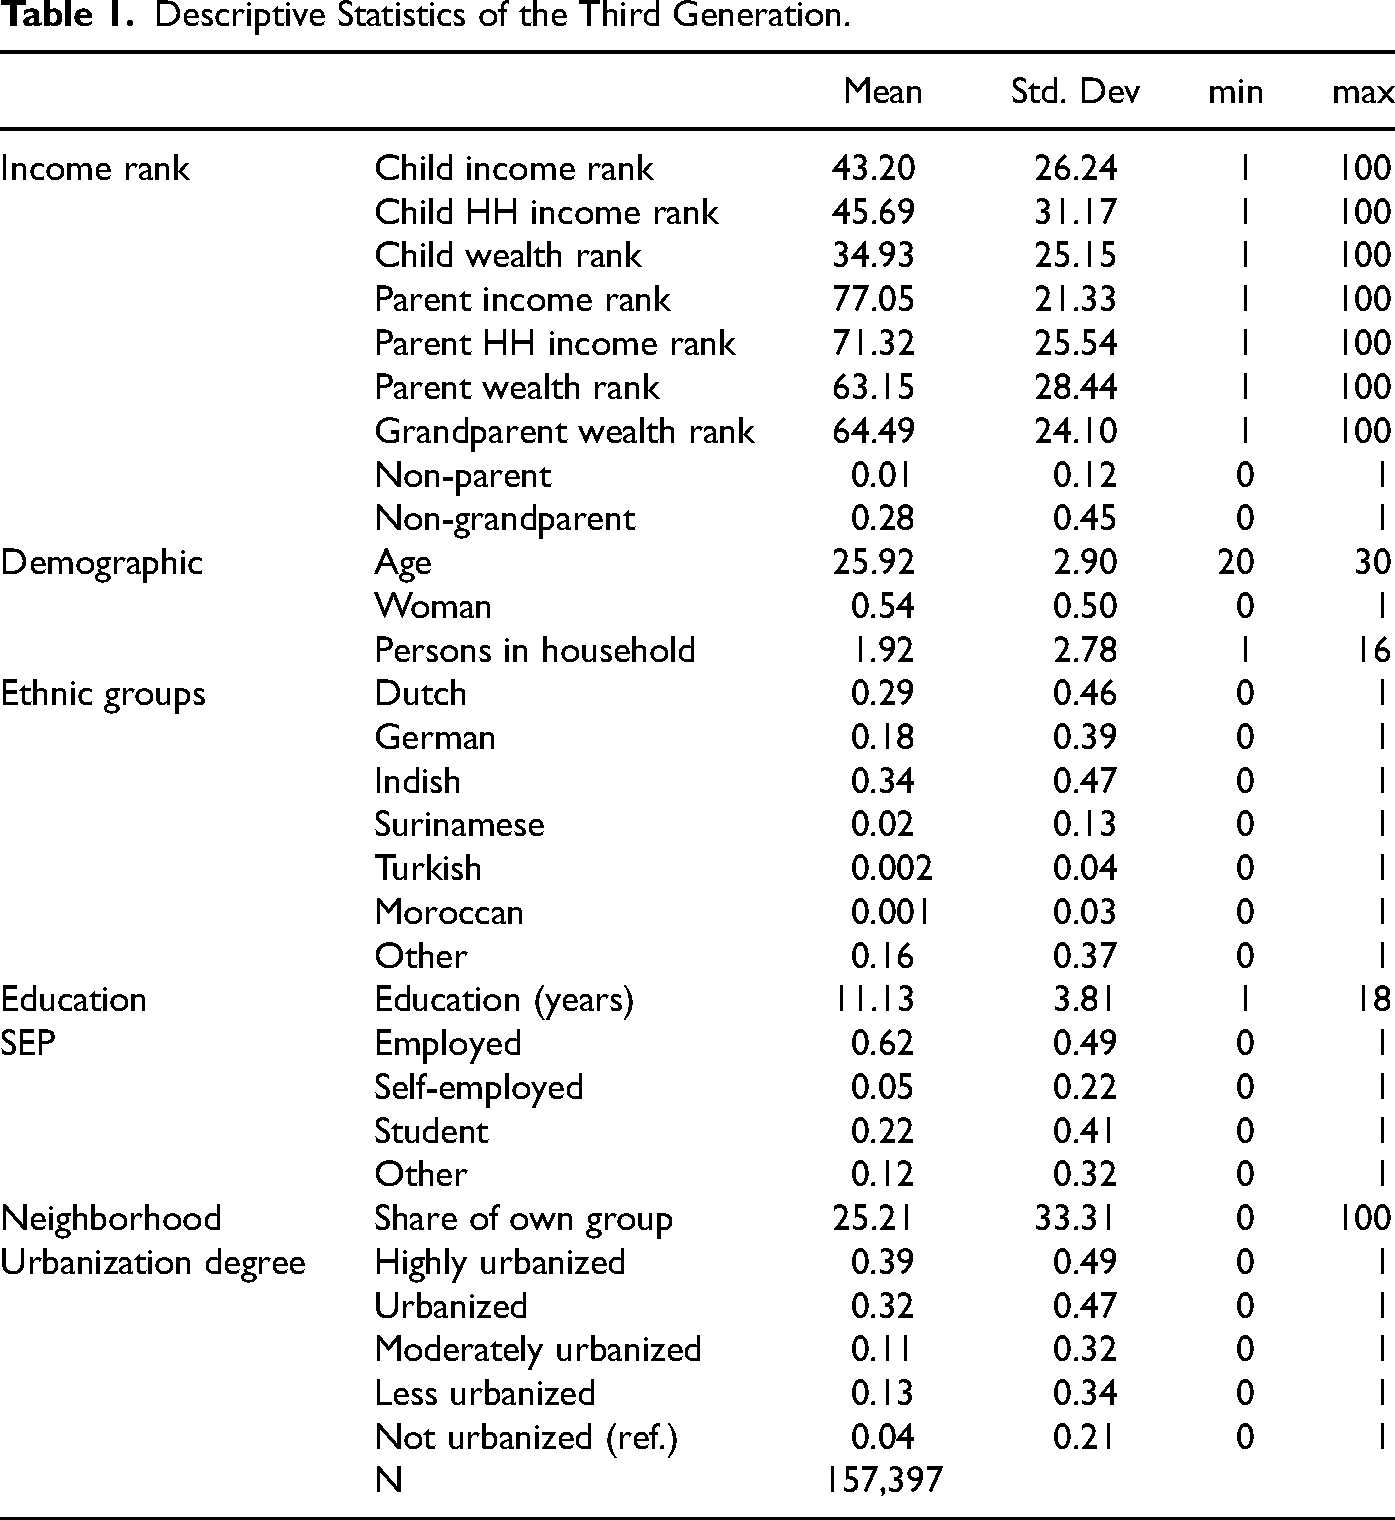
Table 1 lists the variables used in this study with their descriptive statistics. The sample includes individuals aged 20–30 who are not co-residing with their parents. It is worth to note that the “sample” size and the family background of the ethnic groups vary considerably. Our data include a small number of the third generation with Turkish and Moroccan background, 297 and 172, respectively. In addition, a large proportion of individuals are not from original immigrant groups and this proportion varies across the groups. Only 3.8 percent of Germans, 6.7 percent of Indish, 6.5 percent of Surinamese, 11.5 percent Moroccan and 17.5 percent of Turkish groups are children of two second-generation parents of the same origin. The remaining shares are from mixed families (see data). As mentioned, these family backgrounds will likely impact assimilation patterns. For the children and the parents, three measures of income percentile rank are given: personal income, household income, and wealth. The mean values of the children's income items are much lower than those of the parents. The lowest mean income item is wealth, at about 35 for the children and 63 for the parents. The highest mean income item is household income, at 46 for the children and 71 for the parents. The mean value of the personal income rank is about 43 for the children and for the parents. The mean age of the individuals in the sample is almost 26 years, and more than half of the respondents (54 percent) are women. The mean household size is 1.92 persons, and the mean education years is about 13 years on a scale of one to 18. About 67 percent of the respondents are employed, while 22 percent are in education. The average share of first-generation immigrants of the “own group” in the neighborhood is 25 percent. Most of our study population are residing in urbanized municipalities.
Descriptive Statistics of the Third Generation.
The income levels of the young adults are expected to be sensitive to age given the age distribution of our sample by ethnic group. Table AI1 in the Appendix I shows the mean ages of the children (i.e., the young adults of the third generation), the parents, and the grandparents by country of origin. The mean age of the third generation is 26 for the Dutch, German, and Indish children; 25 for the Surinamese children; and 24 for the Moroccan and Turkish children, who are the youngest groups. Accordingly, the parents of the Moroccan and Turkish third generation are also young, mainly under age 50; and most of their grandparents are between ages 70 and 75. The Dutch, German, and Indish subsamples have the oldest parents and grandparents: on average, their mothers are age 56, their fathers are 2 to 3 years older than their mothers, and their grandparents are between ages 80 and 81. Meanwhile, the Surinamese parents and grandparents are, on average, 2–5 years younger than the oldest group, but 2–6 years older than the youngest group.
Figure AI1 in Appendix I depicts the distribution of the children's personal income ranks (percentiles) by ethnic group. The Dutch (labeled “NLD”) and German children are concentrated in the higher income percentiles, while the Moroccan, Turkish, and Surinamese children are heavily represented in the lower levels of the income distribution. We observe a concentration of almost all ethnic groups around the 15th percentile, but the density of this concentration is the highest for the Indish children and the lowest for the German and Dutch children. The density of Moroccan, Turkish, and Surinamese children is much higher up to around the median income level (50th decile), after which the density of the German and Dutch children goes up.
Figure AI2 in Appendix I depicts the distribution of the children's personal income and the parents’ household income with interquartile distances. As expected, the income distribution of the children is generally in lower percentiles than those of their parents. We do see some notable differences between and within groups. The interquartile distances of parental household income for the Dutch, German, and Indish groups even exceed the median. The median of the low-income groups (Moroccan and Turkish) is very close to the national income median. Interestingly, the interquartile part of the household income of the Moroccan and Turkish children overlaps with the second quartile (Q2) of the parents’ household income. The differences between the children's and the parents’ income levels are much smaller for these low-income groups. Indish children show a distinct pattern: i.e., their income is more dispersed, leaning toward lower levels, while the income distribution of their parents is similar to that of the Dutch parents. In sum, these figures already indicate that there are ethnic disparities in the income distribution of the parents and grandparents of the Moroccan, Turkish, Surinamese and Indish children relative to that of the “third-generation” Dutch.
Results of Intergenerational Income Mobility
General Pattern of Intergenerational Income Mobility
We first present the rates of intergenerational mobility by relating the children's personal and household income to various forms of parental income and to parental wealth. The rates of intergenerational mobility are estimated by the linear regression estimator, Equation 1, on the binned series in order to facilitate an intuitive interpretation over the full income distribution, while also estimating the intercept and slope parameters. Given the age distribution of our sample, our estimations control for age and SEP. Figure 1 shows binned scatter plots, which indicate that the conditional expectation of the children's income rank given their parents’ income rank, age, and SEP is almost linear. The fitted line is estimated with large standard errors in the upper percentiles, which implies that the correlation between the child's and the parents’ income is less clear for the highest-income families. These errors are partly due to the small number of children at the higher end of the income distribution. Nevertheless, the fitted lines depict absolute (intercept) and relative (slope) mobility. The absolute mobility is around 38 percentiles for the child's personal income (Figure 1a and b), 34 percentiles for the child's household income rank (Figure 1c), and almost 18 percentiles for the child's wealth (Figure 1d). Thus, the average personal income percentile is 38 when the parents’ income is at the bottom of the income distribution. This level is quite high. The lower level of wealth mobility compared to income mobility is understandable when we consider the ages of our “children” (20–30 years). Wealth accumulation is long-term process and is expected to be higher at older ages. Strikingly, the rate of relative mobility is high for the children's personal income (low slope parameter, about 0.07), while it is relatively low for the children's household income, and especially for the children's wealth (high slope parameters: 0.16 and 0.27). The relatively high slope parameters for household income and wealth imply that positive assortative matching keeps the children on the track of their parents, preventing intergenerational mobility since this indicates a high degree of reproduction of the parental wealth, which will be detrimental for children from low-income families.
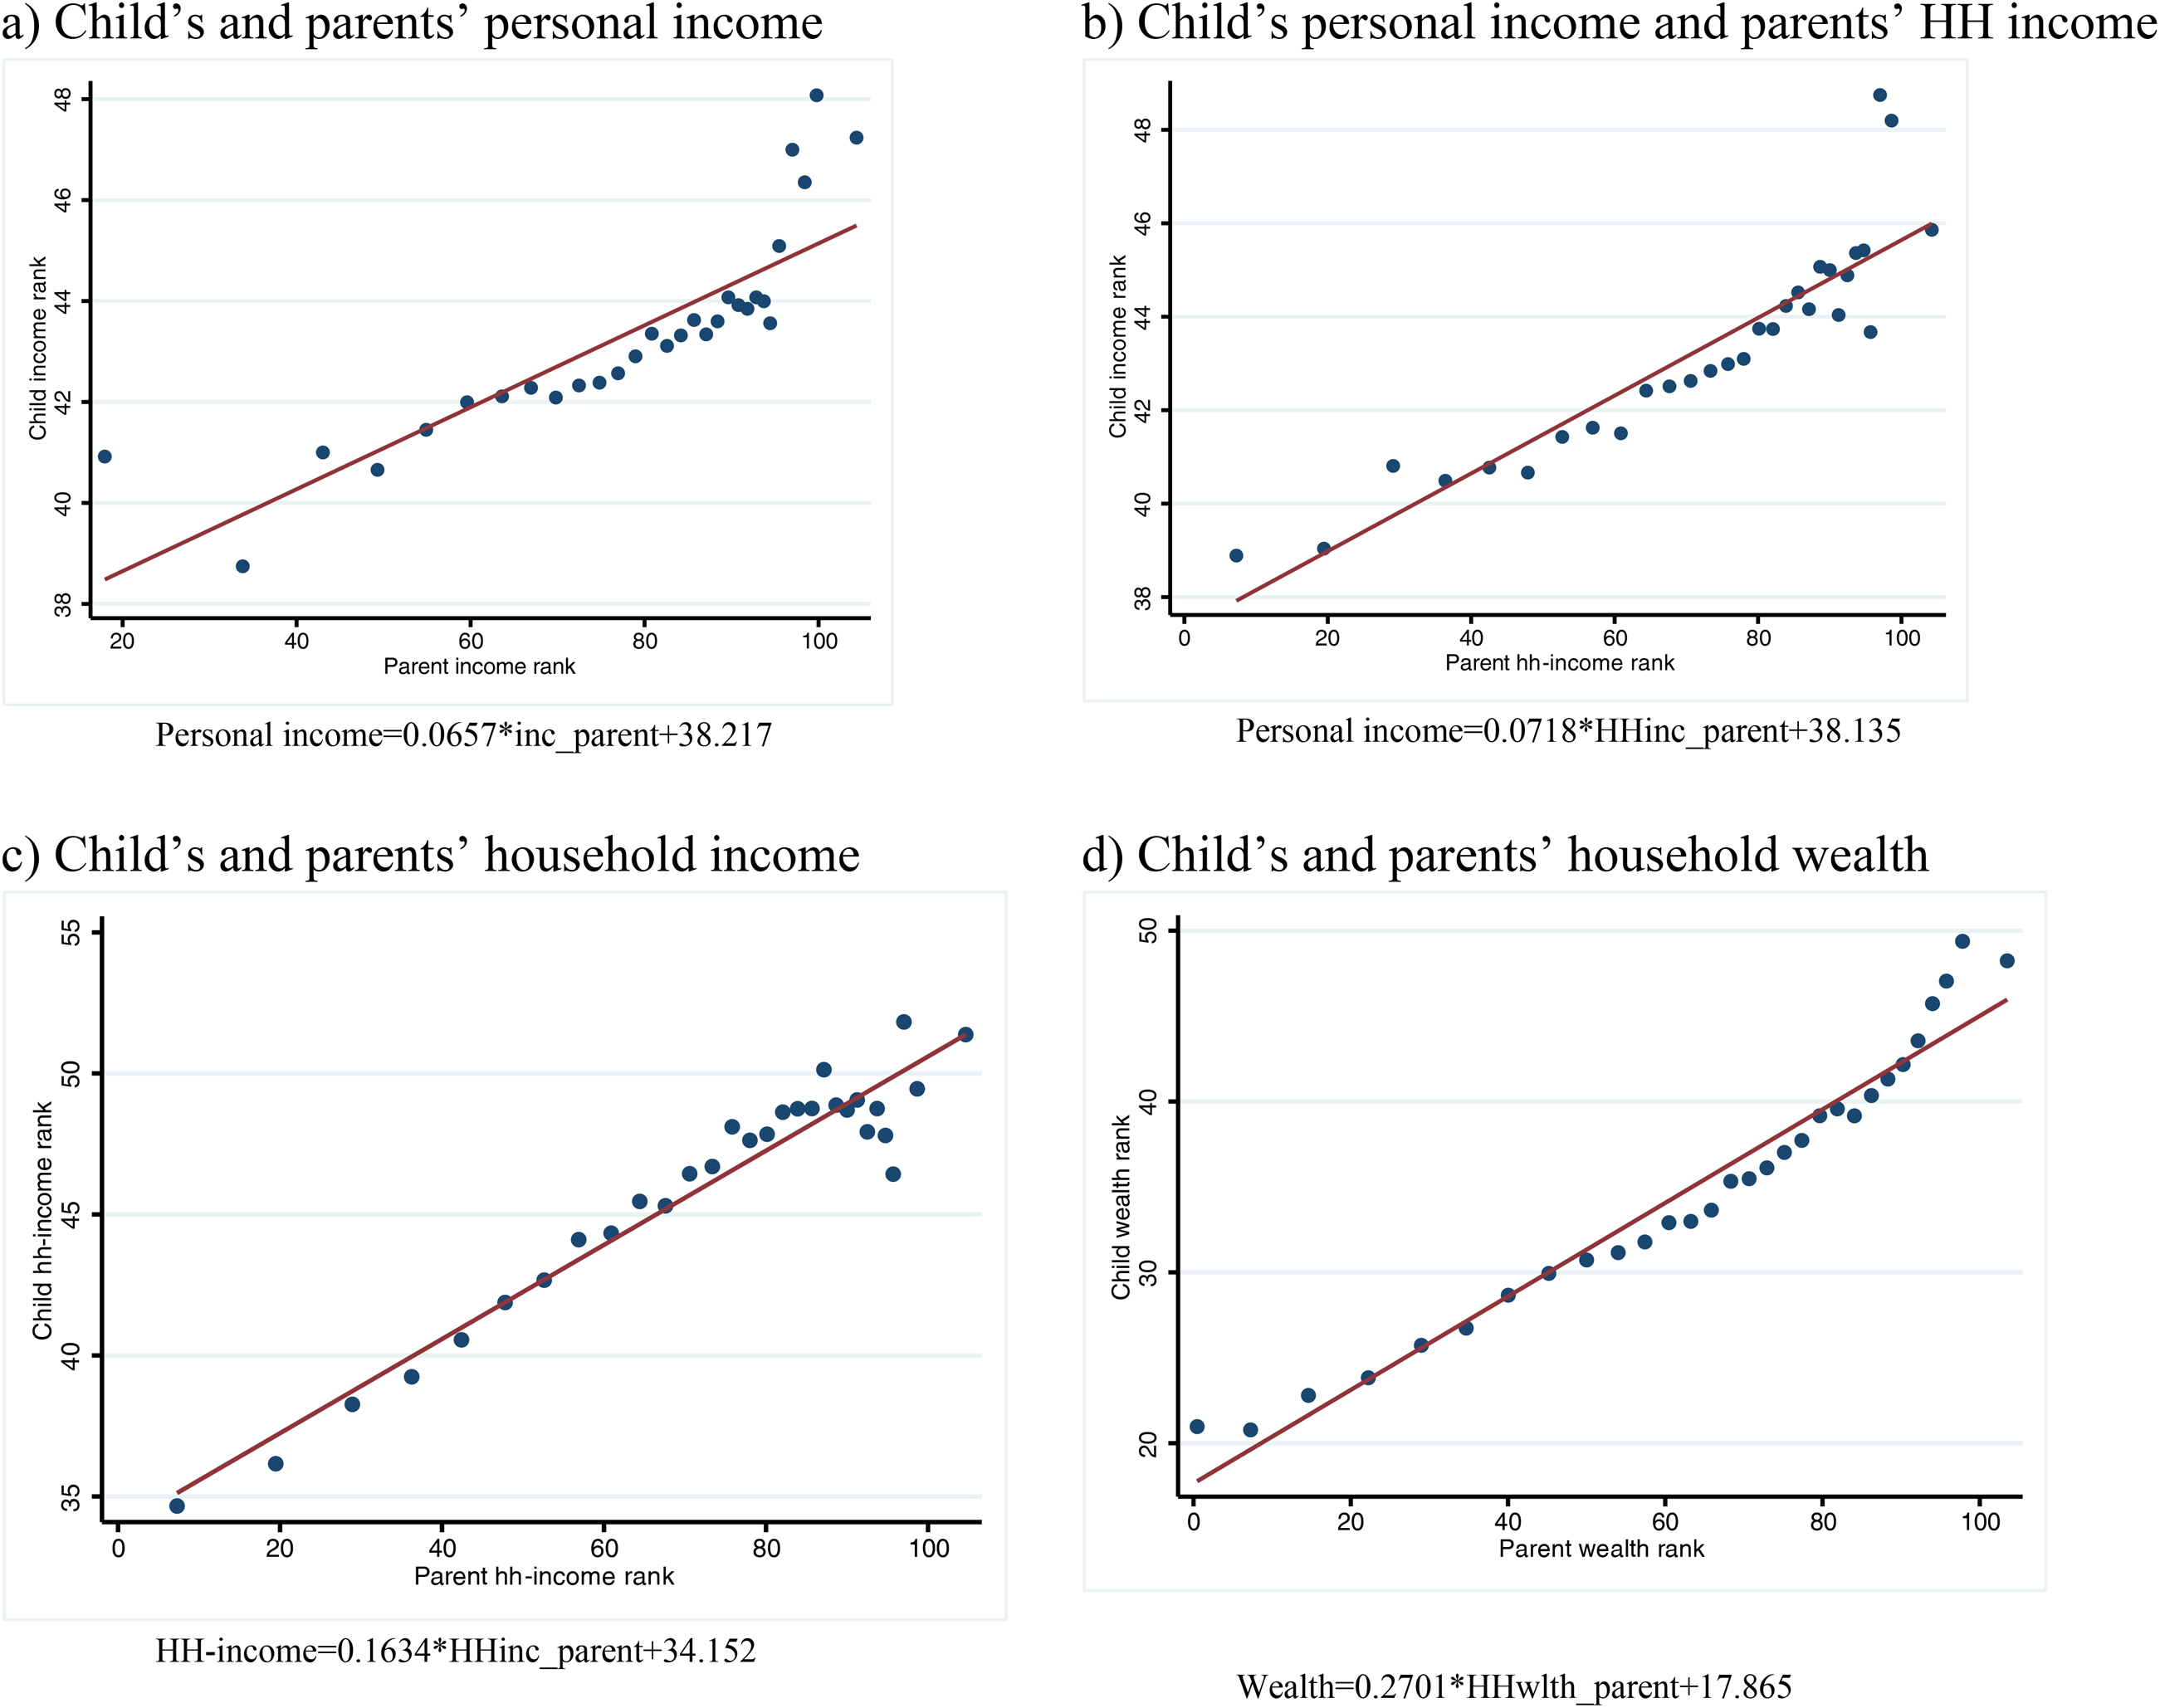
Intergenerational mobility by type of income.
Measuring Absolute and Relative Mobility
To evaluate how rates of intergenerational mobility determine the evolution of ethnic disparities, we use the Equation 1 in the “Measurement of Intergenerational Mobility” section, which allows us to summarize intergenerational mobility with the intercept (
Figure 2 depicts the rates of intergenerational mobility by migrant group. In order to evaluate ethnic disparities in the rates of absolute and relative intergenerational mobility, each figure compares a migrant group with the Dutch sample. The intercept (
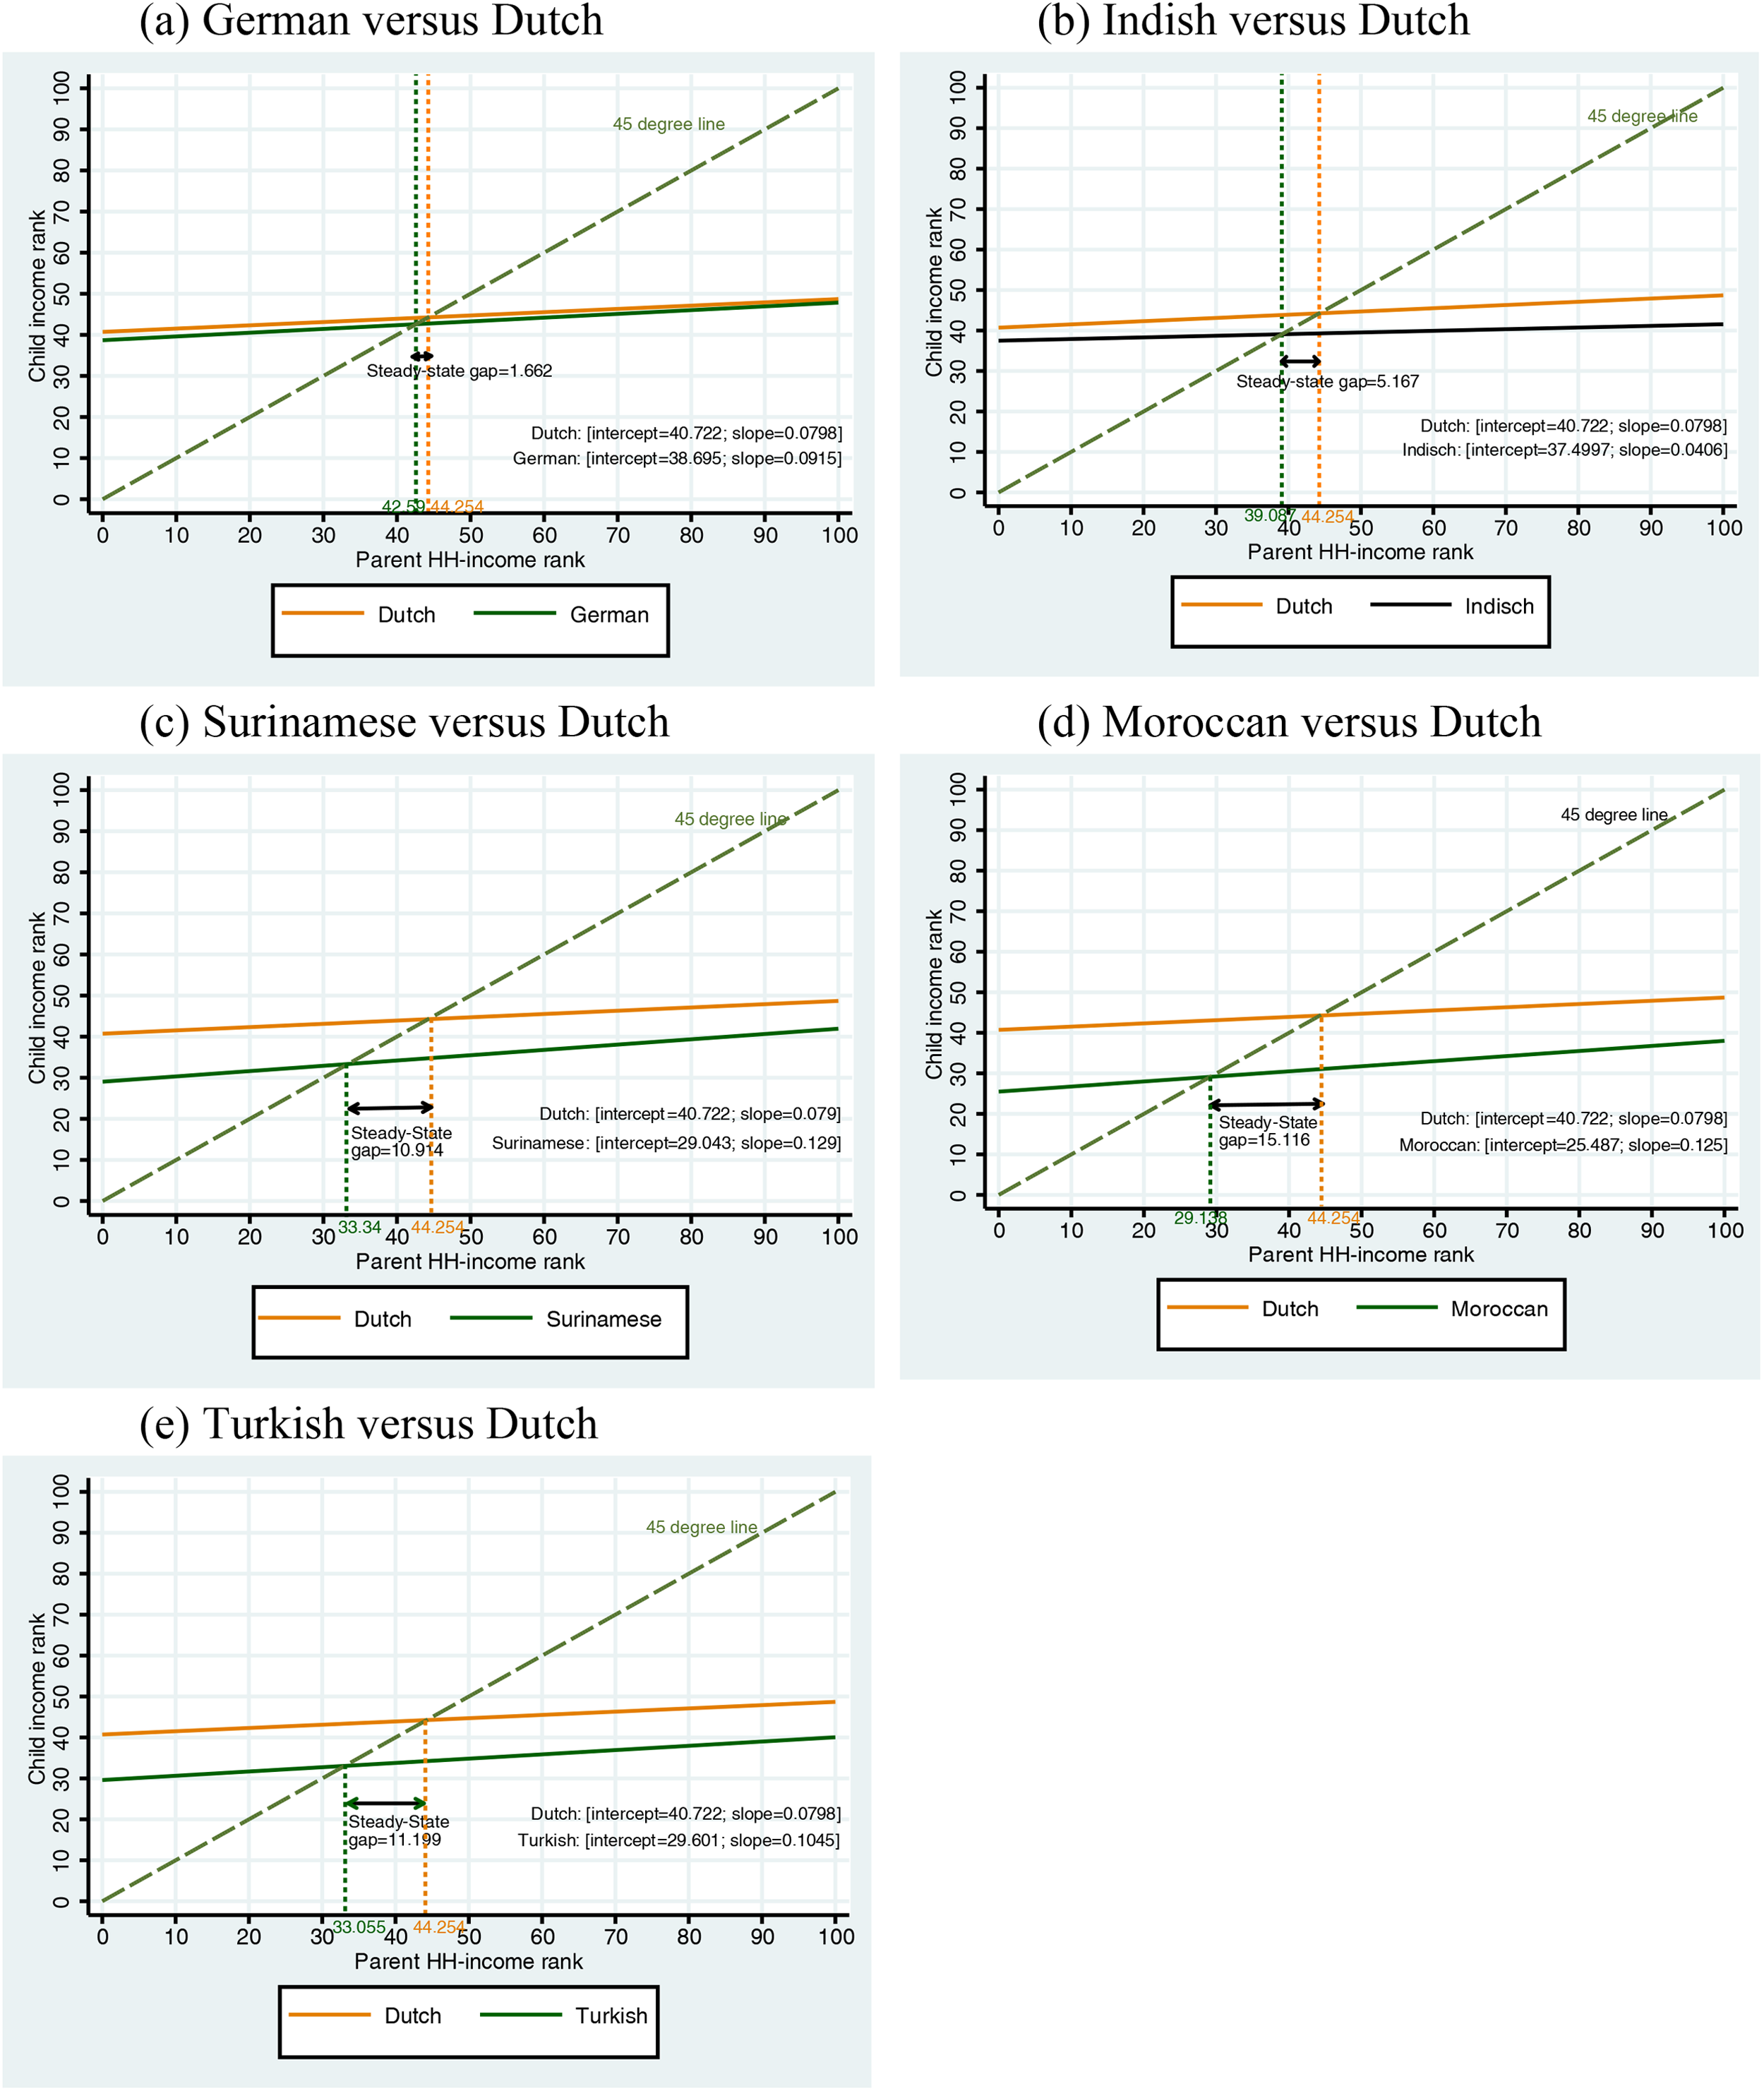
Ethnic differences in absolute and relative intergenerational mobility.
Overall, these results reveal that the current ethnic disparities are primarily driven by intergenerational gaps rather than by transitory factors, such as temporary supports, as the magnitude of the ethnic gap is very similar to that of the gap in the SS for all origin groups. This finding is comparable to findings for the United States by Chetty et al. (2020). Thus, it appears that ethnic disparities can be diminished by reducing intergenerational gaps, i.e., disparities between the income levels of children and their parents. That means that children from low-income families can realize significant income mobility through educational attainment and successful labor market participation to resolve interethnic differentials over generations. An associated policy implication is accordingly providing support to ensure access to education and labor markets.
Explaining Ethnic Gap of Income Rank
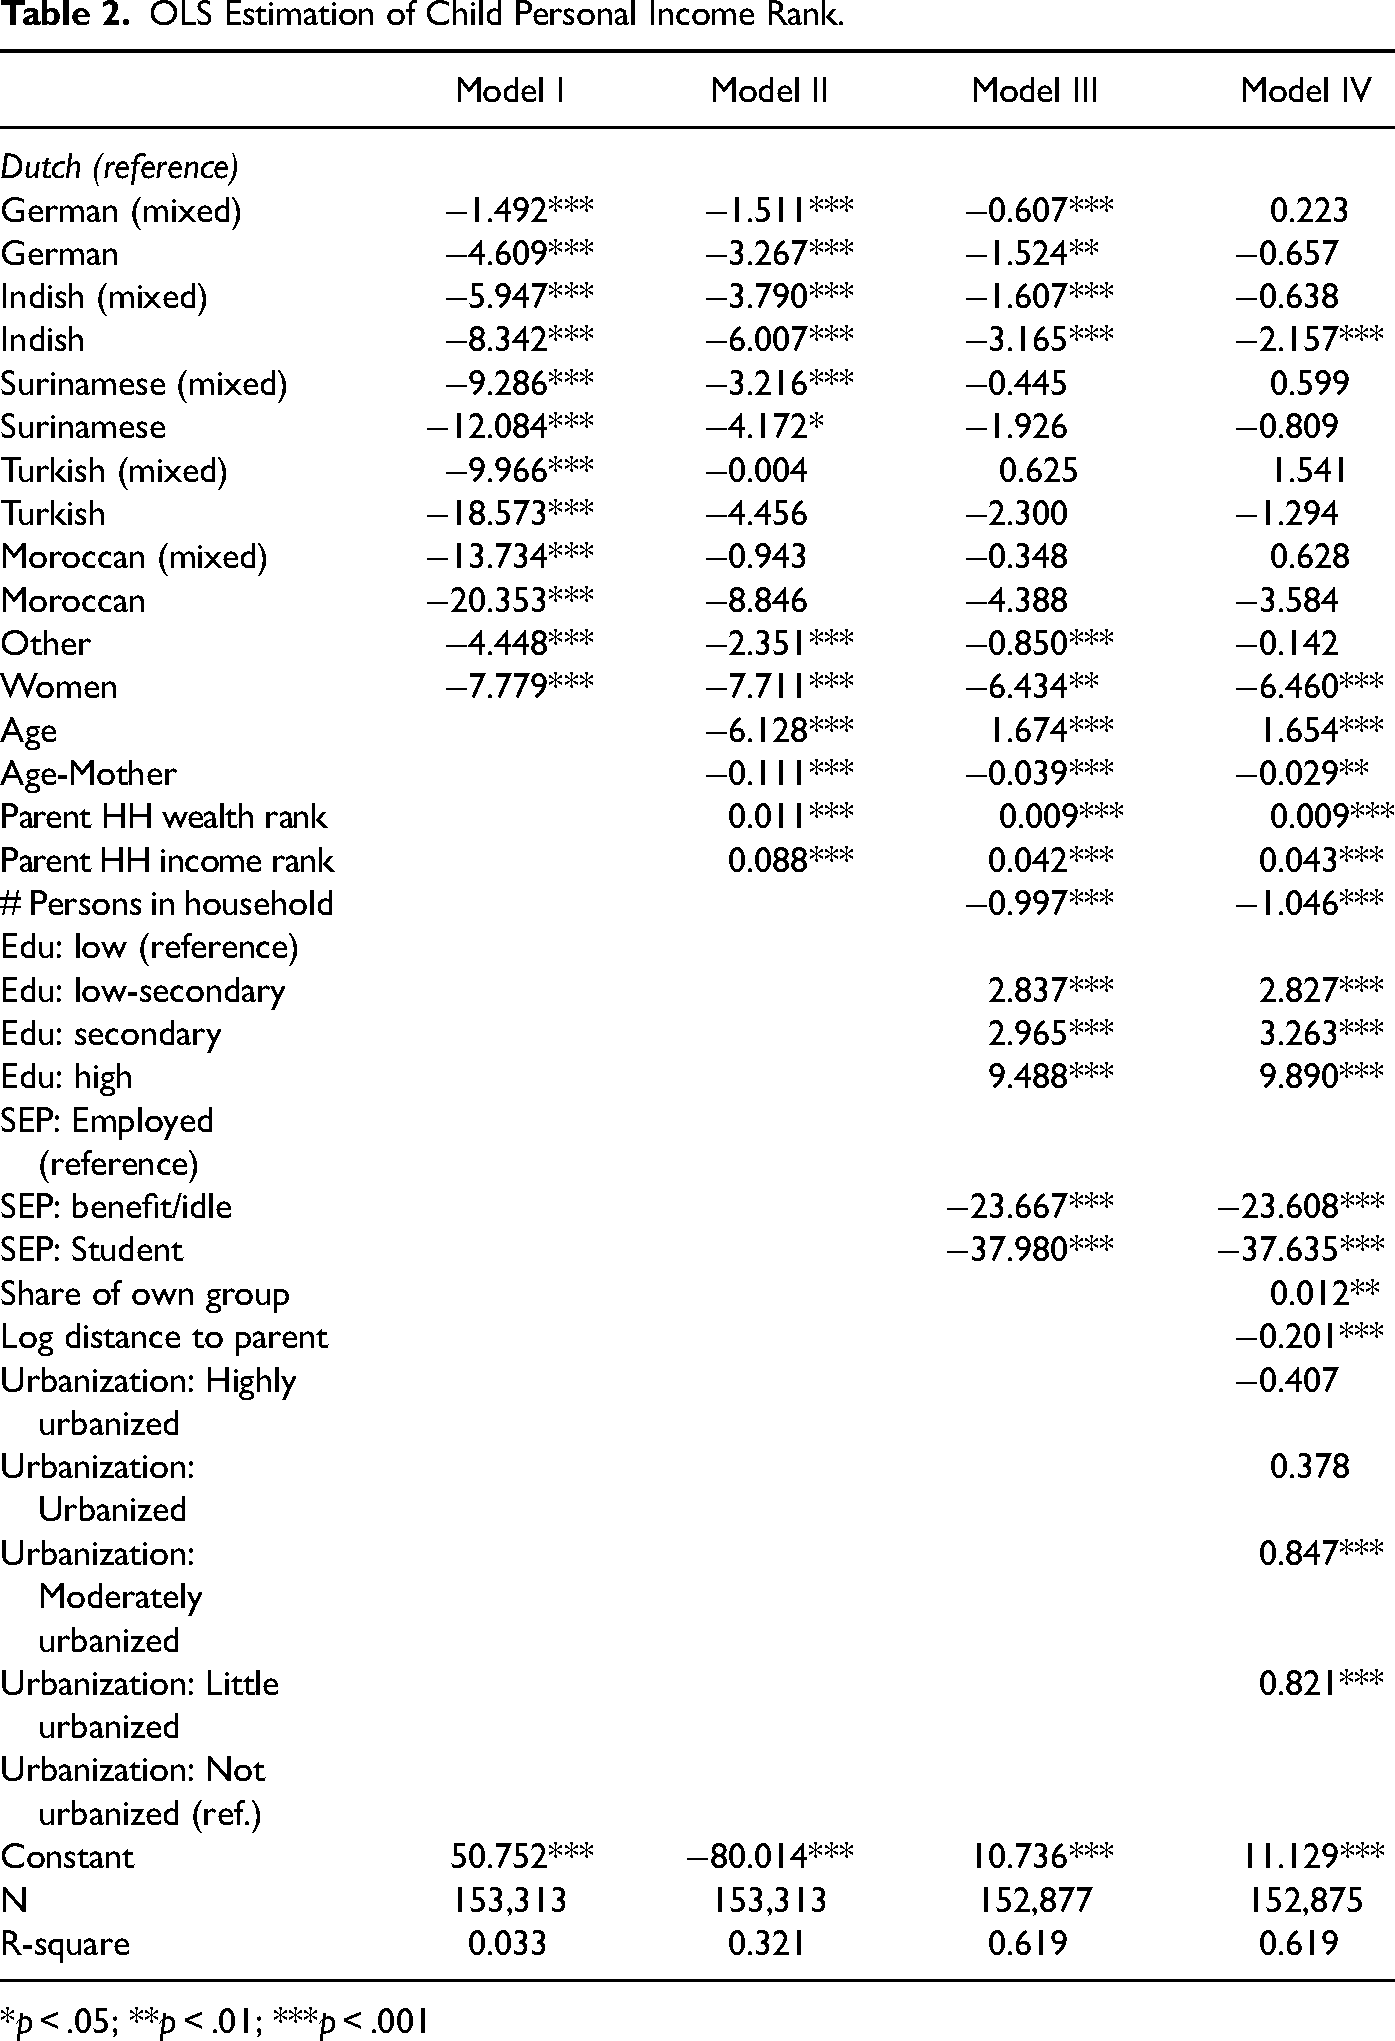
In order to understand the effects of separate predictors on the Dutch-migrant gap in income rank, we estimate four regression models. The estimation results are presented in Table 2. The baseline model (Equation I) includes the only family origin and gender and shows that the ethnic gaps in personal income rank relative to that of the children with native Dutch origins are similar to those found in the analysis of absolute mobility in the “Data” section. The largest gaps are detected for the Moroccan and Turkish children whose grandparents have a relatively short history in the Netherlands; followed by for the Surinamese and Indish children, whose grandparents’ migration paths were shaped by Dutch colonial history. Most of these grandparents arrived after Indonesia (1945) and Suriname (1975) became independent and are both former colonizers and subjects. Compared to other immigrants, their linguistic and cultural distance with Dutch society was relatively small. The smallest gap is found for the children of German families who are culturally and geographically close to the Dutch, and whose migration background is largely unrecognizable. Another striking result is that there are substantial differences between the children from mixed and non-mixed families within each migrant group, which is in line with the prediction of assimilation theories (Alba and Nee 2003; Jiménez et al. 2018). The mixed group is made up of children who come from a family in which one of the parents is of native Dutch origin. The difference is about three points for the Indish and Surinamese children and is more than seven points for the Turkish and Moroccan children.
OLS Estimation of Child Personal Income Rank.
*p < .05; **p < .01; ***p < .001
Model II adds age and three other variables that capture the parental economic position: Parental age, household income, and wealth. As expected, the coefficients of all these additional variables are highly significant. The parental household income has a greater effect than parental wealth while age is a powerful predictor of income. Including these variables results in that the gaps for the Moroccan and Turkish children are no longer significant and reduces the ethnic gap sharply for the Surinamese children and to less extent for the Indish and German children. Some exercises show that the ethnic gap for the Turkish and Moroccan children is mainly driven by their relatively young ages. After controlling only for age, the estimate of the ethnic gap turns out to be statistically insignificant for these groups. The third model includes number of household members, educational level, and SEP. As expected, SEP and educational level are powerful predictors of income. Controlling for these variables substantially reduces the ethnic origin gap in the magnitude of the estimates. The gaps for the Indish and German children shrink considerably but remain statistically significant. The gap for the Surinamese children is no longer significant though. This suggests that the gap for Surinamese may be attributed to their SEP.
Model IV also includes spatial variables: Fraction of co-migrant group in the neighborhood, logarithm of the distance to the parents’ neighborhood, and the degree of urbanization of the municipality. Controlling for these spatial variables leads to a decline in the ethnic gap parameters of Model III. The estimated gap for German and Indish children with mixed parents becomes insignificant, which is possibly driven by the correction for the concentration of Germans along the border, where income is relatively low. The share of own group in the neighborhood appears to be associated with a higher income rank while living farther away from the parents is associated with a lower income rank. These additions lead to slight changes in the parameters of the Model III variables. The coefficients of the degree of urbanization show that the income rank is higher for the children in less and moderately urbanized areas. Further experimentation with these spatial variables indicates that the concentration of own group is mainly responsible for the decline in the ethnic gap, although this seems to have a modest positive effect on the income outcomes (“neighbourhood effect”).
Decomposition of Mean Income Ranks
To uncover the contribution of separate variables to the ethnic differential in the mean personal income rank, we use a standard Oaxaca-Blinder decomposition analysis (Jann 2008).
7
The decomposition analysis uses separate regression models for ethnic origin groups to predict the income rank from the observed characteristics of individuals, is given by (equations 4 and 5). This analysis decomposes the native-migrant origin group differential in the mean income rank into two main components: one component, the so-called explained component, is attributed to the explanatory variables used and, the remaining component, the so-called unexplained component, cannot be attributed to the explanatory variables. Because income is measured in percentiles in the national income distribution, linear regression models are used for the Dutch origin group (denoted by subscript 


Decomposition of Child Wealth Percentiles.
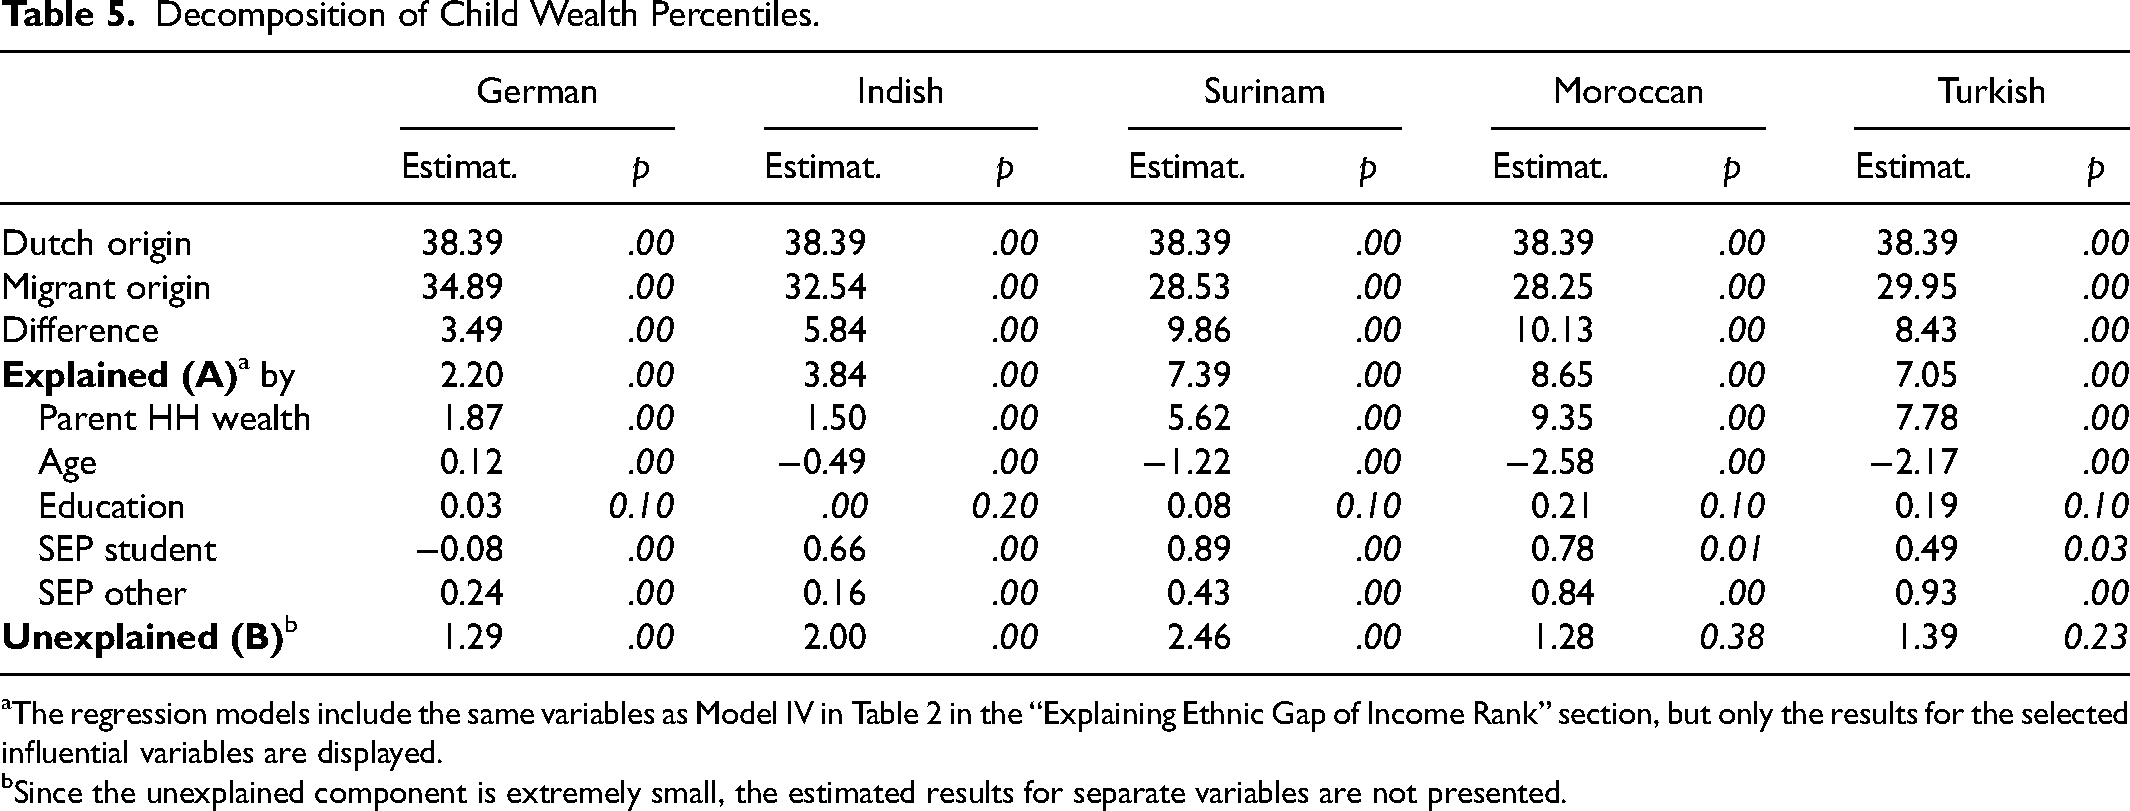
The regression models include the same variables as Model IV in Table 2 in the “Explaining Ethnic Gap of Income Rank” section, but only the results for the selected influential variables are displayed.
Since the unexplained component is extremely small, the estimated results for separate variables are not presented.
Decomposition Results
Estimating the parameters underlying the OLS models for the Dutch and for the separate ethnic groups (Equations 4 and 5), we decompose the mean incomes ranks into explained and unexplained parts as Equation (6). Both parts are also attributed to the variables in the regression models. In fact, the potential sources of a Dutch-migrant gap are identified and quantified in detail. The main decomposition results of personal income, household income, and household wealth are given in Tables 3–5, respectively. We present the mean values, the difference in the means, the explained part together with the contribution of selected variables, and the unexplained part. The unexplained part is very small and is often statistically not significant, and it is negative for almost all groups. These findings suggest that the predictors can explain the Dutch-immigrant gaps we found, and that the difference is even in favor of the migrant groups—in particular the Turkish children, for whom the unexplained difference (−2.03 points) is negative and significant.
Decomposition of Child Personal Income Percentiles.
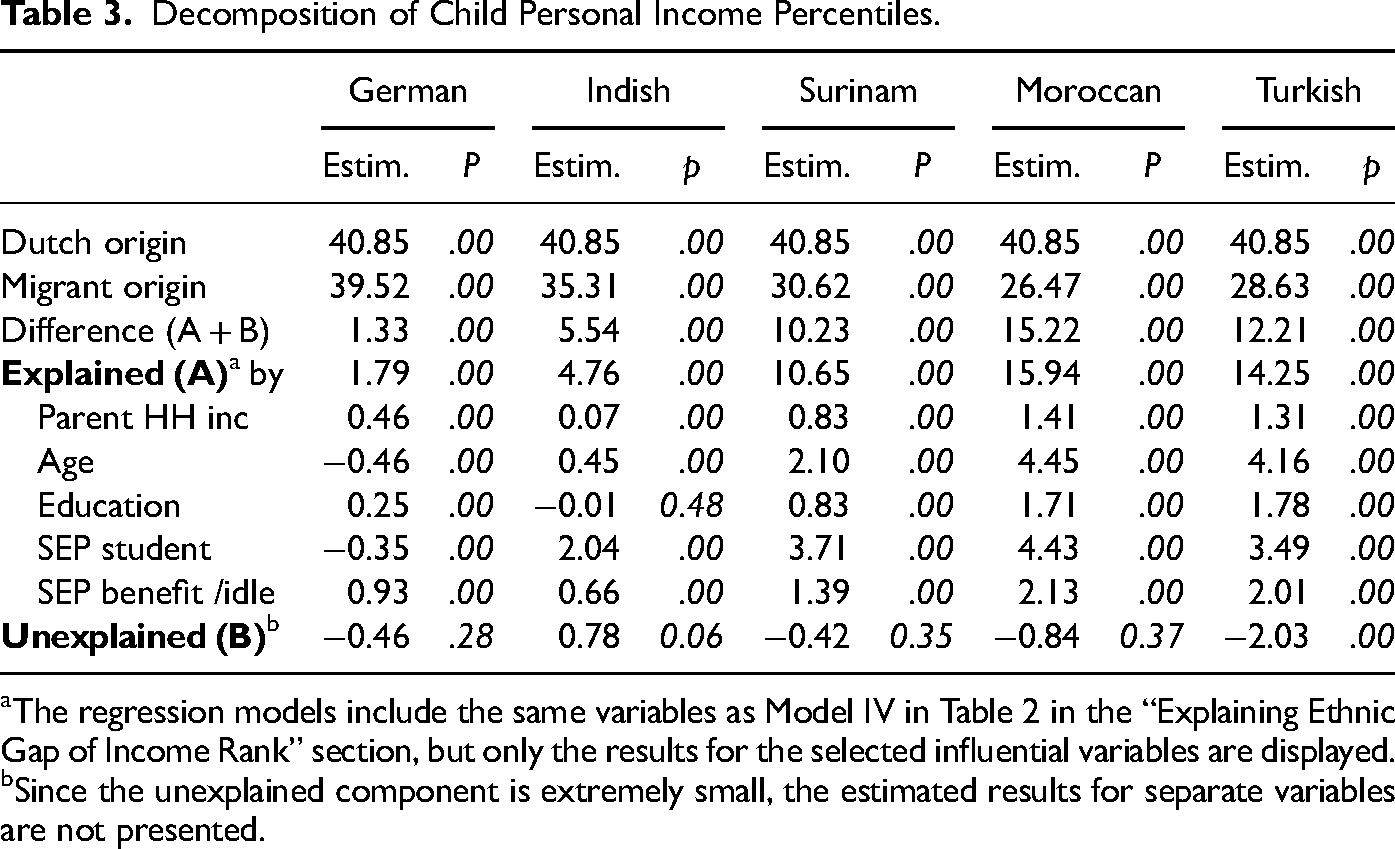
The regression models include the same variables as Model IV in Table 2 in the “Explaining Ethnic Gap of Income Rank” section, but only the results for the selected influential variables are displayed.
Since the unexplained component is extremely small, the estimated results for separate variables are not presented.
Decomposition of Child Household Income Percentiles.
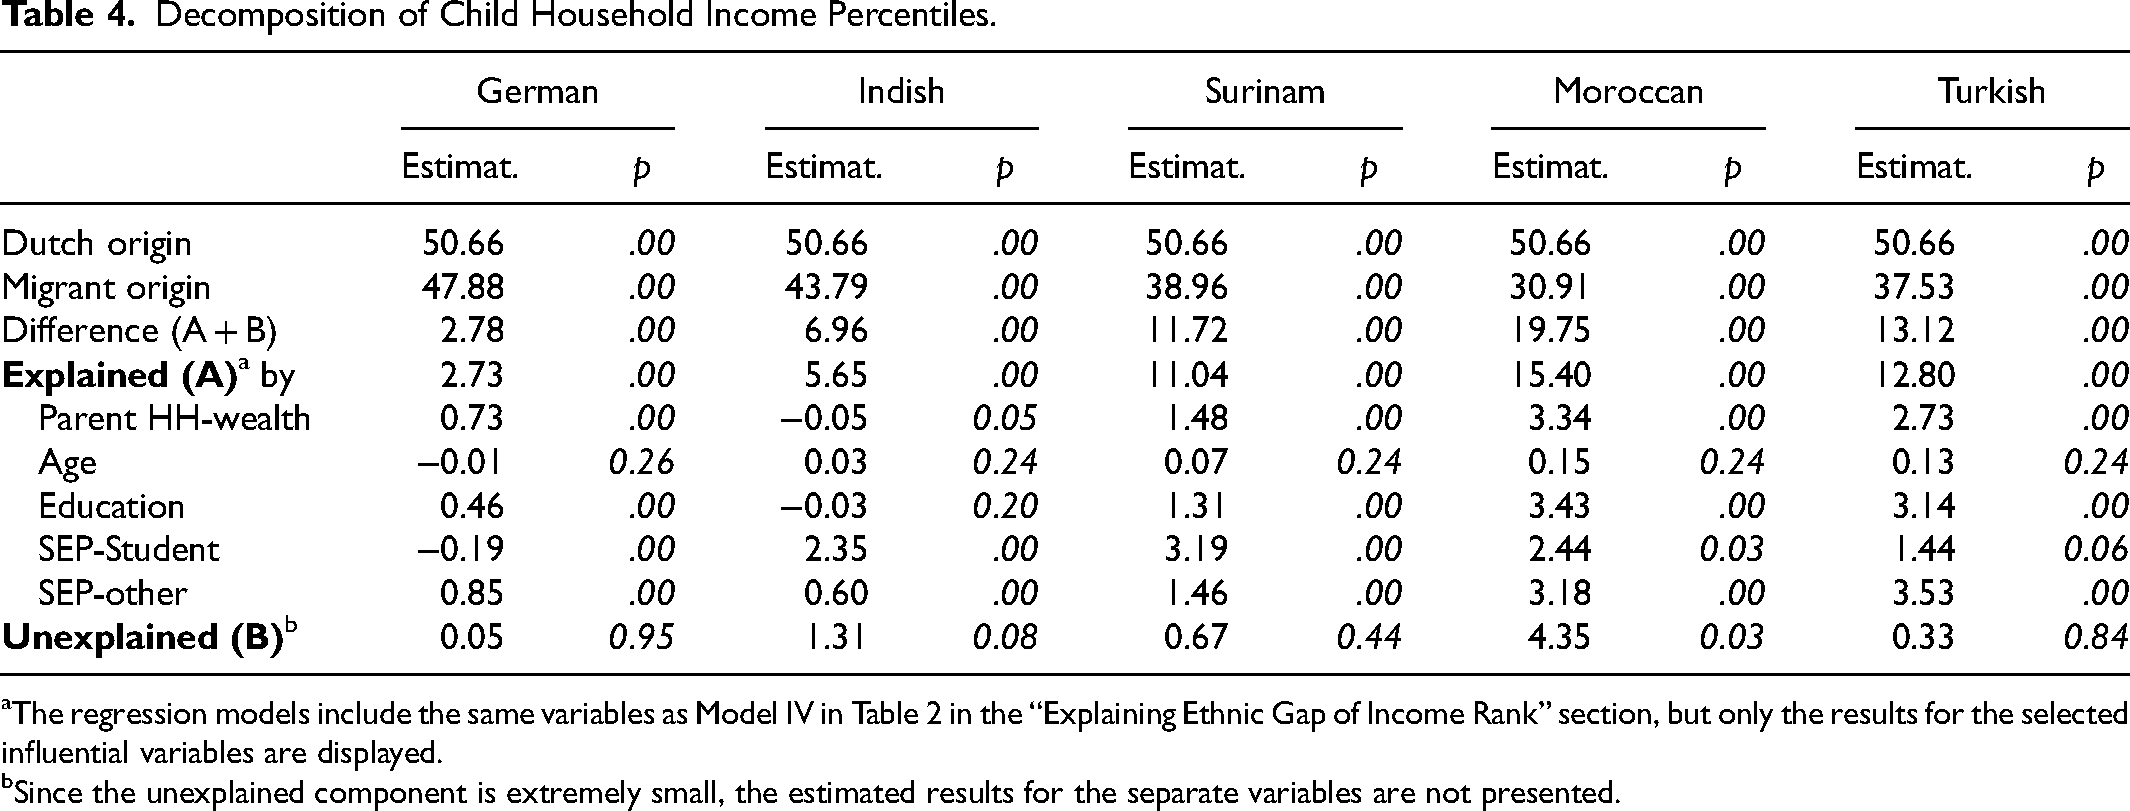
The regression models include the same variables as Model IV in Table 2 in the “Explaining Ethnic Gap of Income Rank” section, but only the results for the selected influential variables are displayed.
Since the unexplained component is extremely small, the estimated results for the separate variables are not presented.
Table 3 shows that the mean personal income rank of Dutch children is 40.85. In general, the migrant origin groups have lower mean income ranks, varying from 26.47 for the Moroccans to 39.52 for the Germans, causing gaps of 1.33 for the Germans, 5.54 for the Indish, 10.23 for the Surinamese, 14.38 for the Moroccans, and 12.21 for the Turks. For nearly all of the migrant origin groups, these gaps are explained by the predictors. The most important explanatory variables are age, SEP (student and benefit/idle), and parents’ household income and education. The large gap found for the Moroccan and Turkish children is attributable to the relatively young ages of these groups and their associated SEPs: i.e., many of these young adults are in education, and are not engaged in income-generating activities. Parental income accounts for 1.41 points of the gap for the Moroccans and 1.31 points of the gap for the Turks.
Table 4 indicates that the mean household income rank of the Dutch children is very close to the median, at 50.66. As in the case of the gap in the personal income ranks, the migrant groups have lower mean household income ranks. The largest differences are observed for the Moroccans, at 19.75; for the Turks, at 13.12; and for the Surinamese, at 11.72. Almost all of these differences are explained by the parents’ income, age, education, and SEP. Only the difference for the Moroccan children (4.35) remains significantly unexplained.
The ethnic gap in wealth differences in Table 5 has a pattern similar to that of the household income, but it is smaller for most of the migrant groups, except for the Germans. A large part of the gap is explained by similar variables. Strikingly, the parental wealth variable explains a substantial part of the gap. This is an indication of a strong correlation between the wealth of the children and the parents, and, correspondingly, of a substantial intergenerational transmission of wealth. This holds in particular for the Turkish and Moroccan families.
Conclusions
The aim of this paper was to evaluate the economic progress of third-generation descendants of migrants from an intergenerational perspective using register data. Our study mainly used three measures of income for the children and their parents: Personal income, household income, and wealth covering income earned from most potential sources collected by tax records. We used percentile ranks of income for the children and their parents and estimated a rank-rank specification with an approach similar to that of Chetty et al. (2020). This approach enabled us to measure absolute and relative mobility, and to uncover ethnic disparities in intergenerational mobility in view of three expectations at the end of the theory section.
First, we conducted a primary rank-rank analysis, which showed significant disparities in absolute and relative income mobility among migrants of different ethnic groups relative to young adults with Dutch grandparents. The largest disparities were found for Moroccan children, followed by Turkish, Surinamese, Indish, and German children. This rank order was shown to be robust to alternative measures of income, and confirmed the findings of the earlier studies, while also echoing perceptions expressed in public debates on integration. The analyses revealed that there are relatively high rates of intergenerational transmission of income among Turkish and Surinamese children. By contrast, the Indish and Moroccan children born to high-income parents were found to benefit less from parental affluence.
Subsequently, we examined ethnic disparities using linear regression models. This analysis showed that the sizeable income disparities observed in particular for the Moroccan, Turkish, and Surinamese third generation vanished when the estimations were controlled for age and SEP, signifying the relatively young ages of these groups. Interestingly, our study population has an overrepresentation of individuals with ethnically mixed second-generation parents, which in itself has been associated with economic assimilation (Alba and Nee 2003; Jiménez et al. 2018). Nevertheless, “third generation individuals” with two parents of the same origin also do not display an ethnic gap after controls. The only group that retains a difference in our model are children with two parents with an Indish migration background. Here, the gap was found to be robust to differences in age and SEP. This finding may be related to a large group of individuals of Moluccan descent who live in highly concentrated neighborhoods and have detrimental socioeconomic outcomes (Özer et al. 2017).
Lastly, to uncover the contribution of parental income to these ethnic disparities, a decomposition analysis was conducted for three measures of incomes. These analyses revealed that for almost all groups, ethnic disparities in mean personal income ranks are fully explained by age, education, and parental household income and SEP. A small difference (up to two percentiles) in mean household wealth remains unexplained by the variables we used only for the Indish, Surinamese, and German children. A difference of 4 percentiles in household income is unexplained for Moroccan children. This outcome contradicts the common assumption that the assimilation of migrant communities is primarily shaped by (religious) cultural distance from the host society and by migration motives (see Bonjour and Duyvendak 2018). Descendants of immigrants from a neighboring country (Germany) and the former colonies (Indonesia and Suriname) appear to have lower income levels, despite their linguistic, religious, and cultural similarities to the Dutch. On the other hand, our results indicated that the children of Moroccan and Turkish origin have achieved income parity with the native Dutch after controlling for the main individual and parental socioeconomic characteristics, even though their (grand)parents are perceived as being the least successful migrant groups due to their unfavorable cultural backgrounds and starting positions as unskilled “guest workers.” The observed differences in levels of economic assimilation over the long run are likely caused by group-specific factors, such as geographical distribution, family migration history, demographic structure, and other factors that shape the motivations and opportunities, rather than by supposed group disadvantages, religious beliefs, and sociocultural distance from the host society.
Overall, this study presents novel empirical evidence that the ethnic disparities in income among Dutch citizens born to second-generation migrant parents from various immigrant groups are fading; and, as such, provides us with insight into how post-war migrant groups are faring in Europe. The ethnic differences in income we observed are fully explained by differences in age and SEP. These findings confirm our expectations based on classical assimilation theory; particularly, the prediction that migrant families will undergo a process of “structural assimilation” over generations and in relation to the majority population (Alba and Foner 2015; Alba and Nee 2003; Algan et al. 2010; Jiménez et al. 2018; Tran and Valdez 2017). The still rather young members of the “third generation” of migrant families in our study reach parity with their native-Dutch counterparts when we control for socioeconomic conditions. One notable exception is the persistent ethnic gap for the grandchildren of Indish immigrants—a mixed group of former colonists, soldiers, and subjects with a longer history in the Netherlands.
There are also differences between origin groups (our third expectation), but these do not necessarily correspond to differences in the initial position of the first generation. Even descendants from migrant groups who arrived with little human capital and a disadvantaged starting position appear to have no significant ethnic disparities in the income rank due to unobserved factors such as cultural differences and discrimination The found differences indicate that ethnic disparities are primarily driven by differences in intergenerational gaps. Hence, there is a need to understand slower paces of economic assimilation for some groups. For instance, various processes of assortative matching in the household formation may reproduce or mitigate intergenerational disparities (see Huschek et al. 2012; Mare 2011).
The finding that we may explain ethnic differences by age and socio-economic background has two important implications for broader debates on ethnic disparities in European societies. First, cultural explanations that relate group norms, habits, and religion to the economic success of minority groups seem to become irrelevant over generations. Second, economic assimilation is primarily driven by more universalistic determinants of economic productivity such as human capital. Accordingly, to support the grandchildren of migrants in closing gaps in income and wealth, effective social policies should direct more investments to providing equal-access to good education, and to facilitating labor market participation and trainings.
So, this study suggests that individuals and groups with a migration background, regardless of their origin, will someday achieve equal social-economic success as the majority population in European countries with a generous welfare state and historically rooted institutions, similar to migrant communities in Northern America. Yet, we should be cautious in our predictions. The young age structure of the third generation and the small population size of some origin groups mean that we do not yet have a complete picture. It may be that ethnic disparities may emerge in later stages of life course. Future studies can give more comprehensive assessments of disparities for a broader range of ages.
Supplemental Material
sj-docx-1-mrx-10.1177_01979183231165499 - Supplemental material for Economic Assimilation of the “Third Generation”: An Intergenerational Mobility Perspective
Supplemental material, sj-docx-1-mrx-10.1177_01979183231165499 for Economic Assimilation of the “Third Generation”: An Intergenerational Mobility Perspective by Aslan Zorlu and Wouter van Gent in International Migration Review
Footnotes
Declaration of Conflicting Interests
The author(s) declared no potential conflicts of interest with respect to the research, authorship, and/or publication of this article.
Funding
The author(s) received no financial support for the research, authorship, and/or publication of this article.
Supplemental Material
Supplemental material for this article is available online.
Notes
References
Supplementary Material
Please find the following supplemental material available below.
For Open Access articles published under a Creative Commons License, all supplemental material carries the same license as the article it is associated with.
For non-Open Access articles published, all supplemental material carries a non-exclusive license, and permission requests for re-use of supplemental material or any part of supplemental material shall be sent directly to the copyright owner as specified in the copyright notice associated with the article.