
Abstract
Time-of-use (TOU) tariffs that vary the cost per kWh to reflect wide variations in generation and wholesale market costs give incentives to shift all electric vehicle (EV) charging to low-price periods. As EV penetration increases, such tariffs would substantially raise the local kW demand in those low-priced periods, which eventually would lead to increasing network expansion costs. A straightforward way to mitigate this problem is to separate energy charges from network charges, with appropriate rate designs for each. This paper uses a realistic case study to investigate the implications of combining TOU energy charges with various network tariff designs in the face of increased EV penetration. Our results provide support for the adoption in the US of ex-ante subscribed capacity tariffs (subscription charges), which give consumers incentives to reduce their peak kW demands. Reducing costs of EV ownership (a priority for many US states) need not be pursued at the expense of broader affordability goals.
Keywords
1. Introduction
After years of stagnant demand, electric utilities are planning for substantial load growth and requesting regulatory approval for network investments that enable electrification of end-use services like electric vehicle charging, building heat and cooling, and water heating; for example, in September 2023, National Grid and Eversource in Massachusetts filed plans for peak load-related network upgrades totaling $2B between 2023 and 2030 (National Grid 2023; Eversource 2023b). Electric vehicle (EV) adoption, in particular, is expected to accelerate rapidly in the US as manufacturers phase out production of internal combustion engine vehicles, and consumers take advantage of lucrative federal and state incentives (BloombergNEF 2023). Because charging demand tends to be correlated across households (e.g., many people charging immediately upon returning home from work), the need to invest in distribution infrastructure to handle peak kW demand may rise more rapidly than kWh consumption, applying upward rate pressure as utilities recover the costs of expanding their distribution networks.
In almost all US states, electric utilities recover delivery costs (distribution and transmission), along with energy costs, from residential and small commercial customers based on customers’ monthly electricity consumption, regardless of the timing of that consumption. 1 We refer to these as flat volumetric tariffs. Under flat volumetric tariffs, EV drivers have no incentive to shift their charging to times when the network is not capacity constrained. In this paper we focus on the distribution component of delivery costs, as it is the one primarily affected by EV adoption.
There is broad consensus that flat volumetric network tariffs are not cost-reflective (Pérez-Arriaga et al. 2017) and discourage electrification (Schittekatte et al. 2023). Most utilities have offered optional (opt-in) time-of-use (TOU) rates since the early 2000s. TOU rates signal how the marginal cost of electricity generation varies on average within days and across seasons. Users can lower their own costs and, in the long run, system generation costs by time-shifting electricity demand to “off-peak” periods (see e.g., Schittekatte et al. 2022). This is simple for EV owners who can create an automated schedule (in a “set and forget” fashion) that delays charging until the start of the off-peak window and smooths charging demand over these off-peak hours. However, as of 2021 only 9 percent of US residential customers were enrolled on TOU rates (Faruqui and Tang 2023), even though 73 percent of residential customers have advanced meters capable of supporting such rates (US EIA 2022). A small number of states have enacted policies to make TOU rates the default option (Kavulla 2023), as shown in Figure 1. In all these states there is no retail competition, so the distribution utility is also the energy supplier, and the TOU rate recovers energy, distribution, and transmission costs in a single per-kWh charge. In several states, EV-specific TOU rates have been introduced. End users opting into these rates are often not required to enroll on a time-varying tariff for their remaining household demand. Default TOU and several EV-specific tariffs are detailed in Supplemental Appendix A.
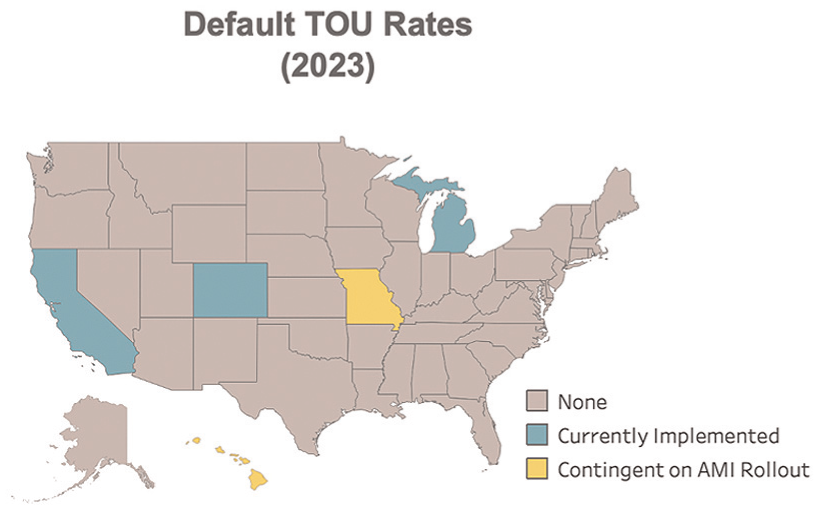
Default TOU rate adoption for each state’s largest distribution utility.
At current low EV adoption levels, EV owners can pay substantially less for charging under TOU rates than under flat volumetric rates, and other consumers receive the indirect benefit of lower peak wholesale prices without bearing substantial costs of network expansion.
However, when local geographic concentrations of EVs rise and wholesale price patterns are poorly aligned with demands on distribution networks, TOU rates may exacerbate the problem of correlated EV charging increasing instantaneous kW demand on the distribution network. A per-kWh charge alone, even a time-differentiated one, provides no disincentive for consumers to limit their maximum instantaneous kW consumption. As consumers defer EV charging to off-peak hours, TOU rates may result in local demand peaks at the onset of off-peak periods similar to the impact of the time-varying rates for electric heaters with thermal storage introduced in the 1960s in the UK and Germany. Such a reduction in the diversity of loads would impact various portions of the distribution network hierarchy, including individual household service connections, single feeders, and multiple feeders aggregated at a substation – what Boiteux and Stasi (1964) refer to as the individual and semi-individual networks. Because residential EV charging is such a large load compared to other household appliances, it is possible that the higher and more highly correlated loads from EV charging can exceed existing network capacity, even at relatively low EV adoption levels, leading to steeply rising costs for distribution network upgrades.
The implications of correlated EV charging on low-voltage distribution grids have been known for quite some time – both in the academic literature (Muratori and Rizzoni 2015) and by policymakers (Parliamentary Office of Science and Technology 2018). From a technical perspective, we know that direct load control with randomization is effective at mitigating the EV-driven peak problem in distribution grids, as demonstrated in the literature (e.g., Backe et al. 2020; Muratori and Rizzoni 2015; Nouicer et al. 2023) and in several small-scale pilots over the years (Cross and Hartshorn 2016; Smith 2009). Recently, Bailey et al. (Forthcoming) presented an interesting small-scale experiment using centralized load control to address the problem of “shadow peaks.” But despite this knowledge, such programs have not been deployed at scale anywhere in the world, even in countries recognized as leaders in utility regulation and EV adoption. We believe three sets of barriers would have to be overcome to successfully roll-out centralized load control programs at scale in the US.
First, while existing load-control programs (e.g., smart thermostat demand response) have proven popular and effective at addressing resource adequacy challenges at the bulk system level, these programs involve very infrequent load control actions (a few hours per year) that in effect substitute for dramatic price spikes. Load control to address peak kW demands within local distribution grids would instead require frequent utility control of household demand (perhaps daily). Consumers may resist such frequent interventions. Consumer resistance would be decreased if consumers had the option to override load control signals, though if that option were frequently exercised the value of the program would be compromised.
Second, efficiently applying load control for local distribution constraints requires granular visibility of flows at the distribution level. Price signals at the wholesale level adjust frequently in response to changes in supply and demand and indicate when constrained system situations occur. These time-varying wholesale price signals provide information about the value of centralized load control for resource adequacy at the bulk power system level. No such price signals exist currently at the distribution level, and so-called “smart grids” are in early-stage development. Distribution investments are typically made many years in advance and align with a long-run price signal rather than fluctuating shadow prices reflecting distribution network constraints.
Third, under the cost-of-service regulatory model dominant in the US, distribution utilities have an incentive to deploy capital whereas direct load control reduces the need for capital investment. While incentive or performance-based regulation is slowly gaining traction, it has not focused specifically on network pricing issues (Joskow 2024). In states with no retail competition, regulatory evaluation of load control programs would not be straightforward. In states with retail competition, effective load control would require the distribution utility to provide price signals, which could change from hour to hour, to retailers or aggregators, who could then directly pass them through to their consumers. The development of such a regulatory framework and pricing mechanism would be highly complex and could take years to implement.
Given the complexity of these barriers, we have little reason to believe that all three will be overcome quickly. The expected growth in EV penetration points to a need for simple alternatives to reduce unnecessary investment in distribution grids in the short and medium terms. It is important to understand whether and what kinds of reforms to the design of distribution network tariffs, that do not face the barriers discussed above, can mitigate the problem of correlated EV charging without causing undesirable side effects (i.e., related to operating costs for EV owners and distributional impacts on different customer groups). 2
To investigate this question, we conduct a realistic, rigorous case study using simulated residential load and EV-owner driving profiles at increasing levels of EV adoption, calibrated for a sample of Massachusetts residential customers. Concretely, we study how to complement TOU energy charges along with separate distribution network tariffs, recognizing that rational consumers will react to the aggregate price. We study three types of network tariffs that have been widely implemented in Europe (described in Supplemental Appendix A) – fixed, volumetric (per-kWh), and capacity (per-kW) – and analyze the results of households minimizing their total electricity costs. We focus on single-family residential distribution feeders, where there is relatively low diversity of customer loads compared to parts of the distribution network that host multiple housing types and customer classes (e.g., commercial and industrial). 3 We consider three key metrics: annual peak demand (which determines network investment), levelized cost of EV charging, and cost shifts between EV and non-EV households. 4
Our main finding is that distribution network tariffs under which consumers subscribe to certain maximum kW demand levels, with some time differentiation, can reduce the impacts of rising EV penetration on network costs without causing serious negative side effects. 5 With EV adoption as low as 15%, we observe new EV-driven peak demands on the distribution network. When paired with a TOU energy tariff, fixed and per-kWh distribution network tariffs fail to contain steep increases in network costs and benefit one customer group (EV households or non-EV households) at the expense of the other one. While a network tariff levied ex-post on actual peak kW demand achieves the lowest distribution network cost in our case study, such a tariff would be difficult to implement and would not provide customer protections against bill shocks. In contrast, a subscription charge performs reasonably well for all assessment criteria considered, 6 offering a compromise between network costs and tariff complexity. Whereas some tariff designs rely on perfectly rational consumer behavior to achieve their desired impact, a subscription charge is robust to heterogeneity in consumer reactions to the tariff; its performance on all criteria actually improves when a small portion of customers ignore price signals. Our sensitivity analyses indicate that time-differentiated subscription charges are less effective when heating electrification is considered, a topic for future work.
Our results should make clear to utilities and their regulators the value of separating network charges from TOU energy rates and introducing a time-varying capacity (per-kW demand) network charge. A bundled TOU rate that covers both energy and network costs – which is gaining popularity among US state energy regulators – could in fact perform worse than flat volumetric rates from a total system cost (energy plus network) perspective by requiring unnecessary and costly distribution network expansion. If regulators do not act quickly, utilities may plan (and propose distribution network investments) based on worst-case scenarios. Over time, the addition of voluntary targeted load control or randomization on top of well-designed tariffs could provide even more savings for customers. Local flexibility markets, where aggregators sell the flexibility of the devices under their management to distribution companies, are also promising (Schittekatte and Meeus 2020). However, we consider these solutions as complements rather than substitutes (see e.g., Nouicer et al. 2023), and we will address this interaction in future work.
The remainder of this paper is organized as follows: Section 2 provides background on network tariff design and introduces our research contribution. Section 3 introduces the process for creating simulated load profiles and specifies the methodology employed. Section 4 presents the results and sensitivity analyses. Section 5 discusses the implications of the results for tariff development. Section 6 concludes and offers policy recommendations.
2. Network Tariff Design Fundamentals and Application to EV Charging
A central objective of tariff design is to provide incentives for efficient consumption while producing adequate revenue to recover the utility’s capital and operating costs. Efficiency requires that a network tariff be structured so that network users are charged according to the cost they impose on the system. This will provide incentives that limit unnecessary investment. In addition, network tariffs should be simple and predictable, and non-discriminatory. Passey et al. (2017) show that under flat network tariffs, the costs consumers pay rarely reflect the costs they impose on the system. This leads to inefficient incentives for grid usage and to cost shifts between grid users.
In theory, the most efficient network tariff contains two parts: a forward-looking charge that reflects the long-run marginal cost of upgrading the network at each location and a complementary fixed charge to recover the sunk costs of past network investments (Pérez-Arriaga et al. 2017; Strbac and Mutale 2005). 7 While there is consensus around this theoretical framework, there is considerable disagreement in the literature about how it should be employed to design network tariffs in practice.
In one camp, acknowledging the difficulty of calculating location-specific long-run marginal costs, Borenstein et al. (2021) argue that because most network investments have already been made, 8 the most important network tariff revision consists of shifting the non-marginal costs of those prior investments from a flat volumetric charge to a fixed charge – see also Borenstein (2016) and Borenstein and Bushnell (2022). These authors model several scenarios in which the long-run marginal transmission and distribution costs are set to zero, effectively ignoring the costs of network expansion. To improve equity and promote electrification, they argue for an income-graduated fixed charge (IGFC) similar to a progressive income tax.
Using smart meter data from 100,000 customers in the Chicago area, Burger et al. (2020) arrive at a similar recommendation: a two-part tariff with a per-kWh charge set equal to the social marginal cost of energy and an income-based fixed charge so that low-income customers pay less than under current flat volumetric rates. The authors also find a strong correlation between customers’ peak demands and their income, implying that retail tariffs with peak demand charges have attractive income distribution attributes. In order to overcome the administrative challenge of collecting income information, Batlle et al. (2020) propose a residual cost allocation scheme whereby users would be charged according to their historical consumption, which can be a reliable proxy for household wealth (Borenstein et al. 2021).
In the other camp, Pérez-Arriaga et al. (2017) adhere to an “efficient ideal” approach, proposing that forward-looking costs should be calculated precisely at each network node, which has only become feasible since the deployment of advanced metering infrastructure. Many others have applied variations on this idea in different contexts including Morell-Dameto et al. (2023), Abdelmotteleb et al. (2018), Gunkel et al. (2023), Winzer and Ludwig (2022), and Govaerts et al. (2023).
These papers in the second camp present innovative approaches that require methods far more advanced than those we examine here (and beyond the implementation capabilities of state public utility regulators in the U.S.). Moreover, even if it were possible to accurately calculate forward-looking network expansion costs at each network node, regulators are likely to resist breaking a decades-long norm of not charging different prices to network users in the same customer class based on their location. On the other hand, the first camp largely ignores the likelihood of future network investments driven by highly correlated newly-electrified demand. Papers like Borenstein et al. (2021) effectively assume that all network investments have already been made and that consumers must simply pay for them. This is no longer consistent with reality.
Our approach and the recommendations that follow fall somewhere in between these two camps. We focus on simple solutions that do not rely on precise forward-looking cost calculations but consider the possibility of distribution network upgrades driven by increasing peak kW demands.
There is a small body of literature that takes a similar approach, primarily considering interactions between tariff designs and the adoption of solar PV: Schittekatte (2020), Hoarau and Perez (2019), Simshauser (2016). Focusing specifically on EVs, Küfeoğlu and Pollitt (2019) demonstrate that under current network tariff structures, EV adoption applies downward rate pressure on network charges (the opposite impact of PV adoption). These papers typically assume scenarios of flat load and revenue neutrality, where all network costs are sunk. They do not consider scenarios in which customers increase net electricity demand through heat pump or EV adoption, and where additional network investments are required to meet peak demand but can be avoided, reduced, or deferred through appropriate tariff design
Two recent papers consider costs of distribution expansion. Hennig et al. (2022) lay out a framework for assessing network tariff performance, focusing on cost efficiency, cost recovery, and implementation burden and simulate a case study using German data. However, the authors consider network tariffs in isolation, with no analysis of the interaction between network and energy tariffs. Li and Jenn (2024) use empirical EV charging data (including residential charging responding to TOU rates) to estimate that California utilities will need to invest between $6 and $20 billion to upgrade distribution infrastructure between now and 2045. However, the authors do not consider tariff design, only the expected rate impacts under existing tariffs and the current revenue requirement.
This paper fills important gaps in the existing literature by simulating a realistic case study that uses 400 individual household load profiles for Massachusetts to (1) focus on the interaction between network and TOU energy tariffs on peak load under a growing EV load scenario, (2) analyze impacts of rate design on the economics of EV adoption via a levelized cost of charging calculation, and (3) evaluate the cost impacts of different tariff designs on both consumers with and without EVs. Our analysis is inspired by existing network tariff designs in Europe, which seem largely to have escaped the attention of regulators and analysts in the US.
3. Methods
In this section, we present a high-level summary of the methodology for our case study, calibrated on realistic Massachusetts residential electricity consumption and driving data. A full description of the approach can be found in Supplemental Appendix B. Figure 2 illustrates the components of our approach, which we outline in the subsections below.
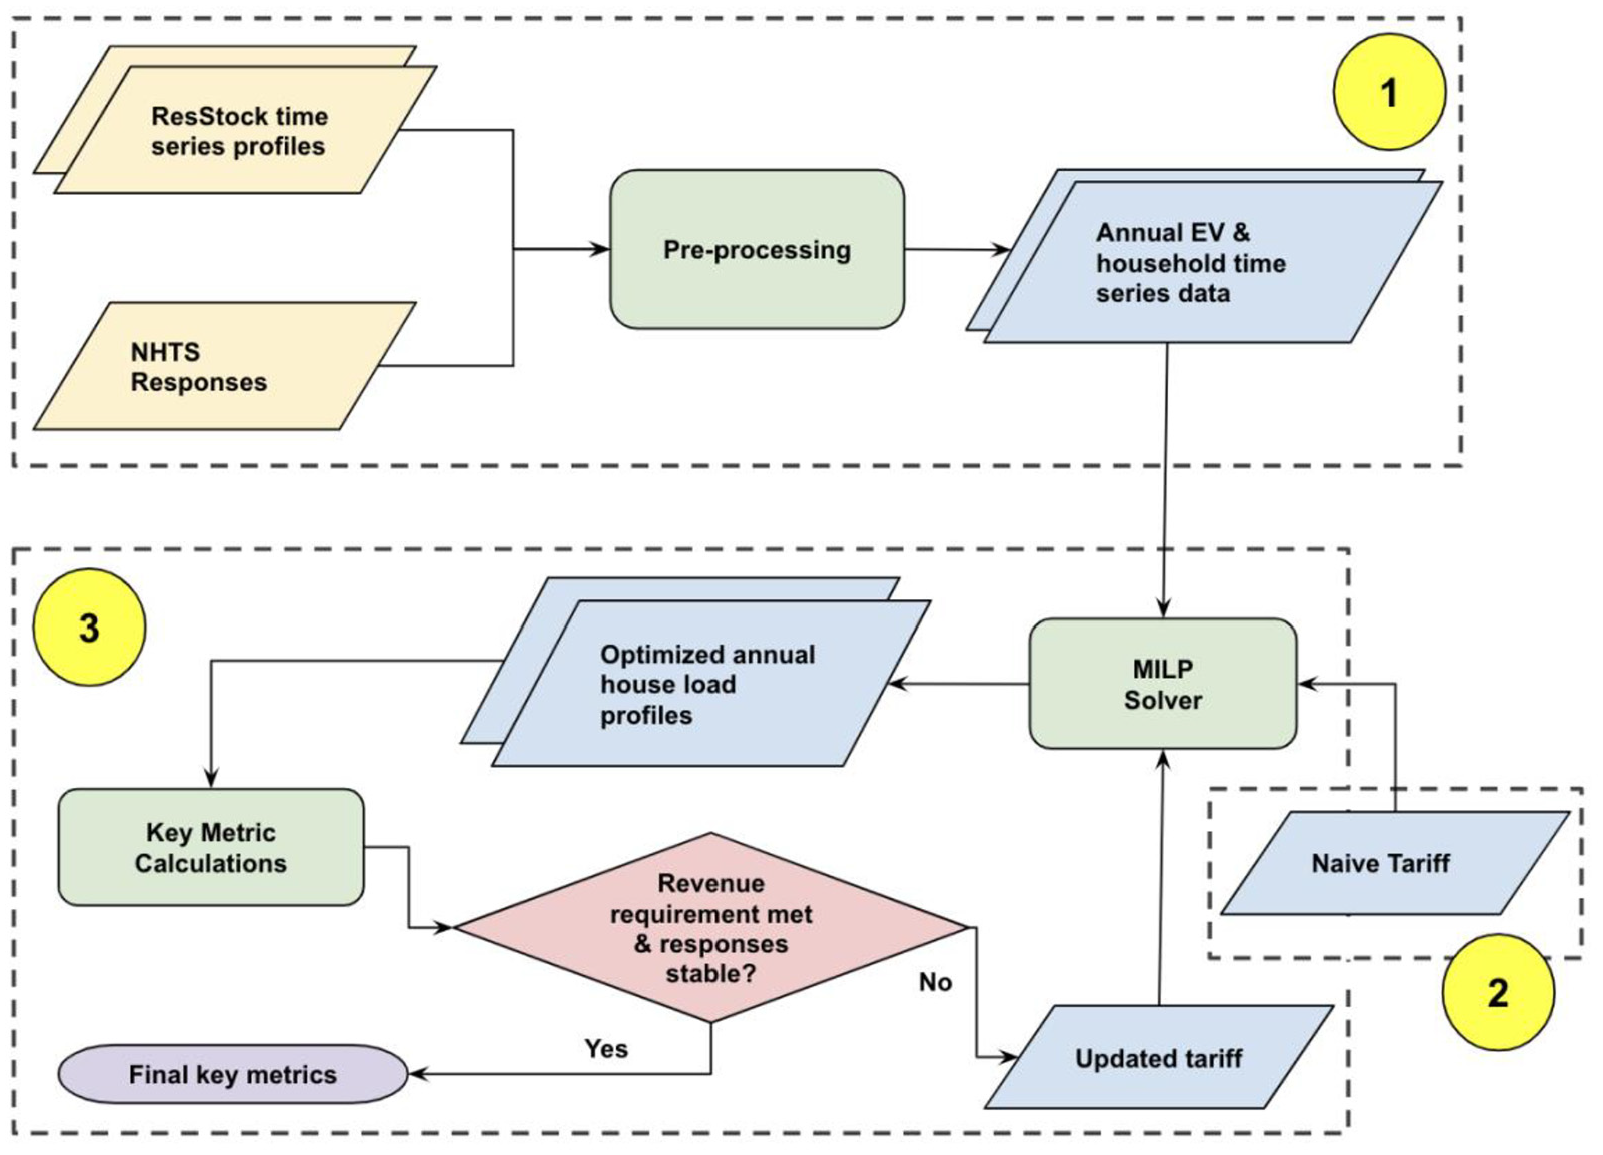
Methodology flowchart; ResStock is a database of synthetic hourly load profiles for representative US homes. NHTS is the National Household Travel Survey, in which respondents log their travel behavior. The processes covered in each numbered cluster are covered in their corresponding sections (3.1–3.3).
3.1. Household Loads and Driving Behavior
We obtain 400 synthetic hourly electricity consumption profiles from NREL’s ResStock database (Wilson et al. 2022), drawn randomly from single-family home archetypes in the state of Massachusetts and representative of the local diversity found on a typical distribution feeder. Using the National Household Travel Survey (NHTS), we assign to each household a simulated driving profile that indicates when its EV is at home and how many miles it is driven per day, detailed in Supplemental Appendix B. Travel patterns, especially miles driven per day, are relatively stable across the US (Federal Highway Administration 2017).
3.2. Network Tariffs
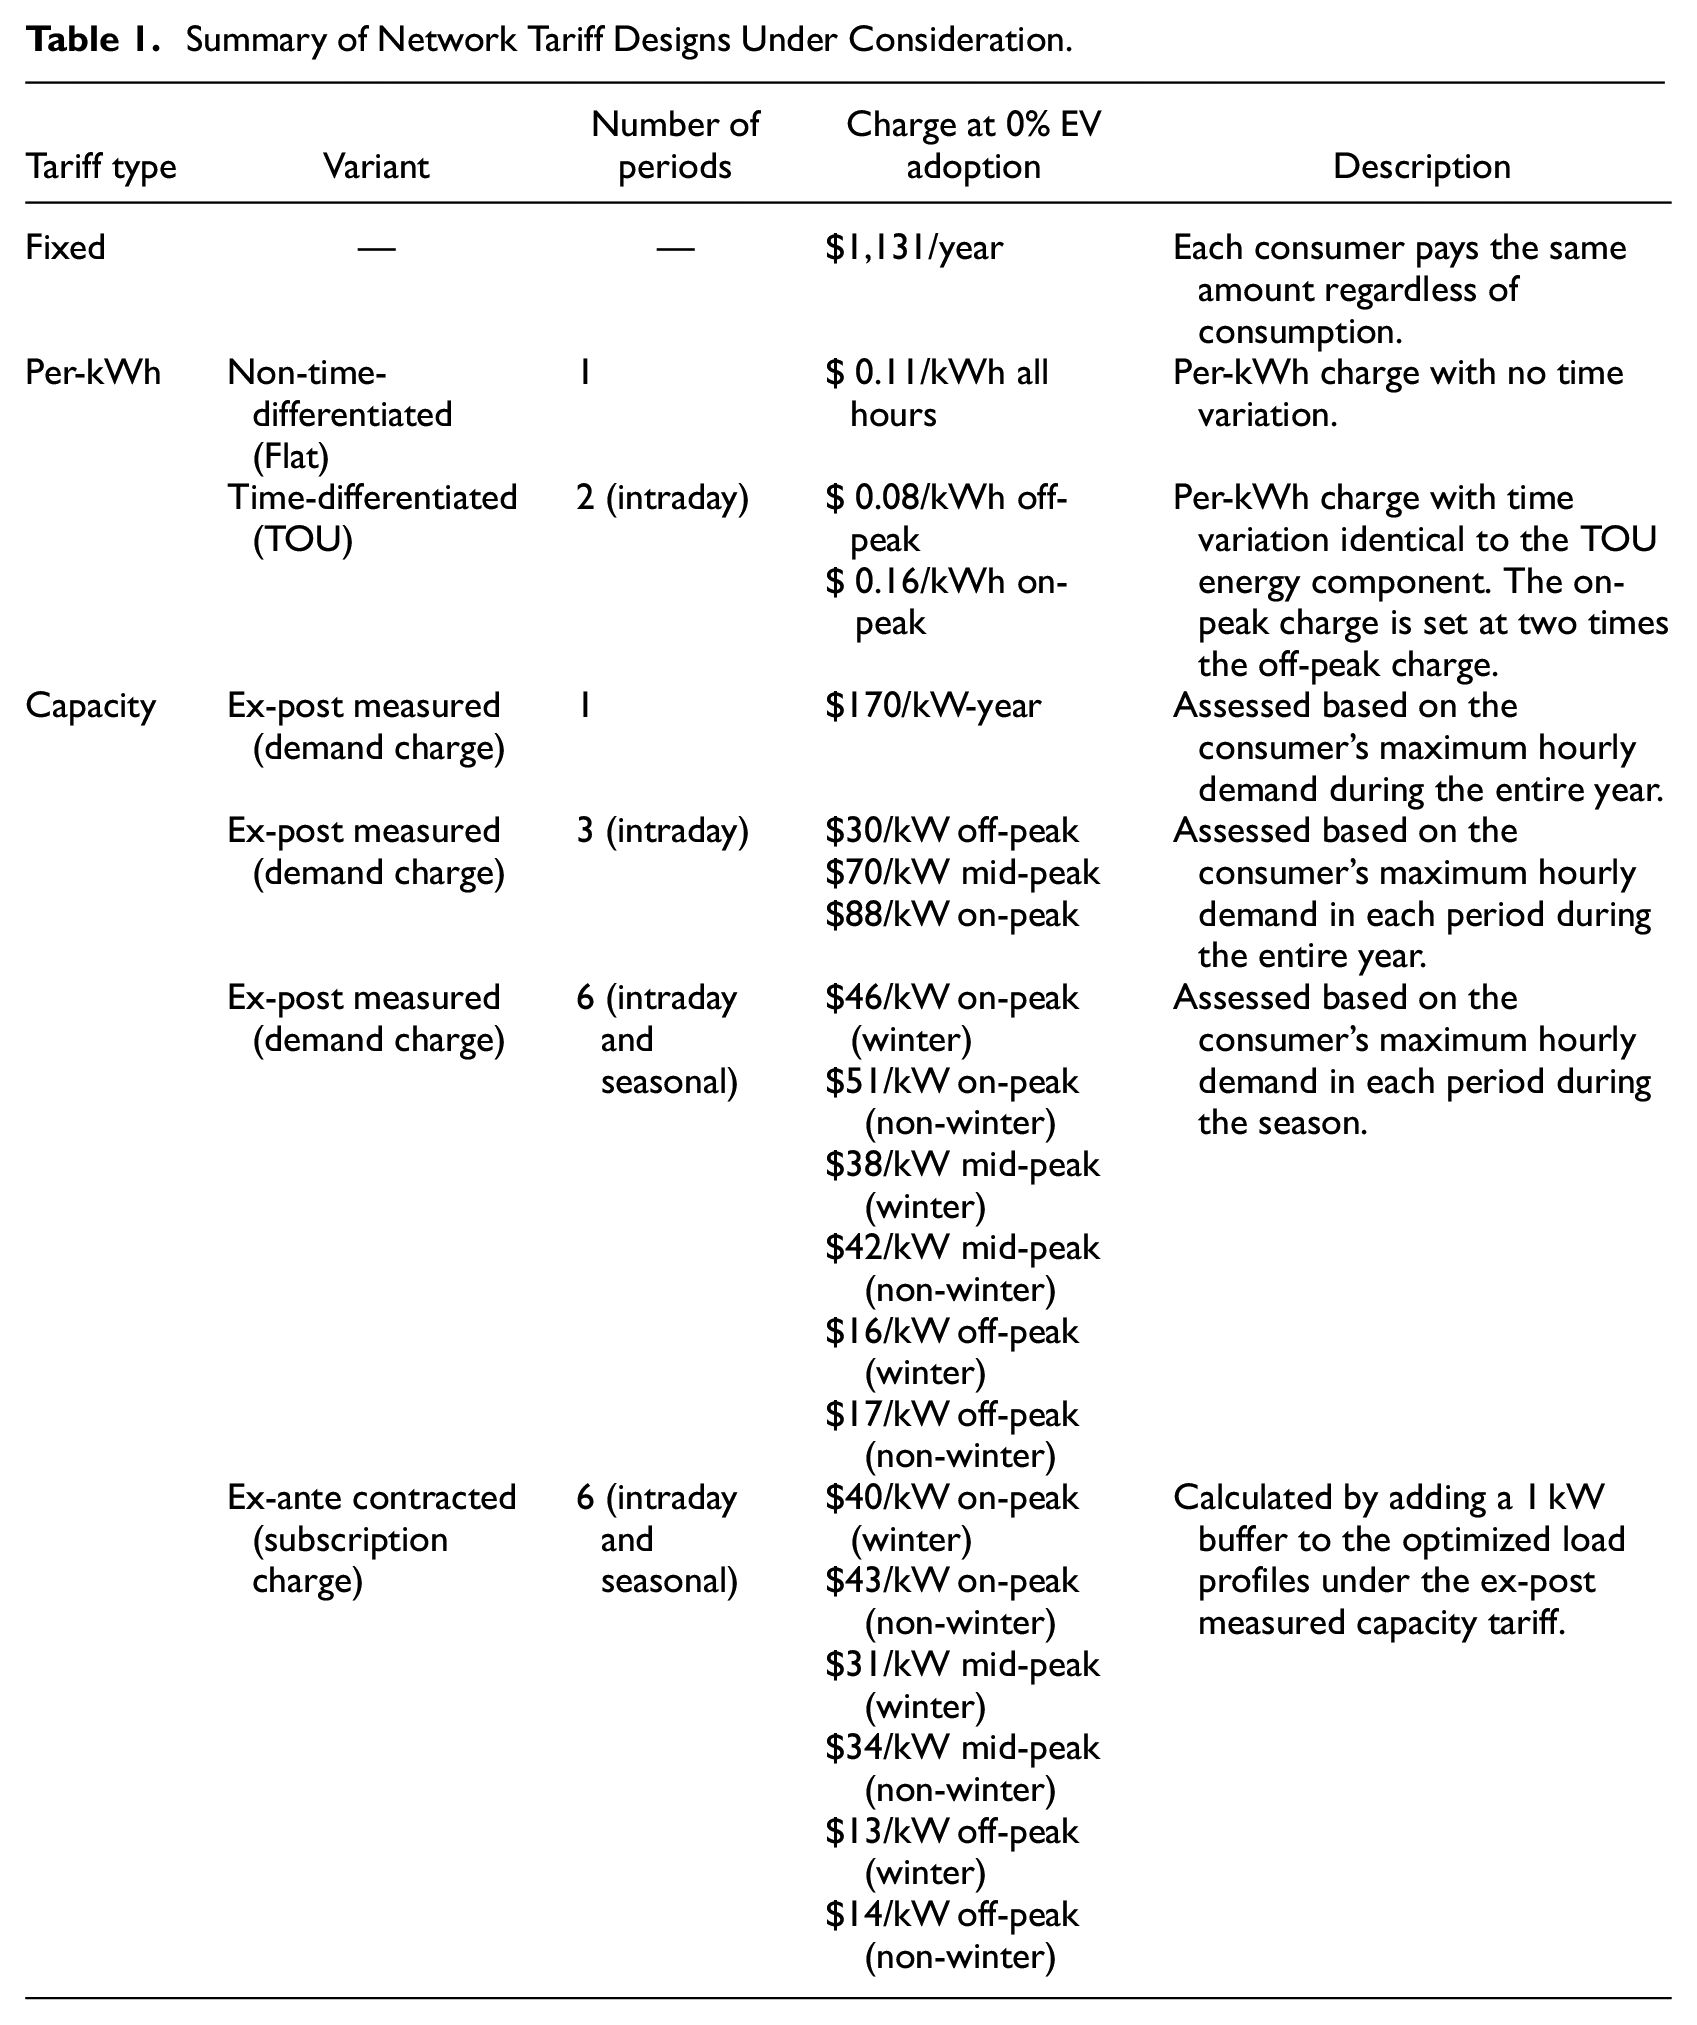
We test variations of three standard formats for network tariff design: fixed, per-kWh, and capacity (based on kW demand). 9 The network tariffs are considered mandatory (i.e., consumers do not have the option to enroll on alternative network tariffs). Table 1 shows the key details of each tariff, with representative charges shown for 0% EV adoption. For all network tariff types, we assume the energy price to be exogenous and energy costs recovered via a simple two-part TOU rate, calculated using the same methodology as the two-part TOU network charge, calibrated under 0% EV adoption on a (flat) energy charge of $ 0.102/kWh. On-peak hours are weekdays 8:00 AM to 8:59 PM. That is, we assume that prices for generation (energy) and high voltage transmission are unbundled from prices for distribution or delivery.
Summary of Network Tariff Designs Under Consideration.
3.3. Optimization and Key Metrics
We assume EV adoption to be exogenous, random, cumulative, and use 5 percent adoption increments. 10 Each household that has an EV in the 5 percent adoption scenario also has one in the 10 percent scenario and so on. We assume that each EV responds rationally (with perfect foresight of future household demand) to price signals when plugged in. We solve a mixed integer linear program (MILP) for each household to independently minimize annual electricity costs (details in Supplemental Appendix B). EV owners react to the aggregate price, including both energy and distribution network charges. EV chargers can vary kW demand while cars are plugged in. We assume non-EV load is unresponsive to price and that homes do not have solar or battery storage, limitations we discuss in Section 5.2.
We assume that the 400 Massachusetts households in the sample discussed above are electrically connected in the same neighborhood and distribution grid. Increases in their annual aggregated coincident peak demand lead to linearly-increasing network costs (the revenue requirement), which are recovered via the distribution network tariff under cost-of-service regulation. While we consider distribution at only one layer, in reality distribution systems are composed of multiple layers (Morell-Dameto et al. 2023). The problem of correlated EV charging is especially apparent at the lowest distribution layers, especially in residential feeders with low load diversity. If we considered more layers, the impact of correlated charging would be less pronounced; the higher you aggregate up the more you can leverage load diversity. In this way, our approach considers the “weakest link” of the cascade.
For each incremental level of EV adoption, we first compute a naive solution where the tariff price levels are set to collect the network revenue requirement at 0% EV adoption. Using the resulting annual peak demand from the naive run, we recalculate the tariff prices to recover the new revenue requirement. Equilibrium is reached when the household responses do not deviate from the previous iteration, and the full revenue requirement is collected. The network revenue requirement is proportional to the annual system peak, described in (1).

LRMC is the long-run marginal cost of expanding the network, set at $50/kW for the low-cost network expansion scenario and $150/kW for the high-cost network expansion scenario.
11
These values are taken from studies commissioned by the California PUC on the avoided cost of distributed energy resources (Energy+Environmental Economics 2022) and the distribution cost impacts of transportation electrification (Cutter et al. 2021). We treat these values as representative endpoints of a cost spectrum, rather than exact predictions. The baseline network cost (BNC) is defined as the product of the annual aggregate consumption at 0 percent adoption times Eversource’s flat volumetric network charge in Eastern Massachusetts as of August 2023 ($ 0.11845/kWh; Eversource 2023a). We assume that all distribution network costs are allocated to the flat volumetric network charge.
We assess each tariff design based on three metrics (calculations for which are shown in Supplemental Appendix B): peak demand (which is linearly associated with total network costs), levelized charging costs for EV households, and distributional cost impacts for non-EV households. EV charging costs determine whether and how much customers will save compared to fuel costs with an internal combustion engine vehicle. Non-EV household costs capture the distributional impacts of each tariff option and indicate whether each will be acceptable from an equity perspective, especially when considering that EV adoption until now has correlated strongly with income (Lee et al. 2019). In particular, we are concerned about low-income, high-consuming households with little flexibility in their consumption schedules who would have difficulty adjusting their behavior in response to a new tariff design. Ideally, we would address distributional issues outside of rate design rather than see them as a constraint. However, this is not always practical.
From a cost-causality perspective, only EV households should pay the incremental network costs due to increased EV adoption. Yet in practice and in our simulations distribution network tariffs reflect not only forward-looking costs but also sunk costs of prior investments (BNC here). The implications are discussed further in Section 5.2.
Under the assumptions outlined in this section, we isolate the impact of network tariff design on each of these key metrics, while capturing how charging incentives are determined by the interaction of the TOU energy tariff and the network tariff.
It is worth discussing briefly how these metrics relate to consumer welfare. We assume there is no disutility from deferring EV charging to a later hour as long as the vehicle has sufficient charge by departure time to fulfill that day’s driving needs. Under this assumption, consumer welfare is negatively related to total electricity cost (energy plus network costs). Furthermore, because the difference in energy procurement costs under the different network tariffs designs is negligible in our case study, we can assume consumer welfare is negatively related to the aggregated network peak. 12 Since we assume EV adoption to be exogeneous, the absolute value of the network tariff charge has only a very limited impact on the aggregated peak. Rather, the network tariff design drives the results. We discuss this further in Section 5.2.
4. Results
In this section, we present results for each key metric above. We include two cases for each metric to represent a range of possible incremental investment costs (LRMC); low ($50/kW) and high ($150/kW). In Supplemental Appendix C, we perform sensitivity analyses to consider how the tariffs perform under different energy pricing plans, consumer behavior, and concurrent adoption of heat pump systems.
We first discuss the results for the growth in annual peak under the different network tariff designs. We then analyze the levelized charging cost for EV households. Finally, we discuss distributional impacts.
4.1. Annual Peak
Figure 3 shows the annual coincident peak demand for each tariff at 5 percent adoption increments. The annual peak is identical for both LRMC cases because only relative price differences impact a household’s response, not the absolute value of the LRMC. The fixed, 1-part per-kWh and 2-part TOU per-kWh tariffs produce the same result because the network tariff either has no impact on or magnifies the price differential in the energy tariff.
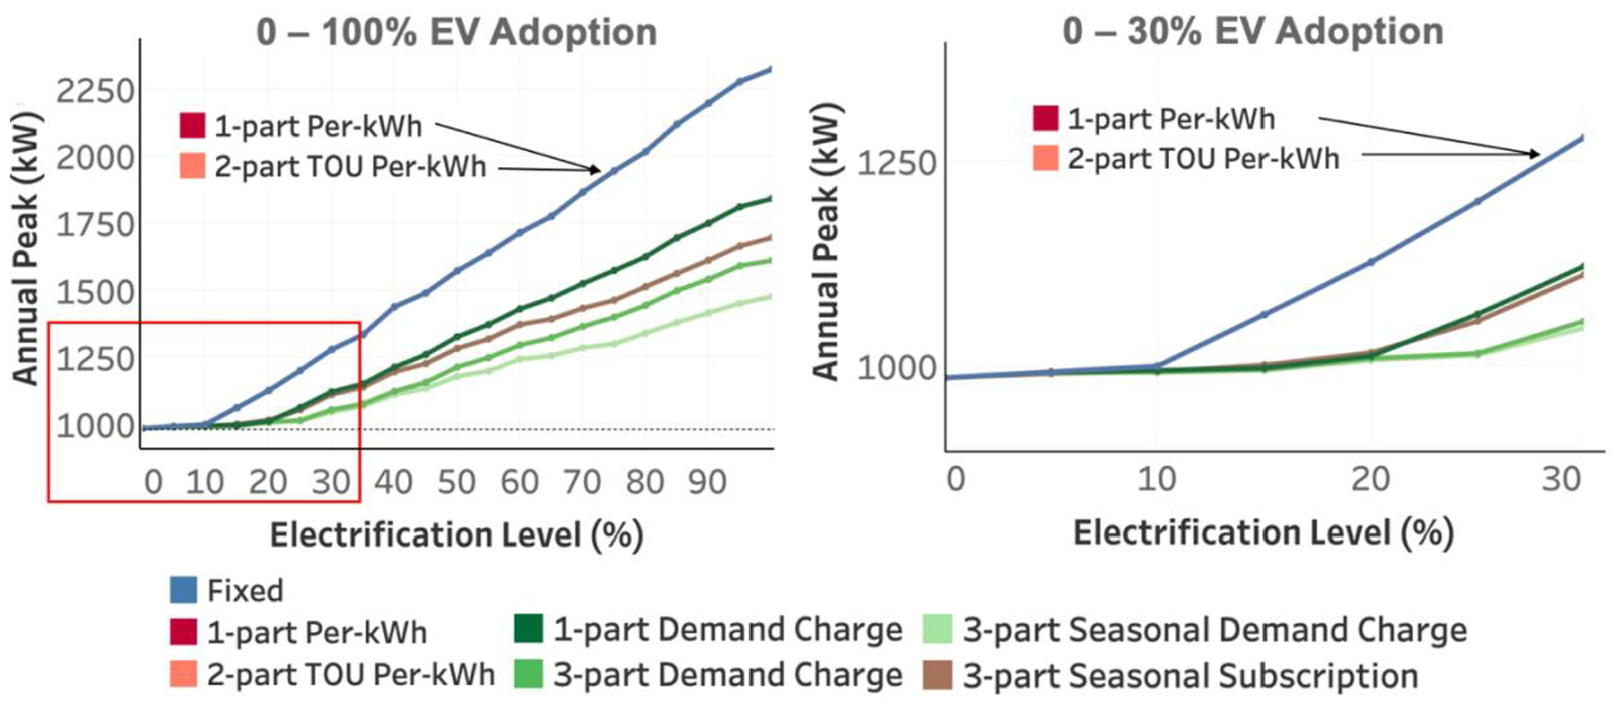
Annual peak demand at 5% EV adoption increments for seven network tariffs tested (left), with 0 to 30 percent adoption highlighted (right). The fixed, 1-part per-kWh, and 2-part TOU per-kWh tariffs all produce the same aggregate peak demand because the network tariff either reinforces or has no distortionary effect on the energy tariff. As early as 15 percent adoption, network tariff designs that fail to mitigate the correlated response to the off-peak energy period diverge from capacity tariffs.
The energy tariff price differential induces EVs that are plugged in to defer charging to the start of the off-peak period. As early as 15% EV adoption this new EV-driven peak exceeds the historically most important early-evening peak driven by (exogenous) non-EV demand. 13 EV-driven “rebound peaks” have also been found empirically, for example, by Qiu et al. (2022) and Bailey et al. (Forthcoming). For the fixed, 1-part per-kWh, and 2-part TOU per-kWh tariffs, EVs charge at the charger’s maximum capacity (7.2 kW). In contrast, under the capacity tariffs charging is limited to a lower kW level to avoid incurring additional network charges.
Figure 4 illustrates this effect by showing EV charging under the subscription tariff versus 2-part TOU per kWh tariff. The left panel shows a single household’s hourly load on the annual peak day. Under both tariffs, the household delays charging until the start of the off-peak energy tariff period at 20:00 to minimize charging costs. Under the TOU per-kWh tariff, charging occurs at the charger’s full capacity over two hours. Under the subscription tariff, charging is spread out over eight hours (from 20:00 until 4:00 the next day) at a capacity such that the aggregate of EV and non-EV kW demand stays beneath the household’s ex-ante contracted capacity of 3 kW. The right panel shows the hourly demand for the annual peak day aggregated across all households at 50% EV adoption, with each EV household behaving similarly as in the left panel (albeit in an uncoordinated way). There is still an EV-driven peak under the subscription tariff, but it is lower than under the 2-part TOU per-kWh tariff. At 50% EV adoption, the annual peak under the subscription tariff (1,283 kW) is 30 percent higher than the annual peak at 0% EV adoption (displayed as a dotted black line in Figure 3), compared to 60 percent higher (1,572 kW) for the fixed, 1-part per-kWh, and 2-part TOU per-kWh tariffs.
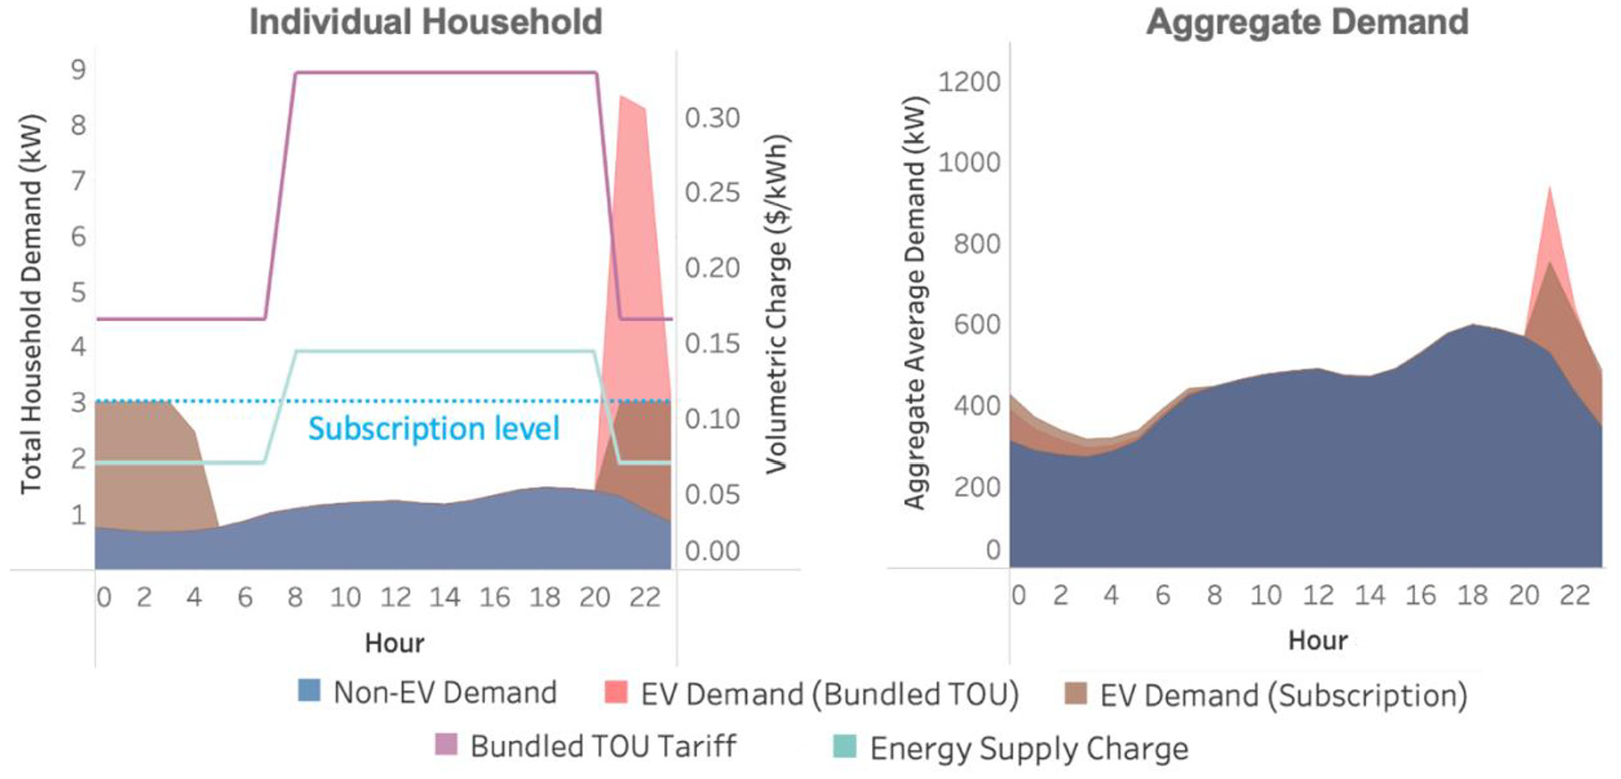
EV charging under the subscription tariff versus 2-part TOU per kWh tariff. The left panel shows a single household’s hourly load on the annual peak day. The right panel shows the hourly demand for the annual peak day aggregated across all households at 50% EV adoption.
We also observe that adding more time periods to the demand charge improves its ability to mitigate peak impacts and thus to defer network upgrades. Under the subscription charge, we lose a portion of peak demand mitigation in exchange for easier implementation due to the 1 kW subscription buffer discussed in Supplemental Appendix B. However, overall, the subscription charge performs significantly better than fixed or per-kWh network tariffs.
4.2. Levelized Charging Cost for EV Households
Figure 5 shows the average levelized charging costs for EV owners. Almost all EV households can achieve the minimum charging cost. This means that they adhere perfectly to price signals and fulfill their driving needs without either exceeding their pre-EV peak demand in each demand period (for capacity tariffs) and charge nearly entirely during the off-peak period. This result is likely an underestimate of charging costs due to our assumption of perfect ability of end users to forecast their individual peak usage. The result for the subscription charge provides a more realistic estimate because customers would know their subscription level in advance (calibrated considering a buffer) and then program EV charging in a way that their consumption remains beneath that limit.
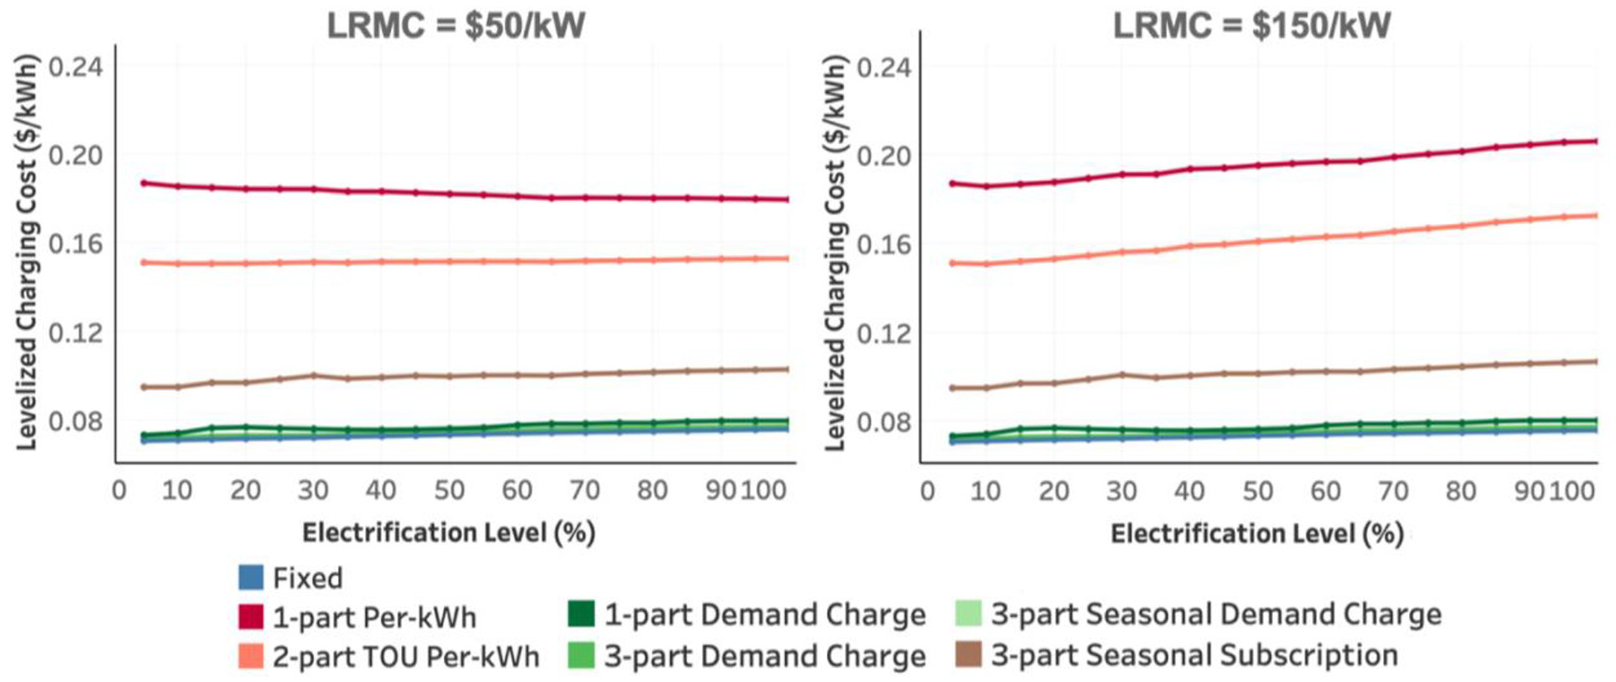
Levelized charging costs for EV owners for low (left) and high (right) LRMC cases. Under the fixed and demand charges, EV customer’ costs are nearly equivalent to the off-peak energy price because they can fulfill their charging needs without increasing peak demand or charging during the on-peak energy window.
What is clear from these results is that volumetric per-kWh network tariffs perform poorly from a levelized charging cost perspective. The average EV in our sample consumes 3,075 kWh annually. When the network revenue requirement is collected using per-kWh tariffs, EV households contribute more to cost recovery than under other tariff designs. Introducing TOU per-kWh network tariffs helps to some extent to lower the levelized costs of charging, but they remain significantly higher than under the other alternative network tariff designs. The slight upward curve of the per-kWh tariffs under the high LRMC case reflects the fact that the revenue requirement (driven by peak demand) is growing faster than aggregate electricity consumption. The opposite occurs in the low LRMC case.
4.3. Difference in Network Costs for Non-EV Households
Figure 6 shows the change in annual network charges paid by non-EV households under the different network tariff designs. Positive values reflect cost increases and negative values represent savings compared to network charges under 0% EV adoption with flat volumetric energy and network tariffs. We focus on network costs because those are non-optional. A consumer whose energy tariff costs increase under a TOU plan might be able to switch to a flat volumetric rate, something we expect to occur in practice, though we do not model this possibility.
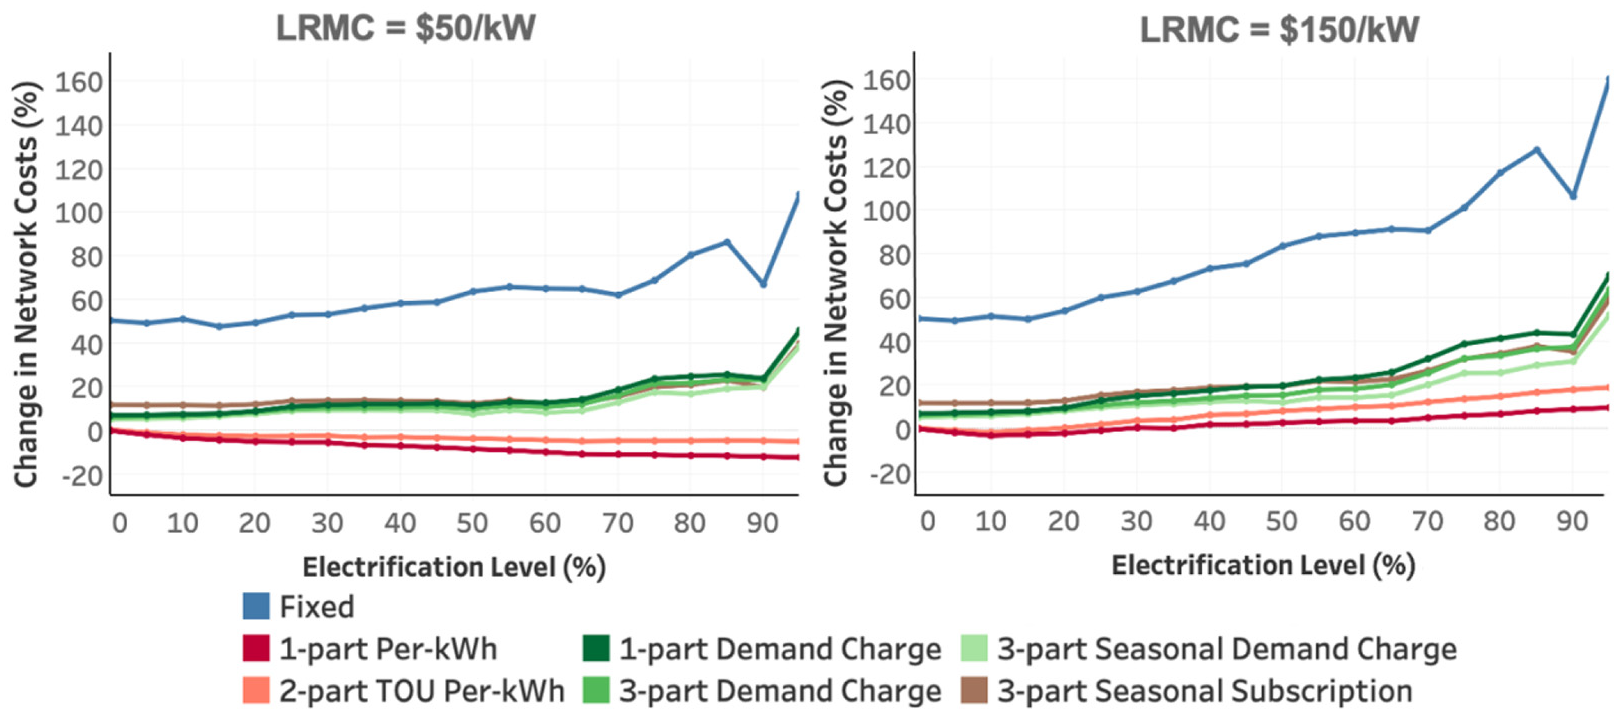
Change in annual network charges for non-EV households for the low (left) and high (right) LRMC cases.
An (undifferentiated) fixed tariff performs the worst at all EV adoption levels, as all new peak-related costs that are entirely driven by EV charging are shared equally among all households. Importantly, these peak-related costs are high under fixed charges (see Figure 3), as no incentive is provided to schedule EV charging to limit the overall local peak. Undesirable distributional impacts for certain groups (e.g., low-income households) could be mitigated using an ex-post subsidy, but this would need to be funded by other ratepayers or through general taxation (Schittekatte 2020). 14 The 1-part per-kWh tariff performs best, as EV owners have no mechanism to reduce their network costs by shifting demand to off-peak hours and hence overly contribute to cost recovery at the benefit of non-EV owners. While the subscription tariff results in higher revenue collection from EV households compared to the 3-part and 3-part seasonal demand charges, this benefit to non-EV households is offset partially by the higher annual peak under the subscription.
This metric is highly sensitive to the assumed cost of network expansion. At $50/kW, the average non-EV household saves money under both per-kWh tariffs at all levels of EV adoption. In other words, EV owners are cross-subsidizing non-EV owners. At $150/kW, this is only true at low EV adoption levels before a new EV-driven peak triggers network upgrades.
5. Discussion
In this section, we first provide a brief assessment of the results presented above. Next, we make recommendations for network tariff implementation based on our case study. Finally, we discuss limitations of our approach.
5.1. Overall Assessment
Table 2 provides a summary of the key metrics for each network tariff for the low and high LRMC cases at 15%, 50%, and 85% EV adoption assuming a TOU energy tariff. According to ISO New England’s 2023 Transportation Electrification Forecast, the 50 percent adoption milestone is expected to be reached by 2035 (ISO New England 2023). Note that 50 percent adoption in concentrated areas of the grid, which is relevant for these results, can happen a lot earlier than overall 50 percent adoption.
Key Metrics for Each Network Tariff at 15%, 50%, and 85% EV Adoption under low and high LRMC.
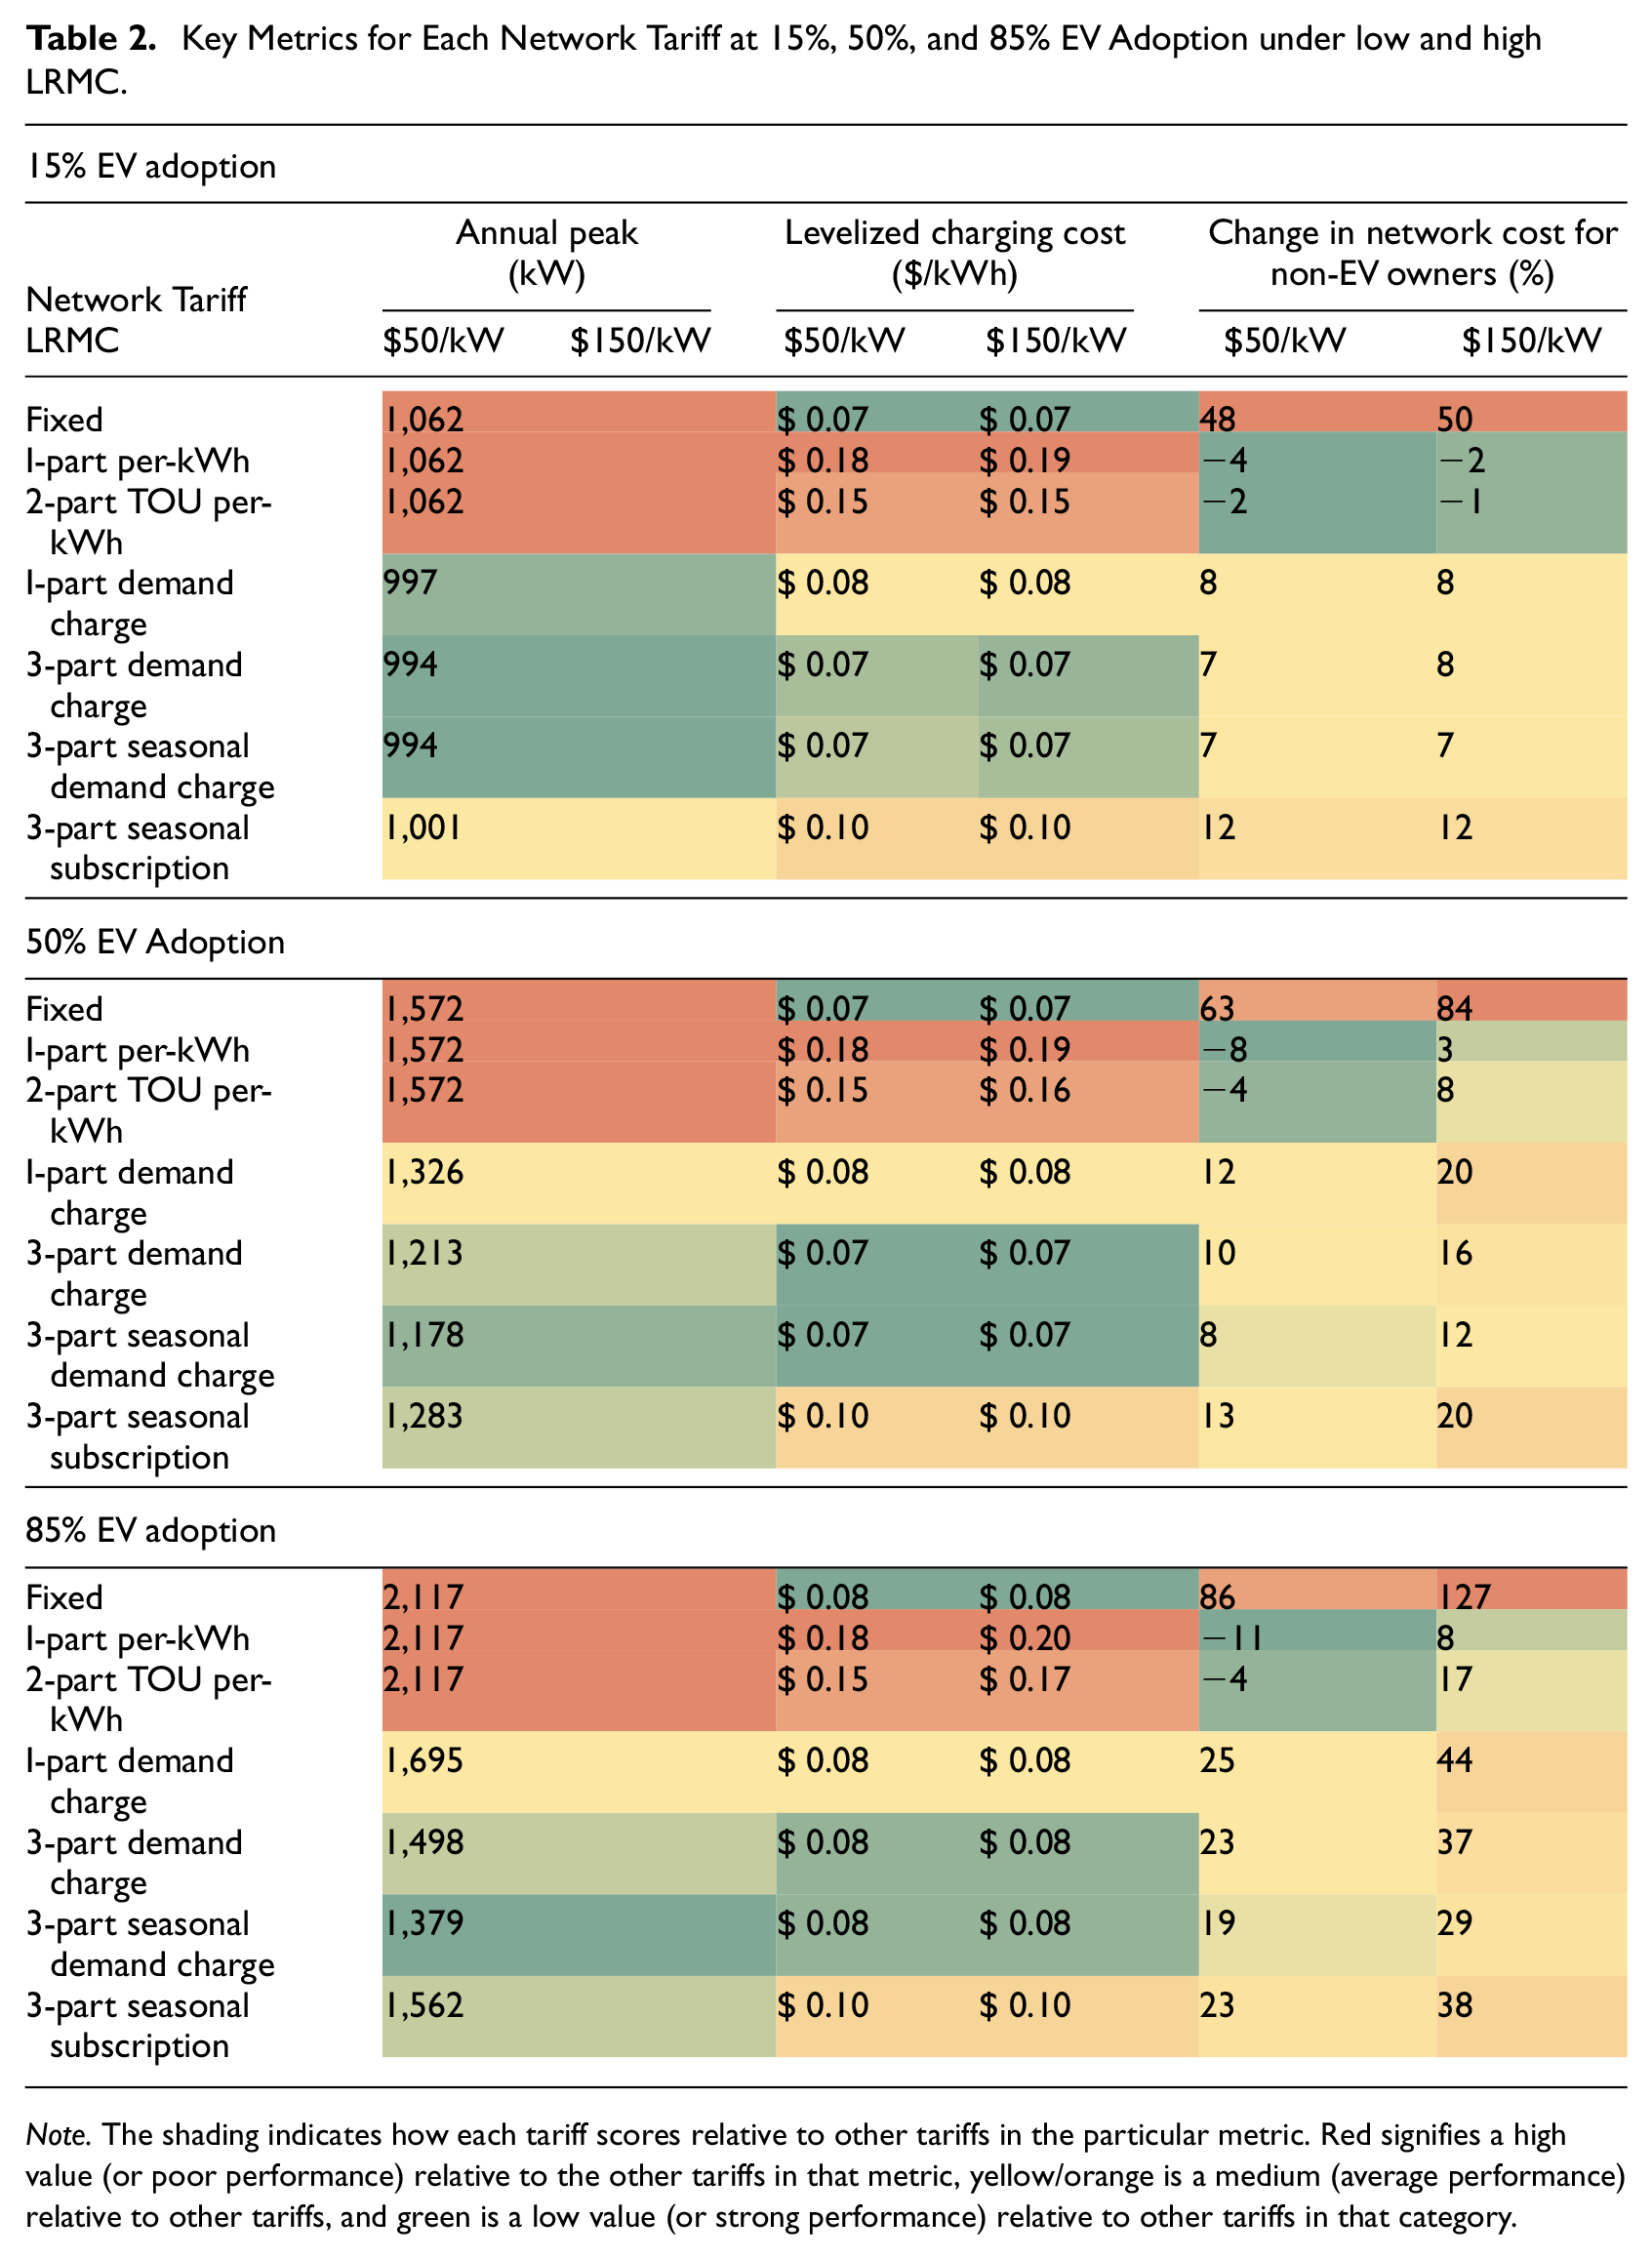
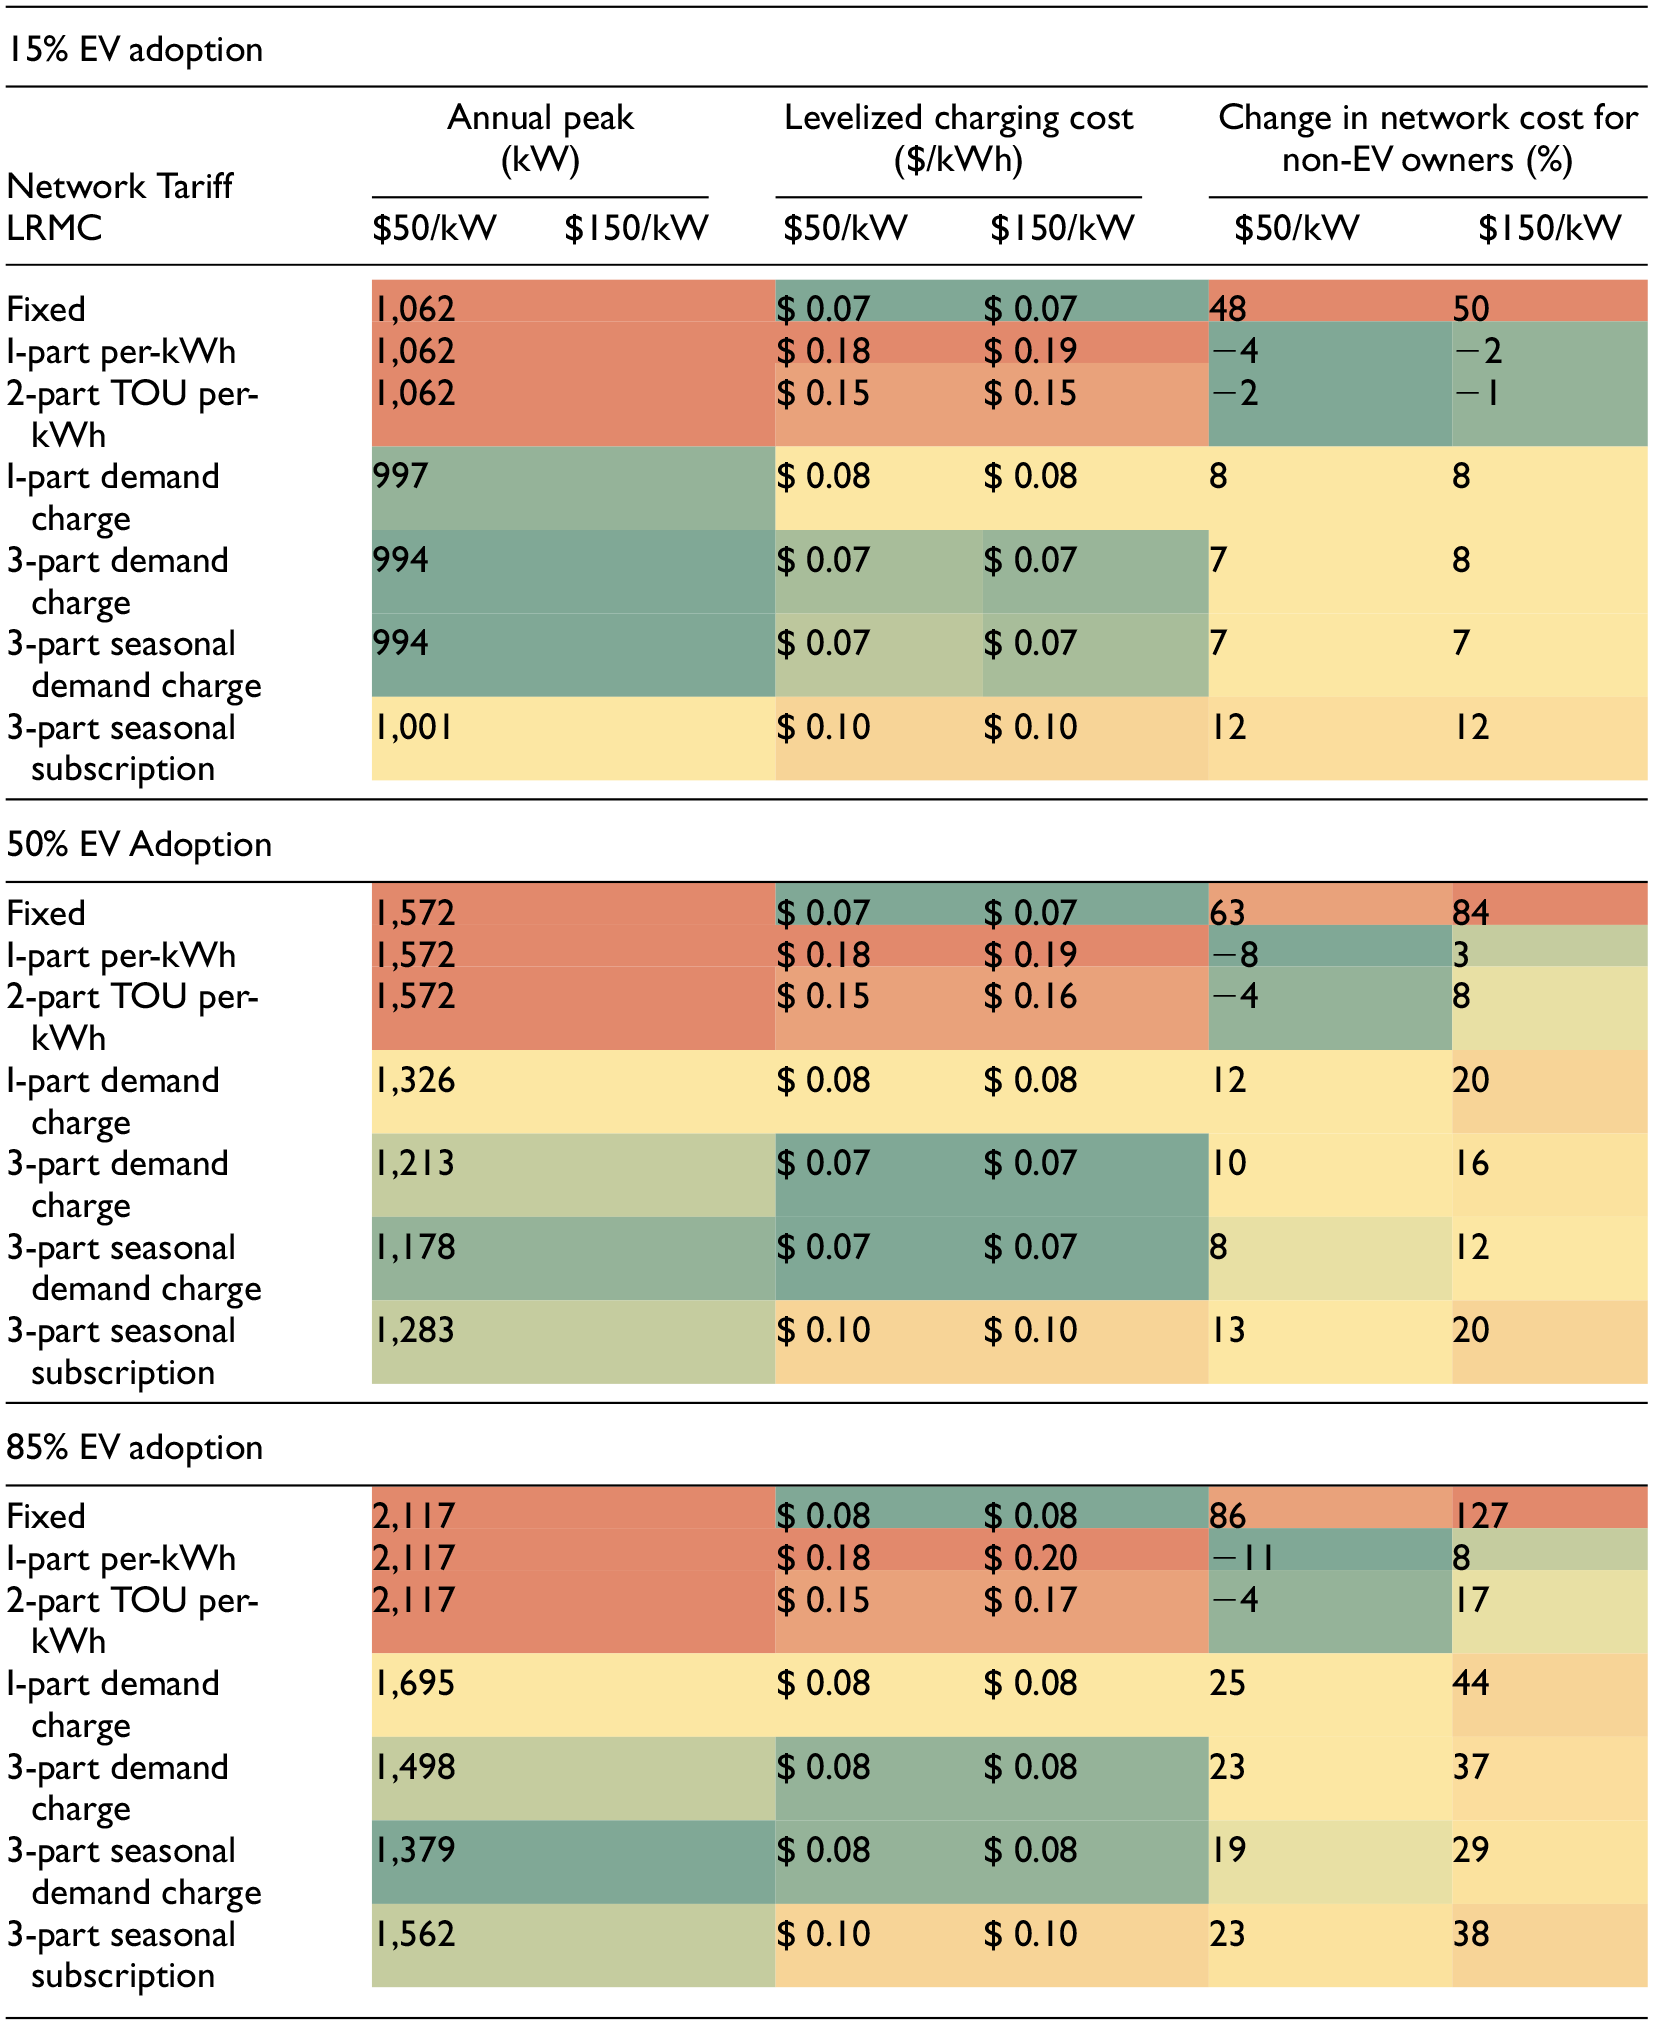
Note. The shading indicates how each tariff scores relative to other tariffs in the particular metric. Red signifies a high value (or poor performance) relative to the other tariffs in that metric, yellow/orange is a medium (average performance) relative to other tariffs, and green is a low value (or strong performance) relative to other tariffs in that category.
The results in Table 2 indicate a tradeoff among assessment criteria. Whereas the fixed tariff performs best in levelized charging cost, it shifts costs to non-EV owners and performs worst in network charges for them. The reverse is true for per-kWh network tariffs. Capacity-based tariffs (demand and subscription charges) offer a compromise, providing a significant reduction in levelized charging cost compared to the per-kWh tariffs while increasing network charges for non-EV owners by only a modest amount compared to the fixed network tariff. While we do not observe an outcome in which costs decrease for both EV and non-EV households compared to the status quo, capacity-based tariffs most closely approach this outcome, demonstrating that reducing costs of EV ownership (a priority for many US states) need not be pursued at the expense of broader affordability goals.
The 3-part seasonal demand charge achieves the lowest annual peak and levelized cost. However, the subscription charge (which does not perform badly on any of the key criteria) offers implementation advantages over demand charges, as discussed below. As Public Utility Commissions attempt to balance stakeholder interests in promoting electrification while addressing the problem of correlated EV charging, a tariff design that does not create big winners or losers may be the most palatable.
US utilities that have pushed back against time-varying rates often cite customer confusion and expected bill impacts as the reason for their opposition (see, e.g., Tomich 2023). Because utilities are penalized for customer confusion and bill shocks, utilities are likely to oppose complicated tariff designs. Therefore “simplicity” and “implementation burden” are considered core criteria for network tariff assessment. There are also experimental studies that show that at some point increasing tariff complexity blunts impacts on consumer behavior (Jacobsen and Stewart 2022).
Nothing in everyday consumer spending resembles an ex-post measured capacity charge. For customers accustomed to paying flat volumetric charges and unaware of their consumption at any given moment, the concept of being charged based on their maximum demand may be an unacceptably large change. Under demand charges, customers are often not shielded from risk; accidentally running multiple appliances concurrently for a few minutes could result in hundreds of dollars in incurred costs. A demand charge also suffers from the opposite problem: for knowledgeable customers who have a high kW demand early in a billing period, there may be no incentive to manage power demand for the remainder of the period.
Thus, while the 3-part seasonal demand charge does well in our simulations, consumers may resist it, and regulators may be averse to implementing it. We believe a subscription charge overcomes these problems in several ways. First, a subscription charge has a cognitive advantage; it gets consumers’ attention and makes optimization easier. If a customer must subscribe in advance and is prompted to resubscribe from time to time – for example, with estimated savings and a default option to continue at the same level – it forces them (possibility with the aid of the utility or retailer) to think about how they can minimize costs. When the demand charge just gets buried in the overall tariff, consumers may not focus their attention on cost minimization. Second, the structure is similar to popular phone and internet plans, wherein customers pay for a maximum level of service that cannot be exceeded without incurring penalties. A familiarity with these types of plans will help explain the logic of subscription charges and ease the transition to new network tariffs. Third, a subscription can be implemented in a way that protects consumers from high bills. For example, smart meters can be programmed such that if instantaneous demand exceeds the subscribed level, the meter is temporarily disconnected. This immediate feedback will help coach customers to not turn on high-power devices simultaneously or to purchase devices that make it possible to program which appliances get turned off first (Mou et al. 2017). 15 If meters are tripped frequently due to exceeding the subscription level and customers want to increase their subscription, they may do so for the following billing period. Fourth, a subscription offers more bill certainty, which is important for customers on tight monthly budgets. Even without perfect foresight, customers can better predict their costs using their ex-ante contracted value compared to an ex-post charge. For cold and temperate climates where forward-looking network costs will be higher in winter, the ability for customers to adjust their subscriptions according to their demand elasticities will help ensure that basic energy services (especially heating) are available. In contrast, flat volumetric rates provide no opportunity for more demand-elastic customers to save money by changing behavior, leading to “heat or eat” tradeoffs (Snell et al. 2018). There are several variants of subscription charges (i.e., “smart subscriptions”) that could be used in a transitional period, for example starting out using a soft cap with a small penalty fee calculated as a function of when the subscription value is exceeded, eventually shifting to a hard cap (DNV-GL 2019). Finally, having customers sign up for the maximum demand to which they want access provides information that can help utilities to plan future networks.
These benefits may help explain why several EU member states have already adopted subscription charges. A 2023 report by the EU Agency for the Cooperation of Energy Regulators (ACER) on network tariffs highlights examples from France, Italy, Portugal, Spain, and Slovenia, among others, and recommends a “gradual move to increasingly power-based distribution tariffs to recover those costs which show correlation with contracted or peak capacity” (ACER 2023, 72). Because of extensive retail competition, European countries tend to have electricity bills in which different cost categories (supply, distribution, transmission, etc.) are broken out. This makes it easier to implement a subscription charge for just the distribution network portion of the bill. Of course, there is no reason why US states without retail competition could not disaggregate their electricity bills as well. In states and countries with retail competition, the distribution (wires) provider could help educate customers on selecting the proper subscription level. Despite these advantages, we are not naive about the difficulty of implementing what for residential and small commercial US consumers would be a radical departure from the rates they have been accustomed to for decades. Techniques like shadow billing can be helpful both to protect and educate customers during the transition period. Given the time required to develop new rates and how quickly the issue of correlated EV charging may appear, states that have not yet transitioned away from flat volumetric rates should consider per-kW subscription charges as a component of retail rate reforms in addition to TOU and critical peak pricing.
Finally, our results also indicate the limitations of even relatively granular network charges coupled with TOU energy charges (and later real-time pricing). When considering the concurrent electrification of home heating and transportation, we observe a significant increase in aggregate peak demand. If we relax some of our network tariff design principles (i.e., simplicity, non-discrimination, and existing widespread implementation), there are several alternatives to the network tariffs tested in our case study. These include daily capacity charges, highly dynamic volumetric network charges (e.g., based on day-ahead forecasted load), auctions for network capacity (Morell-Dameto et al. 2024), and price setting based on equilibria estimations. Yet moving from the flat volumetric tariffs ubiquitous today in the US to these advanced and untested approaches would likely face significant resistance from utilities and regulators. In the near term, simple network tariff designs like those implemented in Europe are effective at limiting peak demand growth. They also offer a bridge to the complementary measures, including direct load control, which will become necessary as we reach higher levels of EV adoption and more volatile wholesale prices. While a subscription network tariff does not obviate the need for network upgrades, our case study shows that it can significantly delay increases in annual peak loads, so that network investments can be spread out over time.
5.2. Limitations of Our Analysis
Here we outline six key limitations of our case study.
First, we do not calibrate the levels of the network charges to actual forward-looking network costs. Our case study focuses on the incentives driven by tariff structures; under our assumption of rational price responsiveness, the absolute magnitude of each tariff does not impact customers’ load shapes. Only relative prices matter. Yet absolute magnitudes will affect distributional impacts and incentives to electrify. In future work, a two-part network tariff can be considered consisting of a capacity charge based on forward looking costs and differentiated fixed charges to collect the remainder of the required revenue and mitigate distribution impacts.
Second, we treat energy prices as exogeneous. While direct impacts of EV charging on the wholesale market are expected to be limited initially, at high levels of adoption it becomes important to consider how the correlated response of flexible loads like EVs and heat pumps would impact wholesale electricity prices and thus affect TOU and dynamic retail energy rates. We will investigate this topic in future work. In any case, flexible loads like EV charging would continue to react to relative price differences, so the risk of a highly correlated response would persist even if wholesale and retail energy prices are endogenous in practice.
Third, we assume all EV charging occurs at home with smart Level 2 chargers, even though one would expect to see a mix of charging locations in the future. According to a survey by Dunckley (2018), 80 percent of charging occurs at home, with the remaining 20 percent at workplace and public stations. Our case study therefore represents a sort of worst-case scenario; non-residential charging would likely help reduce coincident peak demand in the evening by shifting charging activity to daytime hours, as shown by Needell et al. (2023). New automation capabilities could also help drivers select charging locations to reduce strain on the grid and mitigate evening peak demand. Furthermore, in urban areas or places with a high proportion of rental properties, it is unlikely that all residents would be able to install dedicated charging stations at home. Our case study considers a suburban or rural residential feeder where homes have off-street parking 16 and sufficient electric panel capacity to install a Level 2 EV charger. An important extension of our research is examining residential charging in urban settings where alternative charging methods exist. In addition, the implications of charging of delivery trucks and other fleets deserves study.
Fourth, we assume that non-EV load does not respond to price. We would expect actual consumers to shift non-EV demand to reduce costs, enabled by automation capabilities, especially with regard to heat pump operation. While heat pump load is generally considered to be less flexible than EV charging, automation techniques like pre-heating and pre-cooling would mitigate peak demand growth and allow consumers to reduce their network costs, improving distributional outcomes. However, we believe it is useful to consider the purely price-unresponsive case, as it captures the most extreme distributional impacts of the tariff reform for customers who have not yet electrified. This is the same reason we chose to apply the alternative tariffs to the entire population rather than only EV customers.
Fifth, we associate only a single EV with each house. It is likely that some multi-vehicle households will purchase a second EV before all households have their first. We will address this possibility in future work, although we expect that capacity-based tariffs will perform similarly given that each home’s demand or subscription charge is based on its aggregate demand.
Sixth, our analysis focuses specifically on EV adoption (and heating electrification to a lesser extent in Supplemental Appendix C). We did not consider the potential impact of other distributed energy resources, like solar and battery storage.
6. Conclusions
Based on our modeling results, we find that without tariffs that price network and energy separately, correlated EV charging becomes a serious issue even at low adoption levels, with newly created demand peaks that possibly appear already at 15% of local EV adoption. This is even more concerning since EV adoption is highly clustered spatially and will not proceed uniformly across a distribution utility’s service territory.
Our results indicate a tradeoff between reducing costs for EV owners (through fixed and capacity-based network tariffs) and non-EV owners (through per-kWh network tariffs). Per-kWh network charges lead to high charging costs and lack a price signal to limit aggregated demand peaks. While fixed network charges reduce the costs of EV charging, they shift network costs from EV owners to others and again lack a mechanism to mitigate peak demand. Demand charges perform well but are difficult to implement, especially when transitioning from flat volumetric tariffs. Taking all this into account, we propose a 3-part seasonal subscription network tariff as a pragmatic compromise that performs relatively well on all dimensions.
A well-designed subscription tariff has the potential to (1) mitigate the need for local capacity upgrades, especially at early adoption levels, (2) reduce the cost burden on non-EV households, and (3) provide low levelized charging costs for EV owners. The use of special TOU rates to promote EV adoption by US utilities today will yield worse results once low adoption levels are surpassed and EV charging causes new network peaks, which may occur soon in some neighborhoods.
Our sensitivity analyses indicate that simple network tariffs are less effective when dynamic, real-time energy prices, which economists generally favor, and heating electrification are considered. With real-time energy pricing, at high EV adoption levels, a subscription charge yields a similar annual peak as under a fixed network tariff. And when EV and inelastic heat pump adoption proceed in lock step, Supplemental Appendix C shows that rapid increases in peak demand result. In future work, we will investigate how simple network tariff design can be supplemented with innovative solutions to further mitigate these problems.
Supplemental Material
sj-docx-1-enj-10.1177_01956574251365616 – Supplemental material for Designing Distribution Network Tariffs in the US with an Application to Increased Electric Vehicle Adoption
Supplemental material, sj-docx-1-enj-10.1177_01956574251365616 for Designing Distribution Network Tariffs in the US with an Application to Increased Electric Vehicle Adoption by Graham Turk, Tim Schittekatte, Pablo Duenas-Martinez, Paul L. Joskow and Richard Schmalensee in The Energy Journal
Supplemental Material
sj-docx-2-enj-10.1177_01956574251365616 – Supplemental material for Designing Distribution Network Tariffs in the US with an Application to Increased Electric Vehicle Adoption
Supplemental material, sj-docx-2-enj-10.1177_01956574251365616 for Designing Distribution Network Tariffs in the US with an Application to Increased Electric Vehicle Adoption by Graham Turk, Tim Schittekatte, Pablo Duenas-Martinez, Paul L. Joskow and Richard Schmalensee in The Energy Journal
Footnotes
Acknowledgements
The authors are grateful to Abdelrahman Ayad for comments on an earlier draft of this paper. Faculty, research staff, and students from the MIT Energy Initiative and the MIT Center for Energy and Environmental Policy Research provided helpful feedback during presentations of preliminary results. The authors would also like to acknowledge the MIT Energy Initiative’s Future Energy Systems Center for research support and to thank referees for helpful comments.
Funding
The authors disclosed receipt of the following financial support for the research, authorship, and/or publication of this article: This work was funded by the Future Energy Systems Center at the MIT Energy Initiative.
Declaration of Conflicting Interests
The authors declared no potential conflicts of interest with respect to the research, authorship, and/or publication of this article.
Supplemental Material
Supplemental material for this article is available online.
1
Energy charges are sometimes called “supply charges” or “generation charges” depending on the utility.
2
Another alternative to direct household load control is slightly vary the timing of the TOU periods for different user groups to create heterogeneity in charging behavior. In this a paper, we consider whole-home, technology-agnostic tariffs, while the technologies that have been historically subject to randomization were typically separately metered. On top of the additional hardware costs of separate metering, randomization faces a distributor-retailer coordination challenge similar to that posed by direct control. In states with retail energy choice, the distribution utility has no control over the timing of peak and off-peak periods set in energy tariffs.
3
Diversity is traditionally measured by the diversity factor (DF): the ratio of the sum of the non-coincident peak demands of a set of users to the peak in their total demand. This DF is equal to one if demands are perfectly correlated and higher otherwise. The higher the diversity factor is, roughly, the higher the total kWh consumption of that set of users that can be provided with a given network capacity.
4
![]() identify a related equity issue if early EV adoption continues to be correlated with income. In the absence of tariff reform, higher-income individuals tend to have charging schedules that align with local network peaks, so their EV adoption will necessitate network upgrades paid for by all electricity consumers.
identify a related equity issue if early EV adoption continues to be correlated with income. In the absence of tariff reform, higher-income individuals tend to have charging schedules that align with local network peaks, so their EV adoption will necessitate network upgrades paid for by all electricity consumers.
5
There is a concern among some stakeholders that capacity-based network tariffs can inadvertently increase energy procurement costs (i.e., EV drivers cannot fully take advantage of hours in which energy prices are low because their maximum hourly demand is limited by the capacity charge). In our case study, the energy procurement costs increase due to capacity-based network charges was found to be negligible for TOU energy tariffs, that is, EV driving needs can still be met for almost all EV drivers while keeping charging entirely within the off-peak energy period.
6
Our criteria, defined in full in Supplemental Appendix B, are: aggregate peak demand (kW), EV charging cost ($/kWh), and percent change in network cost for non-EV households.
7
8
For distribution networks, there are three kinds of incremental capital expenditures: replacement, reinforcement (e.g., to deal with increase in wildfires) and demand-driven. Demand-driven expansion costs should be priced based on the associated long-run marginal costs.
9
10
While electricity cost for charging is a factor in EV purchases, consumers rank upfront purchase price and public charging availability as much more significant adoption barriers (Pamidimukkala et al. 2023). Furthermore, (![]() ) show that gasoline prices have a significantly larger effect (four to six times) in California on EV adoption compared to electricity prices.
) show that gasoline prices have a significantly larger effect (four to six times) in California on EV adoption compared to electricity prices.
11
Both values are annualized over the lifetime of the equipment entered into service.
12
The negligible impact of energy procurement costs under the different network tariff designs is driven by the charging time needed to meet driving needs being small relative to the duration of the off-peak TOU energy tariff window while vehicles are plugged in. Notwithstanding, when combining a dynamic energy tariff (where energy prices are linked to the day-ahead wholesale energy market) with a capacity-based network tariff, EV drivers may forego some minor savings in energy procurement costs to limit increases in network charges. However, the impact on energy procurement costs remains small. For example, when combining a dynamic energy tariff with a TOU seasonal subscription-based network tariff under the high LRMC case ($150/kW), EV drivers pay on average $5 more per year by limiting charging below their subscribed limit versus ignoring the limit and fully capturing low energy prices. The methodology for this sensitivity analysis is described in ![]() .
.
13
It is worth noting that if customers react to the aggregate price, the fact that the energy and network charges have the same on- and off-peak hours is not relevant. Even if the off-peak blocks did not overlap, rational EV owners would wait until the hour with the lowest aggregate price, producing the same “snapback” effect.
14
The CPUC’s $24.15 fixed charge proposal aims to redistribute costs, albeit less progressively than the income-graduated fixed charge proposal.
15
References
Supplementary Material
Please find the following supplemental material available below.
For Open Access articles published under a Creative Commons License, all supplemental material carries the same license as the article it is associated with.
For non-Open Access articles published, all supplemental material carries a non-exclusive license, and permission requests for re-use of supplemental material or any part of supplemental material shall be sent directly to the copyright owner as specified in the copyright notice associated with the article.