
Abstract
Using a discrete choice experiment, owner occupants of non-apartment dwellings in Victoria, Australia were asked to evaluate alternative electricity contracts with features including increased renewables, different technologies, and demand-side management policies. We assert that a respondent’s financial literacy is correlated with whether they perceive the contract features as investments. To test this, respondents completed a financial literacy quiz, with their corresponding scores used as an indicator of financial literacy. These scores were incorporated within a hybrid mixed logit model to evaluate whether financial literacy explains the variation in choices. Results indicate that respondents with higher levels of financial literacy had a higher willingness to pay for the contract features. This case study is relevant for an environment of rising electricity prices and the transition to greater reliance on renewables.
Introduction
Internationally, residential electricity prices have increased significantly over the previous decade. The factors driving these increases include domestic market structures, aging infrastructure and growth in renewables to achieve long-term climate policy objectives (International Energy Agency 2022). Recently electricity prices in the UK have increased sharply in the wake of BREXIT and increased demand for electricity post-lockdown with demand outstripping supply (Bolton and Stewart 2024). There were sharp increases in electricity prices, for EU countries dependent on Russian oil and gas for example, Germany, following the Russian invasion of Ukraine in March 2022 and subsequent sanctions (Prisecaru 2022). For countries such as Australia, households in some states faced double-digit increases in residential electricity prices in 2022 (Reserve Bank of Australia 2022). The previous decade had seen Australia move toward a sustainable energy generation mix (Csereklyei, Anantharama and Kallies 2021), nationally representing 32.5 percent of total generation (Clean Energy Council 2022). In the wake of market fluctuations, we explore the potential for infrastructure investment and demand-side management using a Discrete Choice Experiment (DCE), evaluating different energy contracts and obtaining Willingness to Pay (WTP) estimates for various contract characteristics, using the retail energy market of Victoria, Australia as a case study. A DCE allows for exploration of preferences for investment in infrastructure and the estimation of non-market values, for example, household preferences for a greener electricity mix. This method also allows for the evaluation of new or improved contract features which cannot be assessed using existing market data.
Rising prices present a challenge for achieving policy objectives focused on minimizing costs, maintaining a reliable energy system, and transitioning toward a low-carbon economy. These objectives make up the three competing elements of the traditional Energy Trilemma (Pliousis et al. 2019; Song et al. 2017; Tocock et al. 2024; Tocock et al. 2023). Although the urgency of the renewable generation transition remains, other demand side management measures or contract features could provide options for residential consumers, retailers, and regulators especially in the wake of recent market fluctuations.
This study provides insights into household preferences on different ways to manage price increases, reliability, and growth in renewables including demand-side management. Consumer contracts with demand-side features are potentially challenging for consumers to assess. One potential source of variation in household preferences is the financial literacy of the household. This form of literacy could influence the perceived benefits of various contract features and may be correlated with an individual’s propensity to focus on the upfront costs of a feature and discount the benefits realized over time. There is some evidence that this is the case for decisions evaluating alternative energy-efficient appliances (Kallbekken, Sælen and Hermansen 2013). If financial literacy does influence the choices made between alternative features of an electricity contract, then it could explain why some features fail to gain public support even when the feature is justified as an investment leading to future benefits, for example lower energy prices. This can also create problems for regulators who may believe the features are not valued as much as they would otherwise be, leading to underinvestment in new technologies. In this study, respondents completed a financial literacy quiz as part of a survey. Since financial literacy is inferred rather than observed, the respondents’ quiz score is used as a proxy indicator of their financial literacy. We use this data and choices made in a series of residential contracts to estimate a hybrid choice model. The model accounts for potential measurement errors in this proxy and allows for correlations between the socio-demographic characteristics of a respondent with their quiz score.
The DCE was designed to support decision-making processes, for example informing firms whether their consumers will co-fund investments in energy infrastructure, or perhaps assist regulators in determining whether households’ value similar contract features (Khosroshahi et al. 2021). Our results suggest that a respondent’s financial literacy influences how they evaluate contracts within the DCE. Lower levels of financial literacy were found to lead to lower stated WTP for all contract features.
The rest of the paper is structured as follows. First, a summary of the Australian electricity market and related studies are provided. Next, the methods section discusses the survey design, including the sampling approach and experimental design utilized for the choice experiment as well as how financial literacy was measured. The econometrics of the hybrid choice model is then described followed by the results and discussion. Finally, the conclusions of the study are provided alongside possible avenues for future research.
Background
Investments associated with the introduction of Australia’s Renewable Energy Target (RET) have led to mixed results with respect to the effective price households pay per kWh of electricity consumed. This result is in part due to the expected merit order effect being offset by other factors. Between 2008 and 2018 electricity prices increased by over 5 percent per annum on average (Australian Competition and Consumer Commission (ACCC) 2018, 2019), despite an average 1 percent per capita reduction in consumption during the same period (Department of the Environment and Energy 2019). Between 2019 and 2021 prices were starting to fall (ACCC 2022), however this reduction is forecast to be short-lived. A reduction in wholesale prices driven by the merit-order effect (Figueiredo and da Silva 2019; Sensfuß, Ragwitz and Genoese 2008) has not been realized in Australia in part due to increases in the price of Liquefied Natural Gas (LNG) and exit of coal-fired generation (McConnell and Sandiford 2020; Simhauser 2018). The recent spike in the price of liquified natural gas or LNG required the Australian Energy Market Operator to temporarily suspend the wholesale spot market and has called on household to restrict appliance use during peak periods in June 2022 as a demand-side measure (Australian Energy Market Operator (AEMO) 2022).
In Australia retail electricity prices are regulated, where retailers are required to justify changes in retail prices (Australian Energy Regulator 2020). Regulators in the United Kingdom and Australia have increasingly been focusing on how households perceive the value of services provided by utilities (ACCC 2019; Essential Services Commission 2016). This is, in part, achieved by retailers offering retail electricity contracts in line with household preferences. Regulators have been hesitant to approve new contracts offered by retailers unless it is clear that they are in the best interests of consumers over time. One objective of this study is to evaluate whether existing service offerings represent value for money from the average household’s perspective.
Over the last twenty years, there have been numerous studies analyzing consumers’ willingness to pay for policies that reduce CO2-e emissions, including increased investment in renewable energy generation technologies (Alberini et al. 2018; Roe et al. 2001). One of the issues related to increased renewable energy generation is that they are often intermittent in nature, which is especially problematic when these sources of energy generation replace baseload generation technologies (Edenhofer et al. 2013). One solution to this problem is the installation of battery storage to allow low marginal cost renewable energy to be stored and sold in the peak period when demand is at its highest (Hanser et al. 2017; Ratnam, Weller and Kellett 2015; Sioshansi 2010).
In addition to supply-side investments, demand-side management policies could reduce or shift demand away from peak periods in the evening when generation is sourced from peak-load generators (Broberg and Persson 2016). Numerous market-based instruments have been developed over time, with mixed results regarding their efficacy in reducing or shifting aggregate consumption (Richter and Pollitt 2018; Strbac 2008). One specific problem relates to customer inertia, in that consumers tend not to actively review and change their electricity contracts to reduce costs (Giraudet 2020; Gleerup et al. 2010; Hortaçsu, Madanizadeh and Puller 2017). These observed behaviors are one potential explanation for the observed energy-efficiency gap (Gillingham and Palmer 2014; Jaffe and Stavins 1994). Some studies have observed that consumers do value having additional information about their electricity consumption, even if it does not prompt them to search for cheaper contracts (Gerpott and Paukert 2013; Kaufmann, Künzel and Loock 2013; Richter and Pollitt 2018).
There is a growing literature on consumers’ willingness to be flexible in their consumgption to reduce electricity costs in exchange for the disutility associated with changing habits (Kubli, Loock and Wüstenhagen 2018). This research, however, is largely focused on “prosumers”, households that both produce and consume electricity (Bergman and Eyre 2011; Parag and Sovacool 2016). As of 2021 this represents around 30 percent of all Australian households who have rooftop solar photovoltaics installed (Australian Renewable Energy Agency 2024). Another theme in the literature on habits, Tjørring et al. (2018) found that households were willing to shift their use of cleaning appliances to different times. Finally, Ruokamo et al. (2019) found that households required compensation for having their electricity consumption affected during the evening.
When households enter into electricity contracts, the price paid covers more than the wholesale cost of generation. Investments in infrastructure that delivers electricity as well as funding the RET are just some of the additional costs that are paid. Electricity that is renewable and reliable may represent an investment for households, in that more is paid today for future benefits to be enjoyed in the future. We hypothesize in this study that financial literacy may be a determinant influencing how households evaluate different contracts, representing different investment opportunities. Financial literacy is important since it determines an individual’s capacity to evaluate financial information. It has been shown to be correlated with effective retirement planning and positive savings behavior (Behrman et al. 2012; Clark, Lusardi and Mitchell 2015). It has also been shown as a predictor for determining the ability of individuals to make investment decisions (Stolper and Walter 2017). Meier and Sprenger (2013) investigate the relationship between financial literacy and time preferences. They find that individuals who participate in financial education programs have relatively lower discount rates when making investment decisions. Sutter et al. (2013) designed an incentivized experiment eliciting children’s and adolescents’ time preferences, with their results suggesting a link between impatience (higher discount rates) and poor saving choices. This link is also suggested in Lührmann, Serra-Garcia and Winter (2018), where a statistically significant relationship was found between financial education and the proportion of time-consistent choices. A paper by Brent and Ward (2018), the only similar study to our knowledge, finds that financial literacy influences the consistency of choices made when evaluating alternative hot water systems. Respondents who were less financially literate were more likely to purchase systems that had a lower upfront cost, but higher running costs over time. In this study our contribution to this literature is the expansion on the idea that financial literacy may be important to account for when households evaluate alternative electricity contracts, specifically influencing the willingness to pay for the features associated with each contract.
Methods
Survey Design
The survey used in this study was developed as part of a larger, multi-treatment project, investigating various aspects of consumer preferences for alternative electricity contracts. We use one treatment in this analysis. After reading a general information screen about the project, the households who provided informed consent (Ethics Clearance H0016832), proceeded to view information and answer questions across a four-part survey. The financial literacy quiz was the first part of the survey. The second part of the survey described how Australian retail electricity prices have increased across the country over the last ten years, as well as describing some reasons why this has occurred. The third part explained the contracts to be evaluated and their associated features. A cheap talk script was provided following the feature descriptions as a reminder to respondents to make choices as if they really had to pay. Following this reminder, respondents were asked to look at the combination of features and make a choice. Respondents then completed eight choice tasks selecting from three different electricity contracts. The fourth part of the survey involved answering attitudinal and socio-demographic questions. In the development of the survey, focus groups and in-depth interviews were conducted with paper copies of the survey to test wording and survey length.
The contracts that would be offered by retailers included a combination of the following features, namely changes in the amount of power sourced from renewable energy generation, limiting appliance use during the evening peak period, installation of batteries to store electricity that can be accessed by the community, and finally the installation of smart meters that would provide households with more frequent updates about the cost of powering their home.
Each feature was described as having the potential to lower future electricity prices within the national electricity market in the long run. During the time period when the survey was in-progress, renewable energy generation made up just over 15 percent of the national energy mix, with the majority of electricity generated from burning coal.
Peak energy consumption for households in Victoria, on average, occurs between the hours of 5pm and 8pm. During this time, peak load generation leads to substantially higher prices being demanded by generators. One way to lessen the need to access these higher priced sources is to restrict how much power can be consumed during this peak period by households. By default, to keep prices constant, all electricity retailers would restrict two of three possible consumption activities. The three activities mentioned included cooking, cleaning, and entertainment. A list of common appliances associated with each activity was also detailed to provide context. As part of the feature description, households would get to choose which activities they would restrict. Alternative contracts would allow for one or both sets of restrictions to be lifted, however, these options never had a zero-cost associated with them. Several questions queried whether respondents understood what these restrictions would mean for their electricity consumption habits.
Another feature presented was related to community storage. At the time of the survey, there were few large-scale batteries operating nationally. A major battery project had been built in South Australia which was widely reported (Sonali 2017), therefore, respondents are likely to have been aware of the potential for such battery projects. The description of this feature was based on the assumption that batteries would be usable as a replacement source of power during a blackout as well as a substitute for peak-load power sources in the evening.
The final feature described whether households could access their consumption information more frequently through the installation of smart meters. Currently, most Australian households only receive this information with their quarterly bill, whereas the smart meters would allow consumption information to be received either daily or in real-time, depending on the type of meter and frequency households prefer. For each of the contracts offered, except for the status quo contract, there is a cost imposed on the household. The cost was defined as an increase in the fixed component of the household’s electricity bill, paid every quarter for five years.
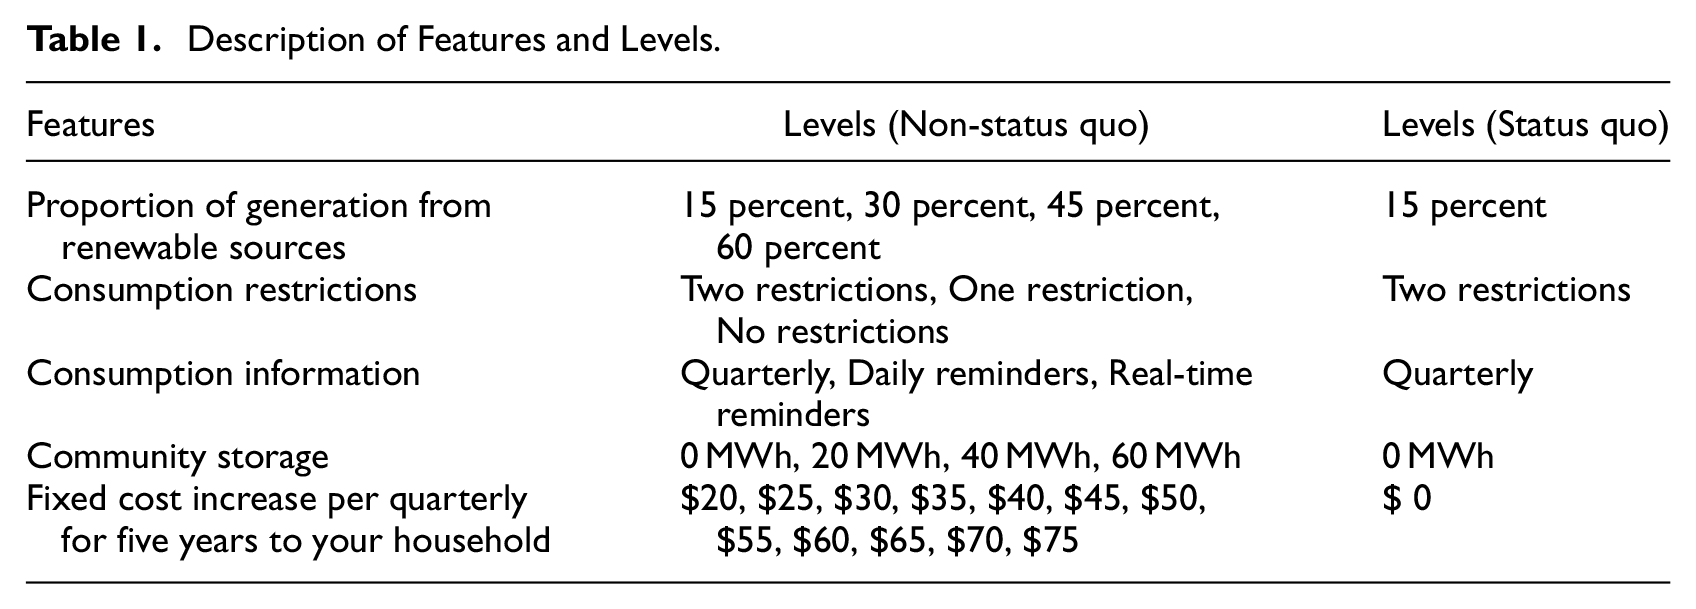
There was a business-as-usual, status quo contract, with no additional cost being imposed on households. This option resulted in no increased investment in renewable energy or storage activities (as a proportion of the current energy infrastructure mix), consumption information being provided quarterly, and two consumption activities being restricted for each household. An example of the choice tasks is shown in Figure 1. The list of features and their associated levels are shown in Table 1. Between each respondent, the order of contract features, apart from costs, was randomized to eliminate potential order effects.
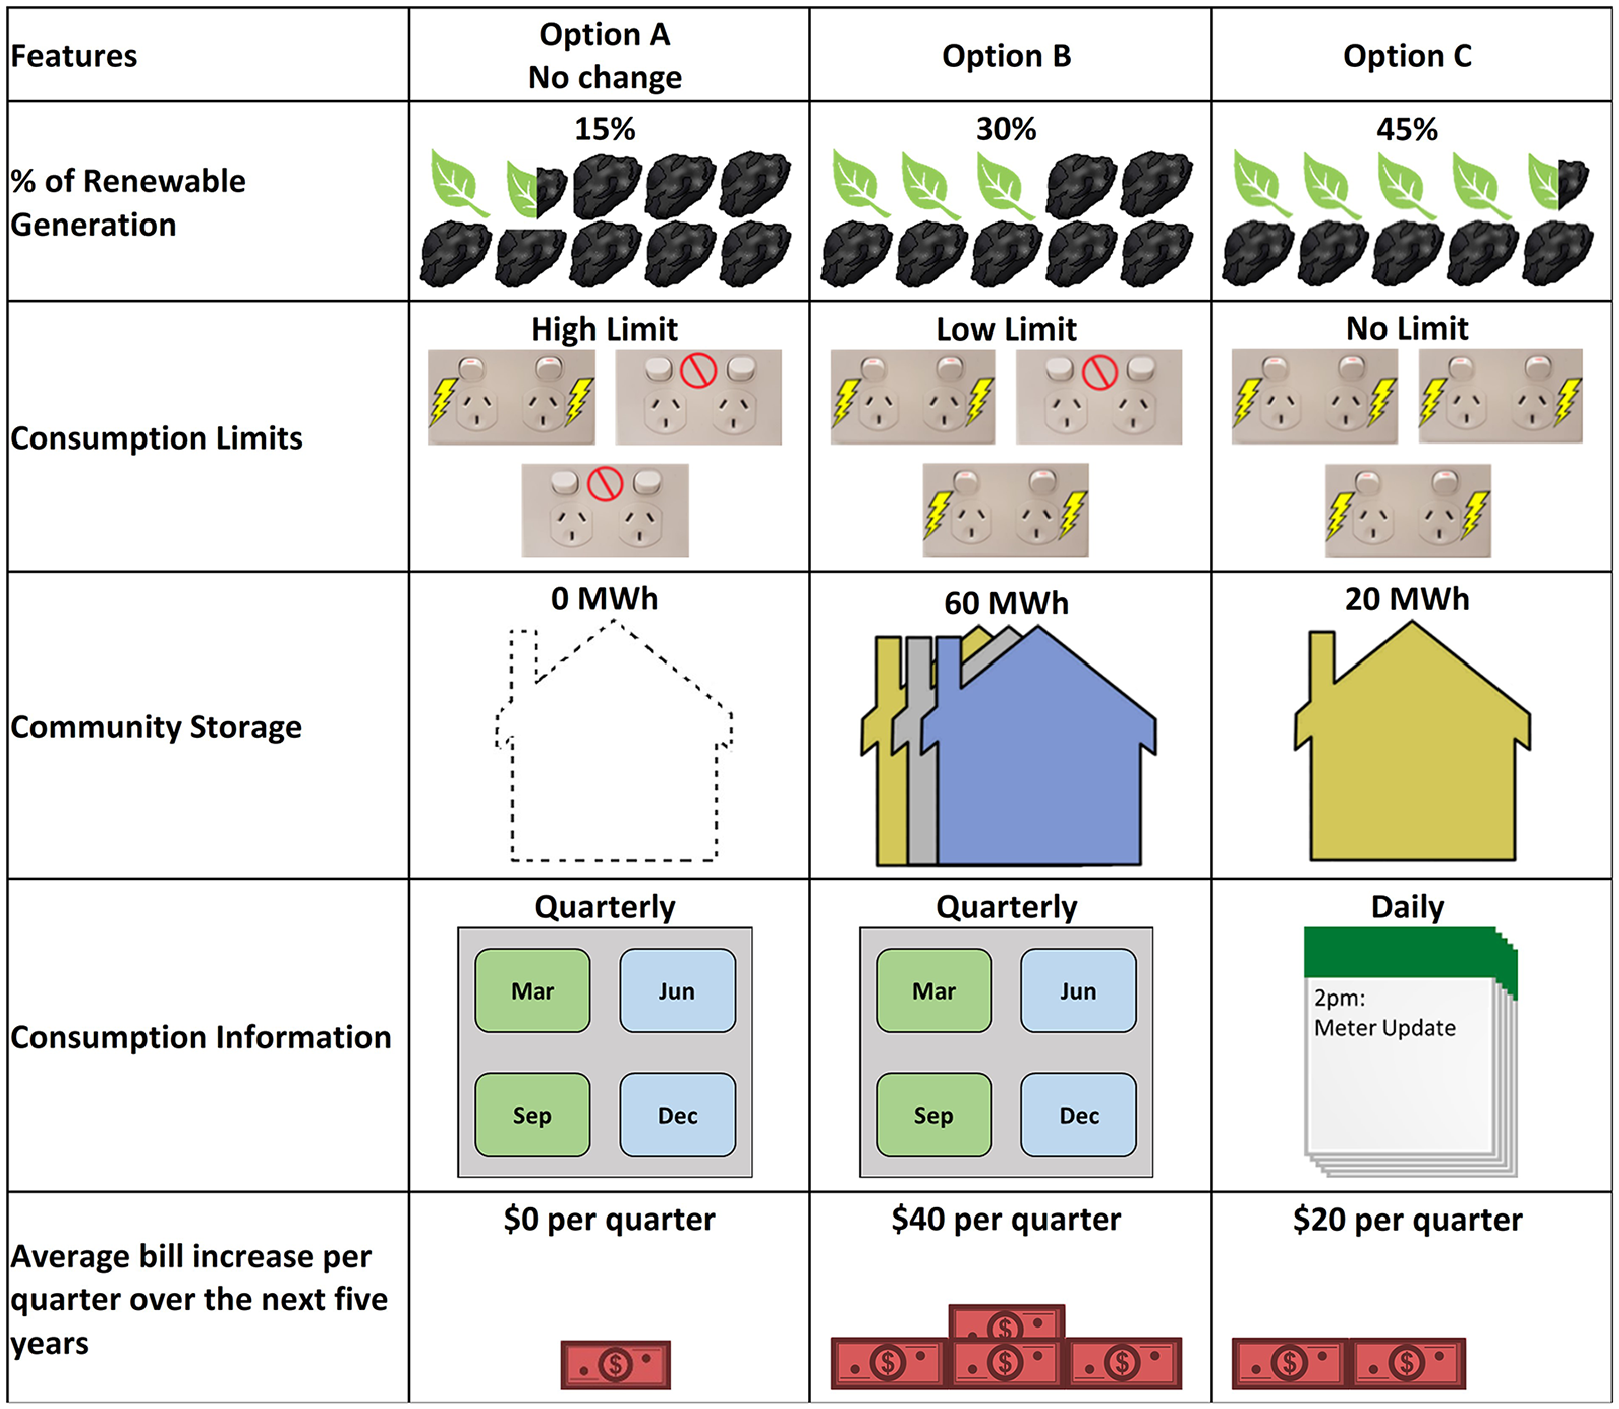
Example choice task.
Description of Features and Levels.
Survey Sample and Experimental Design
A stratified random sampling method was utilized across Victoria based on gender, age, and rural versus urban location. The survey was administered online in June 2019 by Online Research Unit (ORU; http://theoru.com/), an Australian panel provider who continuously refresh their panel using a combination of techniques to reduce issues of self-selection bias. All data collection occurred in May to June 2019. The data collection was not impacted by COVID-19. Retail electricity prices increased post-covid and the complex trade-offs became even more relevant for households impacted by increasing electricity prices.
An efficient design, based on a multinomial logit model, was initially developed using priors obtained from the literature, specifically priors relating to renewable energy investments (Brennan and Van Rensburg 2016; Ozbafli and Jenkins 2016). For the other features, namely consumption limits, storage, and consumption information, no priors were available. The expected sign for these parameters was positive, so they were calibrated to ensure utility balance and no dominated alternatives (Bliemer and Collins 2016). All designs were generated using Ngene version 1.2 (ChoiceMetrics 2018). All designs estimated included the main effects only.
The initial design was piloted, and a basic model was estimated with the significant estimates included as priors in a Bayesian D-efficient design. For the parameters related to billing information, storage, and no consumption limits, the estimated coefficients were not significant in the simple multinomial logit model estimated using pilot data (n = 56). It is not always possible to know if a statistically insignificant parameter is due to the small size of the pilot or due to the feature being unimportant to respondents. These parameters were set to be positive to balance utility and ensure no dominated alternatives. The final design included forty-eight choice tasks divided into six blocks with a simulated Bayesian D-efficient error of 0.003448.
Measurement of Financial Literacy
Several methods have been developed to measure a respondent’s financial literacy. The most prevalent approach involves test-based measures (Hung, Parker and Yoong 2009), whereby responses to a set of questions pertaining to specific financial concepts are often aggregated. Other methods include estimating effects using indicator variables (Gathergood 2012; Jappelli 2010). Self-assessed measures of financial literacy are another approach, whereby financial literacy is inferred from a respondent’s self-assessment (Stolper and Walter 2017).
A set of questions assessing each respondent’s knowledge of financial investments were used to measure financial literacy. The quiz was designed for Australian respondents with experts in financial planning to assess the likelihood that a consumer could make sound, independent financial investment decisions (Louviere et al. 2016). Other studies that have focused on energy-related financial literacy questions, for example Blasch et al. (2021) and Filippini, Kumar and Srinivasan (2020). These indexes were used to test the link between financial literacy and the purchase of energy-efficient durable goods. We opted for the use of investment-specific measures of financial literacy. We hypothesized that households who have relatively more knowledge of concepts related to financial investments would also perceive the contract features as investments and therefore have a higher willingness to pay.
Seven questions from the quiz related to financial investments were included in the survey and were answered by all respondents. The questions asked are shown in Table 2 below.
Financial Literacy Questions (Multiple Choice).
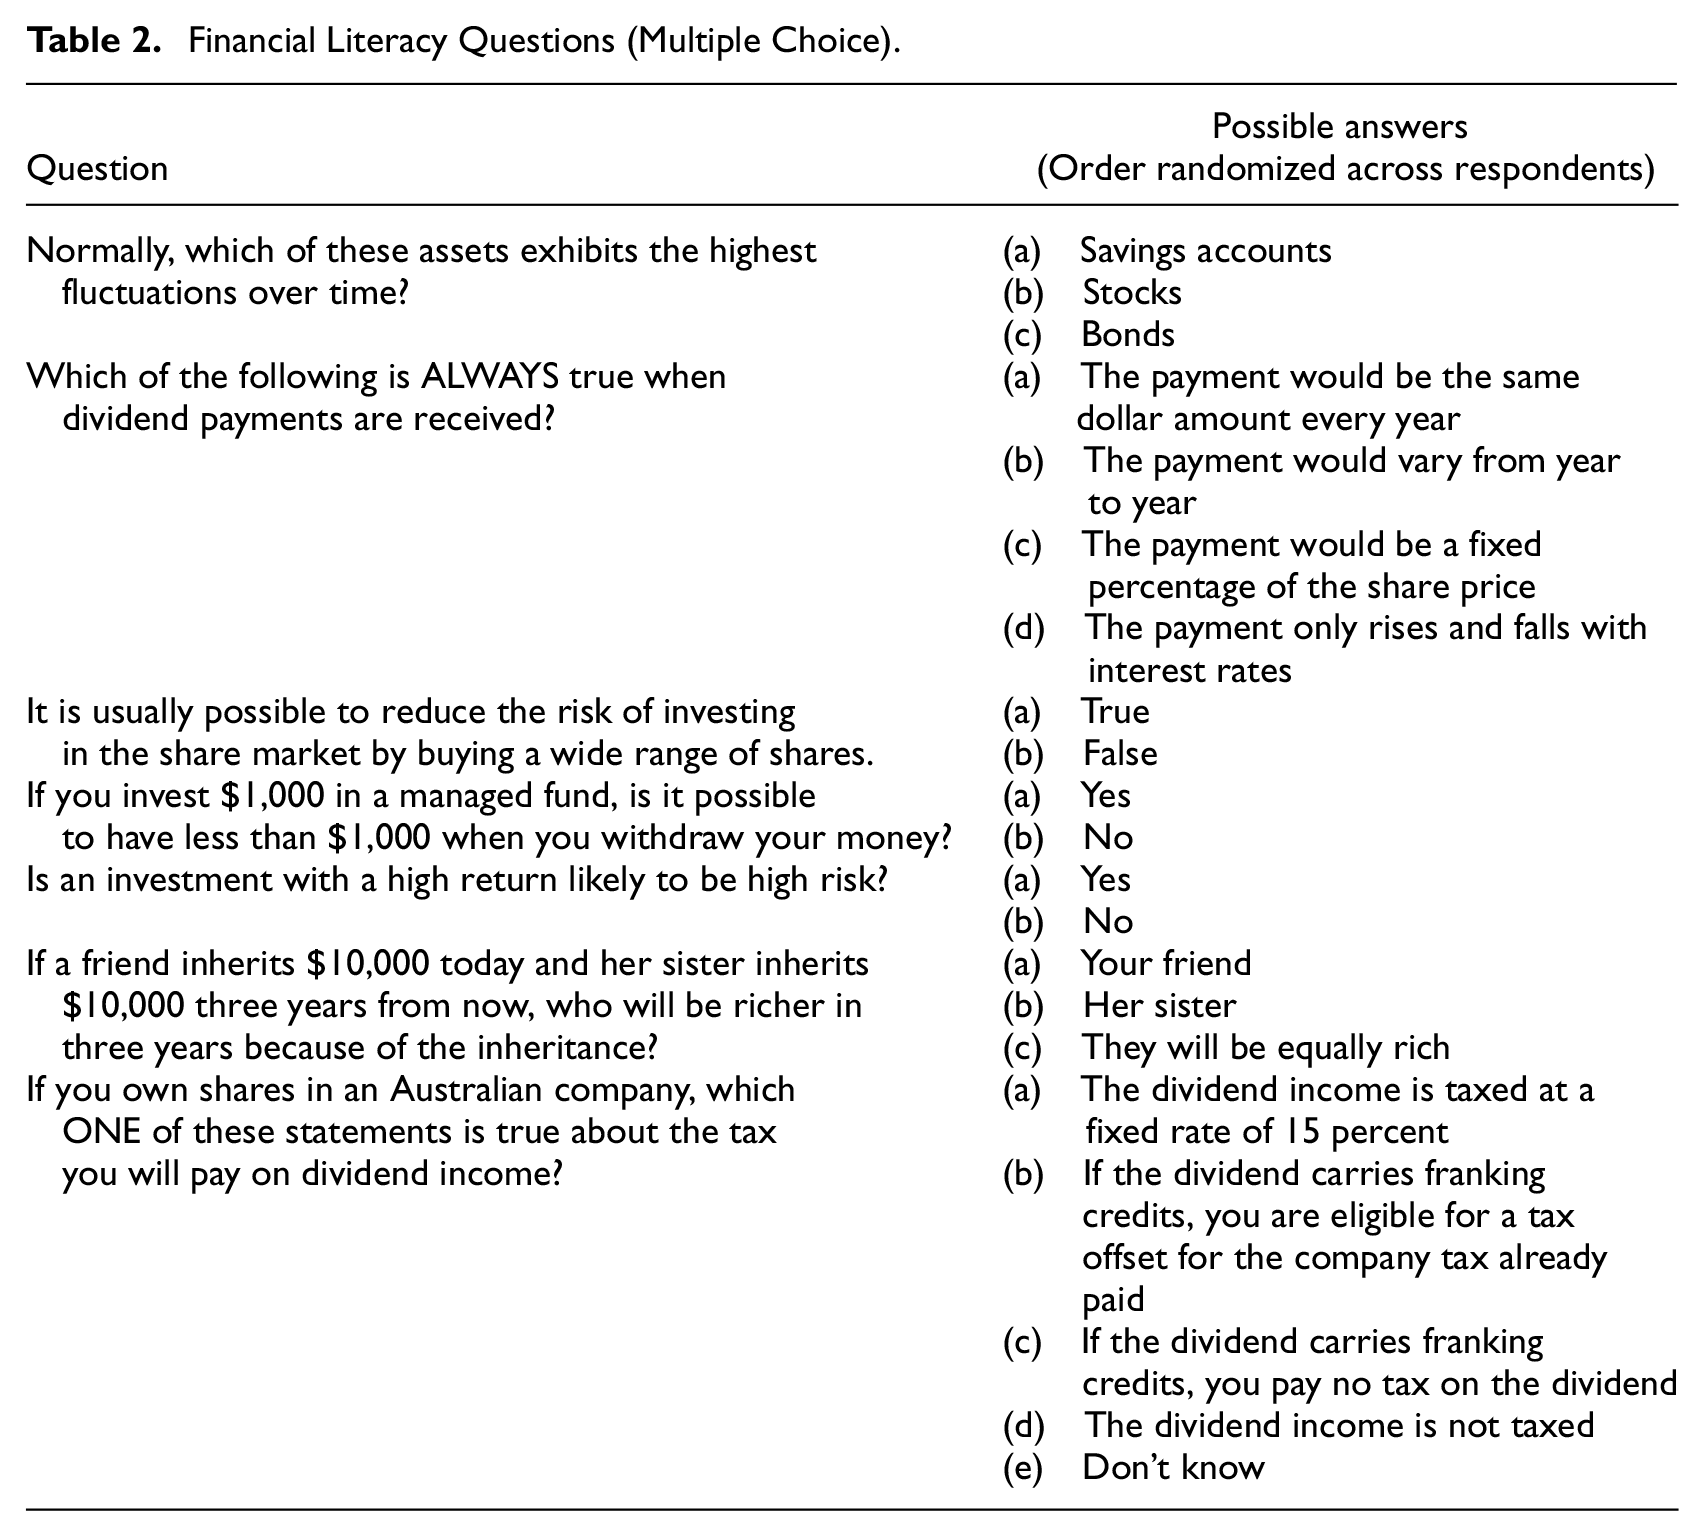
The order of the questions was randomized between respondents to eliminate potential ordering effects. Each question was worth one point, with a maximum score of seven points, representing the highest level of financial literacy. Although higher scores imply higher levels of financial literacy, the scores themselves are ordinal. Each question has an unequal weighting in terms of their importance in assessing an individual’s financial literacy. Consequently, including the scores as interaction terms would lead to measurement error. The choice of modeling these scores as part of a hybrid choice model can address the measurement error issue (Vij and Walker 2016). In addition, it allows for the linking of socio-demographic factors with the respondents’ scores. It was assumed that a high level of financial literacy may be necessary to evaluate electricity contracts involving multiple features associated with investments in energy infrastructure and policy. The non-status quo contracts incurred costs every quarter for five years. The benefits of increased renewables and battery storage, however, are long-term. For example, increased renewable energy generation leads to less reliance on fossil fuels, reducing the associated negative externalities over time. The costs of installing smart meters could be offset through cost savings as consumption information allows households to understand how to lower their future electricity bills. Finally, paying for the removal of restrictions could better align the high costs of generation during the peak period with the final prices paid by households.
Model Specifications
A random utility framework underpins our model of consumer preferences for electricity contracts. With this framework, each decision maker n is expected to obtain a level of utility from a specific alternative j for choice task c equal to

Based on this specification,

The basic multinomial logit model is restrictive in the assumptions made regarding preferences and decision heuristics. To account for preference heterogeneity, a mixed multinomial logit specification was employed utilizing both random parameters and an error component. Preference heterogeneity for each contract feature is modeled through the fixed preference parameter is now expressed as shown in equation (3):

where the first component
For this study, a three-alternative unlabeled choice experiment has been created with one of the alternatives specified as the status quo. To control for left-right bias and/or status quo bias, three additional parameters have been included in the model. Two alternative-specific constants are estimated (as random parameters) for the status quo contract and the third contract (Option C). Further, a zero-mean normally distributed error component has been included for the two non-status quo alternatives to account for potential differences in substitution patterns between the status quo and non-status quo alternatives (Herriges and Phaneuf 2002; Scarpa, Willis and Acutt 2007).
In this study, the choice model is directly estimated in Willingness to Pay Space (WTPS; Train and Weeks 2005), as shown in equation (4):

where
To model how financial literacy influences willingness to pay an interaction parameter is included in the specification of the cost parameter, as shown in equation (5):

where
Financial literacy cannot be directly observed as it is a latent variable and can therefore only be indirectly measured as responses to questions designed to measure the latent variable. To allow for the latent nature of financial literacy, a hybrid choice model can be used to simultaneously measure the latent variable analyzed as well as its effect on the discrete choice experiment (Ben-Akiva et al. 2002; Daly, Hess and Train 2012). This modeling approach can also address issues related to measurement error with latent variables (Budziński and Czajkowski 2022). Figure 2 shows an overview of how the latent variable model fits in with the current discrete choice model.
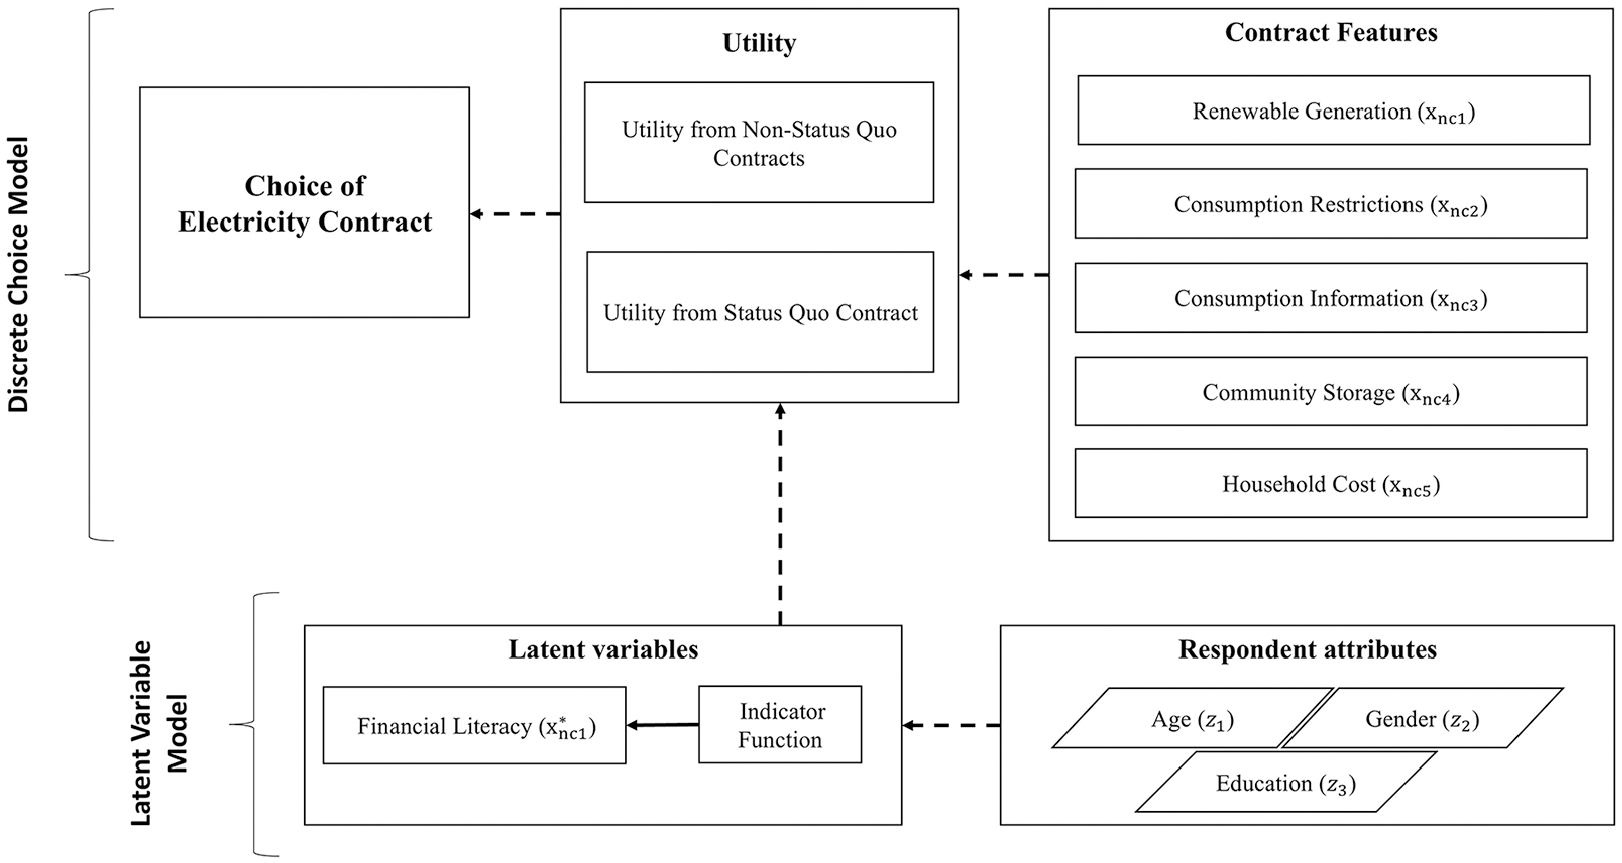
Overview of hybrid mixed logit model.
Financial literacy is modeled using a structural equation estimating the correlation between literacy and socio-economic characteristics, as shown in equation (6):

where,
The latent variable is also linked to an indicator function, in this case, the individuals’ score for the financial literacy quiz via equation (7):

with
Both the choice model and latent variables are solved simultaneously. The log-likelihood function is solved using simulated maximum likelihood, with the combined solution to equations (4) and (7) being shown as:
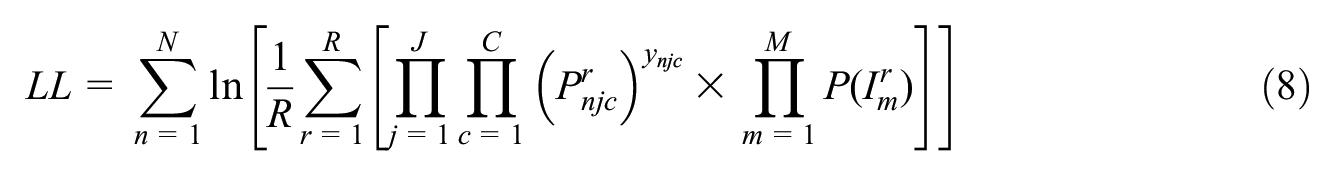
where,
Results and Discussion
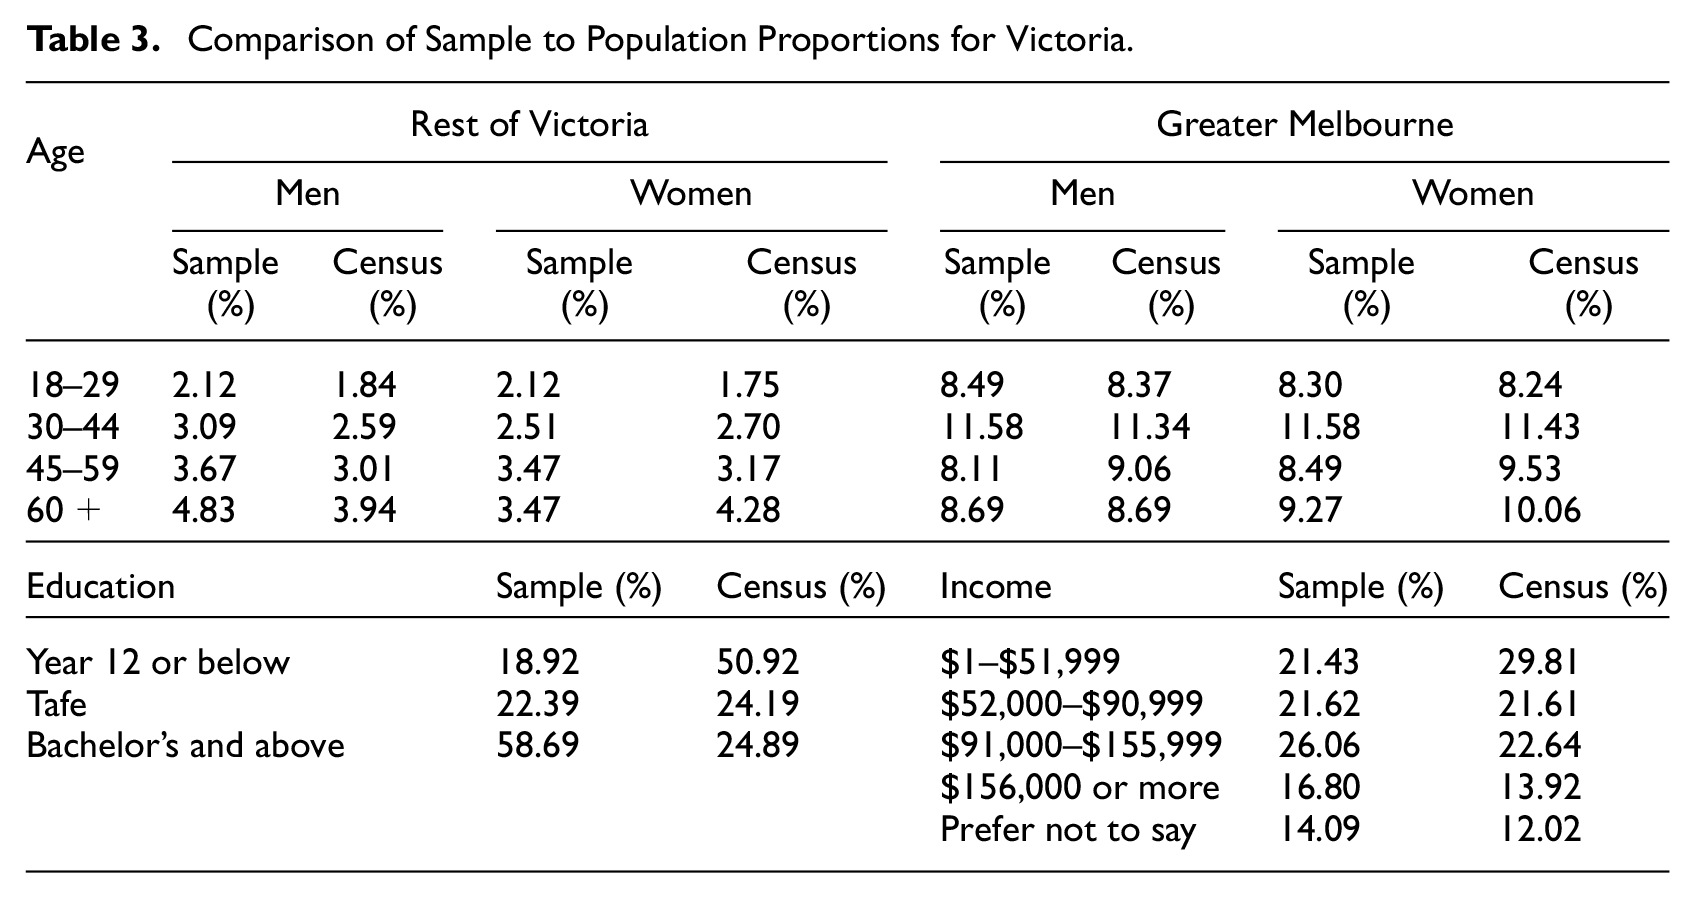
In total 18,250 invites (random sample of the ORU panel stratified by urban/rural, age, and gender) were sent out with reminders in three waves to obtain 518 respondents in total. Socio-demographic targets were used in estimating the required number of observations, but not imposed as quotas. To be eligible to complete the survey, the respondent had to be owner-occupier (with or without mortgage) of a single-family, detached house and responsible for the electricity bill (thus excluding renters and occupants of apartments, townhouses, etc.). The sample respondent characteristics reported in Table 3 are compared with state proportions based on the 2016 census. 2 Although we did not see any statistically significant difference between the sample and census proportions of age and gender there are differences in terms of education and income. In our sample there was an oversampling of respondents who had stated their highest stated level of education was a bachelor’s degree or higher. There was also an under sampling of lower-income households. Consequently, there is a limitation as to how generalizable the reported results may be. We expand on this point further at the end of the paper.
Comparison of Sample to Population Proportions for Victoria.
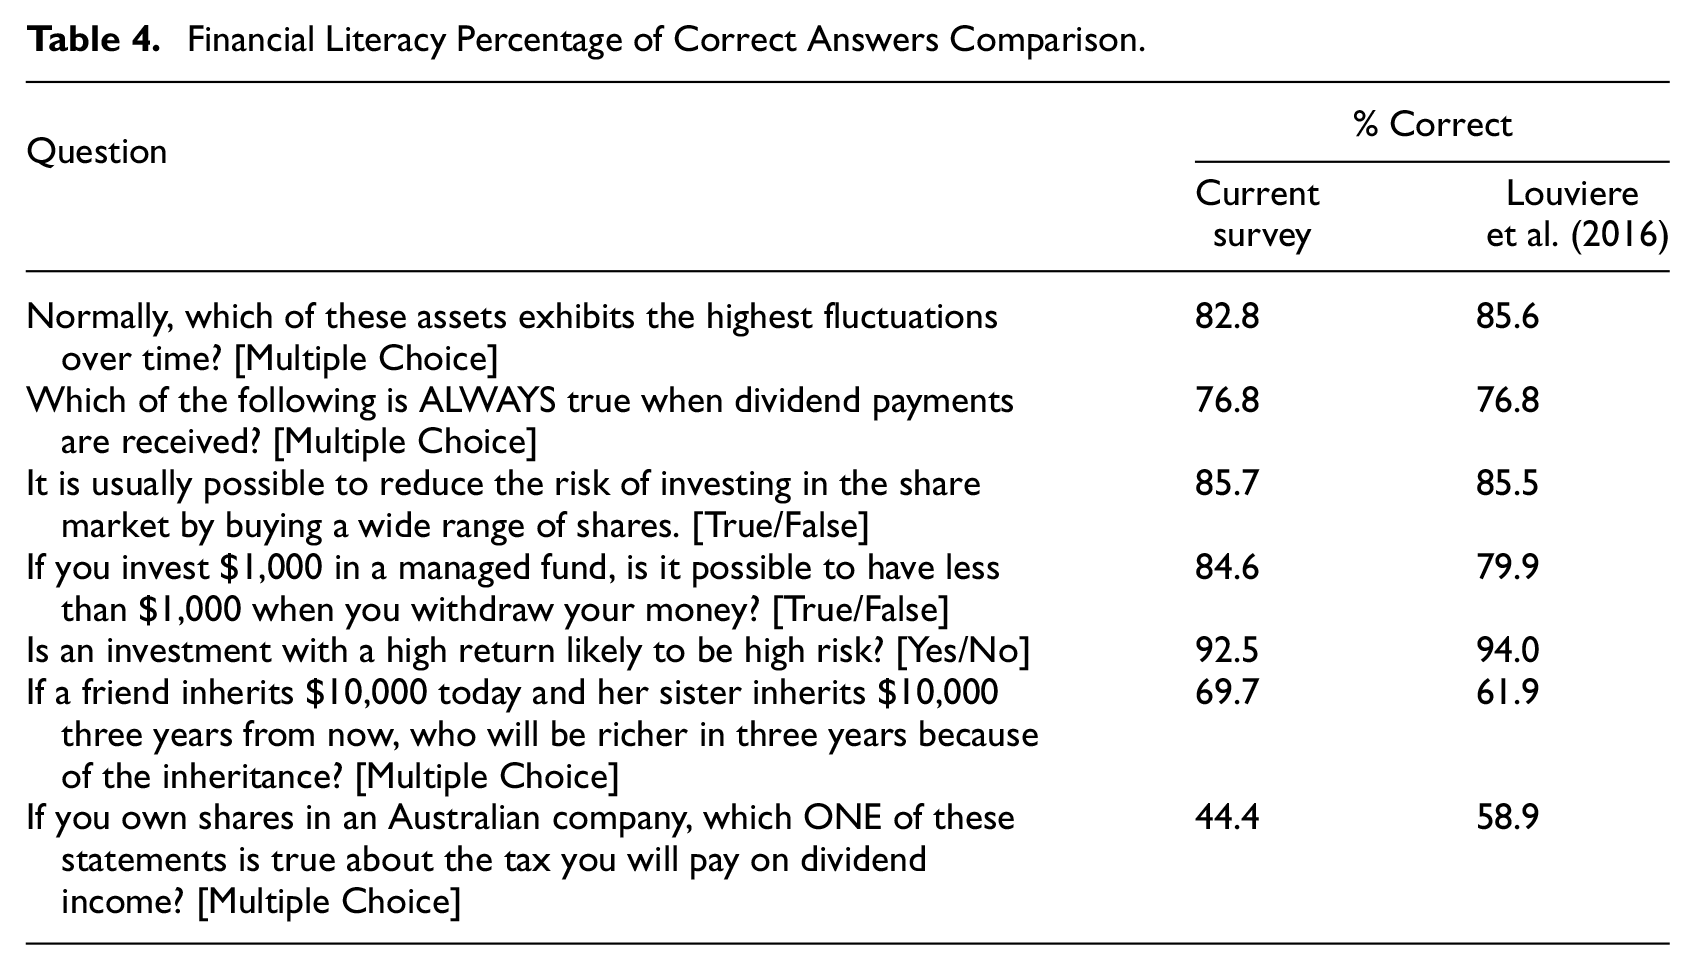
For the financial literacy quiz, each respondent completed seven questions as shown in Table 4. When compared to the results reported in Louviere et al. (2016), the percentage of correct answers is comparable for most questions. There was an exception with one question regarding the tax consequences of dividend income where we added “I do not know” as a response, which was not the case in Louviere et al. (2016). This response was added based on feedback received in focus groups. These responses were then randomly assigned to the remaining results in a similar proportion of correct responses.
Financial Literacy Percentage of Correct Answers Comparison.
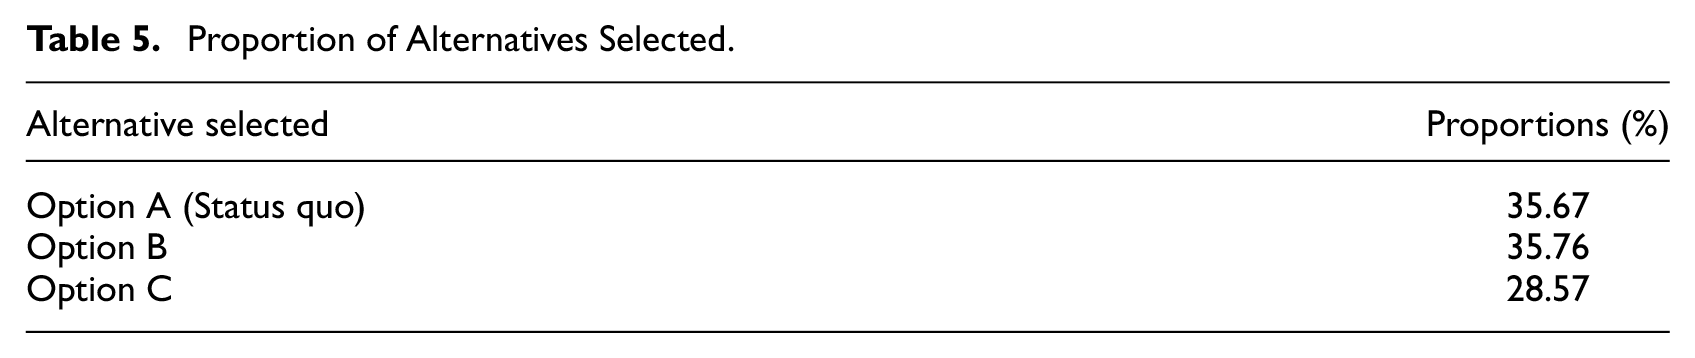
The choice frequencies for each of the contract alternatives are shown in Table 5. More than a third of all choices involved selecting the status quo contract. This result suggests that there is a significant proportion of respondents selecting the status-quo contract despite having two consumption restrictions imposed on the household. Of all the respondents who completed the survey, 26 (five percent) selected a contract that involved at least one restriction being removed for every choice task.
Proportion of Alternatives Selected.
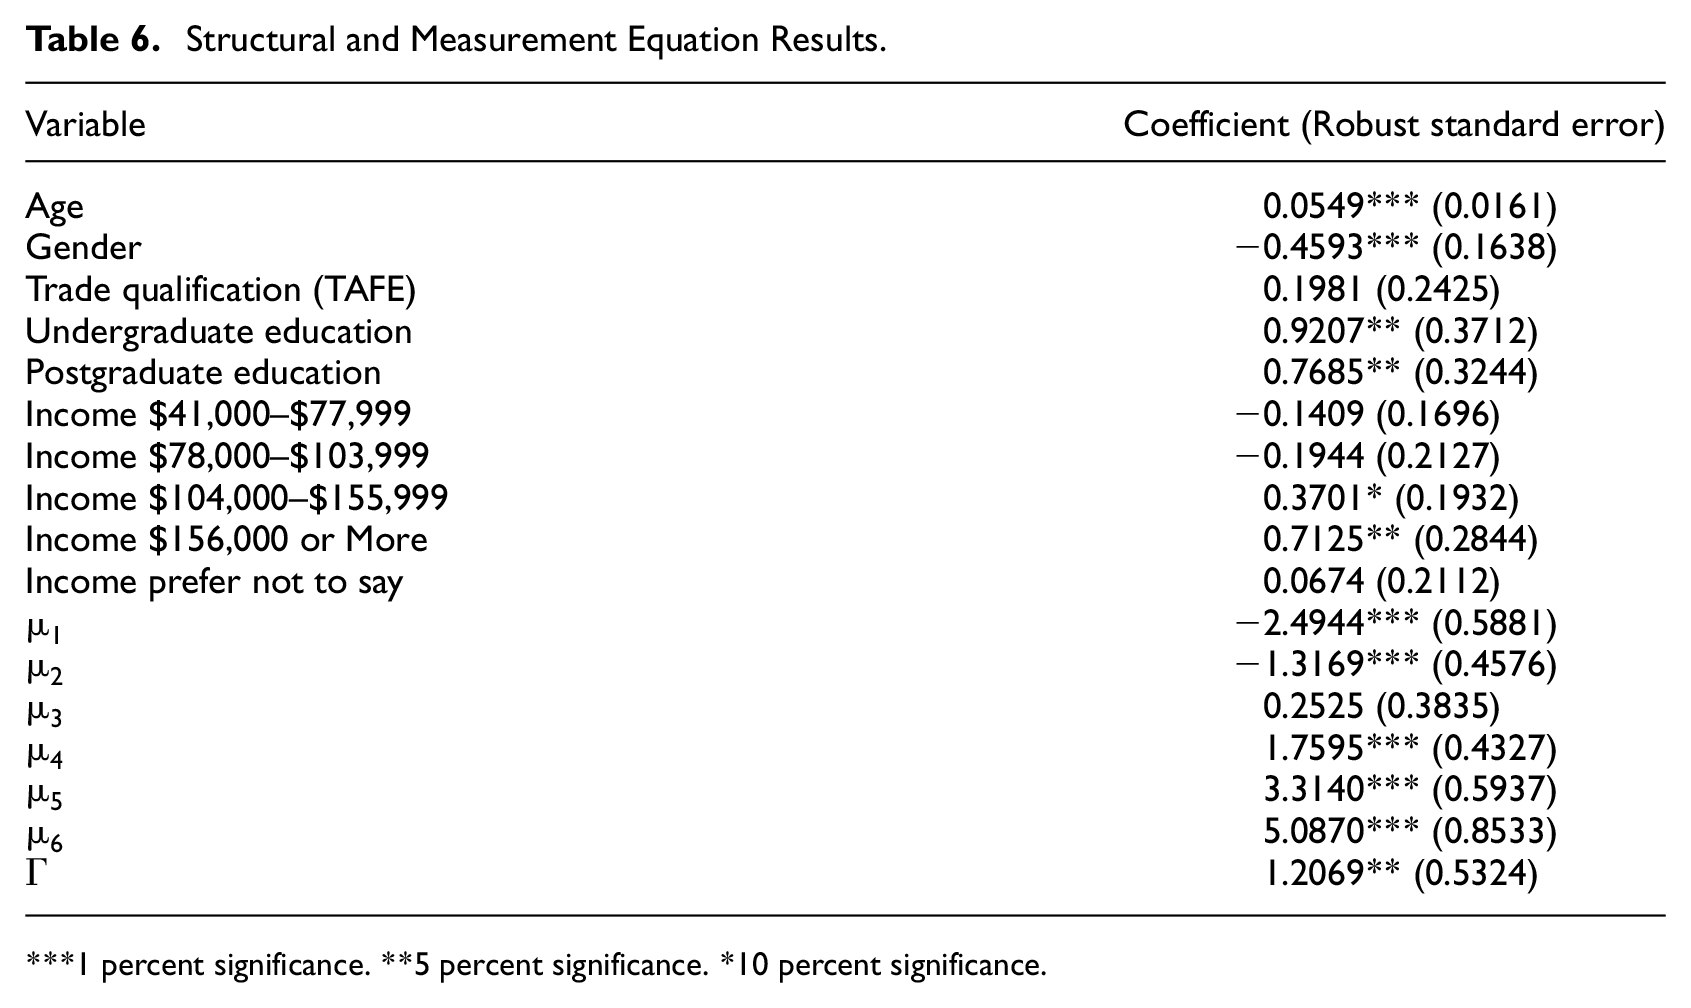
The socio-demographic factors included in the structural equation model are all statistically significant, as shown in Table 6. Older, male, and more educated respondents were more likely to be financially literate. In terms of the relative magnitude of the education parameters, we do not have sufficient statistical evidence to suggest any difference between respondents who have an undergraduate versus postgraduate degree as their highest level of education. The negative coefficient for gender (female = 1) is consistent with past studies (Bucher-Koenen et al. 2017; Klapper, Lusardi and van Oudheusden 2015). The sign on education is also consistent with past studies (Christelis, Jappelli and Padula 2010; Lusardi, Mitchell and Curto 2010). The positive relationship between age and financial literacy is less clear, with some studies suggesting a non-linear relationship, with financial literacy increasing up until a certain age, then falling (Finke, Howe and Huston 2017; Gamble, Juliusson and Gärling 2009). A quadratic term for age was included in an alternative model, however, the final log-likelihood for this model was inferior. Income was found to be statistically significant for the highest levels (household income exceeding $156,000 per annum). This result is broadly in line with past studies, see for example Lusardi and Mitchell (2014) and Mauldin et al. (2016). Finally, for the measurement equation the gamma parameter is positive and significant, suggesting that higher levels of the latent variable lead to a greater likelihood of scoring higher on the financial literacy quiz. The threshold parameters are all significant except for two levels, which correspond to lower scores. This is not surprising given the relatively few respondents who correctly answered a maximum of up to four questions.
Structural and Measurement Equation Results.
1 percent significance. **5 percent significance. *10 percent significance.
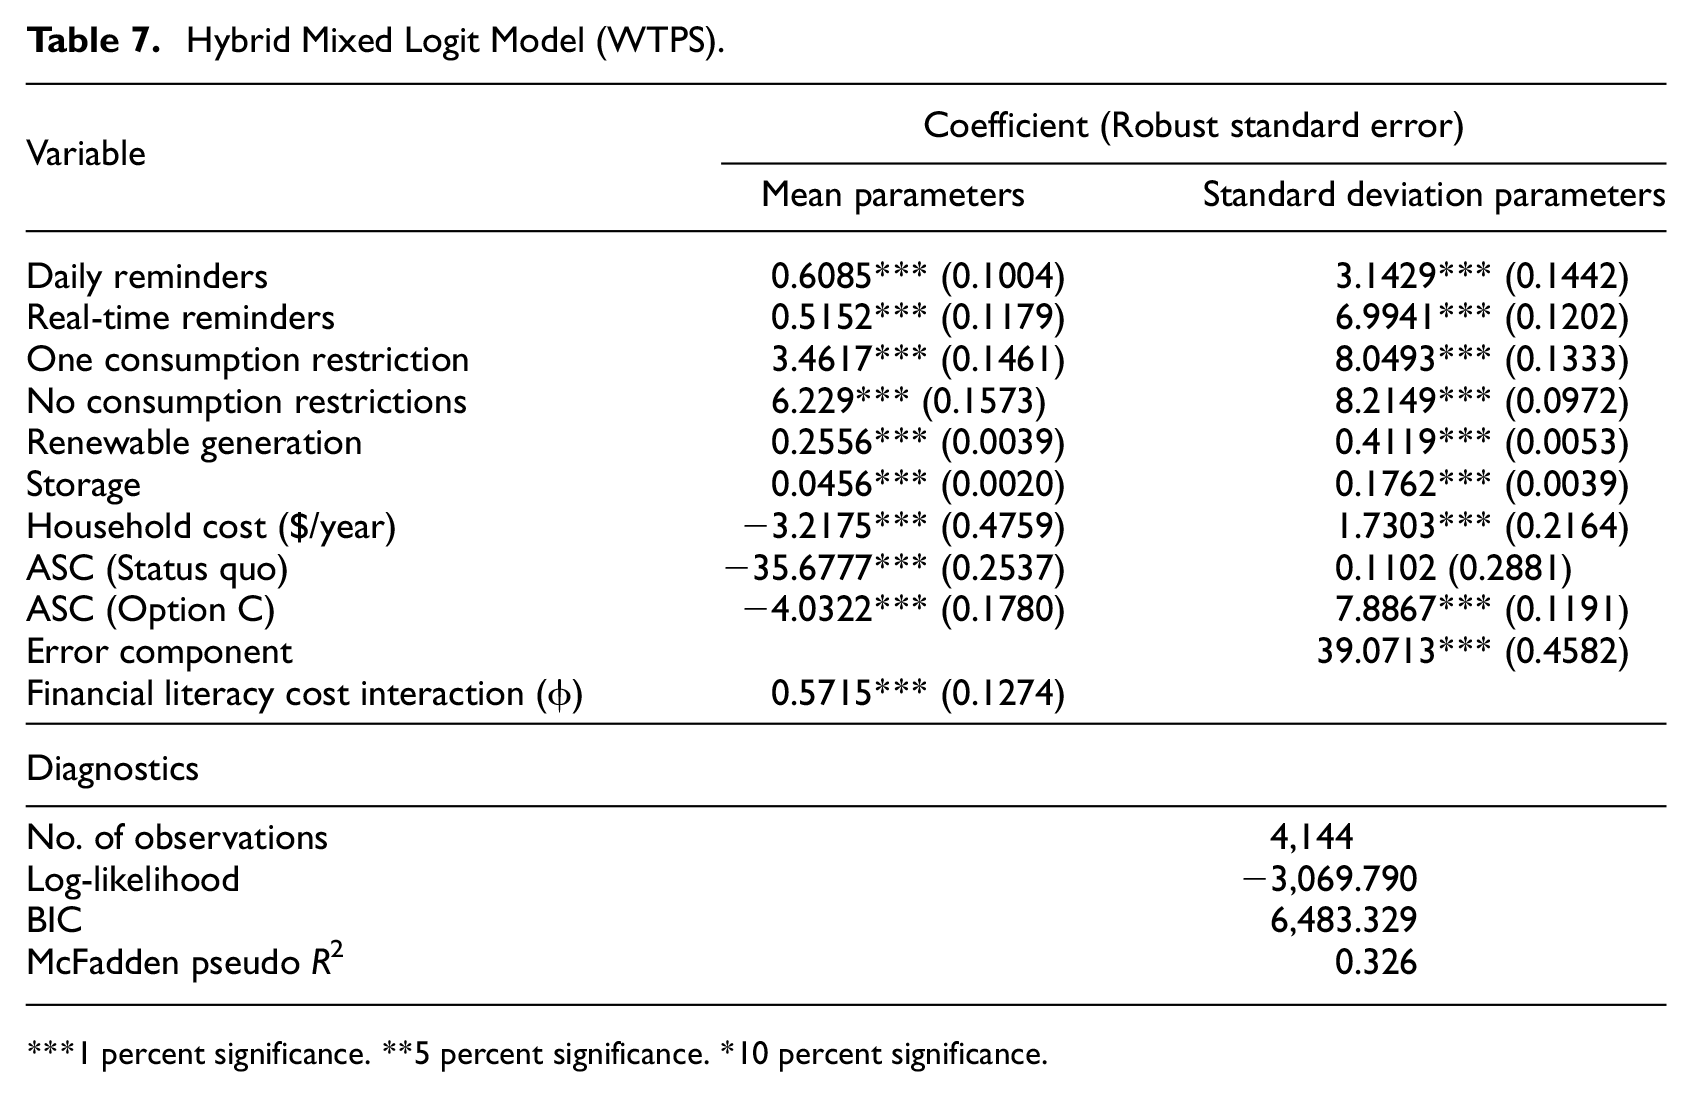
The results of the Hybrid Mixed Logit Model are reported in Table 7. Starting with the mean parameters, all features are statistically significant and have the expected sign. The alternative-specific constants are negative, suggesting that there is unobserved heterogeneity that leads respondents to select contracts that are not the status quo or option C. In terms of the relative importance of features, removing consumption restrictions was the most important for respondents.
Hybrid Mixed Logit Model (WTPS).
1 percent significance. **5 percent significance. *10 percent significance.
For the remaining features, it was assumed that more frequent information would allow households to better optimize their consumption (Filippini, Hirl and Masiero 2018). Gerpott and Paukert (2013) found that German households were willing to pay a one-time levy for consumption information, but not an ongoing monthly fee. Kaufmann, Künzel and Loock (2013) found that Swedish households were willing to pay up to 1.55 CHF on top of their existing tariff for real-time information shown on an in-home display. The difference in mean estimates for the billing reminders suggests that it is better to have more information, however the perceived differences in the value of daily versus real-time information is minimal. The small WTP values in our study may also be due to the perceived low economic benefits and privacy concerns associated with smart meters identified in previous studies (Léautier 2014; von Loessl 2023).
In terms of consumption restrictions, the results suggest that consumers would rather have no restrictions on their consumption activities. This being the first study to estimate this specific type of restrictions, there are no direct comparisons. Kavousian, Rajagopal and Fischer (2013) identified numerous factors that influence household consumption based on smart meter data. They confirm previous studies concluding that energy consumption is driven by behavior rather than perceived efficiency gains (Cramer et al. 1985; Gouveia, Fortes and Seixas 2012). These findings suggest that households are opting out of consumption restrictions to preserve habits, rather than considering the efficiency gains from shifting some activities to other times of the day. The information regarding the type of tariff the household incurred was not collected in this study, although it could be a useful piece of information for any future research analyzing consumption restrictions with price-incentives.
The WTP estimate for the community storage feature has limited comparability with previous studies. In part, this is due to how we described the feature as a technology that reduced the duration of blackouts. Goett, Hudson and Train (2000) estimated that households were willing to pay a value of $1.21 cents per kWh to reduce outages from four 30-minute periods to two of the same length. Carlsson and Martinsson (2008) estimated that Swedish households are willing to pay 7.81 SEK to reduce power outages to a maximum of four hours over the weekend, although they noted significant heterogeneity with respect to the WTP, depending on when the outage occurs, as well as the length. The estimate in our study is closer to the lower end of the studies identified, with households found to be willing to pay an additional $ 0.1824 per year for each MW of battery storage installed. Using the Hornsdale Power Reserve battery capacity of 100 MW, the average annual WTP would be $18.24, which when considering the 30,000 homes that could be powered would lead to a benefit $547,000 per annum in addition to the other commercial benefits the battery provides (Global Infrastructure Hub 2019).
One explanation for the low WTP estimate is the fact that 44 percent of the cost of electricity bills goes toward supporting existing infrastructure and ensuring already high levels of system reliability (Australian Energy Market Commission 2020). Another potential reason is that batteries are not new sources of generation, but rather allow for energy to be stored and discharged later. Baseload renewable energy sources of generation such as pumped hydroelectric dams already exist in Australia and may be considered suitable substitutes. Finally, the relationship between large-scale battery storage and electricity prices may not be well-understood by consumers. Energy storage technologies, excluding pumped hydro storage, make up a small proportion of most countries’ existing energy infrastructure (International Renewable Energy Agency 2017). In Australia, the only large-scale battery storage in operation at the time of the survey was the Tesla-Neoen 100 MW lithium-ion battery, however, new installations in operation in 2021 total to 260 MW, with an additional 18,660 MW proposed for construction (AEMO 2021)
Finally, for the renewables WTP feature, we can compare the results with other studies focusing on renewable energy technologies, independent of the type of technology. Ivanova (2012) estimated that Queensland households are WTP an additional $28 AUD on top of their quarterly electricity bill to support renewable energy sources. Roe et al. (2001) found that US households were willing to pay an annual $21 US premium on top of their existing electricity costs. Our results are relatively lower in real terms. A general finding by Sundt and Rehdanz (2015) is that estimated WTP is generally lower in studies which do not specify the type of renewable energy technology. Another factor that may explain this result is that we expressed the change in renewable energy technologies as a percentage change, which previous studies did not. Our WTP estimates could be useful for policy evaluation, when combined with work by Nelson, Nolan and Gilmore (2021) where changes in the proportion of renewable energy and the reductions in Australia’s emissions profile have been modelled. Nelson, Nolan and Gilmore (2021) estimated that for every 1 percent change in renewable energy emissions have been reduced by 1.635 million tons each year. Although caution must be applied in assuming the same linear relationship going forward, the results in this study suggest that households are willing to pay more to reduce emissions.
For every feature, the associated standard deviation parameters are statistically significant, implying preference heterogeneity within the sampled population (Hensher, Rose and Greene 2015). A statistically significant error component suggests that respondents are trading off between the non-status quo alternatives differently relative to the status quo. The financial literacy cost interaction parameter suggests that the sociodemographic characteristics of the sample, which are correlated with the responses to the financial literacy quiz, also influence the willingness to pay for each of the contract features. 3 In terms of financial literacy and its influence within a discrete choice experiment, the only other paper that can be compared is the recent study by Brent and Ward (2018). Utilizing a similar methodology, they find that people who are financially literate make more consistent choices. There are however two important points to note when comparing results. In the Brent and Ward (2018) study, they estimate a Generalized Mixed Logit without the hybrid specification. They conclude that financial literacy is a source of scale heterogeneity, whilst in our study we find evidence that suggests that financial literacy may influence the willingness to pay for the contract features presented.
From a policy perspective, accounting for a respondent’s financial literacy can be important when considering policies that represent financial investments, such as investments in energy infrastructure. These investments are gradual, with the benefits sometimes not realized until many years after the costs have been incurred. This study finds evidence that the valuation of the features included in this choice experiment are correlated with the financial literacy of the respondent. Although the measure of financial literacy modeled in this paper is a proxy, nonetheless, it provides additional evidence that financial literacy does influence willingness to pay. If respondents do not consider the benefits associated with the features evaluated, they may only focus on the cost or complete preference elicitation exercises in a manner reflecting indeterministic preferences. One question that could be the focus of future research is whether financial literacy plays a role in explaining the choice heuristics utilized by respondent when evaluating contracts, and potentially whether financial literacy influences the scale parameter.
Conclusions and Future Research
Over the past decade, Australian households have been facing rising electricity costs. This study shows that there is still broad support for increasing investments that improve the existing network despite the rising energy prices for consumers. From a policy perspective in Australia, there appears to be support for additional renewable energy generation. In Australia, this is achieved through the long-run renewable energy target. In addition to funding more renewables, households are also willing to pay to support investments in battery storage. In this choice experiment, storage was presented as one way that would increase the reliability of the network. Battery storage, however, could also be used to partially address intermittency issues associated with renewable energy generation, thereby improving their perceived value within the national energy mix. From a regulator’s perspective, the significant WTP estimates suggest that consumers perceive battery storage as value for money.
The choice experiment explored the potential for consumption restrictions as well as the installation of smart meters. The results suggest that households do not want to change their habits during the peak evening consumption period at least prior to the latest large price increases. There is scope for rerunning this type of survey following the experience of some large price increases and calls for consumers to restrict usage at different times of day. In addition, there is also support for smart meters to monitor consumption habits. The benefits of smart meters relate to monitoring real-time consumption through daily reminders.
Finally, this study also looked at how financial literacy influenced the willingness to pay for the contract features presented. The results suggest that those respondents who were less literate, as proxied by the low scores on the financial literacy quiz, had a lower willingness to pay for each of the contract features. It is important to state some limitations regarding the generalizability of the results. The results reflect the responses of homeowners (with or without a mortgage) of non-apartment dwellings. Our results reflect the views of this subset of households and care should be taken in generalizing to a general population. In addition, the oversampling of respondents with bachelor’s or postgraduate degrees and under sampling of low-income households may have biased the measured impact of financial literacy on contract choice. Despite these limitations our results provide some evidence that improving the financial literacy of respondents could lead to the wider acceptance of contract features that reflect investments in the future, as opposed to features that merely reflect costs to be borne by households today. Related to this idea, for future studies, it may also be worth exploring a household’s financial literacy with their knowledge of other facets of the electricity network, or environmental problems more generally. Exploring these relationships may provide richer insight into the other factors that determine which households make consistent decisions. Another area for future research could focus on exploring in more detail the link between financial literacy and specific contract features.
Footnotes
Appendix
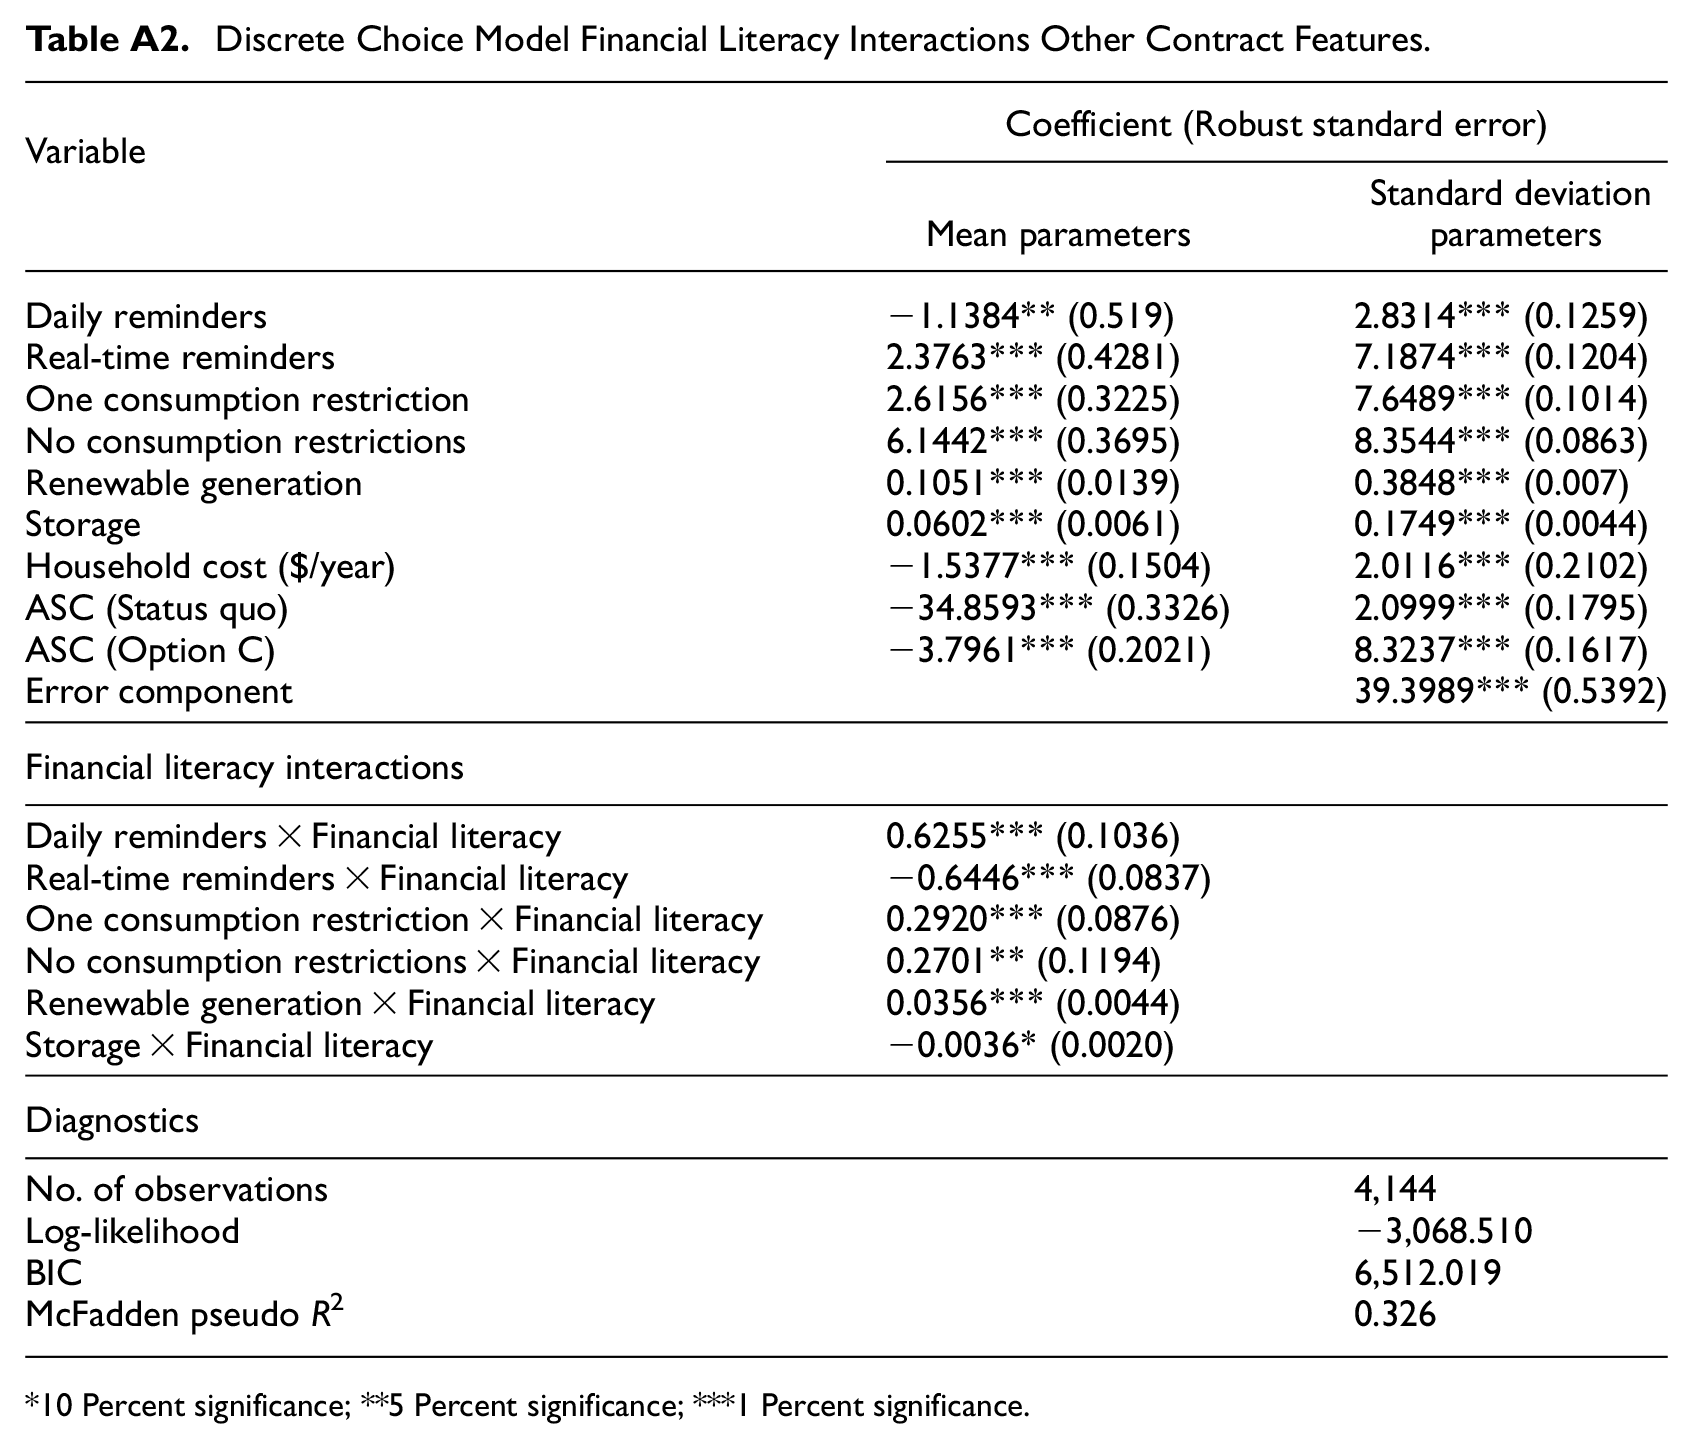
Discrete Choice Model Financial Literacy Interactions Other Contract Features.
| Variable | Coefficient (Robust standard error) | |
|---|---|---|
| Mean parameters | Standard deviation parameters | |
| Daily reminders | −1.1384** (0.519) | 2.8314*** (0.1259) |
| Real-time reminders | 2.3763*** (0.4281) | 7.1874*** (0.1204) |
| One consumption restriction | 2.6156*** (0.3225) | 7.6489*** (0.1014) |
| No consumption restrictions | 6.1442*** (0.3695) | 8.3544*** (0.0863) |
| Renewable generation | 0.1051*** (0.0139) | 0.3848*** (0.007) |
| Storage | 0.0602*** (0.0061) | 0.1749*** (0.0044) |
| Household cost ($/year) | −1.5377*** (0.1504) | 2.0116*** (0.2102) |
| ASC (Status quo) | −34.8593*** (0.3326) | 2.0999*** (0.1795) |
| ASC (Option C) | −3.7961*** (0.2021) | 8.3237*** (0.1617) |
| Error component | 39.3989*** (0.5392) | |
| Financial literacy interactions | ||
| Daily reminders × Financial literacy | 0.6255*** (0.1036) | |
| Real-time reminders × Financial literacy | −0.6446*** (0.0837) | |
| One consumption restriction × Financial literacy | 0.2920*** (0.0876) | |
| No consumption restrictions × Financial literacy | 0.2701** (0.1194) | |
| Renewable generation × Financial literacy | 0.0356*** (0.0044) | |
| Storage × Financial literacy | −0.0036* (0.0020) | |
| Diagnostics | ||
| No. of observations | 4,144 | |
| Log-likelihood | −3,068.510 | |
| BIC | 6,512.019 | |
| McFadden pseudo R2 | 0.326 | |
10 Percent significance; **5 Percent significance; ***1 Percent significance.
Acknowledgements
The authors are grateful to Jasmine Tocock for useful comments on financial literacy provided early in the development of this study.
Declaration of Conflicting Interests
The author(s) declared no potential conflicts of interest with respect to the research, authorship, and/or publication of this article.
Funding
The author(s) disclosed receipt of the following financial support for the research, authorship, and/or publication of this article: Funding for this study was provided by the University of Tasmania.
1
For all the error terms included in the hybrid model specification it is assumed that error terms are mutually independent (Vij and Walker 2016).
2
Results for the sample test of proportions are reported in the ![]() . We note for comparing education and income some aggregation is required to facilitate comparisons with census numbers, details of the aggregation are also mentioned in the Appendix.
. We note for comparing education and income some aggregation is required to facilitate comparisons with census numbers, details of the aggregation are also mentioned in the Appendix.