
Abstract
We assess the extent to which the implementation of Vision 2030 policies enhances the Saudi economy’s resilience to oil shocks. Using a dynamic stochastic general equilibrium model that captures the country’s economic diversification policies, we build a resilience index based on impulse responses to shocks. The policies considered have two opposite effects: reforming domestic energy prices, deploying renewables and introducing a value-added tax increase the volatility of macroeconomic aggregates, whereas economic diversification policies stabilize the economy. Overall, with Vision 2030 the economy’s resilience to oil price shocks increases by 10 to 60 percent, depending on how labor market rigidities and the recycling of fiscal revenues are accounted for. Oil prices remain the main driver of macroeconomic fluctuations. Our analysis shows that an oil-exporting country should design policy packages that balance structural reforms with economic diversification, in order to shield its economy against oil shocks while generating long-term welfare gains.
Keywords
1. Introduction
We investigate the extent to which key reforms under Vision 2030 render the Saudi economy more resilient to economic shocks. Prior to the introduction of Vision 2030, the oil sector accounted for 43 percent of total gross domestic product (GDP) at a time when oil prices were particularly low (2015). Further, oil revenues constituted 73 percent of total government revenues, and oil exports represented over 82 percent of total exports (SAMA 2021). The Saudi economy’s dependence on oil makes it sensitive to shocks to oil prices and production. The resulting fluctuations in economic growth and household consumption have a welfare cost that Pierru and Matar (2014) find to be significant. In 2016, Saudi Arabia announced its Vision 2030 program, 1 an ambitious plan that aims to reduce Saudi Arabia’s dependence on oil and diversify its economy. To reach this strategic goal, new economic and policy measures were introduced. This paper assesses the impact of four key government measures on the resilience of the Saudi economy: the introduction of a value-added tax (VAT), the reform of domestic energy prices, the deployment of renewables, and the public push toward economic diversification.
In January 2018, Saudi Arabia implemented a VAT of 5 percent on most goods and services, which was later increased to 15 percent in July 2020. The VAT is a source of non-oil revenue for the government that can be invested to foster economic diversification. In addition to the VAT, the government reformed regulated domestic energy prices in 2016, and subsequently in 2018. These reforms were accompanied by targeted cash transfers to support low-income Saudi households. The National Renewable Energy Program (NREP) was launched in 2017 to increase the share of renewable energy production in the Kingdom, achieve a balance in the mix of local energy sources and fulfill the Kingdom’s obligations in reducing carbon dioxide emissions. 2 In January 2021, the Saudi government announced that the country will base half of its power generation capacity on renewables by 2030, with the remaining half using natural gas. Vision 2030 includes a big public push toward economic diversification, which is key to mitigating the adverse impacts of oil shocks (IMF 2016). The government has embarked on expanding investments across various sectors of the economy, 3 with a specific focus on those sectors requiring intensive capital inputs. This includes the manufacturing sector, the digital economy, as well as the development of infrastructure for the tourism and leisure sectors. In our model, we incorporate this commitment to economic diversification as an objective of achieving a non-oil GDP share equal to 70.4 percent of the total GDP, as derived by Havrlant and Darandary’s (2021) analysis of Vision 2030. 4
Some studies, like Blazquez et al. (2021), examined the long-term implications of implementing a value-added tax, reforming domestic energy prices, and deploying renewables for the Saudi economy. They, however, adopt a deterministic approach and do not consider the resilience of the Saudi economy to shocks. To our knowledge, the literature does not provide an analysis of the effects of Vision 2030 economic policies on the resilience of the Saudi economy. This paper aims to fill this gap by proposing an approach to measure resilience and applying it to the Saudi economy.
To address the question of economic resilience, we introduce public investment as a driver for economic diversification in K-DSGE, the dynamic stochastic general equilibrium model used in Blazquez et al.’s (2021) analysis. Following Hallegatte (2014), we define resilience as the capacity of an economy to resist a particular shock and recover rapidly to (or above) its pre-shock level.
In this paper, we study the impact of Vision 2030, a comprehensive policy package, on the economic resilience of the Saudi economy. The policies considered have two opposite effects. On one hand, diversification increases the weight of non-oil GDP over total GDP, reducing the vulnerability of the economy to oil shocks. On the other hand, reforms such as the deregulation of domestic energy prices and the deployment of renewables lead to a decrease in domestic oil consumption, thereby increasing oil exports and amplifying the exposure of the Saudi economy to oil price shocks. Assessing how these two opposite effects interact and what is the resulting outcome is far from being trivial. In this paper, we do not look only at qualitative results, but we also study their quantitative dimension and show that the economic diversification effect prevails. This analysis, encompassing a package of interacting policies, contributes to our understanding of the potential outcomes for other oil-exporting countries attempting to undertake similar structural transformations in their economies.
The paper is organized as follows. Section 2 briefly presents the extended model. Section 3 describes the model calibration and validation. Section 4 presents the policy experiments and evaluates the impact of the reforms on the volatility of the economy, the relative importance of each type of shock, and the resilience of macroeconomic variables. Section 5 concludes.
2. The Model
We extend K-DSGE, the dynamic stochastic general equilibrium model used in Blazquez et al. (2019, 2021), to represent new features of Saudi Arabia’s economy. The main features of this model are as follows. The Saudi economy is represented as an oil-rich small open economy, with two representative (Saudi and non-Saudi) households and four production sectors. Firms produce two final goods, namely tradable and non-tradable goods, along with energy services and electricity. The model includes a resource sector with three energy sources: oil, gas, and renewable energy. The government collects tax revenues, provides public services and income transfers, and employs nationals; it also invests in oil, natural gas, renewable energy production, and infrastructure. We assume that the government maintains a balanced budget. 5 The economy exchanges a final good, the output of the tradable goods production sector, with the rest of the world, and it exports fossil fuels and acquires foreign bonds. As a small open economy, it takes the world prices of tradable goods, international gas prices and the global interest rate on foreign bonds as given exogenously. We include an oil price reaction function in the model to capture the impact of Saudi oil exports on the international oil market and, consequently, on oil revenues. The domestic currency is pegged to the United States Dollar. Figure 1 shows the structure of the model.
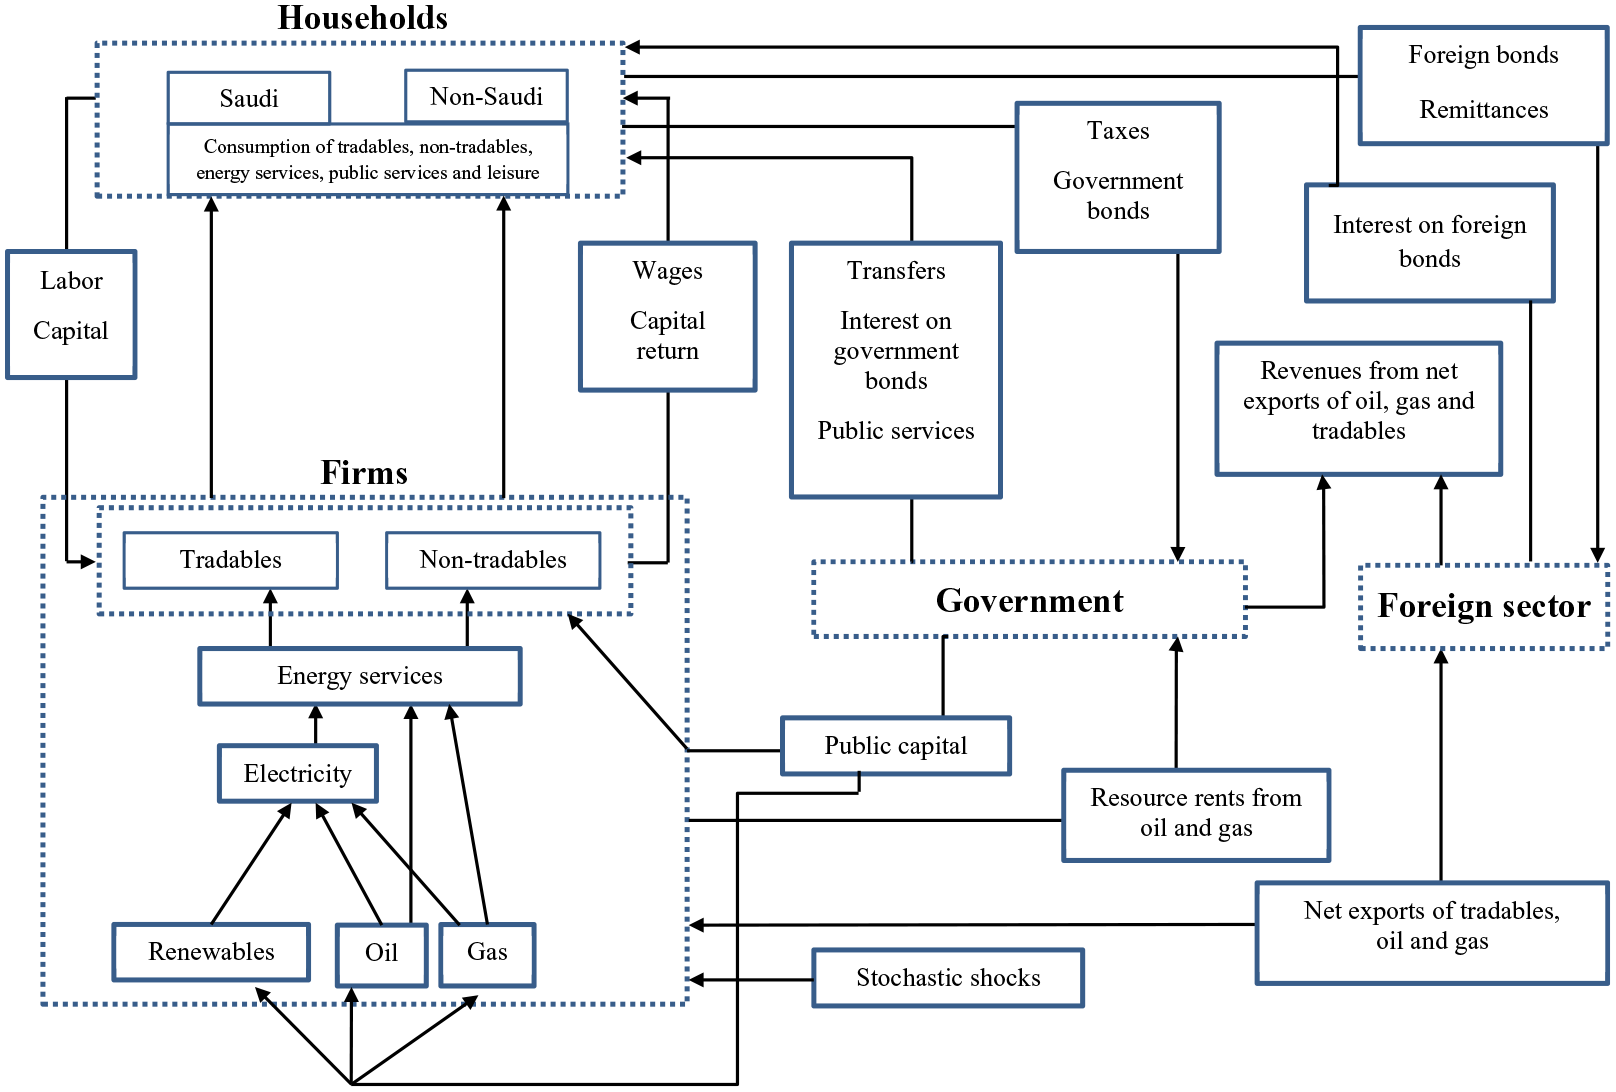
Structure of the K-DSGE model.
Our model builds upon the work of Blazquez et al. (2021) and incorporates significant enhancements. First, we introduce stochastic shocks to account for uncertainty and assess the economy’s resilience. Second, we modify the labor market representation to capture the specific characteristics of the Saudi labor market, incorporating labor market rigidities. Third, we use public investment as a mechanism for implementing the government’s economic diversification policies. Finally, we reformulate the electricity sector to capture the recent government decisions on the role of natural gas and renewable sources. For the sake of clarity, Supplemental Appendix A provides a description of the model, including all the main equations.
2.1. Shocks
As the goal of the paper is to analyze the impact of policy reforms on the resilience of the Saudi economy, it is essential to introduce uncertainty in the model and identify the specific shocks that may impact the Saudi economy.
The model accounts for four exogenous stochastic shocks: a productivity shock to the production of tradable goods, a productivity shock to the production of non-tradable goods, a shock to the international price of oil and a shock to domestic oil production.
The production functions of tradable (T) and non-tradable (NT) goods include a shock


where
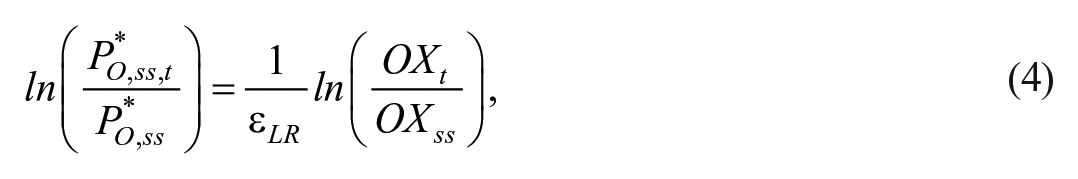
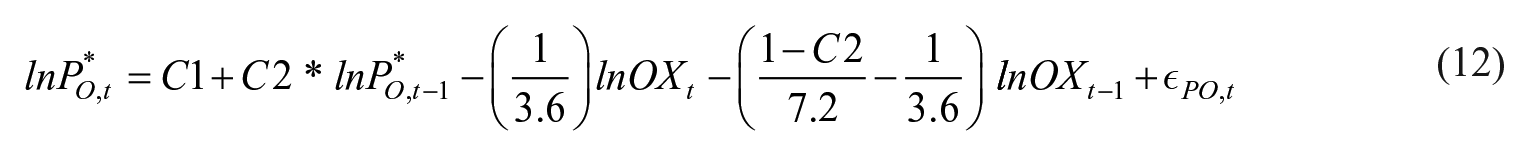
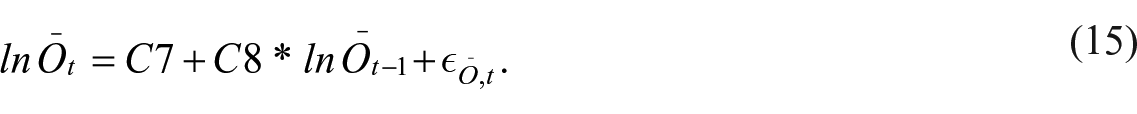
The international price of oil is assumed to evolve over time according to a mean-reverting process. Given that Saudi Arabia has a considerable market share (about 12%) of the global oil market, any changes to Saudi oil exports will have an impact on international prices and can significantly impact Saudi export revenues. Thus, we need to model the price changes caused by variations in Saudi exports. We consider a mean reverting process that embeds two adjustment mechanisms: (i) a partial adjustment toward the price that would materialize in the long-run if the previous period’s level of exports remained forever, and (ii) a short-run adjustment due to the current change in export levels, as given below
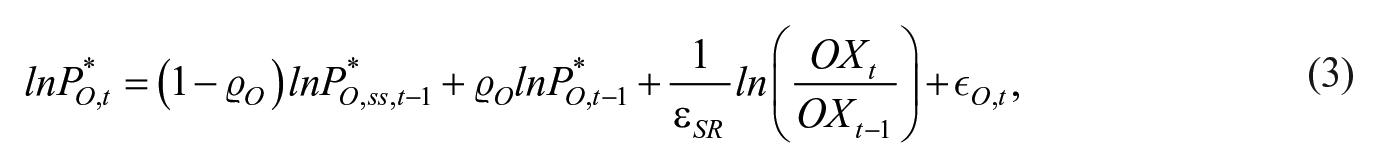
where
Finally, domestic oil production,

where
2.2. Households and Labor Market Rigidities
The model includes two representative households: a Saudi household and a non-Saudi household. This distinction is essential, as expatriates comprise around 30% of Saudi Arabia’s total population. 8 The Saudi Labor Force Survey (Mulligan 2023) shows a significant raw wage gap between Saudi and expatriates. On average, expatriates send USD 18 billion in remittances annually to their home countries. Note that many remitters are oil exporting producers, especially members of the Gulf Cooperation Council and Russia. This creates a link between remittances and oil price fluctuations (Snudden 2018). Saudi Arabia requires neither Saudi nor foreign workers to pay personal income taxes. However, Saudi workers and their employers must contribute to the social insurance system, which provides retirement old age and disability benefits for citizens. Foreigners who are not from Gulf Cooperation Council countries may not contribute to this system.
In our stochastic framework, Saudi households maximize the expected discounted value of their utility streams, while non-Saudi households are non-Ricardian households. Thus, in each period t, subject to the budget constraint, the Saudi household maximizes the following objective function
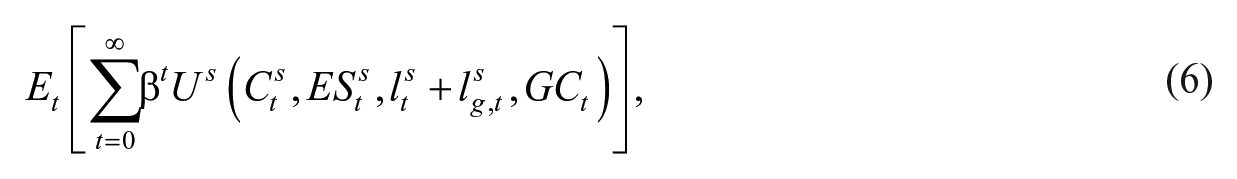
where
Saudi households’ budget constraint includes spending on the final consumption good, investment good, and energy services. It also includes the net acquisition of both government and foreign bonds. These households’ income includes after-tax labor income, capital income, government transfers, and returns from government and foreign bonds. Thus
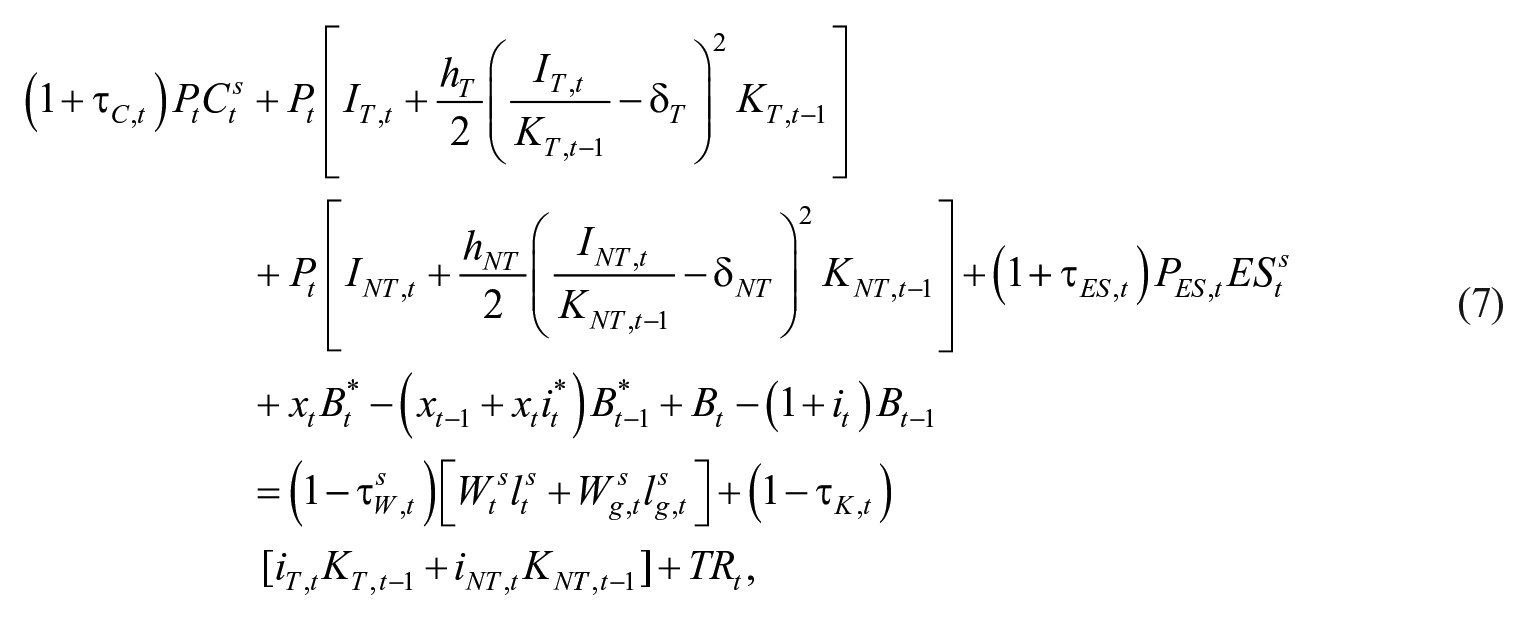
where
Non-Saudis play a significant role in the Saudi economy due to their substantial representation in both the population and the total labor supply. They come to the Kingdom and cannot stay without a job: hence their labor supply is assumed to be inelastic and their savings are transferred abroad in the form of remittances (Snudden 2019). 9
Given these considerations, we assume that the non-Saudi household consumes a final consumption good and energy services and supplies labor to the tradable and non-tradable goods sectors. The labor supply of non-Saudi workers is treated as exogenous, with their employment limited to the private sector. The budget constraint includes only the after-tax labor income received for the hours of work supplied to the tradable and non-tradable goods sectors. Thus, the non-Saudi household’s net income is
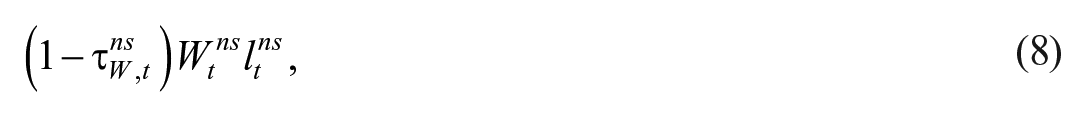
where this household is denoted by the superscript “ns.” We assume that the non-Saudi household spends a constant fraction
In addition to accounting for capital adjustment costs, the model incorporates labor market rigidities that align with the structure of the Saudi labor market. Employment fluctuations come from two sources: changes in the extensive margin – the number of workers - and changes in the intensive margin - hours per worker. In our model, the fluctuations in Saudi labor are generated by the labor/leisure decision made by Saudi households (intensive margin). As shown in the Saudi utility function (6) and in the budget constraint (7), we include an exogenous Saudi government labor variable
2.3. Public Investment in Economic Diversification
Economic diversification is one of the main drivers of Vision 2030’s policies, which aim to increase the share of non-oil GDP in total GDP. To this end, a significant portion of public investment is allocated to the construction and maintenance of physical and digital infrastructure, aimed at providing productive services to the private sector. 10 In addition, the Saudi government is also investing in infrastructure within megaprojects. 11 These initiatives aim to attract private investment and foster the growth of various sectors such as technology, energy, tourism, healthcare, and entertainment, among others. Institutions like the Public Investment Fund also invest in initiatives facilitating technology transfers to the Kingdom.
We capture the push toward economic diversification by including a specific stock of public capital serving as a catalyst for economic diversification. This public capital increases the productivity of both the tradable and non-tradable sectors in the model.
The productivity-enhancing effect of public capital stock and the growth potential of public investment as a fiscal policy instrument have been studied within dynamic general equilibrium models by Baxter and King (1993), Manzano (1998), Rioja (2001), and Berg et al. (2012).
In the model, the accumulation of public capital for diversification (

where
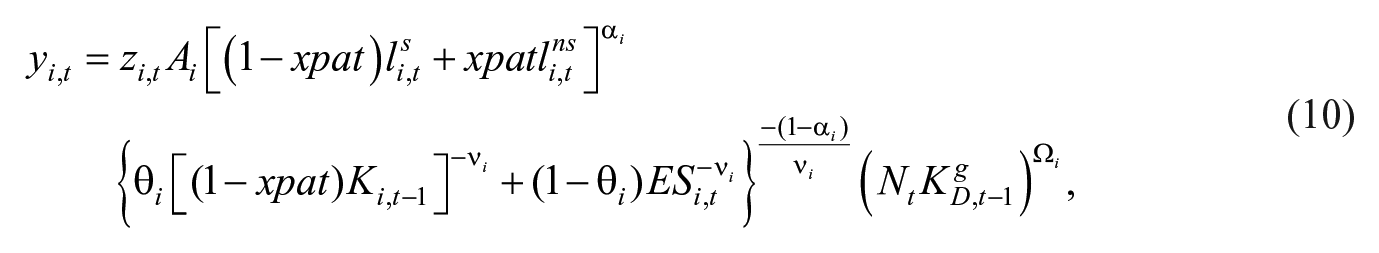
for i = T,NT, where
Public investment in diversification is included in the government budget constraint alongside public investments in oil production and renewable energy, labor compensation to public (Saudi) employees, government consumption and transfers to Saudi households. These expenditures are matched by revenues from taxes on the consumption of goods and energy services, proceeds from domestic sales and exports of oil, and net government bond issuances. 12
2.4. Electricity Generation
Fifty percent of Saudi Arabia’s power generation capacity will be based on renewable sources by 2030, with the remaining 50 percent using natural gas. The phasing out of oil implies changes in the production function of electricity, which, after the policy reform, has the following specification

where
3. Model Calibration and Validation
The model is calibrated on an annual basis to align with the available data frequency for Saudi Arabia. Thus, the time span of the simulations is a year. The parameters for the calibration of the model can be classified into three groups:
obtained from the literature,
independently calibrated,
jointly calibrated for the model to match long-run relationships observed in the Saudi economy during the period 1997 to 2016. 13
The parameter calibration by agent/sector of the model follows Blazquez et al. (2021) and is briefly summarized in Supplemental Appendix B. The steady state of the model before policy implementation matches the main long-run characteristics of the economy during the period 1997 to 2016.
However, there are a few changes related to the new features of the model. To account for labor market rigidities, we take the Saudi employment in the government sector to be 22 percent of total Saudi employment, matching the observed average share between 1999 and 2016. 14 In addition, the government wage has been calibrated to reflect the most recent data on the average wage differential between Saudi and non-Saudis, with the Saudi wage averaging 2.4 times higher than the wage of non-Saudis (in the steady state). 15
Additional parameters related to the model extension and policy reforms require calibration or estimation. Specifically, for the transition to natural gas and renewables in electricity, we set the gas efficiency parameter
The stochastic processes involving productivity shocks, oil price, and oil production have been jointly estimated. The data for oil price, oil exports and oil production consist of annual observations from 1996 to 2016 and are taken from the General Authority of Statistics (GaStat 2021). To obtain the productivity data for the estimation of (2) and (3), we compute the Solow residual of the production functions using data from GaStat and the calibrated parameters. The tradable goods sector includes manufacturing as well as agriculture, forestry and fishing, while the non-tradable goods sector includes the remaining non-energy sectors of the economy.
We substitute (4) into (3) and impute the calibrated values for long-run and short-run oil price elasticities,


The estimated parameters are presented in Table 1.
Estimated Coefficients of Stochastic Shock Processes.
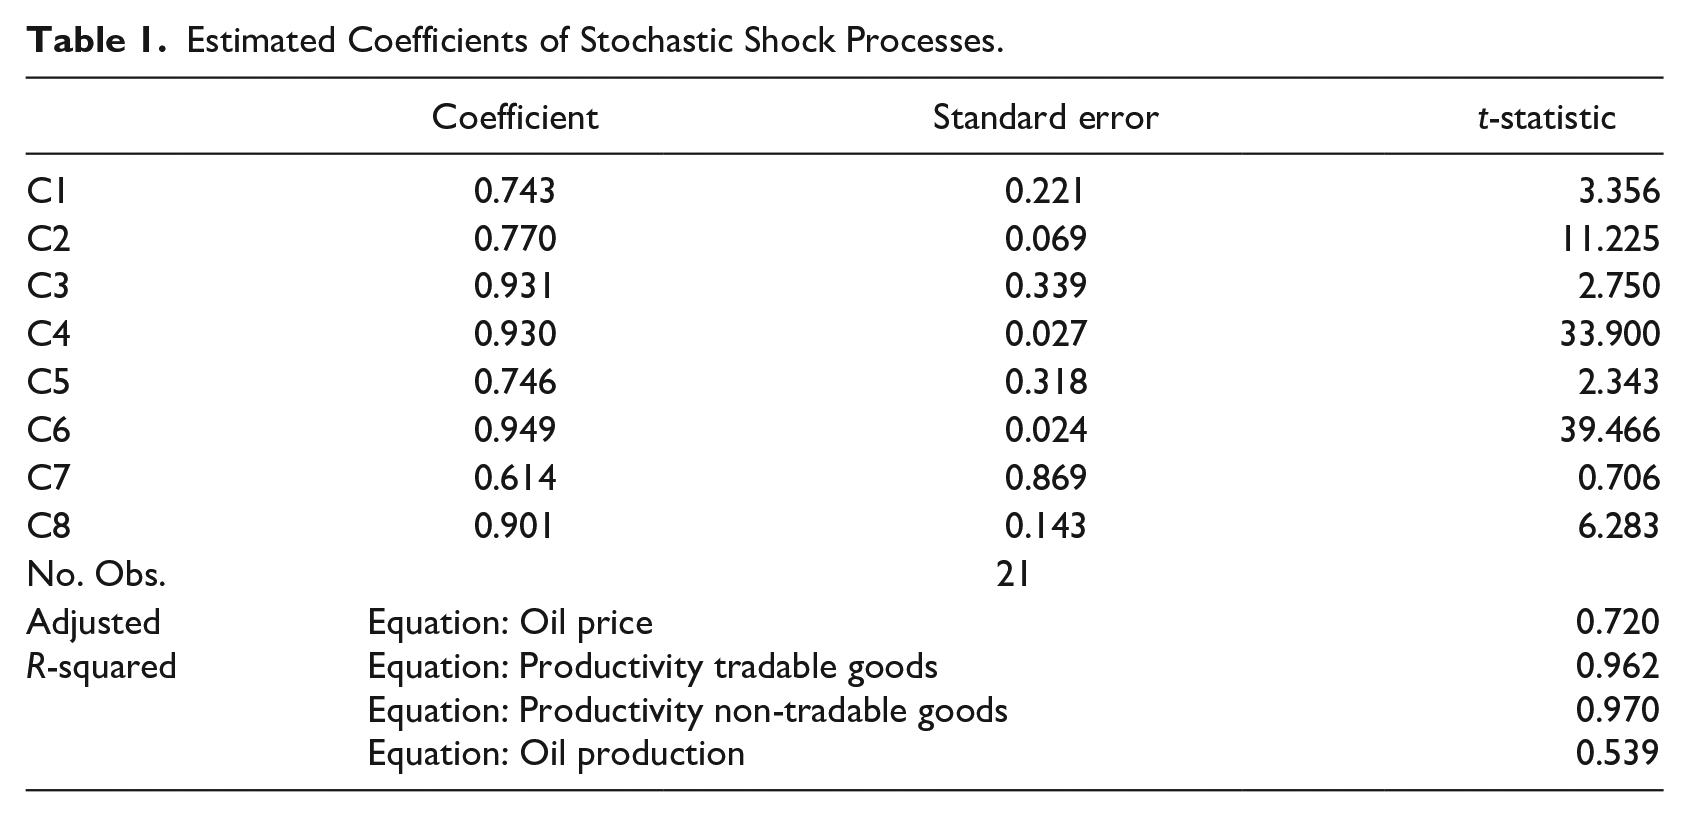
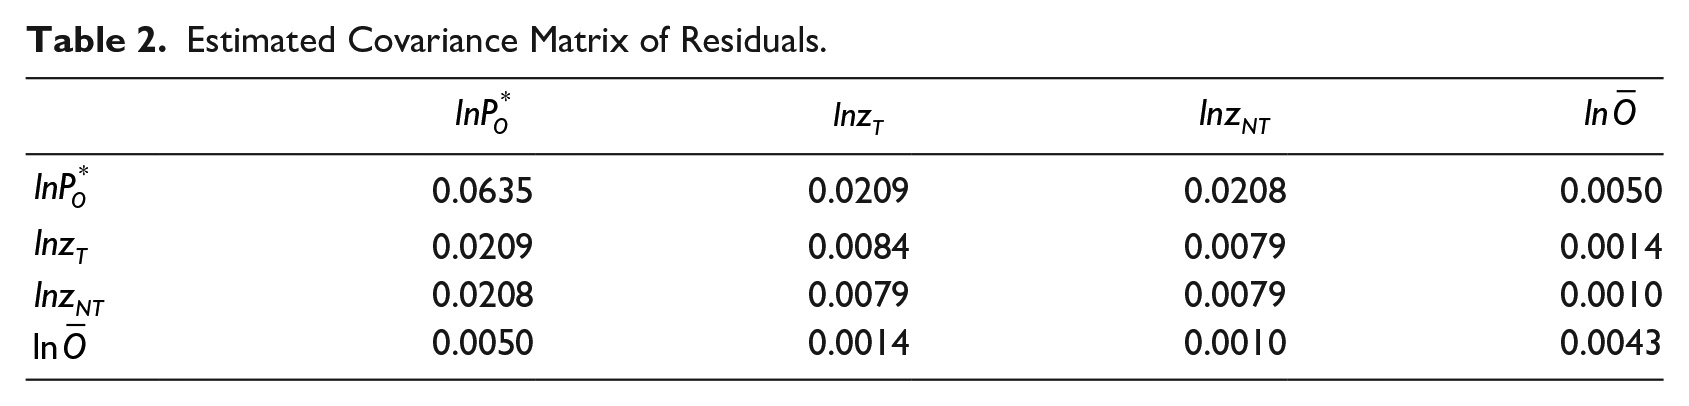
The estimated coefficients are generally statistically significant with acceptable goodness of fit. The autoregressive parameters show a very high degree of persistence. The estimated covariance matrix of the residuals of equations (12) to (15) is presented in Table 2.
Estimated Covariance Matrix of Residuals.
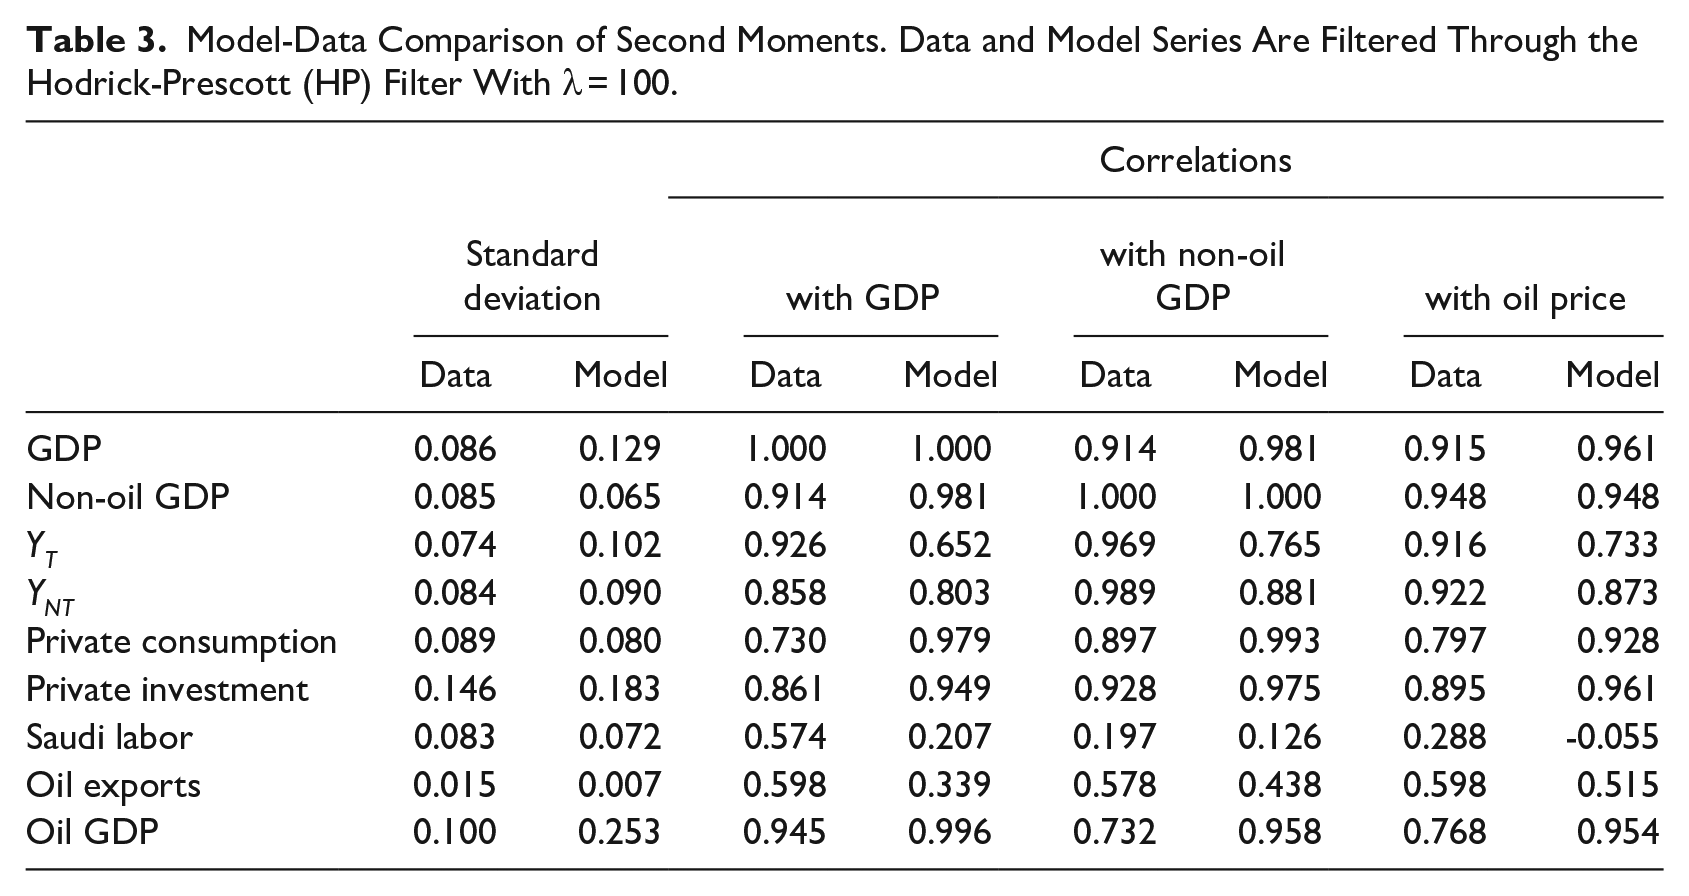
With this calibration, the steady state of the model can reproduce the most important average macroeconomic ratios of the Saudi economy, many of them chosen as calibration targets, as reported in Blazquez et al. (2021). However, since the model is now stochastic, we also need to assess its ability to reproduce the Saudi business cycle. We conduct a stochastic simulation (before policy implementation), feeding the model with the residuals of the stochastic processes for the period 2000 to 2016. Following standard practice in DSGE models, we compare the second moments of the data with those produced by simulating the model. Table 3 demonstrates that the model reasonably captures the characteristics of business cycle fluctuations in the Saudi economy.
Model-Data Comparison of Second Moments. Data and Model Series Are Filtered Through the Hodrick-Prescott (HP) Filter With λ = 100.
4. Policy Reforms, Aggregate Volatility, and Resilience to Shocks
We now analyze the extent to which the implementation of Vision 2030’s key economic policies impacts the resilience of the Saudi economy to shocks. These policies are:
Introduction of VAT: a 15 percent VAT applied to tradable goods, non-tradable goods and energy services consumed by households;
Energy price reform: alignment of the domestic prices of oil and gas,
Deployment of renewable energy: 50 percent of electricity from renewable sources, with the remaining 50 percent coming from natural gas;
Diversification policy: public investment in diversification so that non-oil GDP reaches a share of 70.4 percent of total GDP.
4.1. Impact of Economic Reforms on Aggregate Volatility
In this section, we first compare the fluctuations of the Saudi economy under three different scenarios: (i) before policy reforms have been implemented (Before V2030 scenario); (ii) after policy reforms, except diversification, have been implemented (Partial V2030 scenario) and (iii) after all policy reforms have been fully implemented (Full V2030 scenario).
We assess the impact of the reforms on the economy’s volatility by examining changes in the standard deviations of macroeconomic variables. This allows us to analyze the role of economic diversification in smoothing economic fluctuations. Note that the stochastic shocks affect government revenues through their impact on tax receipts and on oil and gas revenues arising from domestic consumption and exports. Therefore, the spending side of the government budget needs to be adjusted accordingly to keep the budget balanced. Thus, when simulating the model, we consider two scenarios, depending on the channel through which the government budget adjustment takes place: either via direct transfers to Saudi households or via government consumption.
Table 4 shows the standard deviations of relevant macroeconomic variables as a measure of their volatilities in the before V2030 scenario, along with the percentage change in these standard deviations for the partial V2030 and full V2030 scenarios. We compute two different simulations depending on the fiscal variable which adjusts to fulfill the government budget constraint: transfers to households or government consumption.
Transfers Adjustment. Standard Deviations of Simulated Variables.
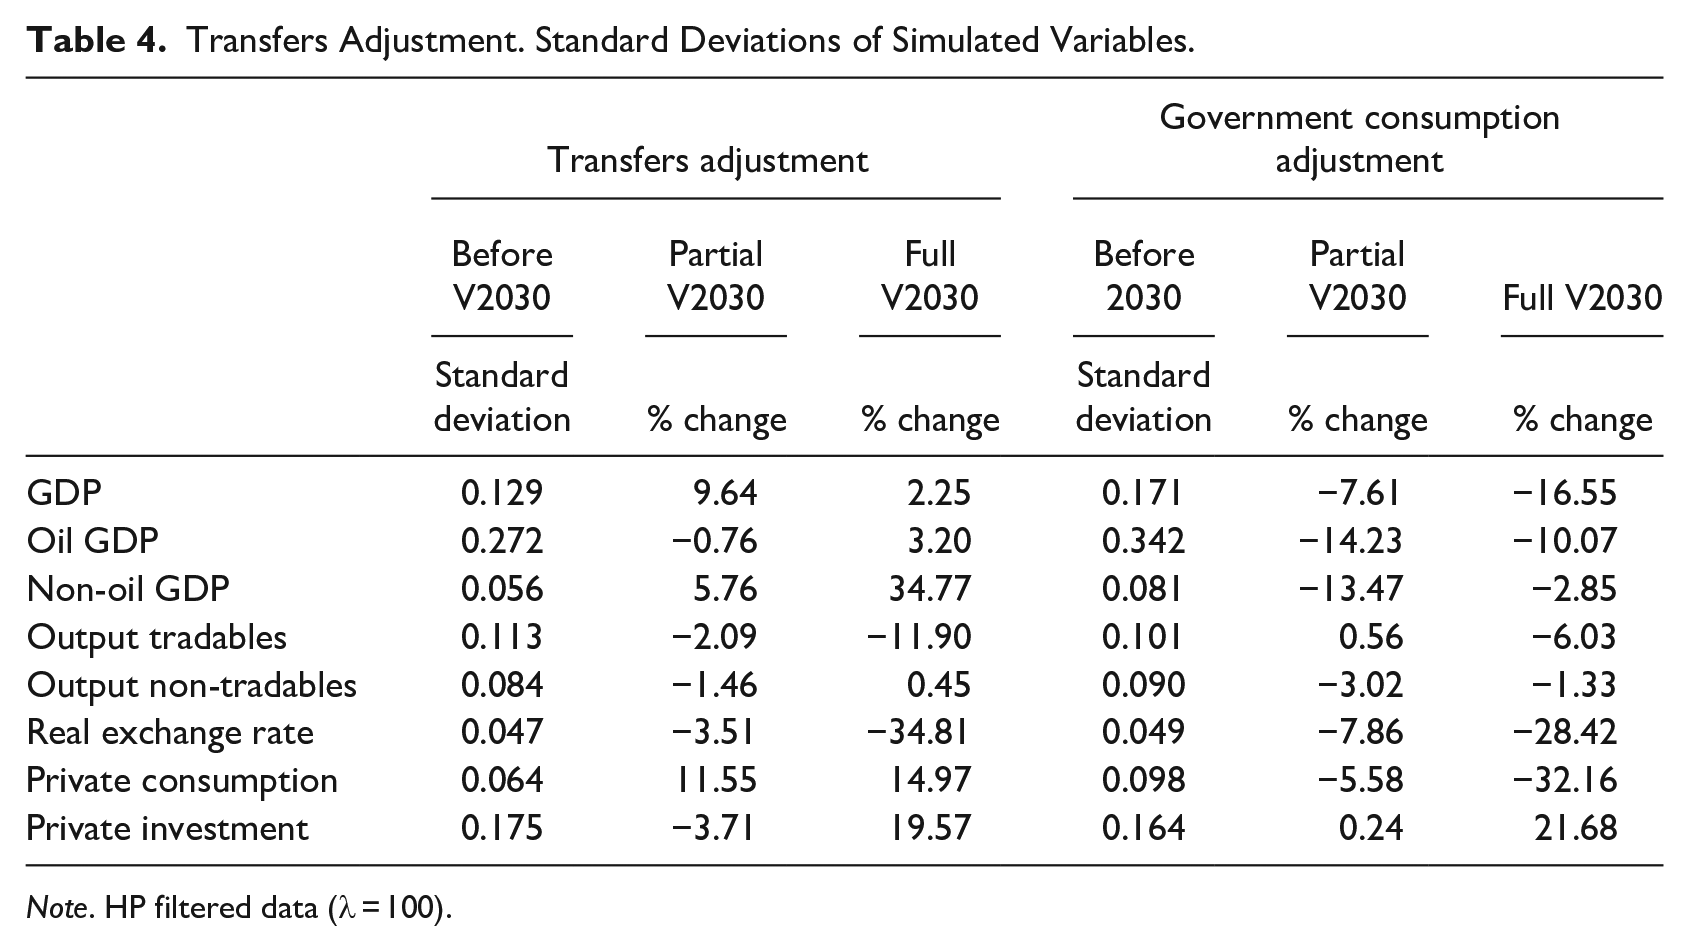
Note. HP filtered data (λ = 100).
The main insight from Table 4 is that economic diversification is paramount for enhancing the stability of the Saudi economy. The volatility of GDP is lower when Vision 2030 policies are fully implemented compared to their partial implementation. In the case of transfers adjustments, the volatility of GDP increases in both scenarios, but much more with the partial implementation of Vision 2030 policies. Under government consumption adjustment, the volatility of GDP decreases, with a more significant reduction observed in the full implementation scenario of Vision 2030 policies compared to the partial implementation case.
These results reflect the net effect of two opposite forces affecting the transmission of shocks to the economy. The energy price reform and renewable deployment lead to reduced domestic oil consumption and increased the fiscal revenues from oil exports. The volatility of fiscal revenues increases which results in more volatile fiscal spending that has a different transmission channel depending on the fiscal variable affected: transfers to households or government consumption. The introduction of value-added taxation helps diversify government revenues by reducing the weight of oil revenues, but it is not a substitute for economic diversification. However, when economic diversification takes place, the relative size of oil in total GDP is smaller, reducing the volatility of GDP. Figures in Table 4 show the net effect of these two opposite forces.
The crucial role of economic diversification is also reflected in the volatility of the output of the tradable sector and the real exchange rate, two key variables that capture the competitiveness of the Saudi economy. In both cases, the volatility is reduced after the implementation of the diversification policy.
The effect of reforms on the standard deviation of non-oil GDP and private consumption depends very much on the channel used by the government to adjust its spending. With transfers, both variables tend to fluctuate even more, whereas with government consumption, their standard deviation is reduced.
4.2. Shocks that Matter the Most
We now assess the relative importance of each type of shock and the extent to which each one changes with the implementation of Vision 2030 policies. To this end, we decompose the variance of the model’s endogenous variables into percentages attributable to each exogenous stochastic shock. 18 Tables 5 and 6 show the asymptotic variance decomposition in the three scenarios, considering two different channels for adjusting the government budget: transfers to households and government consumption, respectively.
Variance Decomposition: Fiscal Adjustment Via Household Transfers.
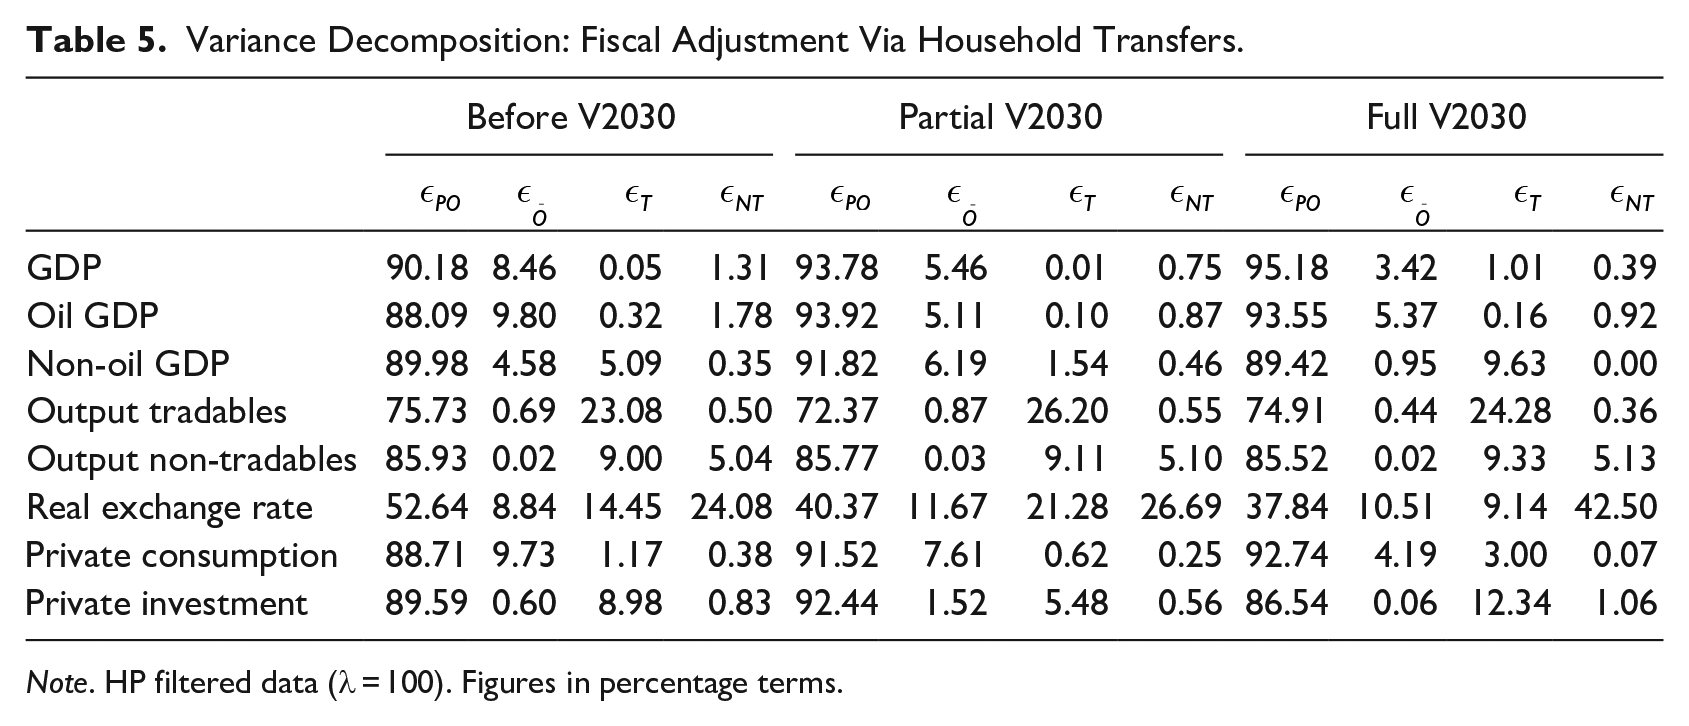
Note. HP filtered data (λ = 100). Figures in percentage terms.
Variance Decomposition: Fiscal Adjustment Via Government Consumption.
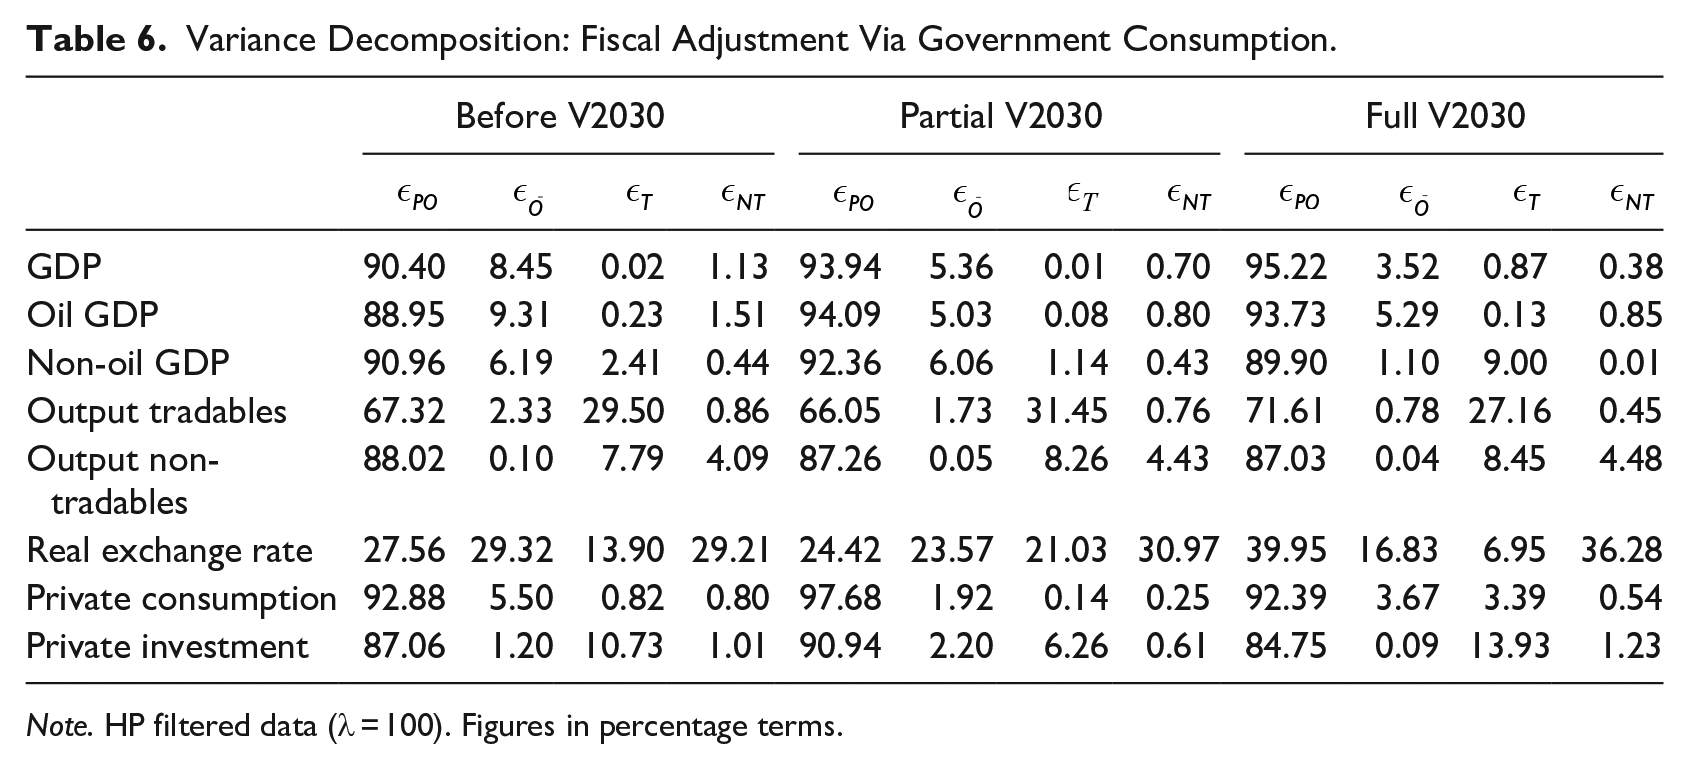
Note. HP filtered data (λ = 100). Figures in percentage terms.
The tables indicate that oil price shocks remain the main driver of macroeconomic fluctuations in the Saudi economy, impacting variables such as GDP, oil GDP, non-oil GDP, tradable and non-tradable production, private consumption, and private investment. This holds true regardless of the variable—transfers or government consumption—used to balance the government budget and whether or not Vision 2030 policy reforms are implemented. Oil production shocks are the second main factor behind the Saudi economy’s macroeconomic fluctuations, while productivity shocks have a lesser impact.
Note that after fully implementing Vision 2030 oil shocks explain a slightly larger portion of the variance of GDP than under the partial implementation of Vision 2030. That however does not undermine our conclusion that diversification policy is key to stabilize the economy, since the variance of GDP after the full implementation of Vision 2030 is smaller than the GDP variance after the partial implementation of Vision 2030. For example, Table 5 shows for GDP that the share of oil price shock in total variance goes up from 93.78 to 95.18 once diversification policy has been added: an increase of 1.4 percent. Table 4 showed that the variance of GDP decreases by 7.39 percent after adding diversification to the policy package. This implies that oil price shocks contribute to the variance of GDP by almost 6 percent less after adding diversification to the Vision 2030 policies.
4.3. Resilience to Oil Shocks After Policy Reforms
When computing volatility, we take into account all the shocks considered in the model. However, as discussed in the previous section, not all shocks play an equal role in explaining the fluctuations of the macroeconomic variables. As expected for the world’s largest oil exporter, oil price shocks, and to a much lesser extent, oil production shocks, are the main source of macroeconomic fluctuations. We therefore focus here on the response of the economic variables to oil (price and production) shocks. 19
Figures 2 to 5 compare the response of the main macroeconomic variables to a 1% positive shock to the oil price or oil production under the Before V2030, Partial V2030 and Full V2030 scenarios. 20 We present the outcome for the two channels of public budget adjustment: transfers to households and government consumption.
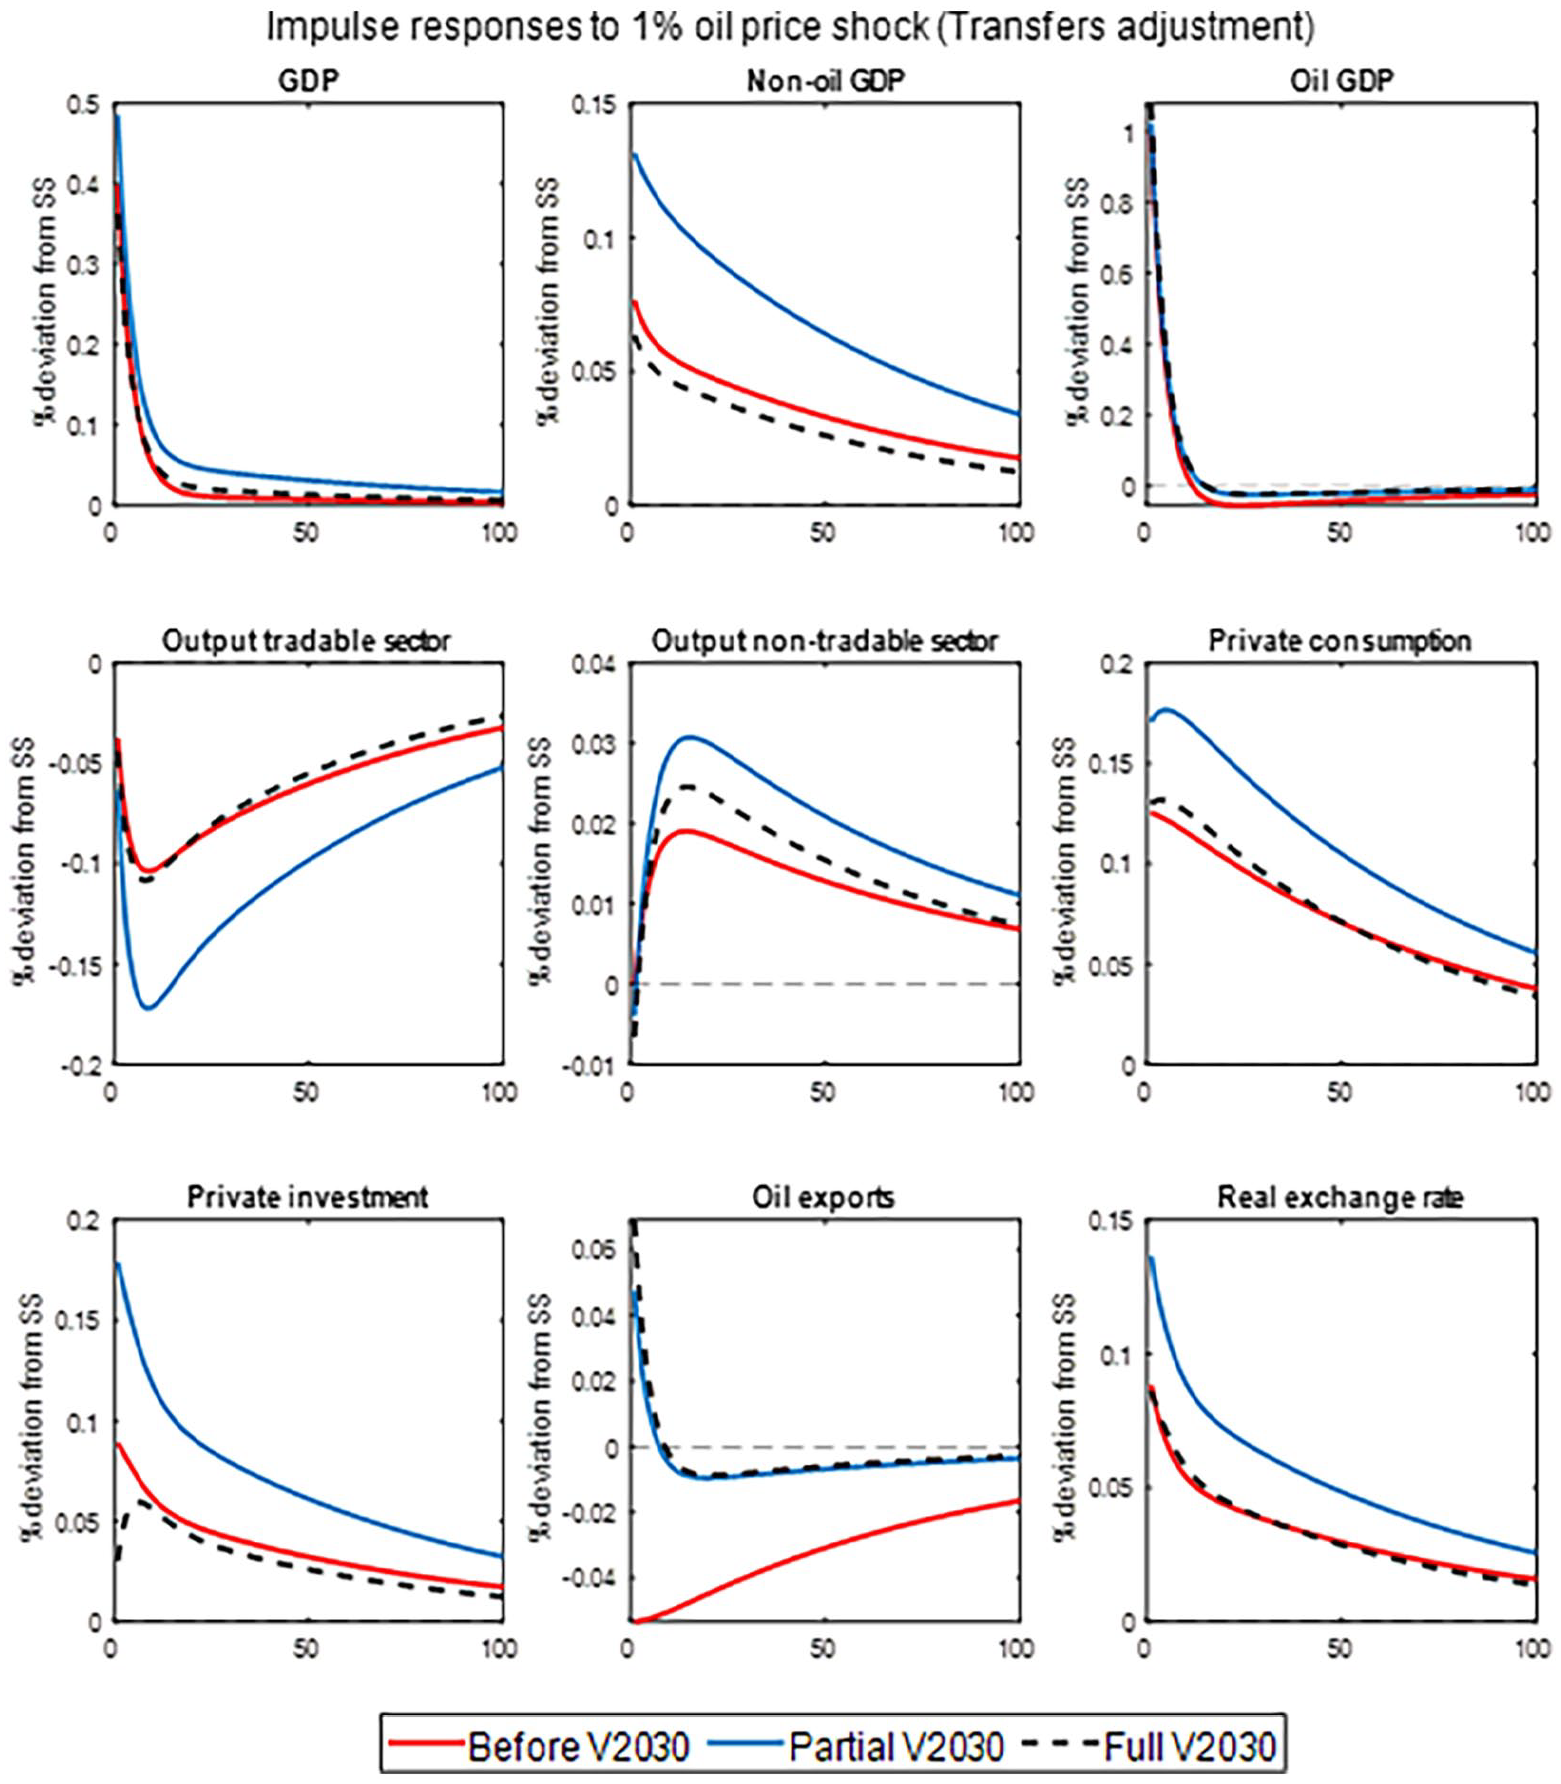
Impulse responses to oil price shocks: Fiscal adjustment via transfers (in percentage deviations from the steady state).
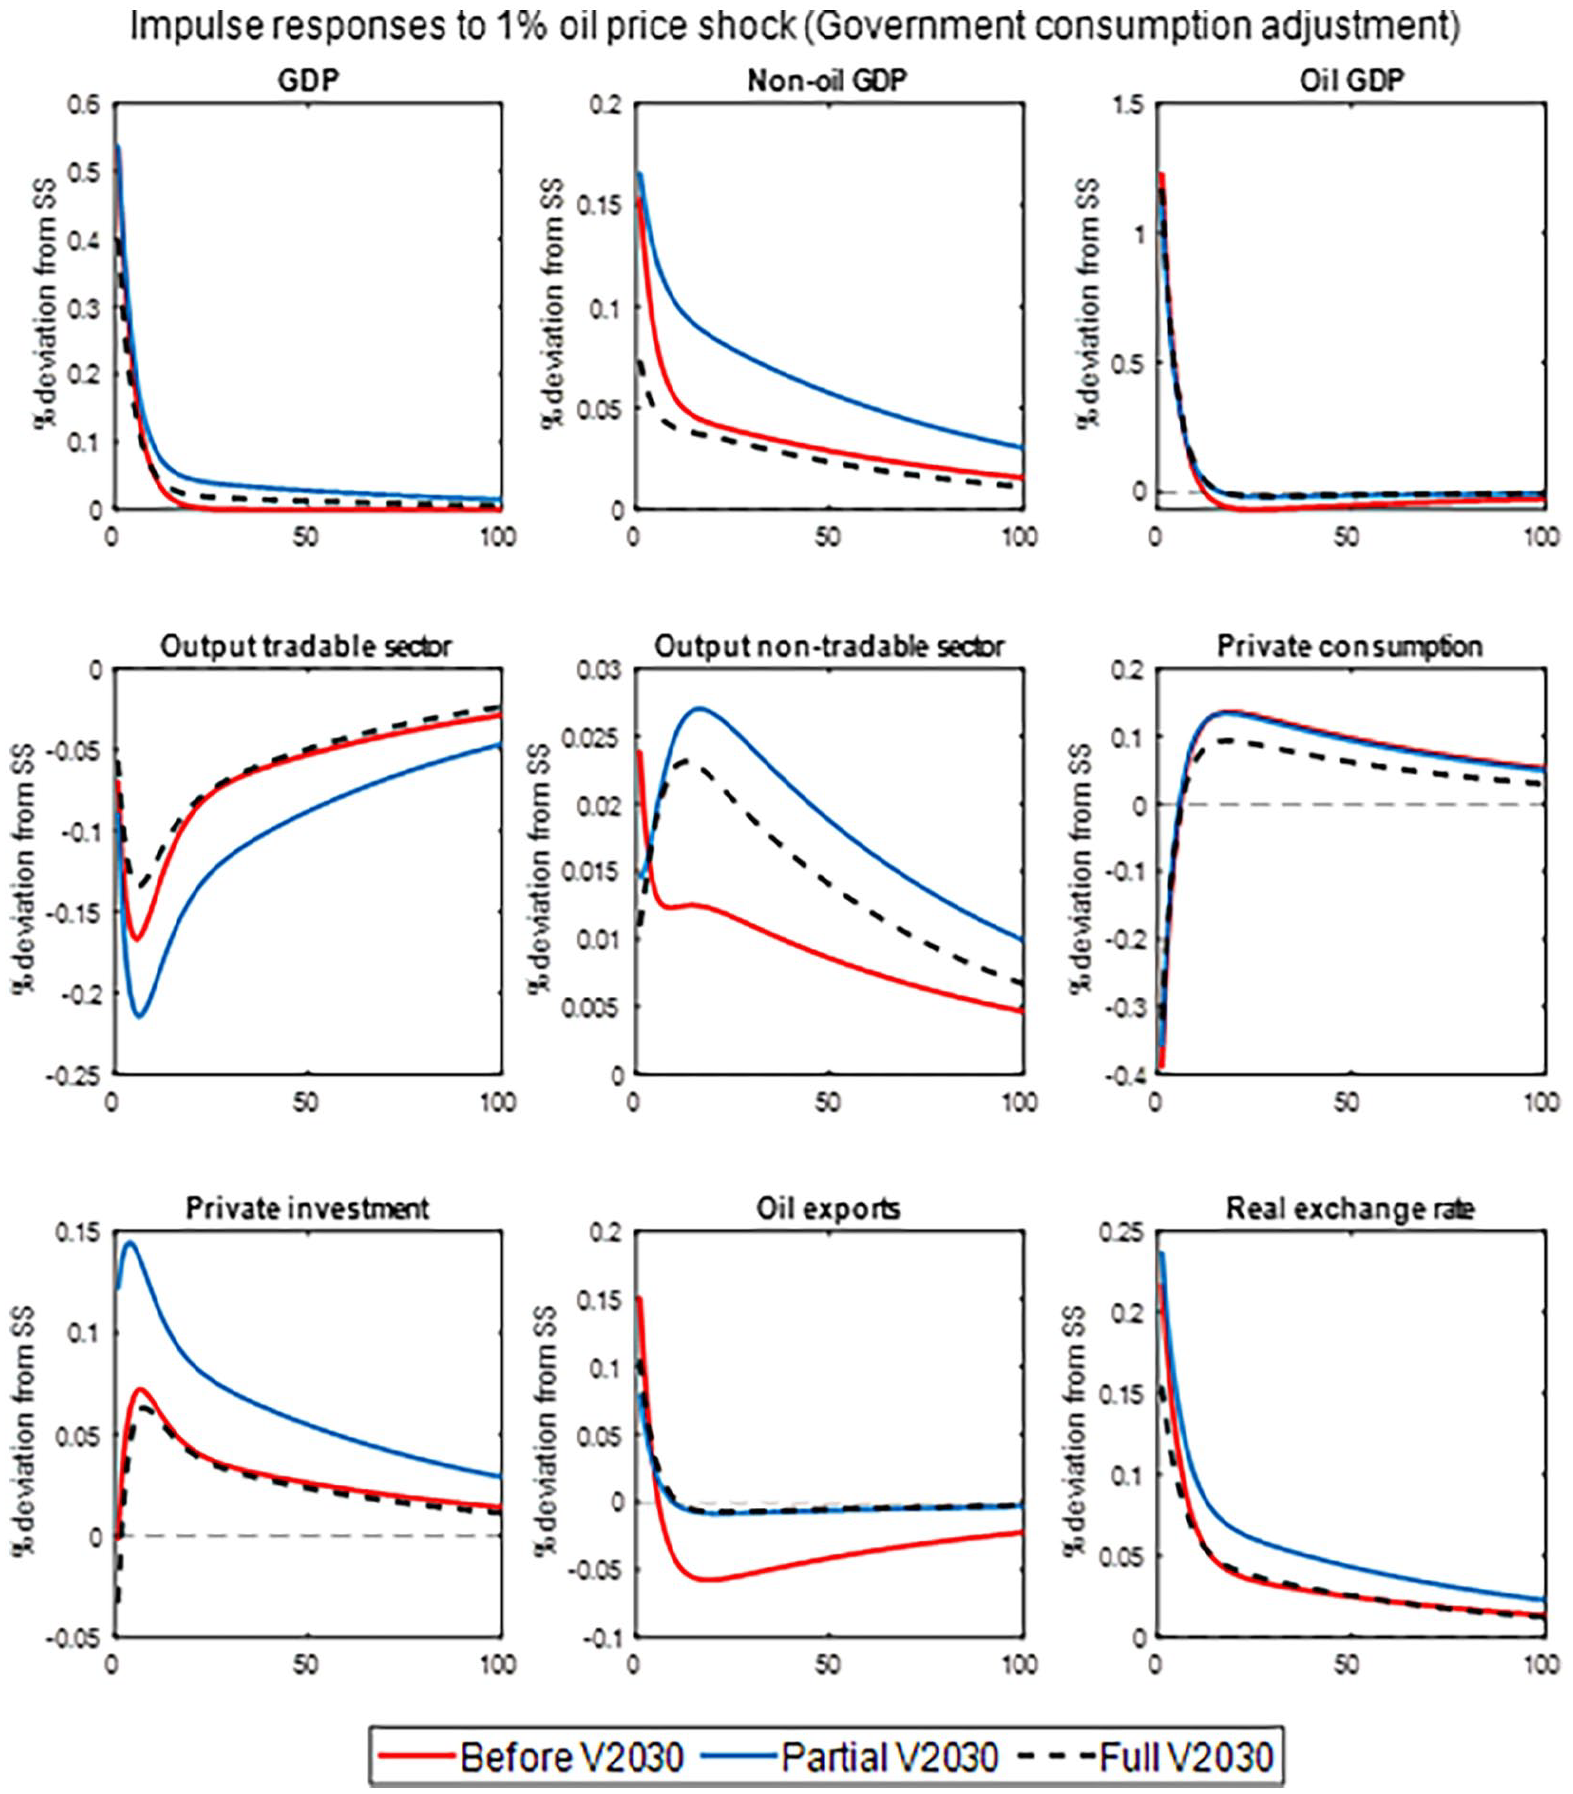
Impulse responses to oil price shocks: Fiscal adjustment via government consumption (in percentage deviations from the steady state).
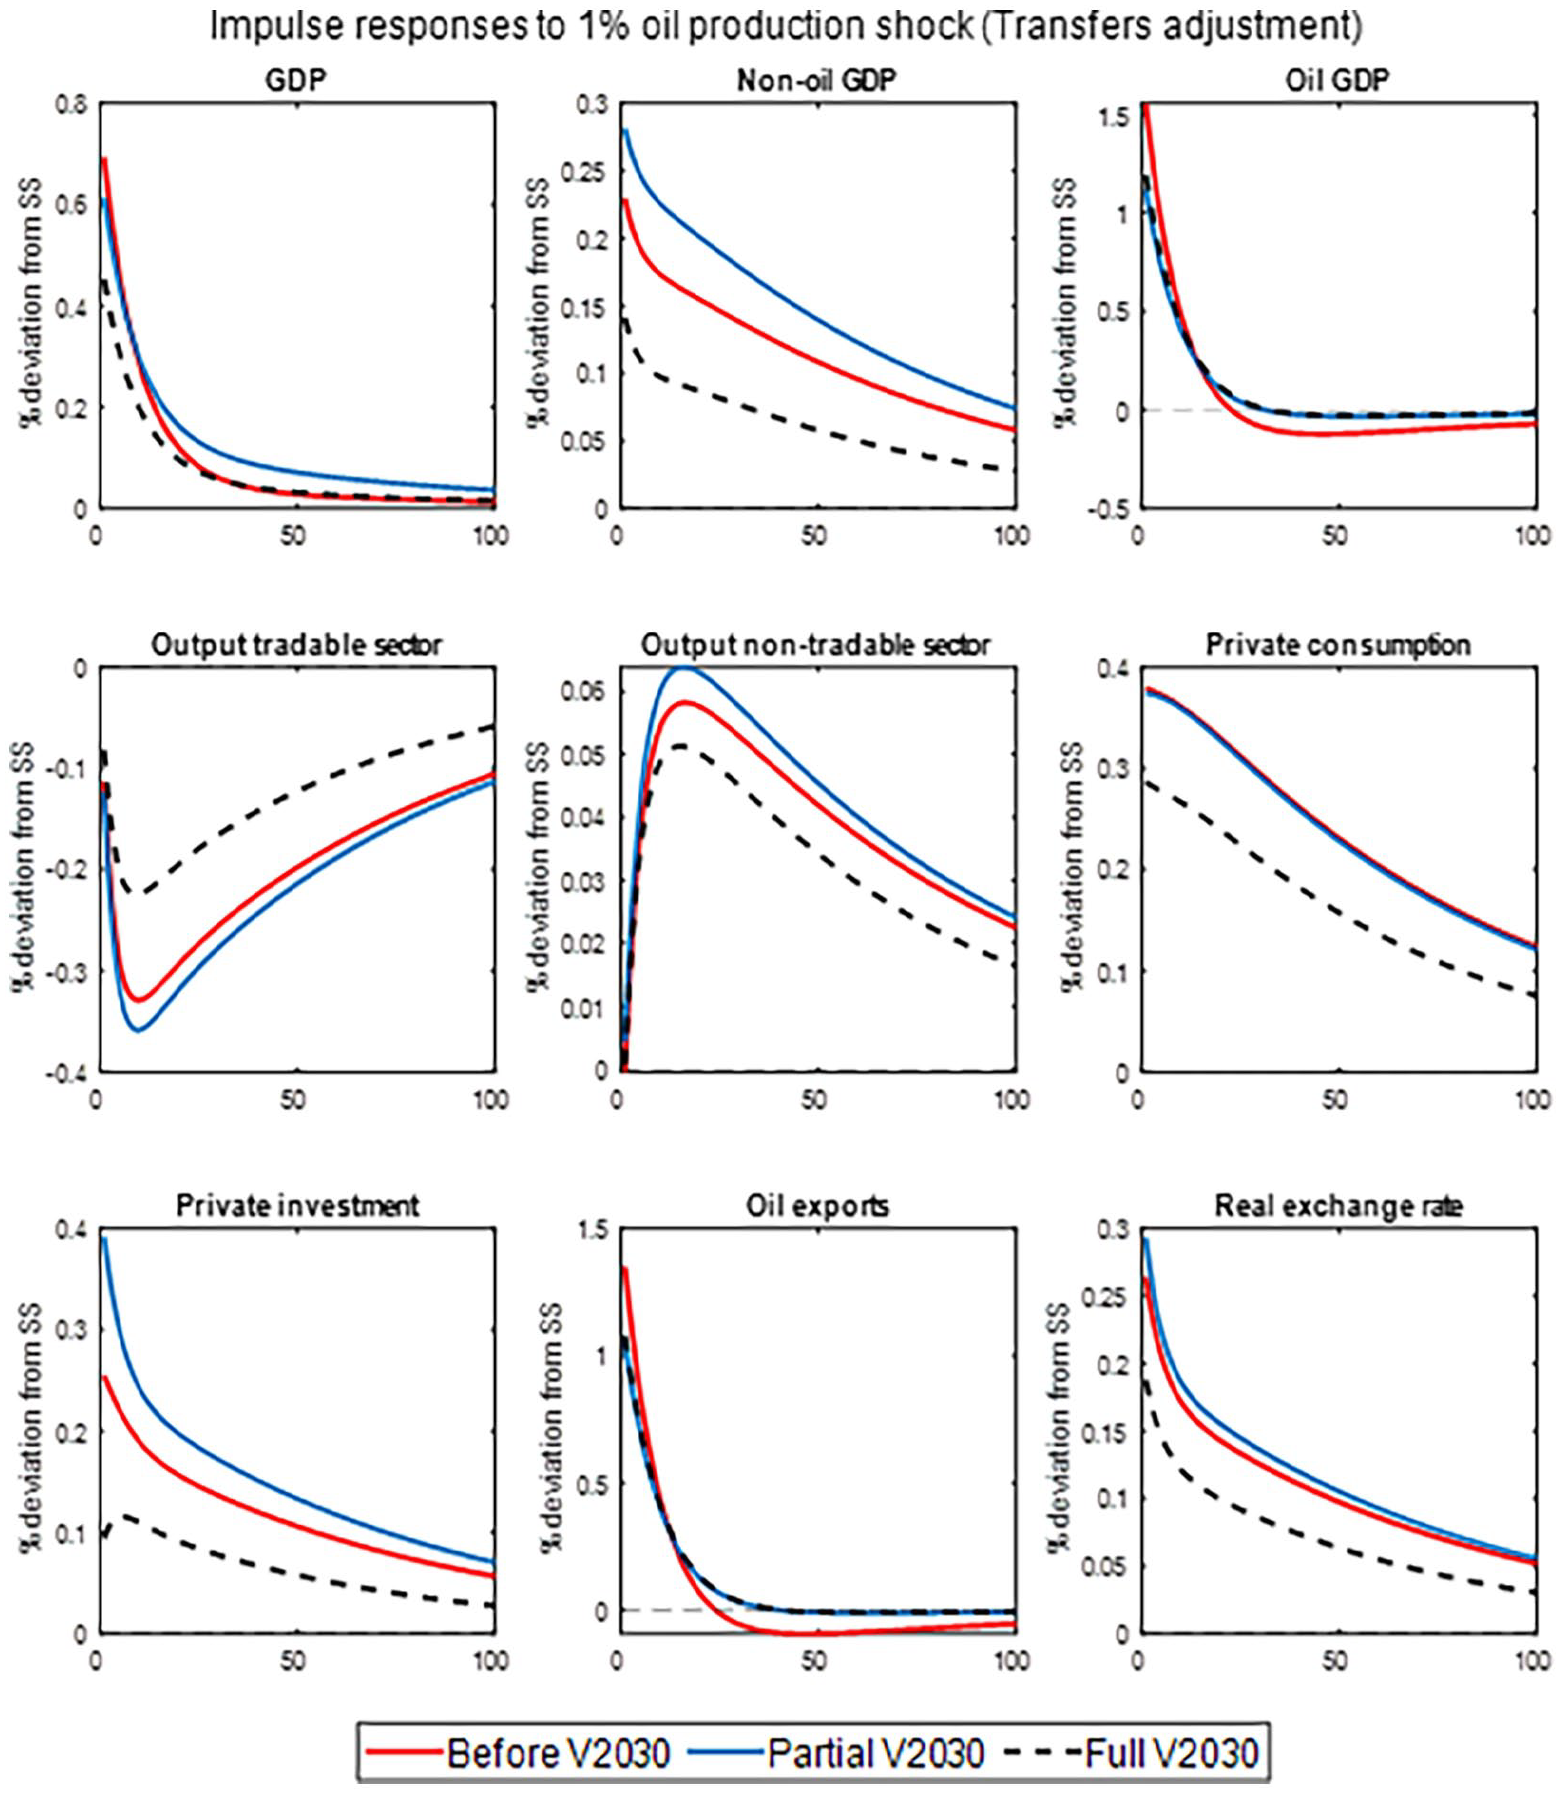
Impulse responses to oil production shocks: Fiscal adjustment via transfers (in percentage deviations from the steady state).
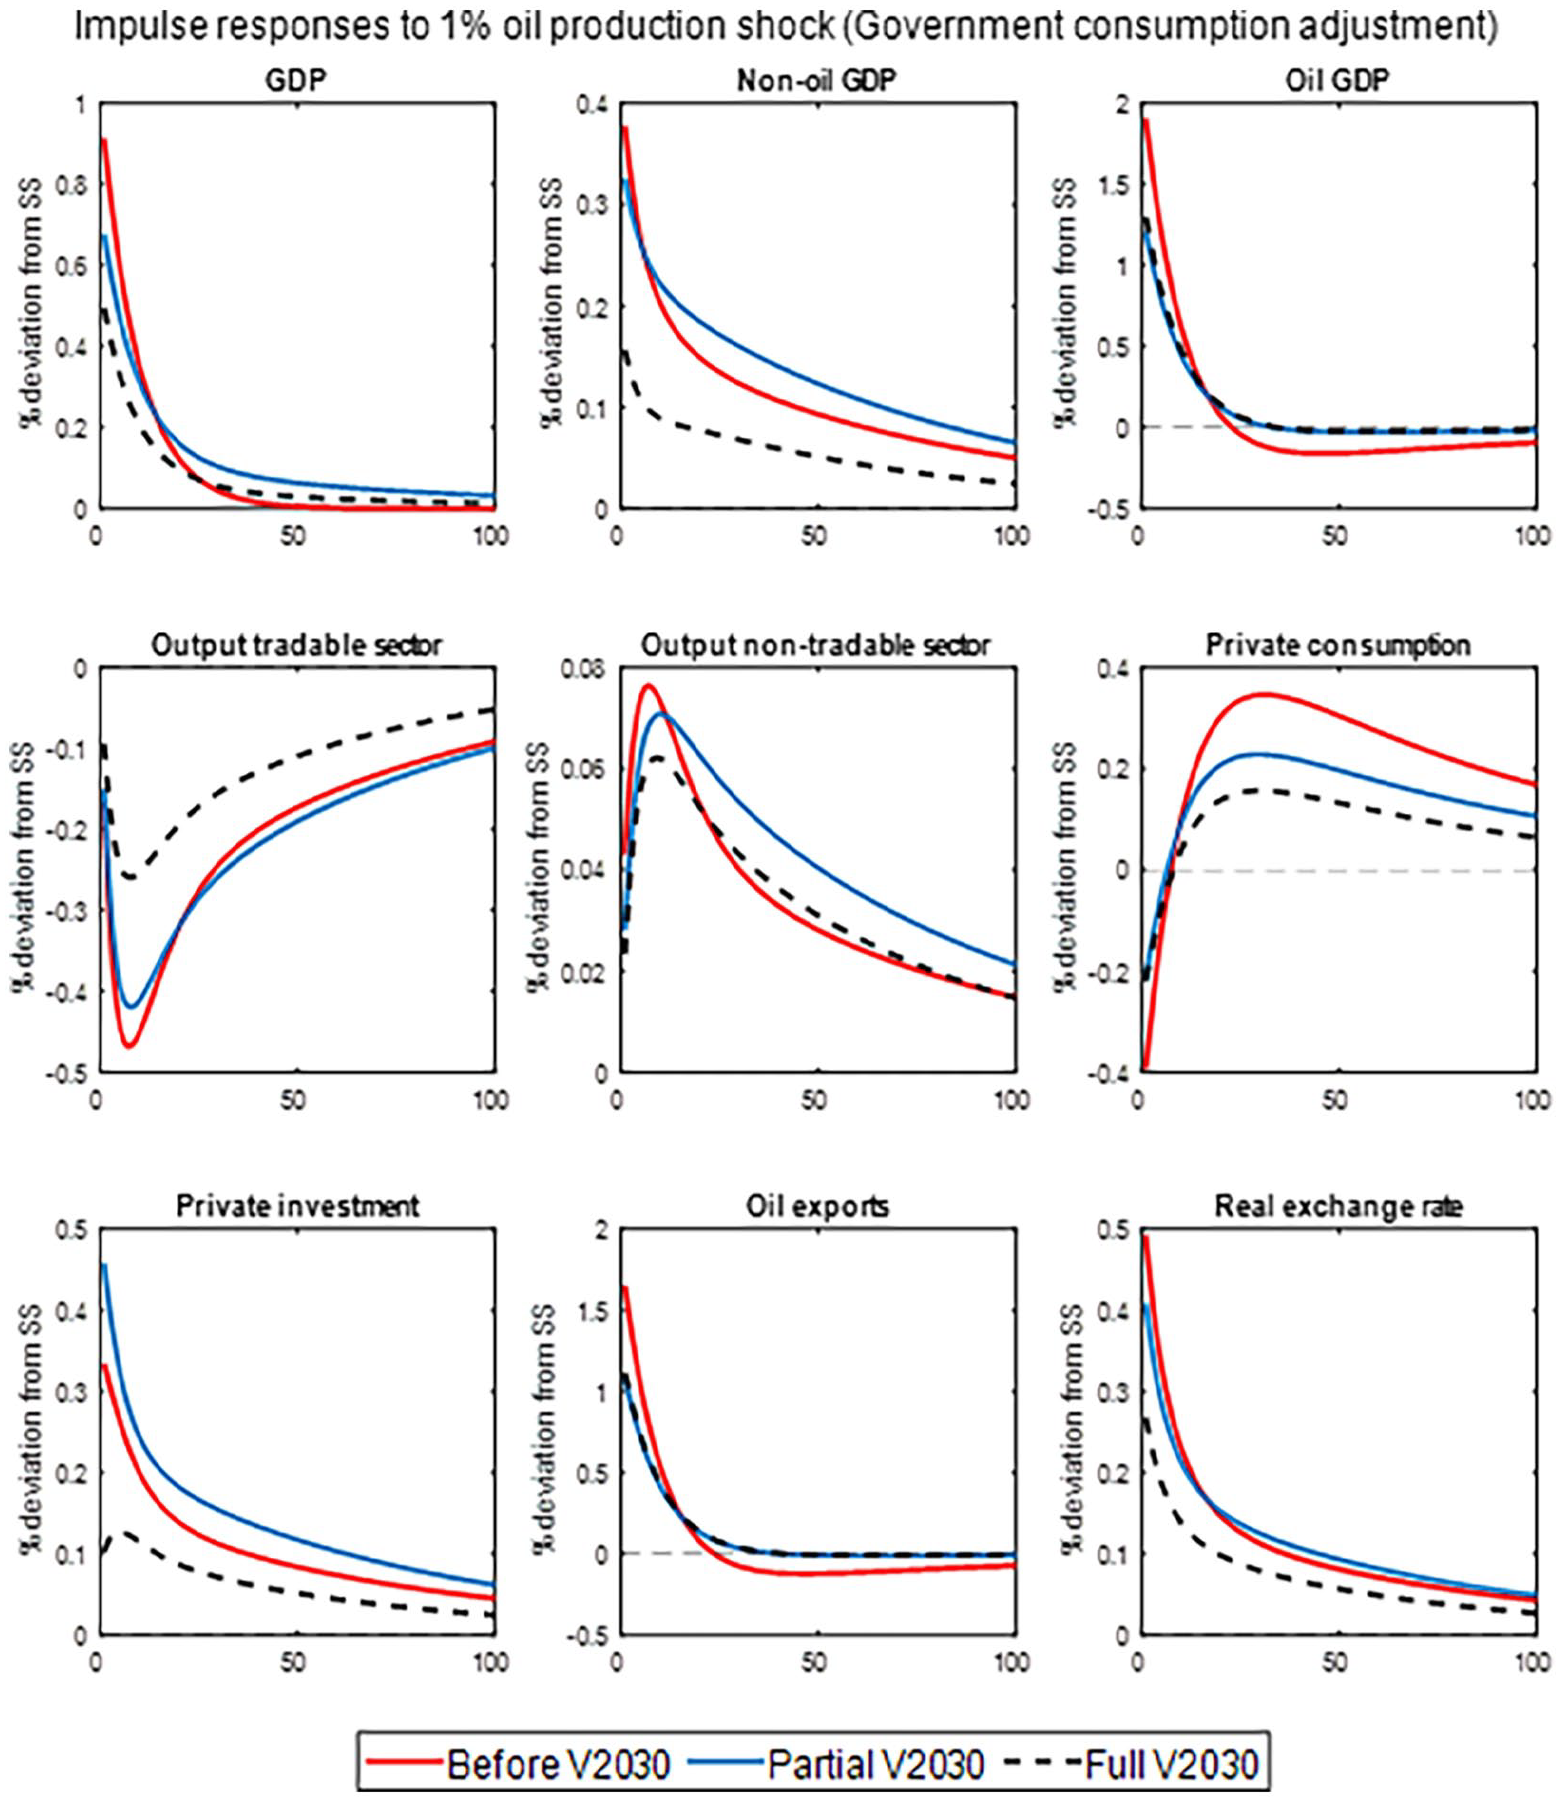
Impulse responses to oil production shocks: Fiscal adjustment via government consumption (in percentage deviations from the steady state).
For the two shocks and two budget adjustment mechanisms, the blue line corresponding to the Partial V2030 scenario is always above (below) the red line of the Before V2030 scenario when the shock induces a positive (negative) change. This is consistent with the results of Section 4.1. The results indicate that after the implementation of the policy reforms without economic diversification, Saudi Arabia’s macroeconomic environment tends to be more volatile as it has a larger response to oil shocks. However, this situation is reversed when the economic diversification policy is also implemented; the Saudi economy becomes more stable. The dashed black line corresponding to the Full V2030 scenario tends to be below (above) the Before V2030 blue line when the shock induces a positive (negative) change for the two shocks and the two possible budget adjustment mechanisms.
There is no qualitative difference between the effects of oil price and oil production shocks from this standpoint. This is because these shocks are somewhat similar and both have essentially the same effect on fiscal revenues from oil.
Another perspective is to consider the differences in responses to the shocks depending on whether the fiscal adjustment is conducted through transfers or government consumption. In this case, the response is very similar, with only some differences in the response of private consumption, which is affected by the relationship between government and private consumption in the utility function. Therefore, oil shocks continue to be the main driver of fluctuations for the Saudi economy. The economy, however, will be more resilient to oil shocks when the policy package includes the implementation of the economic diversification policy.
4.4. A Resilience Index to Oil Shocks
As discussed throughout the paper, our general goal is to analyze whether the resilience to shocks has increased or decreased after the policy reforms. We consider that the less a macroeconomic variable is impacted by a shock, the greater the variable’s resilience to the shock. We therefore propose a resilience index to shocks at different time horizons that captures the numerical information contained in the impulse response functions. For a given variable and given shock, the impulse response function indicates the change in the variable’s value caused by the shock, and its path back to its steady state value. The resilience index of a variable X at horizon H is given by:
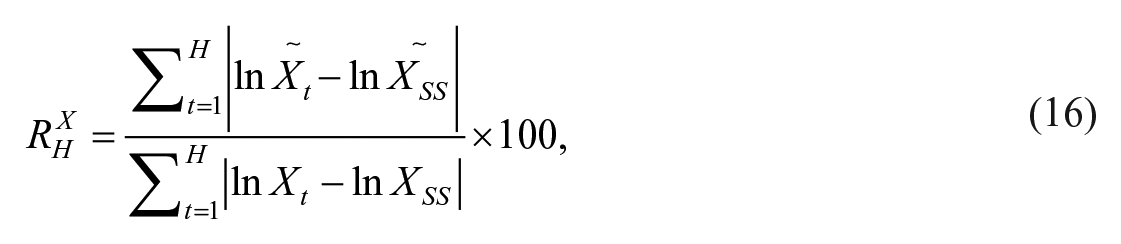
where
A value of the index greater (lower) than 100 means that the resilience to shocks has increased (decreased) with economic reforms. A value of, for example, 105 means that the resilience to shocks has increased by 5 percent, as the cumulative impact of a shock has been reduced by 5 percent after the policy implementation.
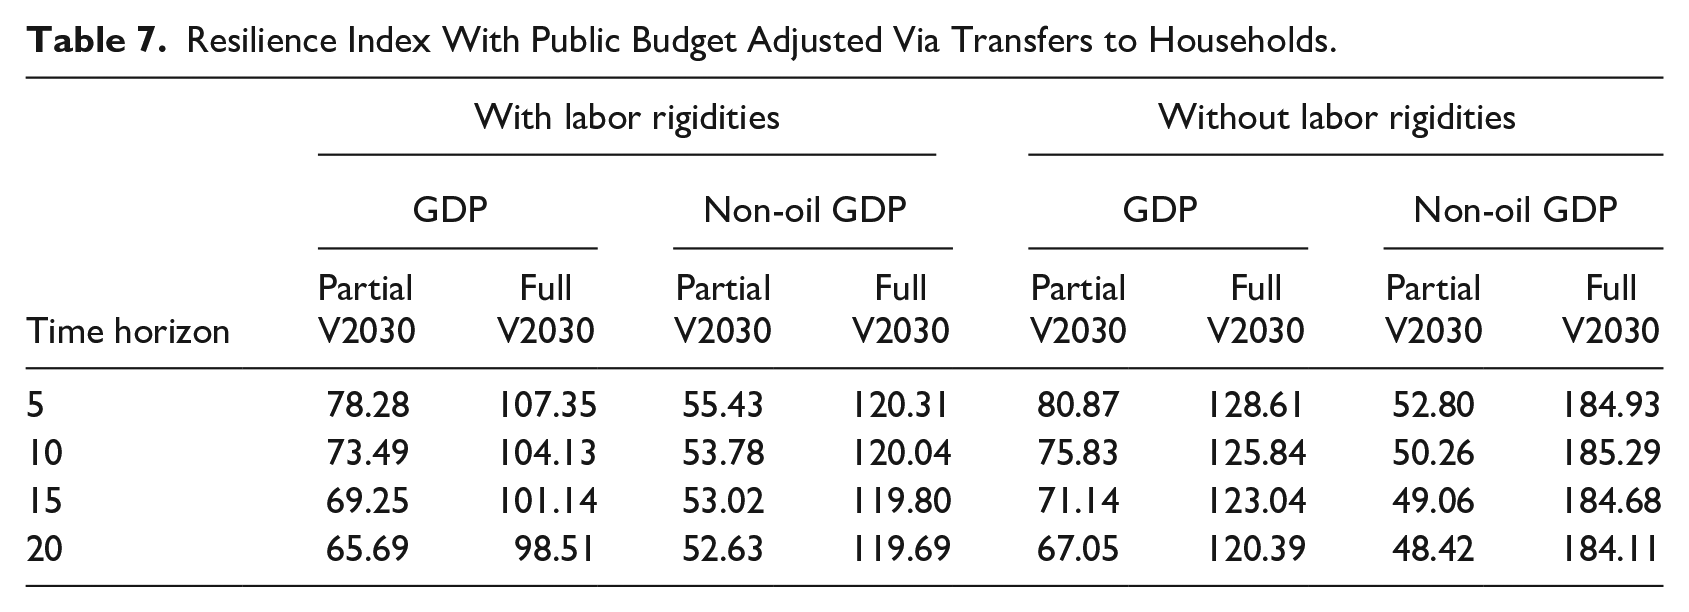
We examine scenarios considering both labor market rigidities and, in Supplemental Appendix F, provide additional insights by presenting results without such rigidities. Saudi Arabia has made significant steps in implementing labor market reform initiatives to tackle the existing rigidities. In Tables 7 and 8, we show the resilience index for GDP and non-oil GDP under the two channels for public budget adjustment. 21 Following the results of Section 4.2, we focus on the response to oil price shocks, as these are by far the largest source of fluctuations.
Resilience Index With Public Budget Adjusted Via Transfers to Households.
Resilience Index With Public Budget Adjusted Via Government Consumption.
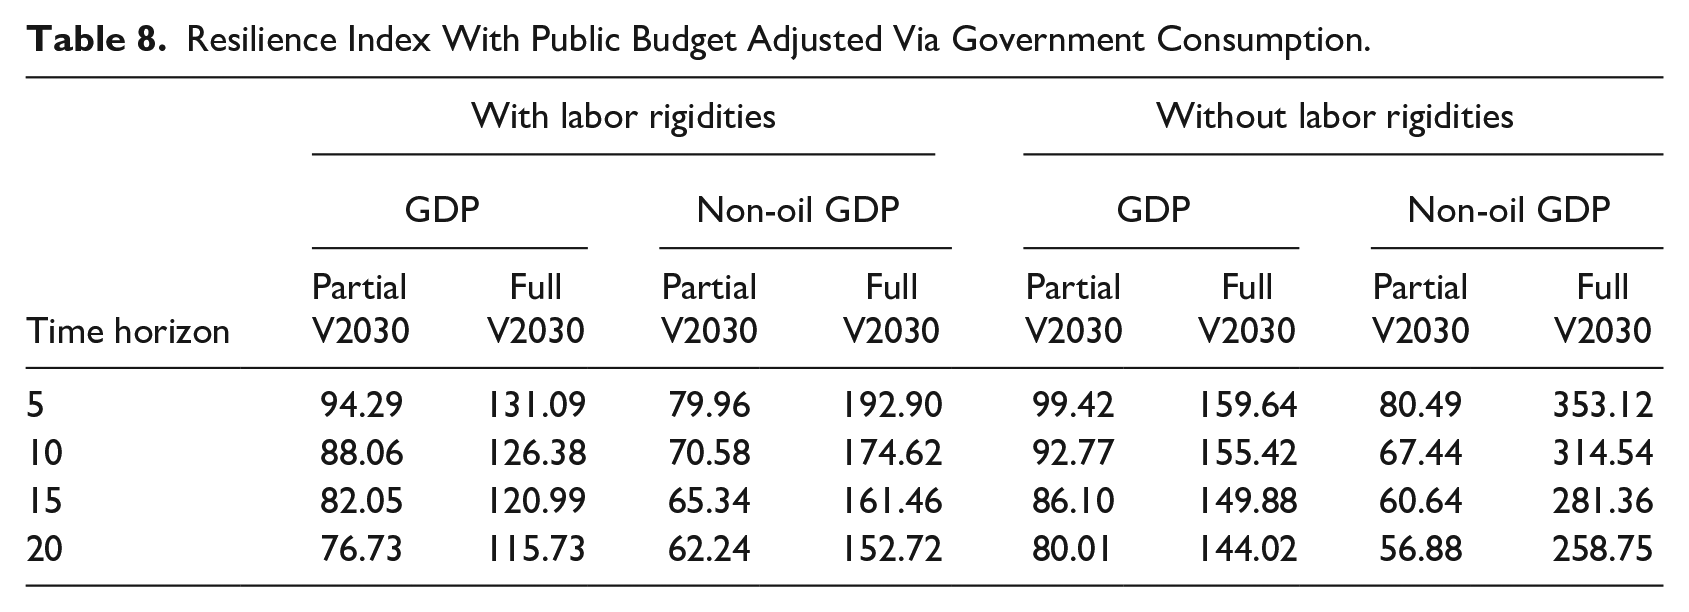
The full implementation of Vision 2030 policies significantly enhances the resilience of the Saudi economy to oil shocks. When only partially implemented (without economic diversification), the resilience index of GDP to oil price shocks falls below 100, indicating a lower level of resilience. However, including economic diversification policies leads to a resilience index exceeding 100, showcasing a remarkable improvement in GDP’s ability to withstand oil price shocks. The extent of this increase in resilience varies depending on several factors such as the time horizon, labor rigidities, and fiscal channel. Without labor rigidities, the resilience index increases by 20 to 60 percent, whereas with labor rigidities, the increase ranges from minimal to 30 percent. A similar conclusion is reached when applying the resilience index to non-oil GDP, with an increase in the resilience to oil price shocks that ranges between 20 and 253 percent. These findings quantitively demonstrate the critical role of a successful economic diversification policy in mitigating the negative effects of oil price shocks on the Saudi economy.
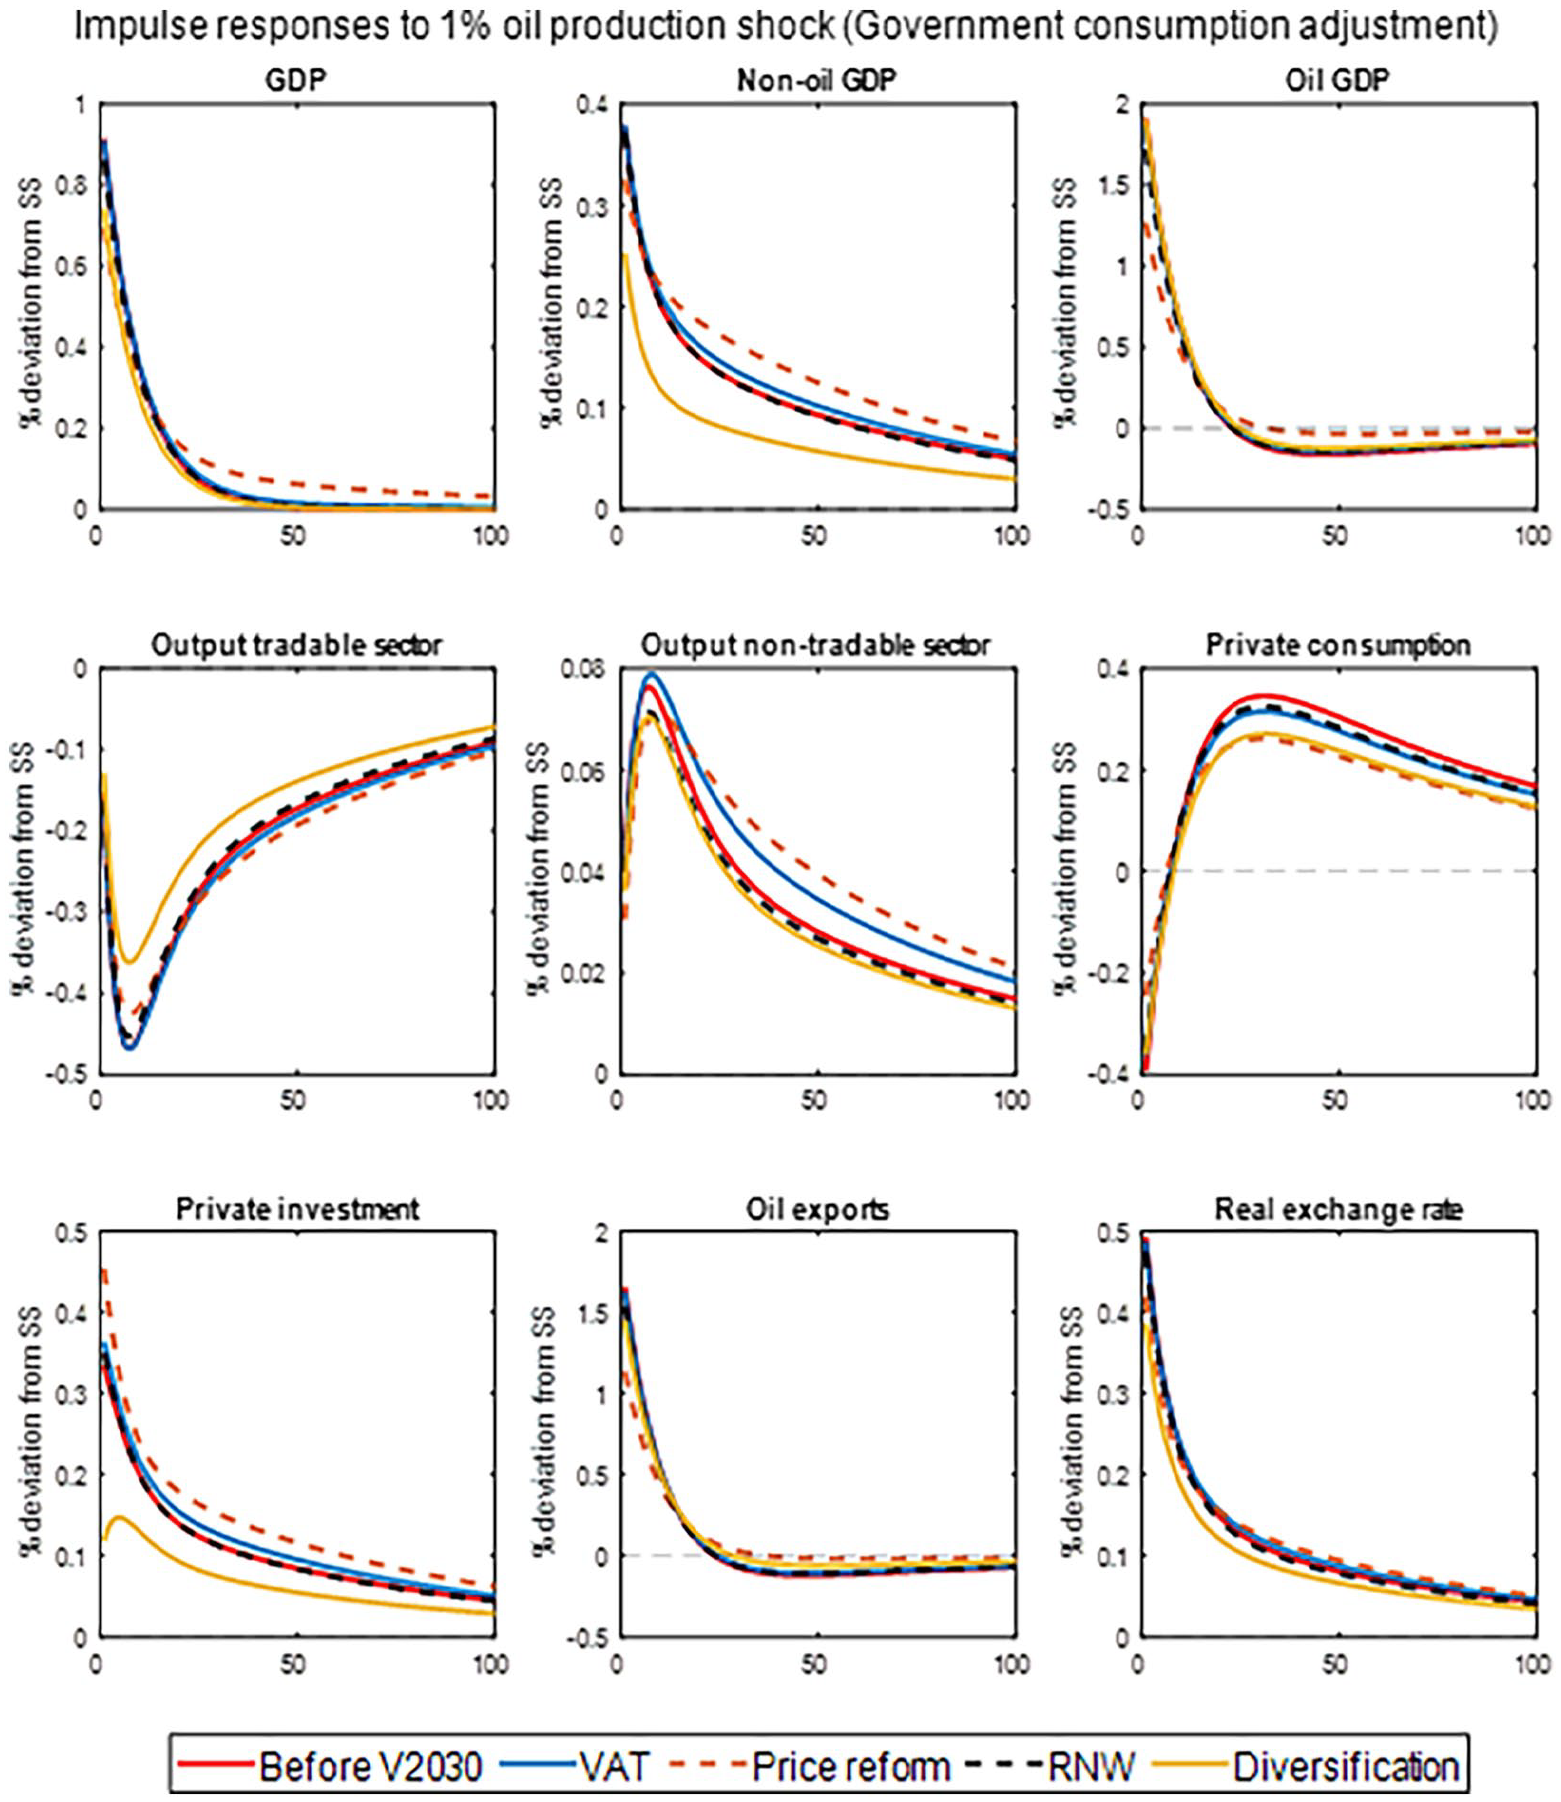
4.5. Impulse Response Functions for Individual Economic Reforms
To analyze the effects of individual policies on the transmission of oil shocks, we simulate the impulse response functions for each individual economic reform (“VAT,” “Price reform,” “RNW,” “Diversification”) and compare them with the response functions obtained in the baseline (“Before V2030”). The simulation results are showed in Figures 6 to 9.
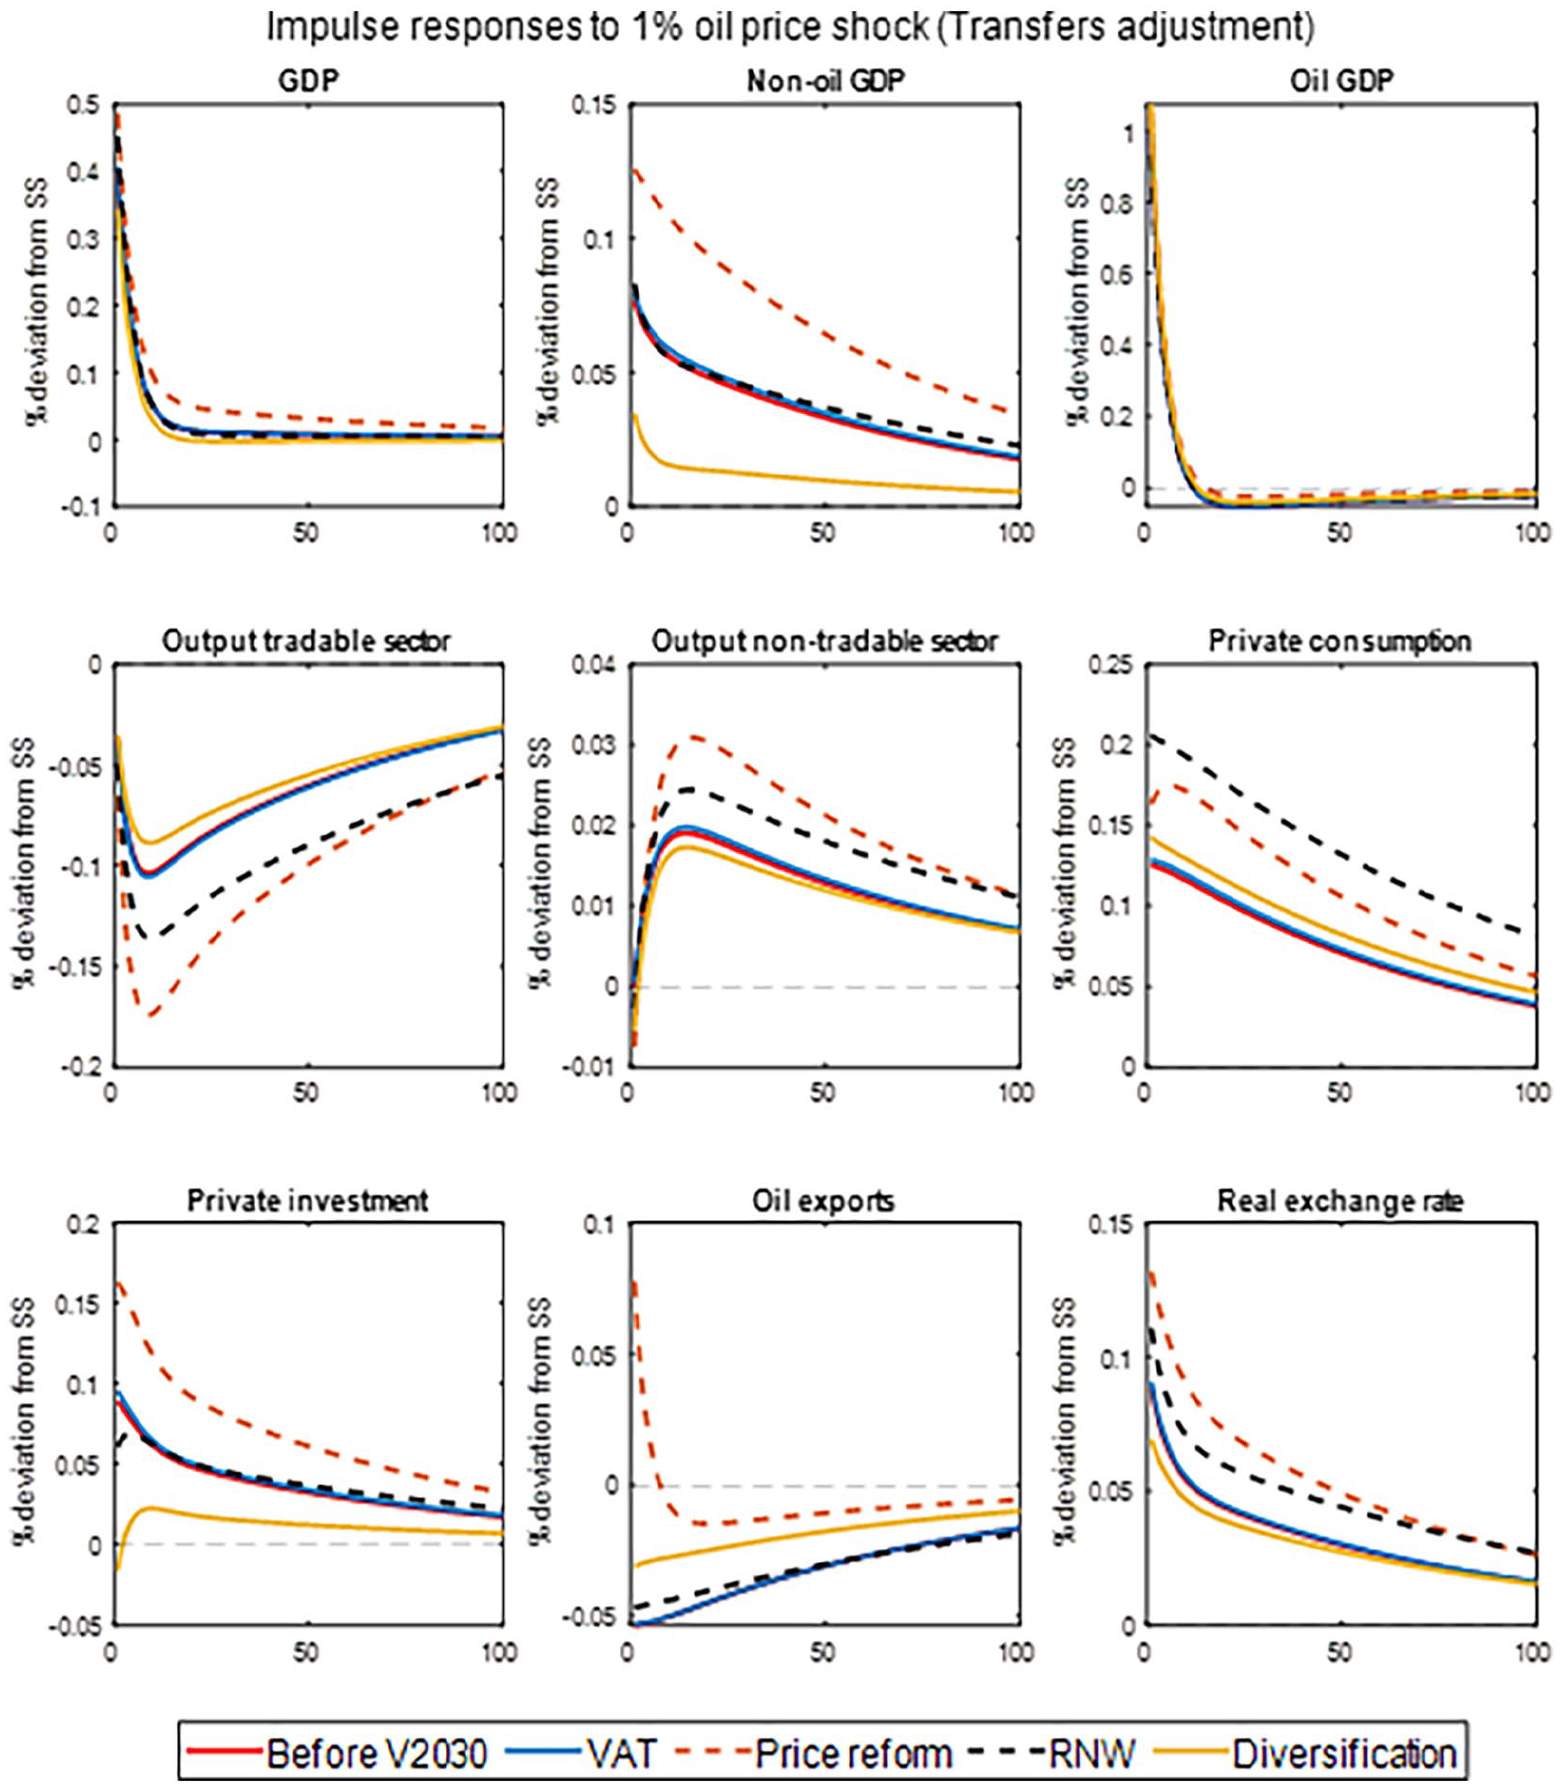
Impulse responses to oil price shocks: Fiscal adjustment via transfers (in percentage deviations from the steady state).
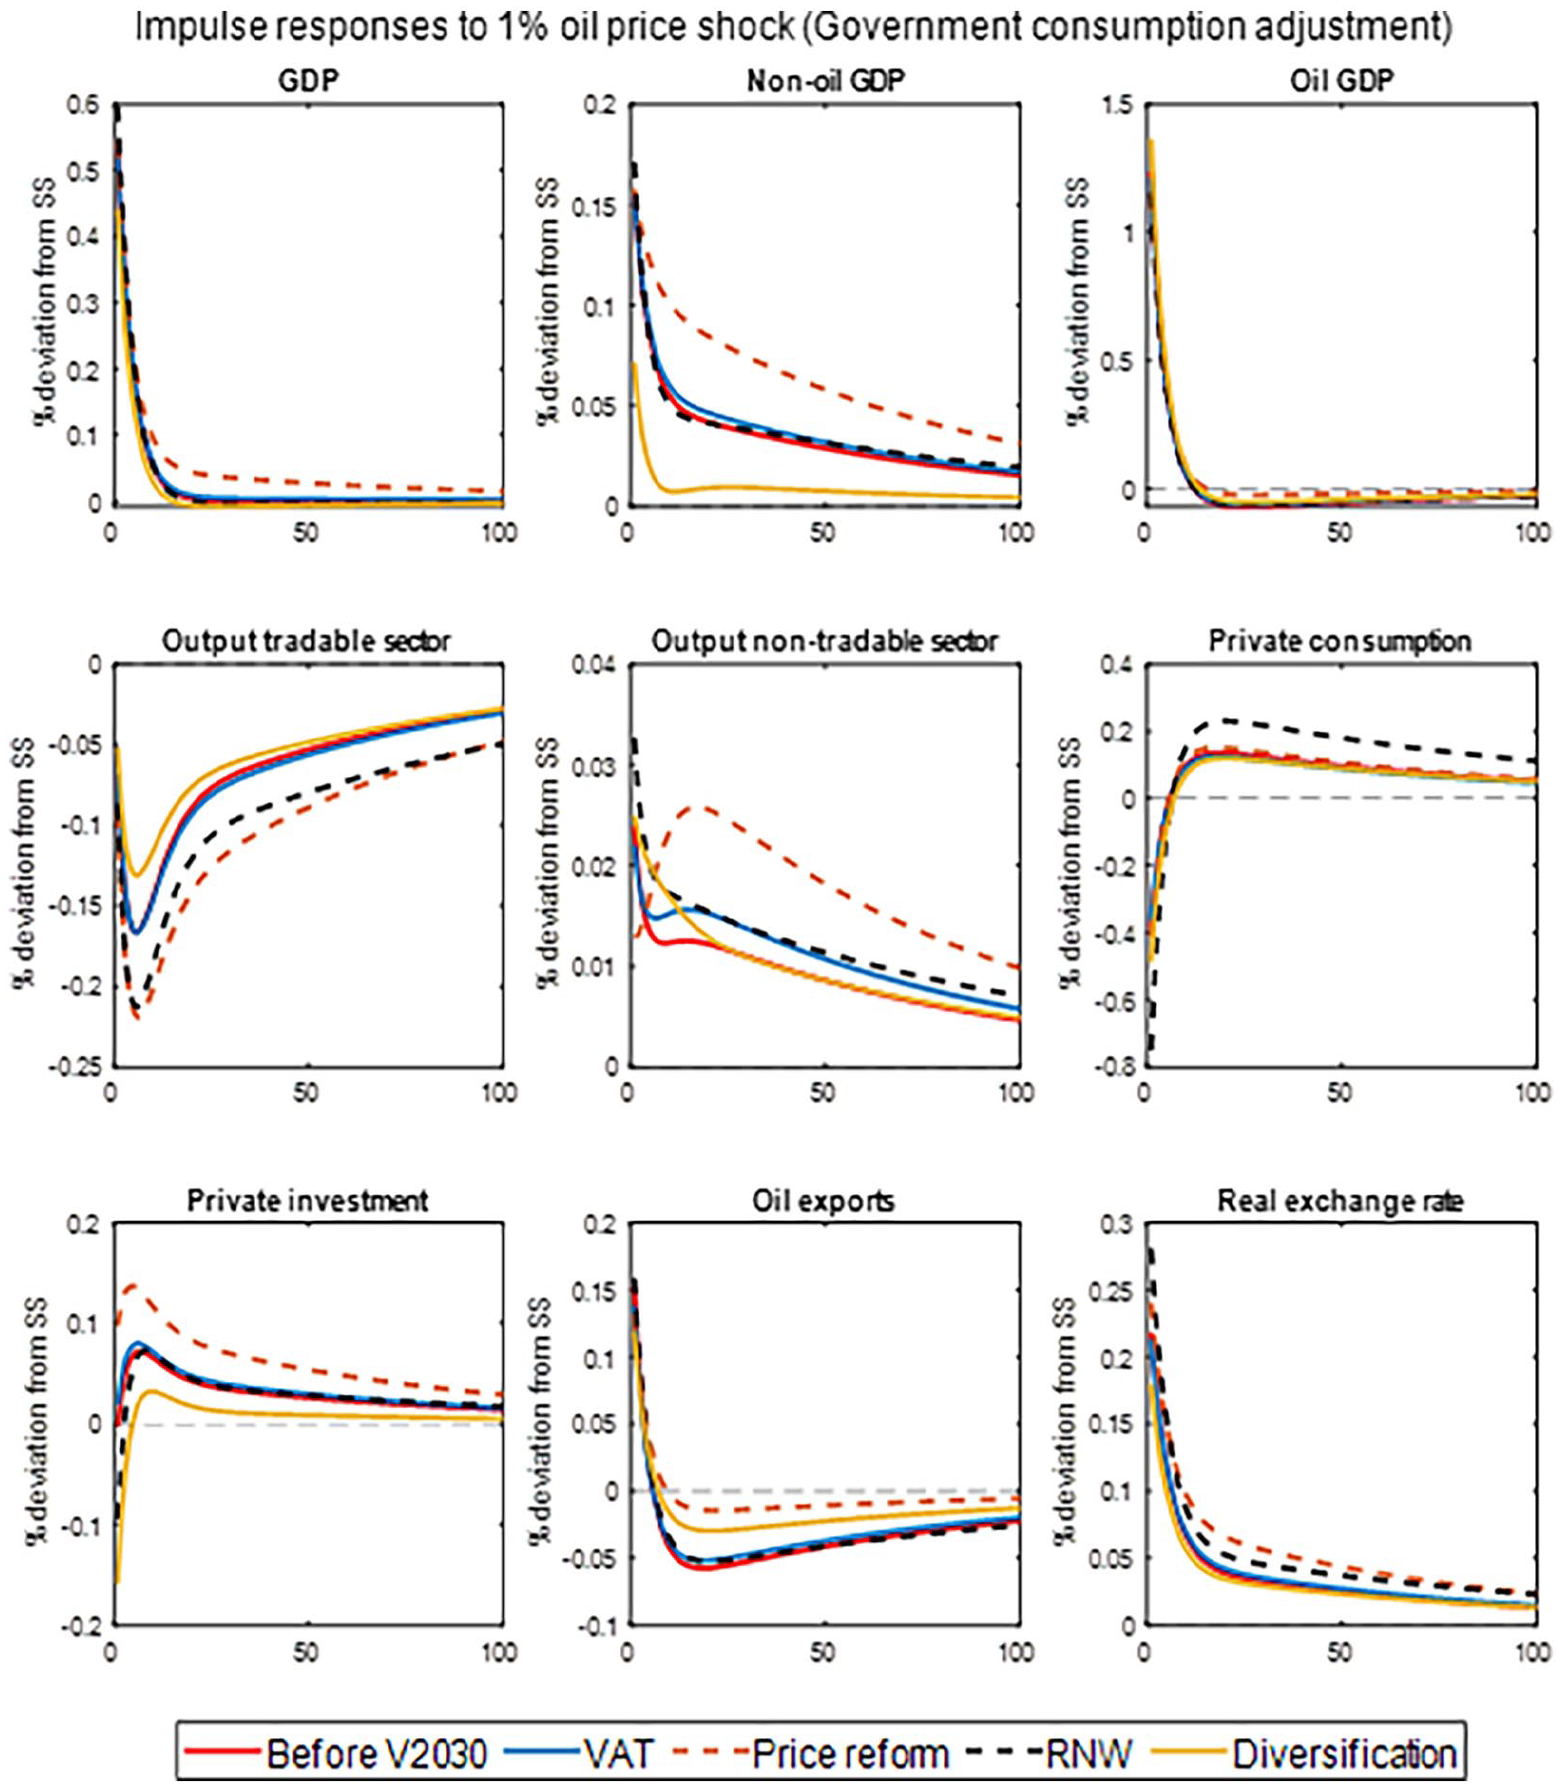
Impulse responses to oil price shocks: Fiscal adjustment via government consumption (in percentage deviations from the steady state).
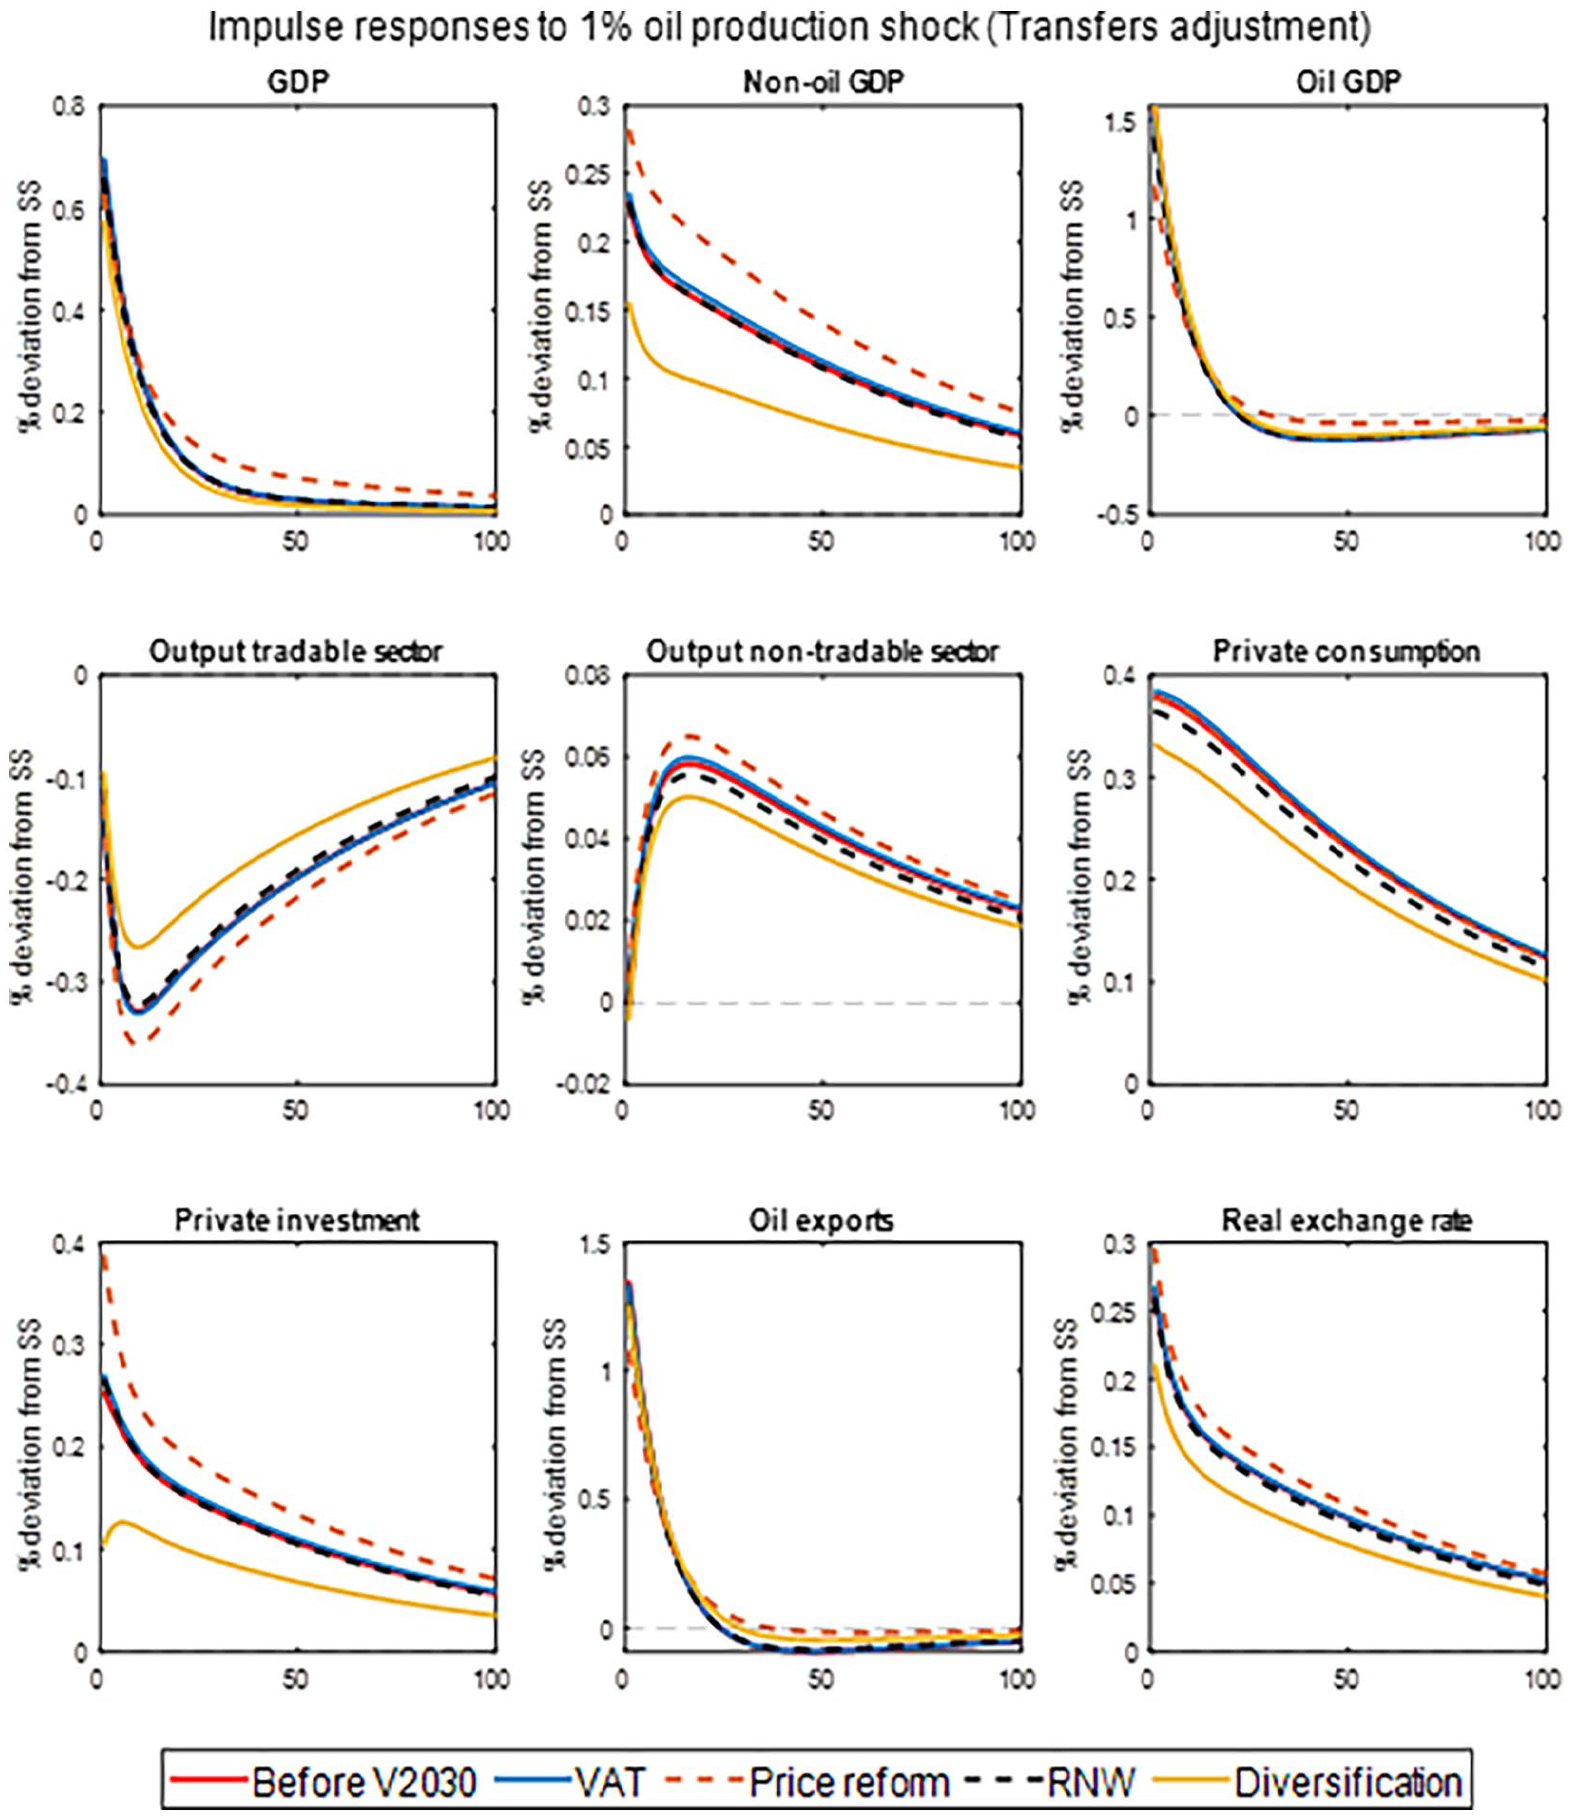
Impulse responses to oil production shocks: Fiscal adjustment via transfers (in percentage deviations from the steady state).
Impulse responses to oil production shocks: Fiscal adjustment via government consumption (in percentage deviations from the steady state).
We note that the different policy reforms do not produce qualitative differences in the transmission of oil price and oil production shocks, irrespective of the fiscal instrument (transfers to households or government consumption) adjusting the government budget. However, the individual policies produce quantitative differences in the transmission of oil shocks. Thus, we can observe that diversification policies tend, for the relevant macroeconomic variables, to reduce the quantitative response to the shocks, as seen in the case of non-oil GDP. In all cases, the response to the shock is not only smaller relative to the other policies, but also smaller than before the implementation of any Vision 2030 policies.
The results presented below reinforce the significance of a successful diversification policy in reducing the aggregate volatility of the Saudi economy.
5. Conclusions
This paper investigates the extent to which key Vision 2030 economic reforms contribute to rendering Saudi Arabia’s economy more resilient to exogenous shocks. We consider oil price and production shocks as well as productivity shocks.
First, we find that the volatility of the Saudi economy increases after the policy reforms if no economic diversification takes place. The reduction in domestic oil consumption induced by the reforms leads to increased oil exports and, consequently, oil revenues. As a result, the transmission of oil shocks to the domestic economy through fiscal channels is amplified. However, when economic diversification policies are also accounted for, the outcome is reversed.
Second, we assess the relative importance of each type of shock and to what extent it affects the economy after implementation of the Vision 2030 policies. The picture that emerges is that oil, through unexpected changes in prices or production, continues to be the main driver behind the fluctuations of the Saudi economy, even after the implementation of economic reforms. Oil production shocks are the second main driver of fluctuations of the Saudi economy, while sector-specific productivity shocks play a less important role.
Third, we analyze the response of economic variables to oil shocks using impulse response functions over a five-year horizon and build a resilience index to measure the economy’s ability to withstand shocks. We believe that the suggested index effectively captures the concept of economic resilience to a particular shock. When the Vision 2030 reforms include economic diversification policies, we find an increase in the resilience of GDP to oil price shocks ranging from 10 to 60 percent, depending on how labor market rigidities and the recycling of fiscal revenues are accounted for.
Our analysis shows, for an oil-exporting country, the importance of designing a policy package that balances structural reforms with economic diversification, in order to shield its economy against oil shocks while generating long-term welfare gains.
Supplemental Material
sj-pdf-1-enj-10.1177_01956574241240279 – Supplemental material for Resilience of Saudi Arabia’s Economy to Oil Shocks: Effects of Economic Reforms
Supplemental material, sj-pdf-1-enj-10.1177_01956574241240279 for Resilience of Saudi Arabia’s Economy to Oil Shocks: Effects of Economic Reforms by Hossa Almutairi, Marzio Galeotti, Baltasar Manzano and Axel Pierru in The Energy Journal
Supplemental Material
sj-pdf-2-enj-10.1177_01956574241240279 – Supplemental material for Resilience of Saudi Arabia’s Economy to Oil Shocks: Effects of Economic Reforms
Supplemental material, sj-pdf-2-enj-10.1177_01956574241240279 for Resilience of Saudi Arabia’s Economy to Oil Shocks: Effects of Economic Reforms by Hossa Almutairi, Marzio Galeotti, Baltasar Manzano and Axel Pierru in The Energy Journal
Footnotes
Declaration of Conflicting Interests
The author(s) declared no potential conflicts of interest with respect to the research, authorship, and/or publication of this article.
Funding
The author(s) disclosed receipt of the following financial support for the research, authorship, and/or publication of this article: Baltasar Manzano acknowledges the financial support from the Spanish Government and FEDER through grant PID2021-124015NB-I00.
Supplemental Material
Supplemental material for this article is available online.
4
5
Since we aim to quantify the effects of (long-term) structural transformations on the resilience of the Saudi economy, we assume that the government does not attempt to smooth its spending throughout time (so that these effects can be isolated). For this reason, we assume that the government budget is balanced every year. In addition, that the Saudi government follows or not a particular fiscal rule is not public knowledge. An alternative analysis (beyond the scope of the paper) could hypothesize fiscal rules and analyze their economic consequences (Snudden, 2016).
6
7
If the short-run price elasticity,
8
In 2019, Saudi Arabia’s population was estimated to be 34 million. The total number of non-Saudis in the country is estimated to be almost 11 million.
9
Saudi Arabia is the second largest sender of international remittances which in turn represent large foreign capital inflows to labor exporting countries. The Saudi labor market demand induces important flows in international migration, thus making remittances and labor flows susceptible to oil global price movements.
10
Empirical studies of developing countries and cross-country regressions find that public investment is important for a country’s growth (see, e.g., Easterly and Rebelo 1993; ![]() ). The literature accounts for the impact of public investment on productivity growth through the estimation of aggregate (national or regional) production functions in which public capital is entered as an input (Bom and Lightart 2014).
). The literature accounts for the impact of public investment on productivity growth through the estimation of aggregate (national or regional) production functions in which public capital is entered as an input (Bom and Lightart 2014).
12
The model also allows for labor income taxes paid by Saudi and non-Saudi households, capital income taxes paid by Saudi households and taxes on remittances paid by non-Saudi households. However, these taxes are currently zero.
13
For the jointly calibrated parameters to reproduce some of the long-run characteristics of the Saudi economy, the goal is to match the model’s steady-state results to key empirical relationships. We follow a non-linear constrained optimization procedure that minimizes the deviation from the empirical relationships while meeting the constraint represented by the model’s system of equations. In other words, the calibration procedure involves minimizing the sum of the squares of the deviations from the empirical relationships by optimally adjusting the selected parameters.
15
We computed the average Saudi wage by dividing the total Saudi labor income by the total working time by Saudi workers:
16
This elasticity is generally difficult to pin down in econometric estimation of production functions. Indeed, there is a certain variability in the estimates in the literature, with Ω lying between 0.15 and 0.40 (Aschauer 2000; ![]() ). Two empirical features are that the elasticity is lower when public capital refers to physical infrastructure only and that it is higher when the analysis pertains to developing countries. We took the upper end of the values of Ω on the grounds that, in this paper, we capture public investment in diversification that includes not only physical infrastructure but also digitalization, recreation and health. Supplemental Appendix C presents the results of the sensitivity analysis on parameters
). Two empirical features are that the elasticity is lower when public capital refers to physical infrastructure only and that it is higher when the analysis pertains to developing countries. We took the upper end of the values of Ω on the grounds that, in this paper, we capture public investment in diversification that includes not only physical infrastructure but also digitalization, recreation and health. Supplemental Appendix C presents the results of the sensitivity analysis on parameters
17
18
20
The impulse response functions are simulated as responses to orthogonal shocks, meaning that the covariance matrix of shocks is assumed to be diagonal for this exercise.
References
Supplementary Material
Please find the following supplemental material available below.
For Open Access articles published under a Creative Commons License, all supplemental material carries the same license as the article it is associated with.
For non-Open Access articles published, all supplemental material carries a non-exclusive license, and permission requests for re-use of supplemental material or any part of supplemental material shall be sent directly to the copyright owner as specified in the copyright notice associated with the article.