
Abstract
As a high-energy-consuming sector, China’s light sector should have received more attention for its carbon emissions (CO2e). However, the literature on energy-related CO2e in China’s light sector is limited at present. This paper aims to assess the impact of China’s light sector on CO2e. This paper applies the energy consumption technique, input-output analysis technique, and structural decomposition model to analyze China’s light sector energy-related CO2e and emission reduction from the input-output perspective. The results show that the energy structure effect, energy intensity effect, and input structure effect are the main restraining factors for the growth of the light sector energy-related CO2e, which are caused by the expansion of the energy utilization structure on the supply side of the light sector. The final demand effect is the factor promoting the growth of the light sector energy-related CO2e. It reveals that the final demand products in the light sector still have high environmental degradation features. Policymakers should actively enhance and rationally adjust the demand for the light sector in numerous industries to avoid the resource waste caused by the excessive expansion of the light sector.
Introduction
The environmental challenges in the developing world are increasing due to rapid urbanization, industrialization, and economic growth. Continuous economic growth demands more energy consumption, mainly from fossil fuels. Consequently, greenhouse gas emissions (GHGs) are increasing. Fossil fuel-based energy consumption threatens global sustainability (Alam et al., 2022; Pachiyappan et al., 2021; Jahanger et al., 2022a; Yang et al., 2023a). Reducing energy consumption to curtail environmental hazards is not a viable solution as energy is the primary input in all production processes (Yu et al., 2022a; Li et al., 2022). The United Nations General Assembly (UNGA) set various Sustainable Development Goals (SDGs) in 2015 to ensure a sustainable future. Among others, SDG7 aims to increase the use of clean energy and more reliance on renewable energy to ensure energy efficiency. It is also evident that SDG7 is linked to ensuring access to clean and affordable energy (He et al., 2022; Jahanger et al., 2022b).
According to the carbon emissions (CO2e) data released by the International Energy Agency (IEA) in 2020, China’s carbon emissions in 2019 accounted for about a quarter of the world’s emissions (IEA, 2020). According to the World Bank (2021), the contribution of the Chinese economy to carbon emissions (metric tons per capita) increased from 1.914 in 1990 to 7.60 in 2019 (WB, 2021). The graphical illustration of the CO2e trend for the Chinese economy is also shown in Figure 1. China is the greatest energy consumer and CO2 emitter (BP, 2020) and the second-largest economic entity worldwide. CO2 is the main element of GHGs and the main source of climate warming (Hamid et al., 2023; Jahanger et al., 2023; Yang et al., 2023b; Yu et al., 2022b). To reduce CO2e and mitigate the global GHG effect, Chinese President Xi Jinping stated at the UNGA on 22 September 2020, that “China will hike its regionally determined contributions and adopt more powerful policies and measures to strive for CO2e by 2030. It reached its peak a year ago, and strive to achieve carbon neutrality by 2060” (Ding et al., 2019). A graphical illustration of the CO2e trend for China economy.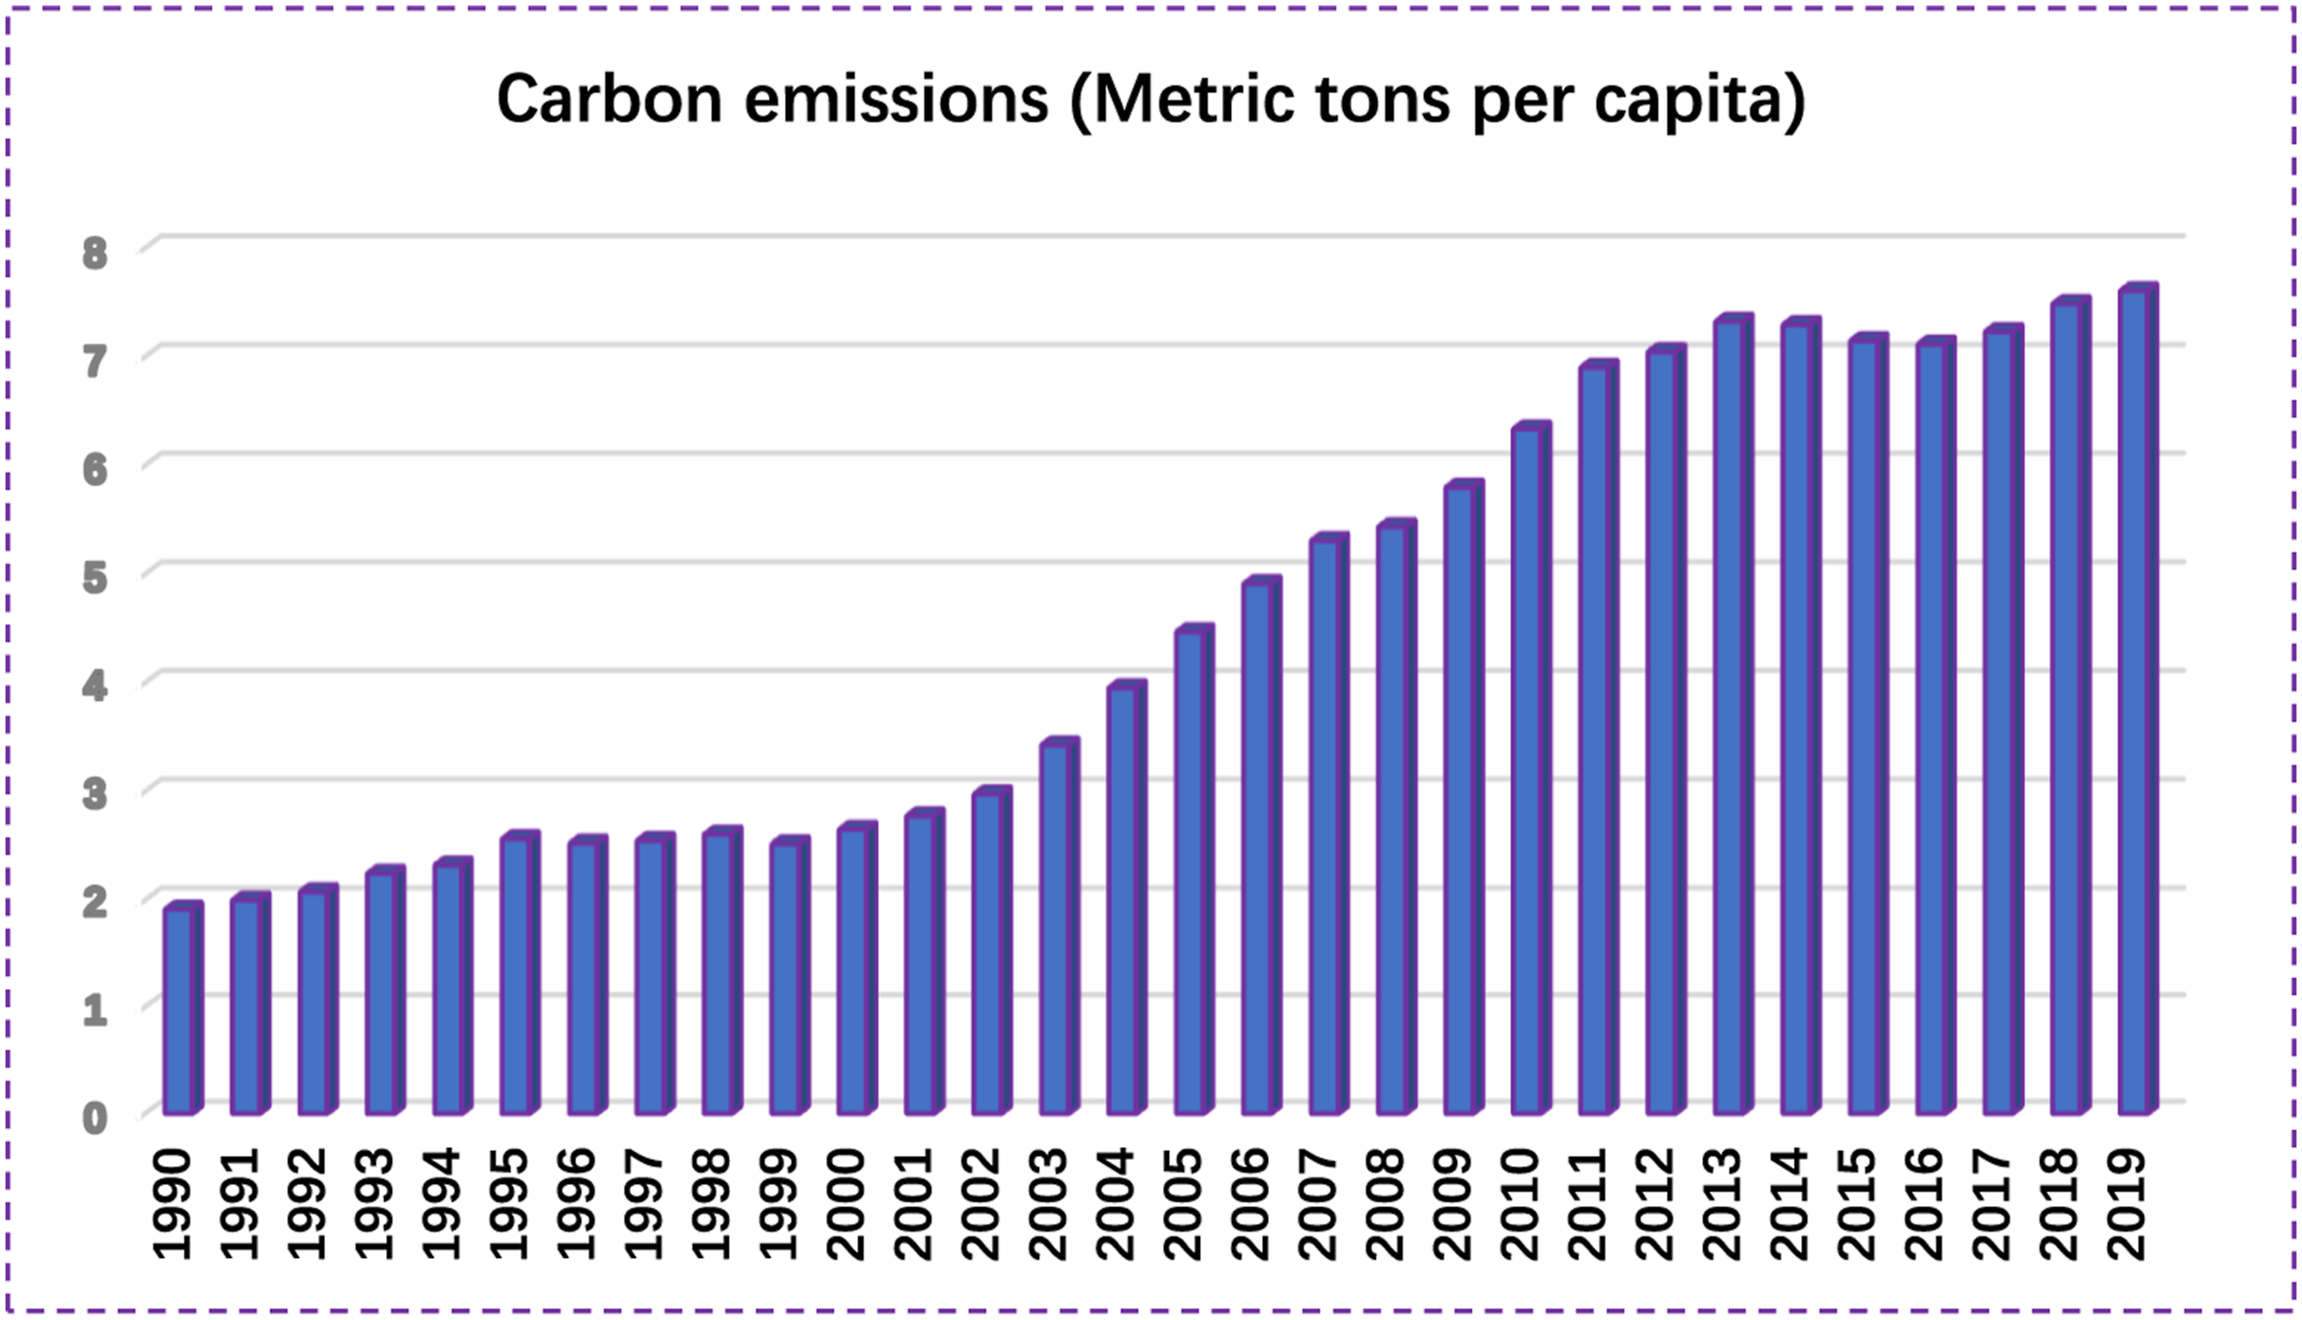
As China’s industrial system is the key factor in energy utilization, the main foothold of China’s energy CO2e control is concentrated in the industrial system (Long et al., 2017; Chen et al., 2018; Jiang et al., 2022a). Among them, domestic and foreign scholars have calculated and studied the CO2e and emission reduction factors of several sectors in China, such as the power sector, heavy sector, agriculture sector, transportation sector, construction sector, service sector, and other energy-intensive sectors (Jahanger et al., 2022c; Wu et al., 2018; Xie et al., 2019; Yu et al., 2021; Yu et al., 2020; Jiang et al., 2022b; Yu et al., 2022; Li et al., 2023). Although the light sector is inferior to high-energy-consuming sectors such as electricity, transportation, and manufacturing in CO2e, the light sector accounts for 28.4% of the whole industrial scale. Therefore, the CO2e generated by the light sector is increasingly not negligible.
The subsequent structure of this paper is as follows: the second chapter is the literature review, the third chapter is the data and model, the fourth chapter is results and analysis, and the last chapter is research conclusion and policies.
Literature Review
Empirical Evidence
By combing the previous literature on CO2e of the light sector, it can be concluded that there are only a few studies on CO2e of the light sector in China. The few existing literature on CO2e of the light sectors are diffused in the study of the whole industrial system. Few pieces of literature systematically study CO2e and emission reduction of the light sector in China. Such as Guo and Liu (2016) constructed a computable general equilibrium model to analyze the influence of carbon tax policies on energy utilization and CO2e in China. The results show that coal, heavy sector, thermal power, light sector, natural gas, and transportation contribute more to CO2e reduction, while other sectors contribute less. Moreover, some scholars have studied the energy efficiency of light industry and specific industries, including the comparative study of energy consumption between light industry and heavy industry, and the utilization efficiency of energy technology in light industry. Lin and Tian (2016) introduced the general situation of energy consumption of China’s light sector, estimated the rebound effect size of China’s light sector for the first time, and compared and discussed the different degrees of rebound effect of light and heavy sector. Li and Lin (2017a) compared and analyzed the ecological total factor energy efficiency (ETFEE) of heavy and light industries. The results show that government-stimulated expansion has promoted technological development in a heavy industry compared with the light industry but still has no impact on utilizing existing technologies through improved management efficiency. Lin and Tian (2017) discussed the inter-factor substitution and inter-fuel substitution in China’s light industry, indicating that electricity price reform is crucial to energy conservation in China’s light industry. In the same year, Li and Lin (2017b) further constructed a unified comprehensive framework to analyze the rebound effect and related issues, and used this framework to conduct empirical analysis and comparison of China’s light and heavy industries, taking into account the heterogeneity among sub-industries. Tian and Lin (2018) pointed out that energy consumption in China’s light industry sector has increased significantly over the past 20 years, and applied a meta-frontier approach to study regional technology disparities in energy utilization of China’s light industry sector across different regions. The study found that the most advanced technology was in the eastern region and that it was effective to promote the spread of new technology from the east to the central region. Moreover, Wang et al. (2022) results found that light sector responsible for China’s local CO2e was the household electrical appliances sector. Such consequences may offer a reference for articulating light sector policies to have a positive influence on the socio-economic landscape and inspire SDGs.
Furthermore, Wang et al. (2019) studied the influence of technological progress on CO2e. The results show that although technological progress in heavy industry and light industry has significantly contributed to the improvement of energy efficiency, technological progress has contributed to the increase of CO2e level. Kang and Yang (2020) used the energy utilization technique and the input-output technique to study the CO2e structure of China’s energy system and industry in 2015 by seeing the two aspects of energy investment in total capital formation and export from the viewpoints of China’s energy supply and demand sides. The results show that construction, agriculture and light industries have low-CO2e and high-CO2e efficiency.
Besides, Chen et al. (2020) measured total factor energy efficiency and CO2e efficiency in China’s Anhui Province. The results show that the CO2e efficiency and total factor energy efficiency of each sub-industry of the light industry have a big gap. Contraction of the gap between the sub-industries of the light sector is favorable to raising the overall level of the total production cost of the light industry. Jin and Han (2021) adopted the generalized Division index model to examine the decoupling between CO2e of China’s manufacturing and industrial added value. The outcomes show some improvement in decoupling the manufacturing sectors, particularly in the light sector. Additionally, Mahapatra et al. (2009) revealed that efficient electric lighting offers higher light levels low energy utilization and low environmental degradation in the case of the India economy.
First, from the analysis of existing literature on CO2e of the light sector, only few studies are there about light sector from the perspective of input–output analysis. Second, in terms of research methods, most existing literature focuses on the econometric and exponential decomposition models, while few studies use the structural decomposition model to study CO2e from the light sector. Compared with the exponential decomposition model, this method can analyze the influence of changes in demand for the light sector CO2e (Hoekstra and Van den Bergh, 2003). From the research point of view, few studies examine the structural characteristics and structural emission reduction factors of China’s light sector energy.
Contribution Margin
The current research is exclusive from the prior studies in three-fold. Most significantly, from the perspective of input-output analysis, the supply and demand sides of light sector are unified, and the CO2e and emission reduction of light sector energy are studied comprehensively and systematically. Secondly, energy consumption and input-output approaches are used to inspect the structural characteristics of light sector CO2e. This process describes the evolution of historical CO2e structure characteristics of the light sector, providing a theoretical analysis basis for the supply side energy CO2e control of the light sector. Thirdly, the structural decomposition technique is used to examine the influence of four structural factors on the growth of light sector energy CO2e.
Data Description and Model Construction
Data Description
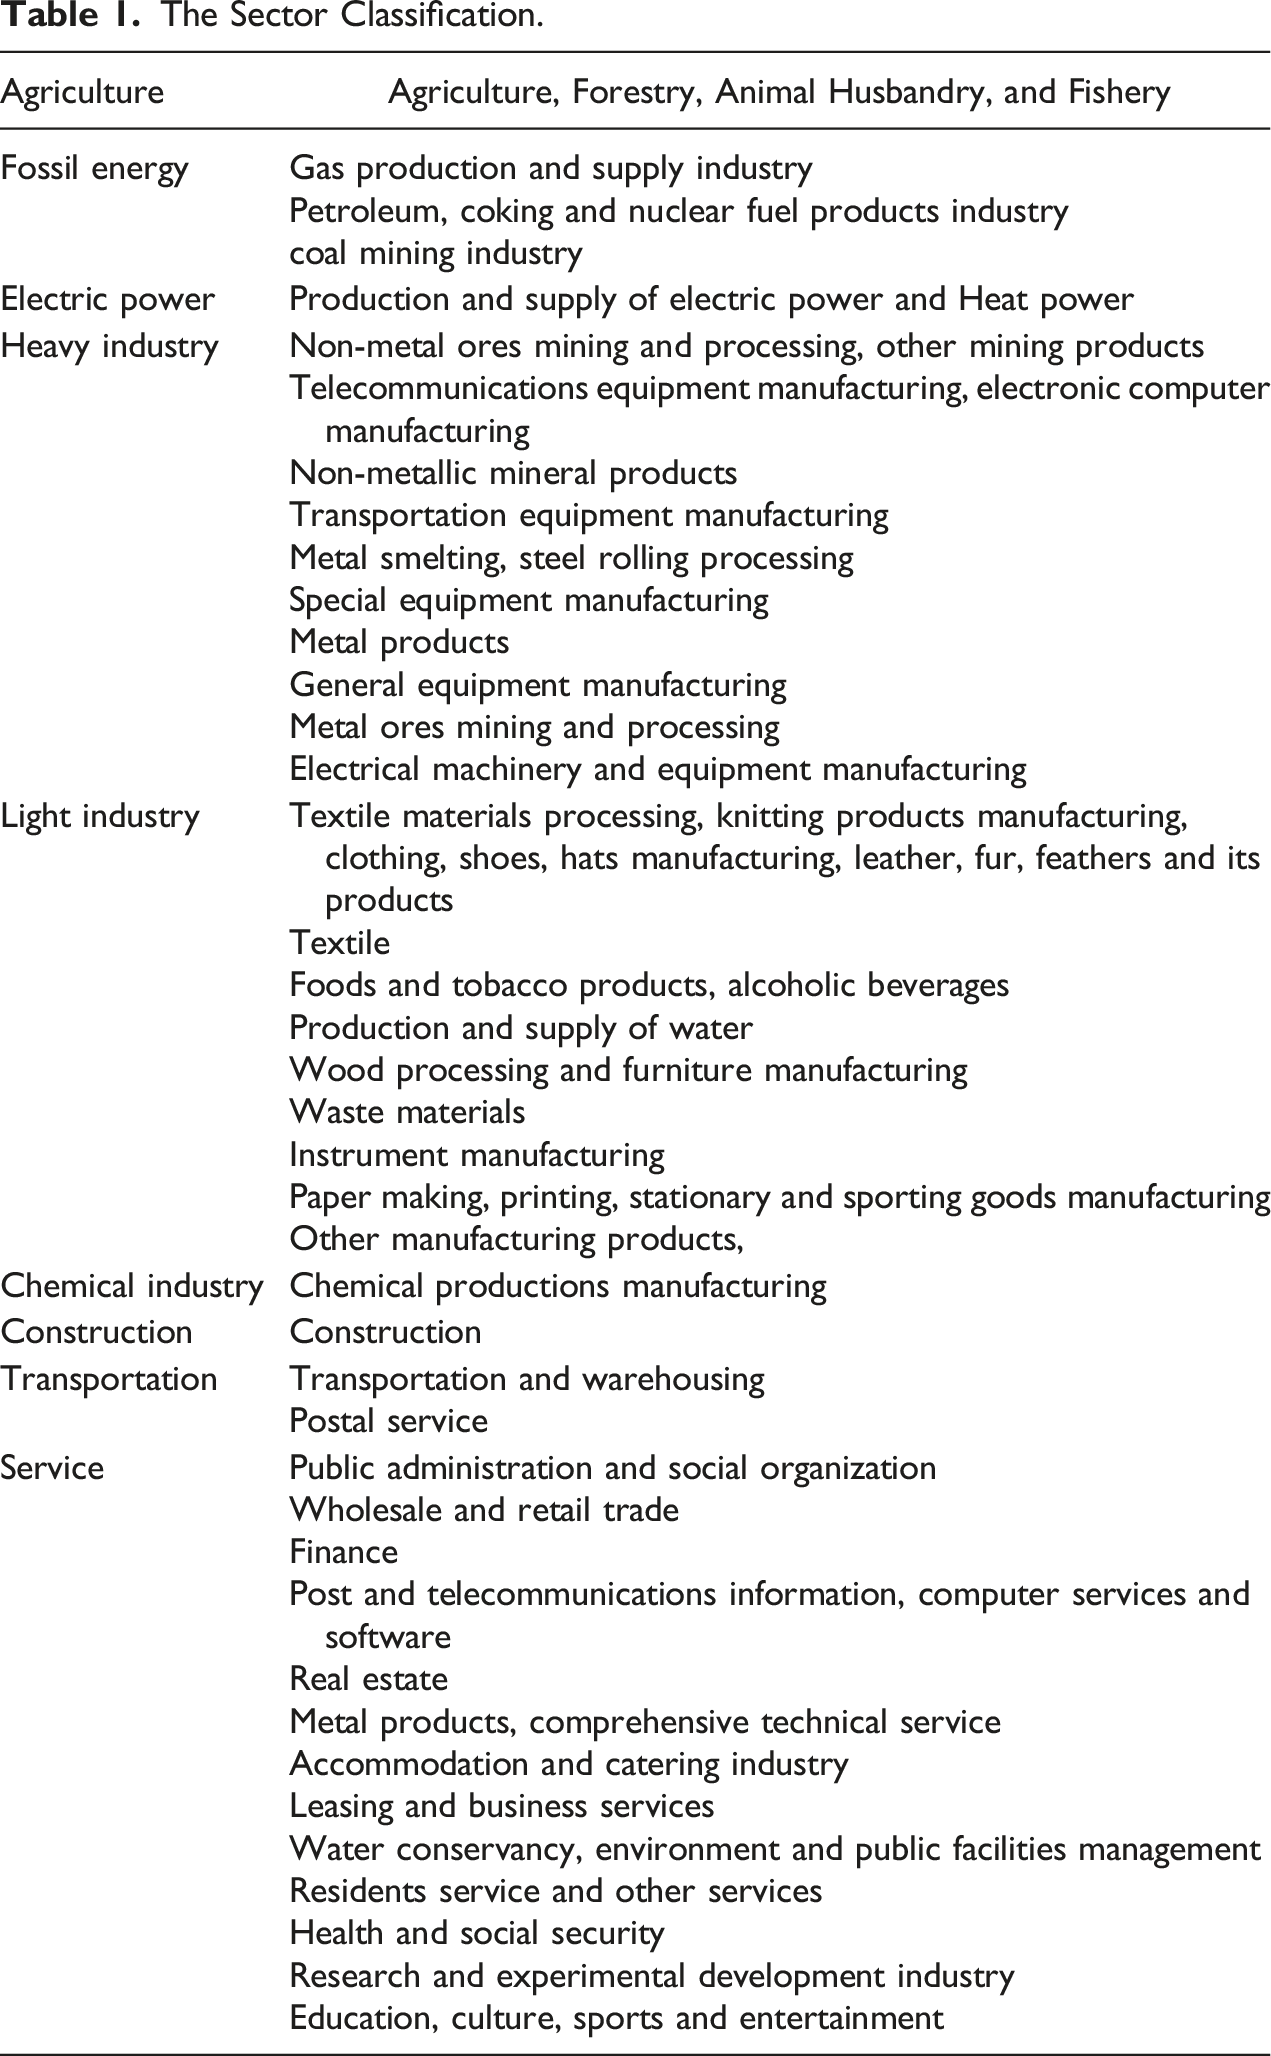
The research data in this current paper is divided into three parts. First, the paper uses the data from China’s input-output tables for the years 2007, 2015, 2012, and 2017. The second part is the final fossil energy utilization of the light industry in China’s energy statistical yearbook corresponding to 5 years. The third portion is the CO2e coefficients of 12 energy sources published by Intergovernmental Panel on Climate Change (IPCC). It should be noted that as China’s input-output table is restructured/updated every 5 years and will be extended every two to 3 years, the research interval of this paper is not continuous. At the same time, considering the observability of the expression of research results and the division of China’s input-output table into 42 departments, we combined the 42 departments into 9 with reference to the relevant literature (Yu et al., 2023). Figure 2 represents the geographical coverage of the Chinese economy. The details of department consolidation are revealed in Table 1. Geographical coverage of China economy. The Sector Classification.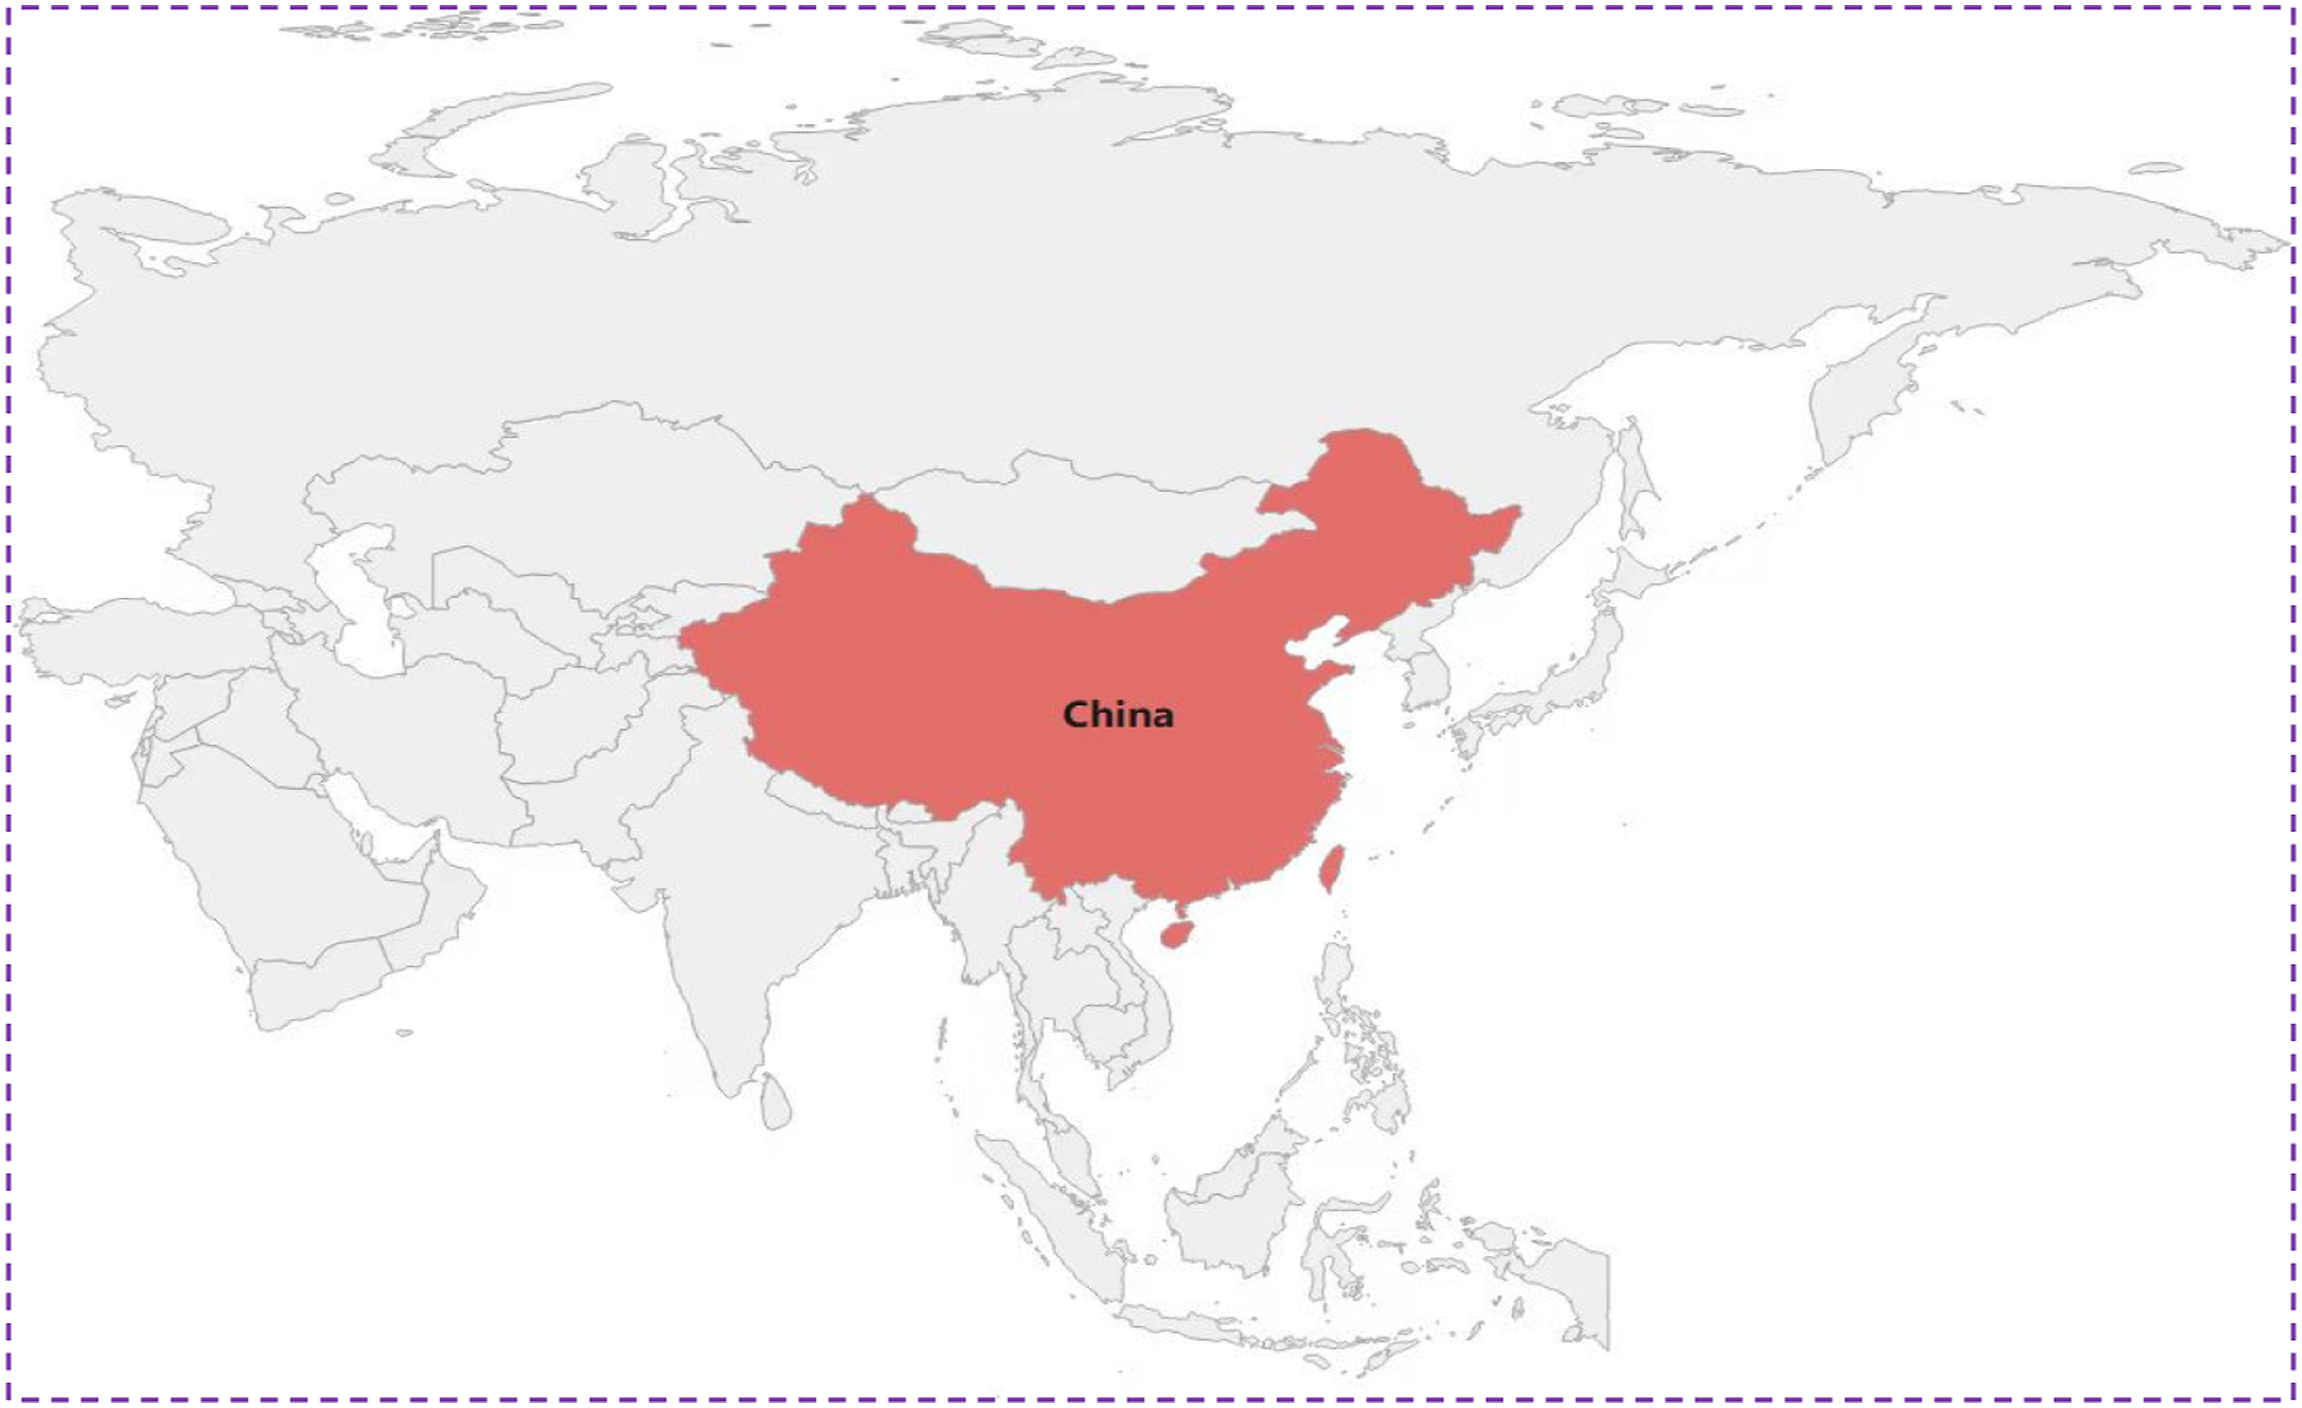
Model Specification
This section is divided into two parts: the input-output method and the decomposition model of China’s light sector. The flow chart depicted in Figure 3 expresses the mechanism of the model more clearly. The flow chart of this model.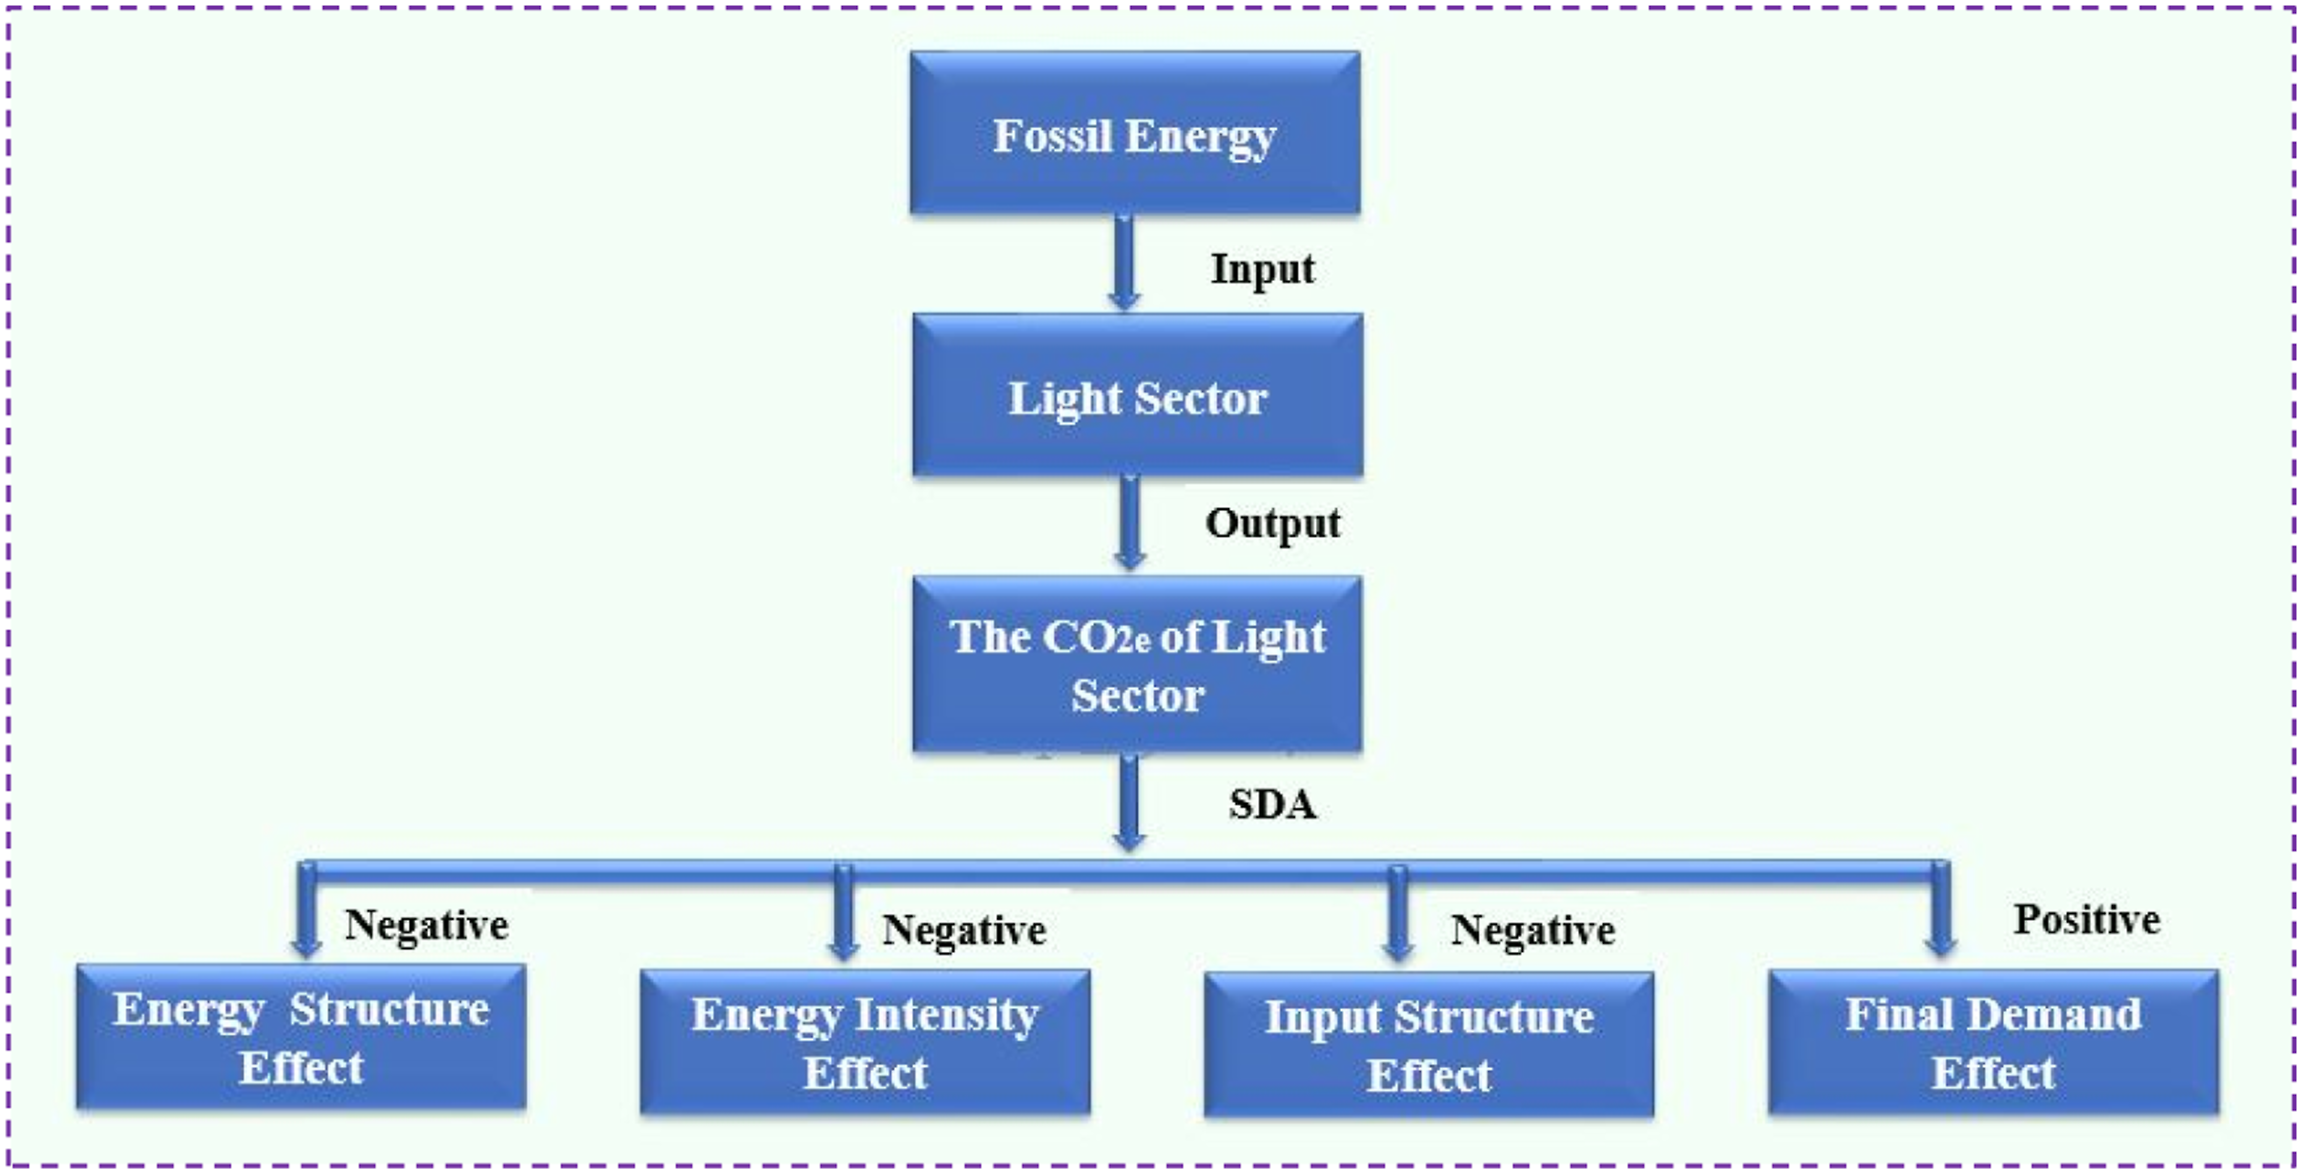
Input-Output Analysis
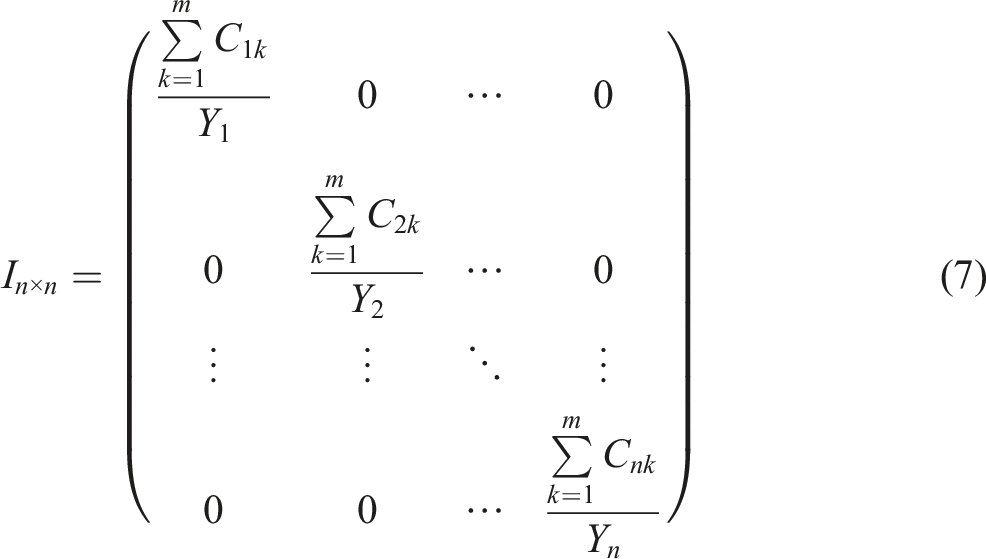
The input-output analysis mainly establishes the input-output table to analyze the relevant economic activities. To get the model first, one needs to compile the input-output table and select the model according to the relevant data in the table. Therefore, the input-output table is essential for input-output analysis and forms the basis of the input-output analysis model. In the input-output table, inputs are arranged vertically and outputs horizontally. The model reflects the relationship between commodity production and material exchange among economic departments. This top-down technology uses departmental monetary data to explain the complex interdependence between industries in the modern economic system. According to the data collected by the economic departments, an input-output analysis matrix is compiled in the input-output table and a mathematical model of input and output is built according to the balanced connection.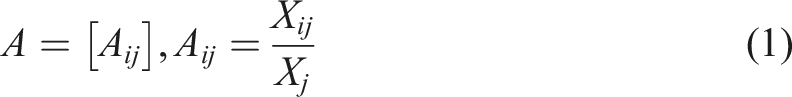
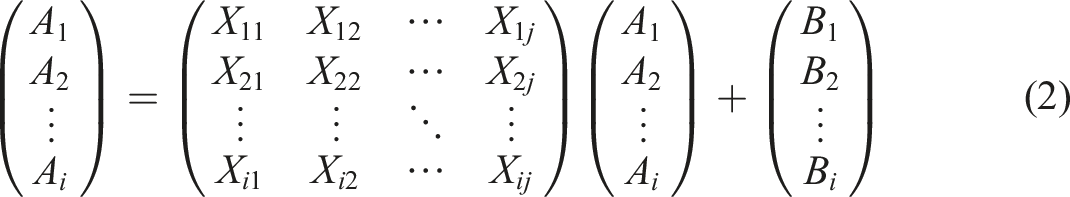


The economic significance of
Decomposition Model of the CO2e Structure of China’s Light Sector
As the input-output table of 42 sectors encompasses 16 light industries, the final energy utilization of the light sector is the sum of the energy consumption of these 16 sectors. Additionally, as electric heating energy consumption does not directly produce CO2e, the terminal energy utilization here primarily refers to terminal fossil energy utilization.

Among them, 
Among them, 


Among them, 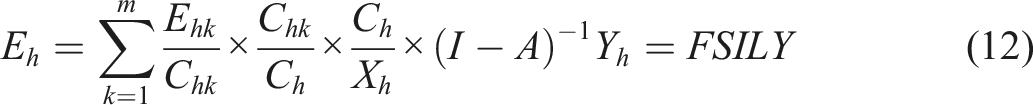
Simultaneously, the difference between the CO2e of China’s h-th industry (light industry) in previous and subsequent years can be articulated as follows
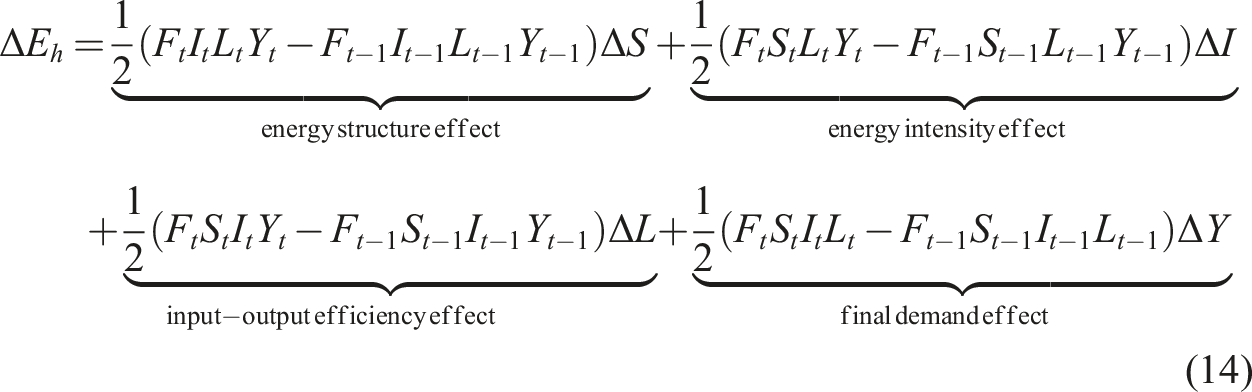


Here, the impact of the energy structure effect of the light sector on CO2e is
Results and Analysis
CO2e Calculation Results and Analysis of the Light Sector
Based on the above data and the energy utilization calculation method, we can calculate the energy CO2e of China’s light sector from 2007 to 2017. The results are shown in Figure 4 below. Energy-related CO2e of the light sector.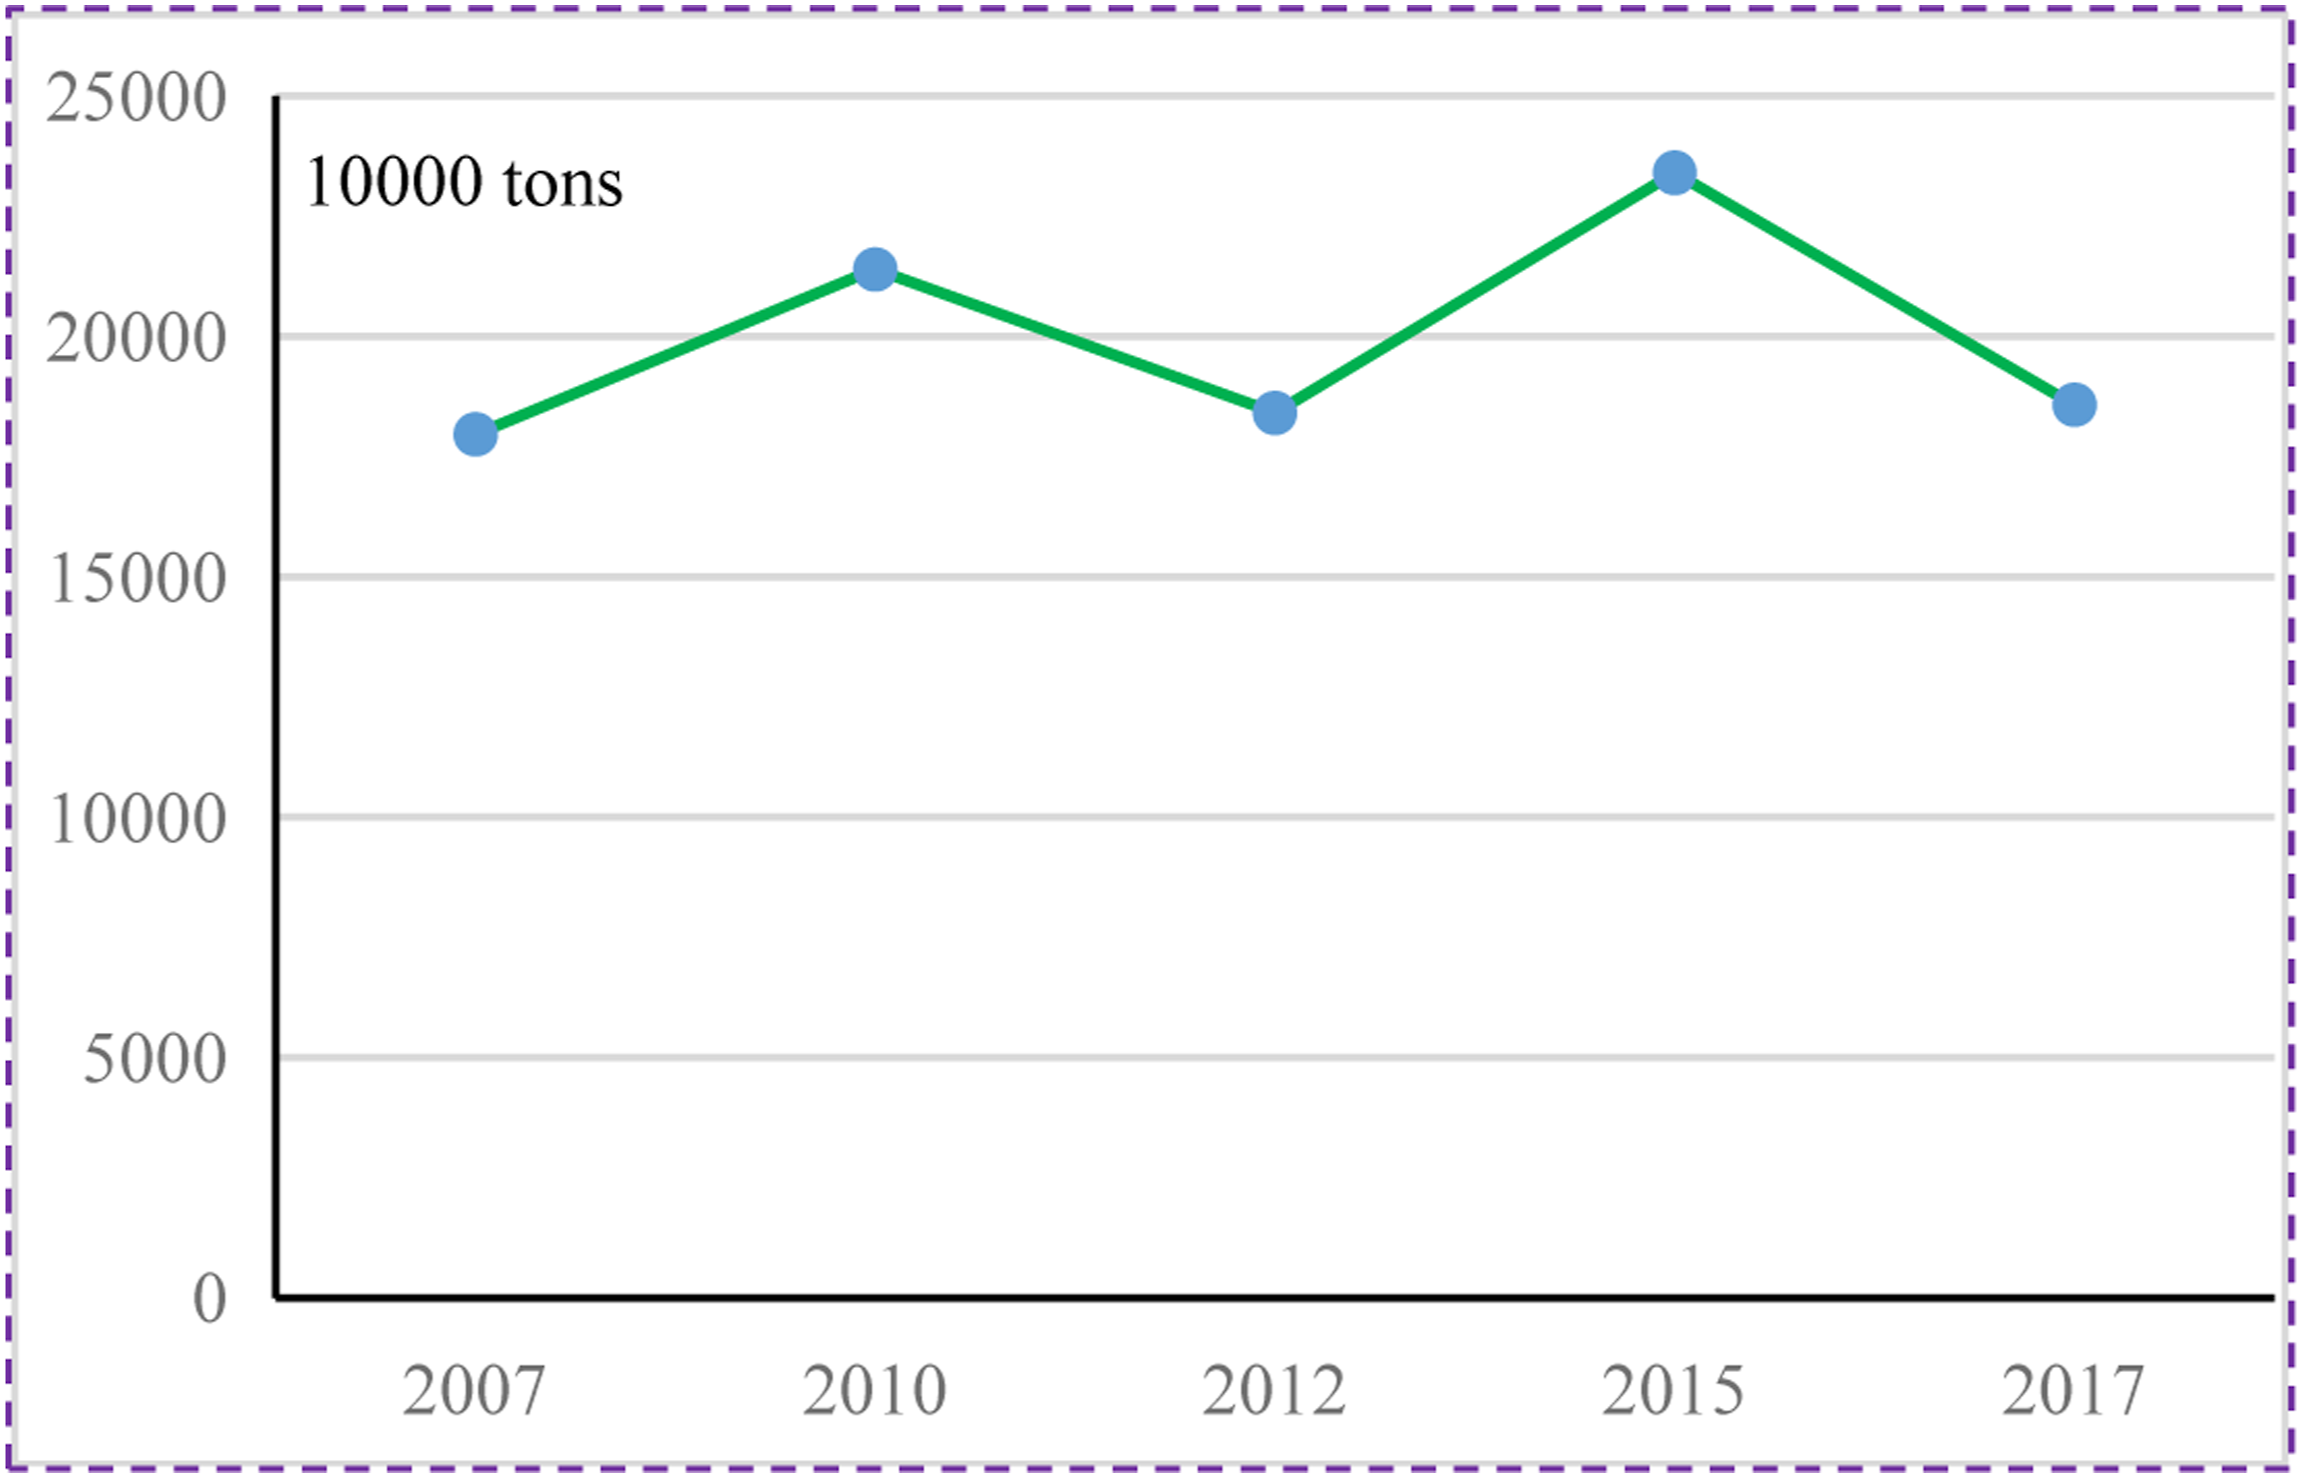
By analyzing Figure 4, the energy CO2e of China’s light sector in 2007, 2010, 2012, 2015, and 2017 can be concluded to be 179.632, 213.9819, 84.0992, 234.0901, and 185.7926 million tons, respectively. Therefore, from 2007 to 2017, the energy-related CO2e of China’s light sector showed a fluctuating upward or downward trend. The above phenomenon can also be well-explained. Sorting out the energy utilization of China’s light sector from 2007 to 2017, we can conclude that the energy utilization of light industries converted into standard coal from 2007 to 2017 is 56.67,140,306, 67.42,282,675, 57.7,970,772,73.66,089,282, and 62.75,765,395 million tons, respectively. This is a good explanation for the rising trend of light industrial energy CO2e from 2007 to 2010, the declining trend from 2010 to 2012, the rising trend from 2012 to 2015, and the declining trend from 2015 to 2017.
Analysis of CO2e Emission Structure of the Light Sector
CO2e emission Structure of the Light Sector.
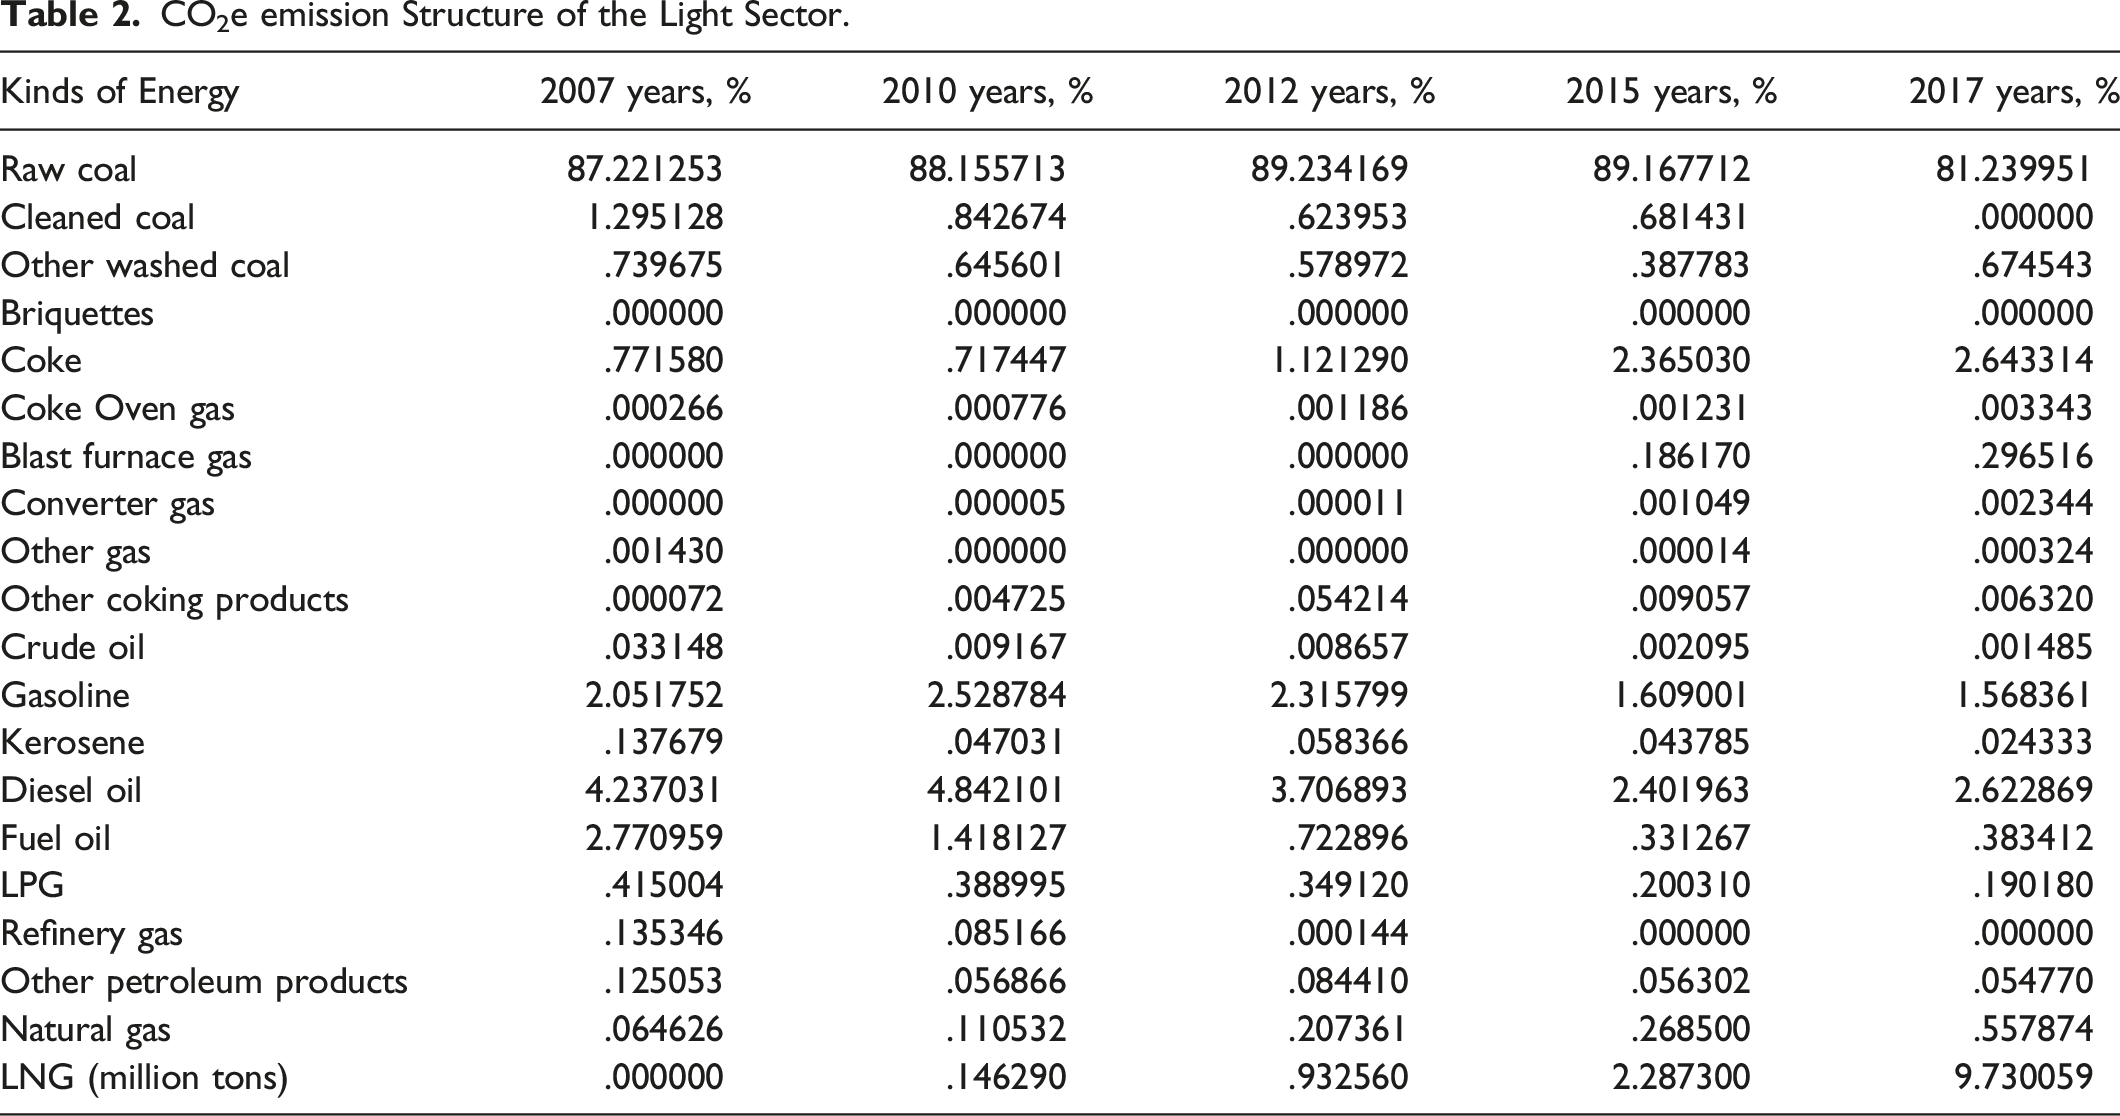
Two points can be drawn from the analysis of Table 2 from the viewpoint of the energy consumption structure. First, more than 80% of China’s light sector energy CO2e is still produced by burning raw diesel and coal. Among them, the CO2e of raw coal was described as 87.22% of the overall energy CO2e in 2007. However, in 2010, it increased to 88.16% (.94% more than that in 2007). Furthermore, in 2012, the CO2e of raw coal was defined as 89.23%, showing an almost 1.07% rise compared to its value in 2010. In 2015, the CO2e of raw coal was around 89.17% of the overall energy CO2e, but in 2017, it declined by approximately 7.93%. On the other hand, in 2007, the CO2e of diesel accounted for 4.24% of the total energy CO2e but, in 2010, it was reported as 4.84%, a .60% enhancement. In 2012, the effect of CO2e of diesel was defined as 3.71%, a 1.13% decrease as compared to that in 2012, but in 2015, the effect of CO2e of diesel was 2.40%, a 1.31% increase. In 2017, the CO2e of diesel accounted for 2.62% of the total energy CO2e, a .12% increase over its value in 2017. By investigating the energy utilization data of light industries from 2007 to 2017, raw diesel and coal utilization can be assumed to account for more than 3% and 70% of the whole energy utilization in the entire research range. At the same time, with raw diesel and coal as maximum-carbon energy, their combustion CO2e coefficient is greater than that of minimum-carbon energy such as natural gas (hereafter NGAS) utilization. The leading two causes mutually clarify the above phenomenon. Second, on the opposite side, the CO2e from NGAS as clean energy is less than 10% of the total energy CO2e. Evaluating the energy utilization data in the series from 2007 to 2017, the utilization of NGAS and liquefied NGAS can be observed to account for no more than 17% of the fossil and primary energy in the entire research range. At the same time, for a low-carbon energy source such as NGAS, the CO2e coefficient of its combustion or burning is low. In the above paragraph, two problems or reasons mutually describe the phenomenon of NGAS utilization, accounting for a comparatively small quantity of the overall energy CO2e.
If Figure 4 is compared and analyzed from the perspective/viewpoint of time evolution, the share of CO2e of higher carbon energy sources such as diesel, oil, and raw coal can be concluded to present a fluctuating downward trend from 2007–2017. Particularly, raw coal decreased from 87.22% in 2007 to 81.24% in 2017 and diesel from 4.23% in 2007 to 2.62% in 2017. As CO2e is thoroughly linked to energy utilization and environmental strategies (Kong et al., 2020), we offer/provide the following conceivable clarifications by categorizing the energy base policies/strategies within the current research range. China’s 11th Five Year Plan on energy progress is planned to overcome the proportion of primary energy utilization, particularly high-carbon CO2e energy such as oil and raw coal. Compared with 2005, raw coal and oil are required to decrease by 1.8% points and 1.3% points in 2010. In the 12th Five Year Plan for energy progress, the Chinese policymakers/government proposed decreasing the proportion of coal utilization in 2015 to around 65% of that in 2010. The active implementation of the above energy policies has led to a steady downward trend in the proportion of high-carbon energy sources such as diesel and raw coal in the CO2e structure of light sector energy.
Because of the preceding analysis discussion, the energy utilization shape/construction on the supply side of light industries can be determined to have improved from 2007 to 2017, with 2015–2017 being the best period in the sample range. However, high-CO2e energy sources such as diesel, oil, and raw coal can be still determined to be the main energy sources for CO2e in light sectors. Hence, more effort is needed to improve the energy utilization structure of China’s light sector.
Outcomes and Analysis of Structural Emission Reduction in the Light Sector
Impact of Four Aspects on the Growth of Energy CO2e of Light Sector. (unit: 10000 tons).
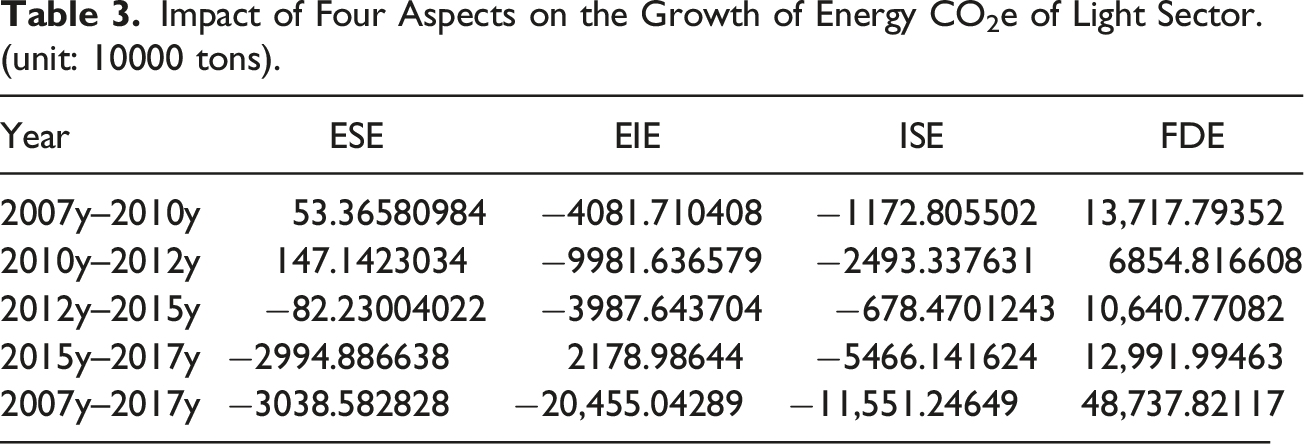
The following four facts can be obtained by analyzing Table 3 from the viewpoint of time evolution.
First, from 2007 to 2010, the energy structure and final demand effects are the agenda for the energy CO2e of the light sector. Precisely, the effect of energy structure reflects the characteristics of the energy utilization structure, indicating that the energy use structure on the supply side of the light sector has not been adjusted in this range. The “high carbonization” of the final product considers that China’s light sector has the feature of maximum energy input. The outcomes display that the “extensive” economic growth model of China’s light sector has not been upgraded from 2007 to 2010. The input structure and energy intensity effects can inhibit the growth of the energy CO2e of China’s light sectors. Remarkably, the energy intensity factor reflects the energy use per unit output, and the input structure effect reflects the generalized technological progress. The outcomes display that the energy use technology of China’s light sector has been significantly improved from 2007 to 2010, and the generalized technological development reflecting the input structure effect has also been upgraded, leading to the energy intensity effect and emission reduction effect. These results are in line with the finding of Jiang et al., 2022c.
Second, from 2010 to 2012, the energy structure and final demand effects were still the driving forces for the energy CO2e in the light sector. This shows that in this research range, the light sector as the final demand invention still has the attribute of high environmental degradation. The energy use structure on the supply side of China’s light sector has not been improved. The input structure effect and energy intensity effect can inhibit the growth of the energy CO2e of China’s light sector. This demonstrates that the energy use technology of China’s light sector has been significantly upgraded within this research range, and the generalized technological development reflecting the influence of input structure has also been enhanced. These results coincide with the finding of Tian and Lin (2018).
Third, from 2012 to 2015, the final demand effect remained an important factor for the growth of energy and CO2e of light sectors. This shows that the light sector, as the final demand product, still presents features of high environmental pollution in this research range. The input structure effect, energy structure effect, and energy intensity effect can inhibit the growth of energy CO2e of China’s light sectors. This displays that within this research range, the energy consumption structure of China’s light sector has been optimized, the energy utilization technology of China’s light sector has been significantly upgraded, and the generalized technological progress reflecting the effect of the input structure has also been enhanced.
Fourth, from 2015 to 2017, the final demand effect and energy intensity effect promoted the growth of energy CO2e of China’s light sectors. This process displays that China’s light sector, as the final demand product, still displays the features of high environmental pollution within the research range. Simultaneously, China’s light sector energy utilization technology has not been effectively upgraded. The input and energy structure effects can inhibit the growth of the energy CO2e of China’s light sectors. This demonstrates that within this research range, the energy consumption structure of China’s light sector has been optimized, and the generalized technological progress reflecting the effect of input structure has been improved. This finding is similar to those found by Wang et al., 2022.
Overall, from 2007 to 2017, the input structure effect energy structure and energy intensity effects had emission reduction effects on the growth of the energy CO2e of China’s light sectors, and the final demand effect was the essential factor for the increase of the energy CO2e of China’s light sectors. From the viewpoint of emission reduction, the input structure effect, energy use intensity effect, and final demand effect are significant means to attain long-term emission reduction. Optimizing the energy utilization structure can also achieve emission reduction in the short term. Further, we will examine the energy intensity and energy structure effects of China’s light sectors.
Energy Structure Effect Analysis
Energy Consumption Structure of Light Sector.
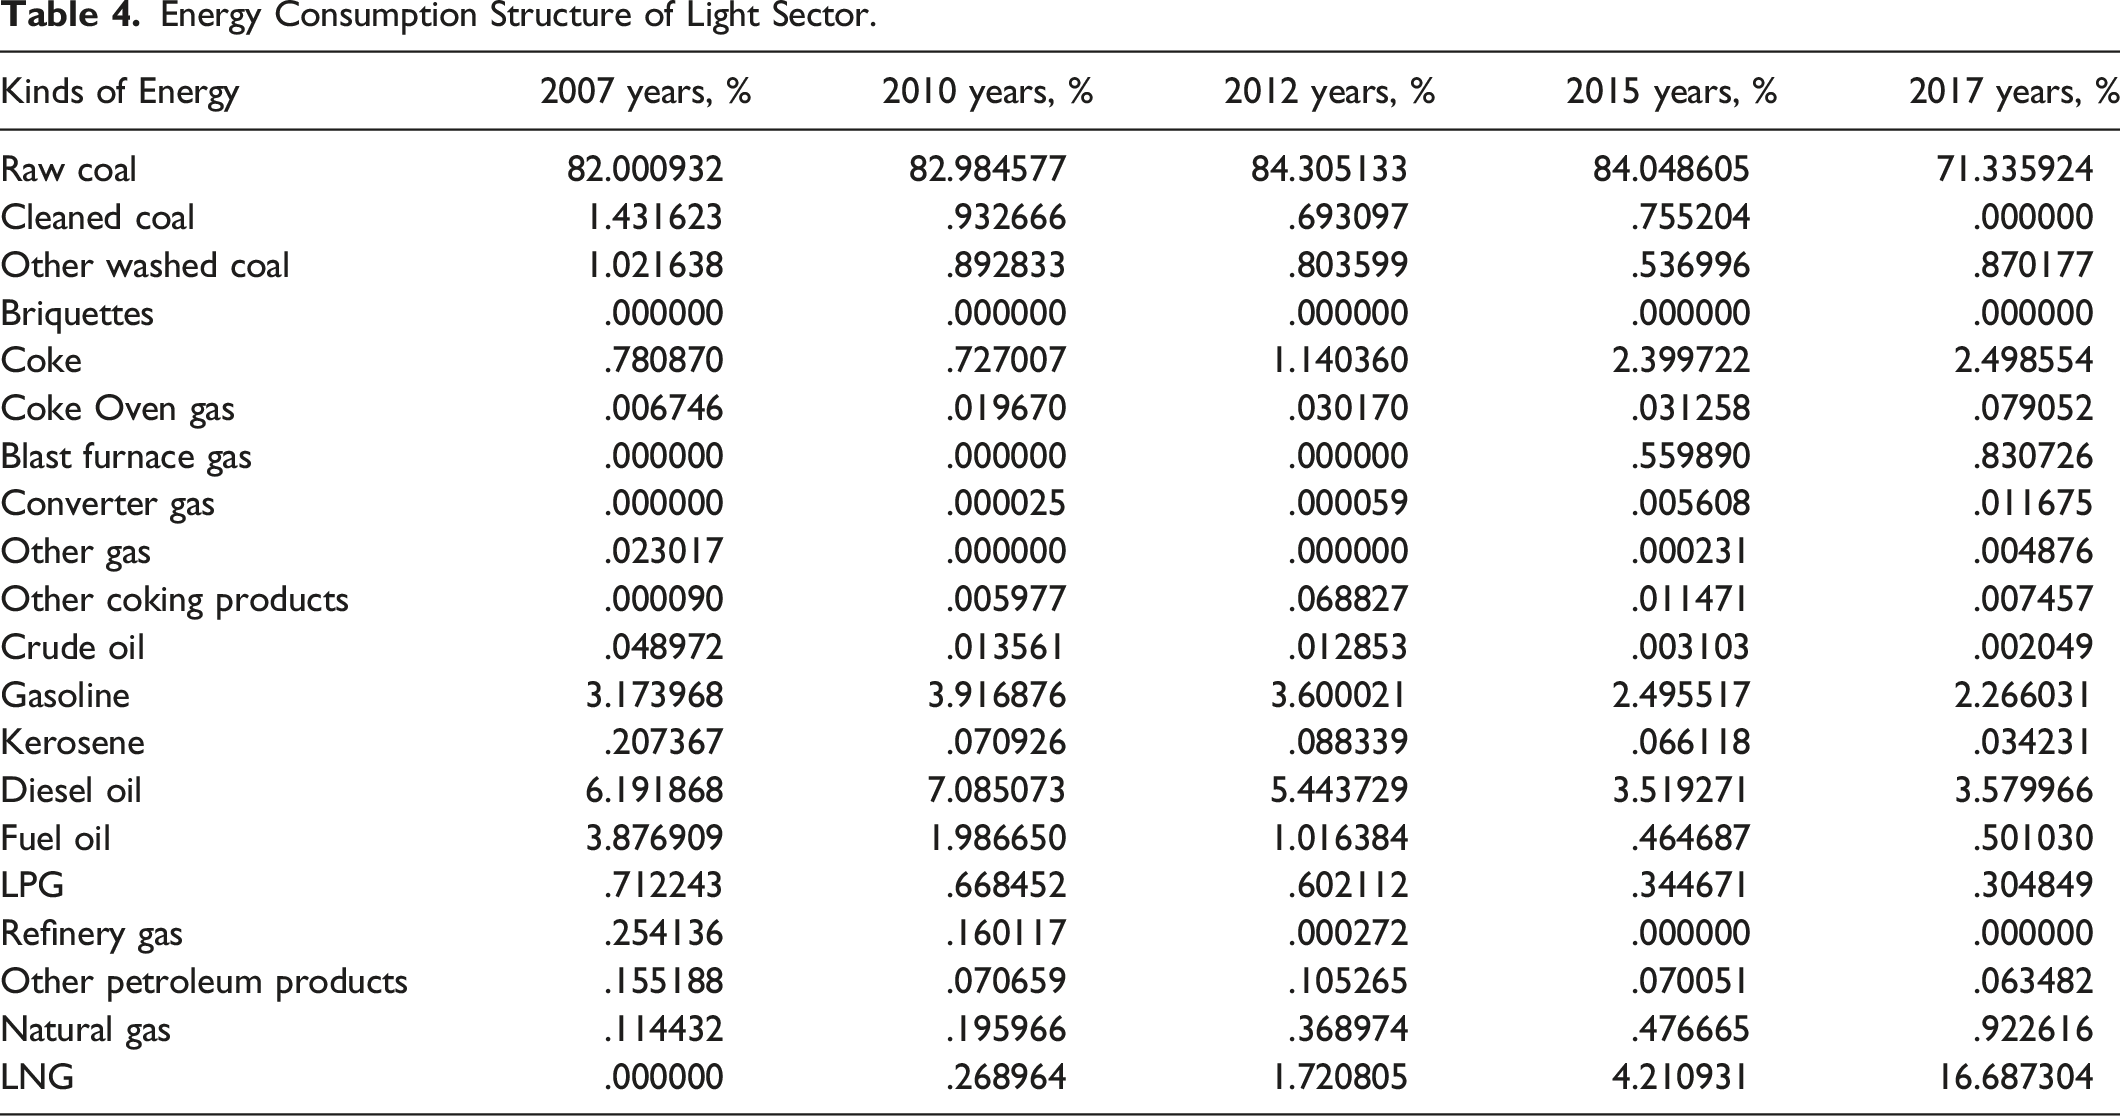
By analyzing Table 4 from the perspective of the energy supply side of the light sector, it can be said that the proportion of the utilization of high-carbon energy sources such as washed coal, raw coal, oil, and diesel is trending downward. The balance of the utilization of low-carbon energy sources such as NGAS and liquefied NGAS displays an upward trend. This clarifies that the change in energy use structure in Table 4 has an emission reduction effect on the growth of energy CO2e of the light sector. The emission reduction effect is due to the optimization of the energy use structure on the supply side of the light sector. This energy use structure is optimized by enhancing the proportion of the low-carbon energy use structure and reducing that of the high-carbon energy use structure. Regarding the effect of the energy structure, the reduction results of the light sector further illustrate that the light sector is prioritized as its thermal power energy consumption structure is more reasonable, but there is still progress space. Of course, it should be noted that within the research range from 2007 to 2017, the energy structure effect from 2007 to 2012 did not play a role in emission reduction, which can also be explained. According to Table 4, from 2007 to 2012, the proportion of raw coal and other high-carbon energy consumption did not decline but increased slowly.
Energy Intensity Effect Analysis
According to the above models and data, the energy intensity coefficient of China’s light sector from 2007 to 2017 is determined and shown in Figure 5 (unit: 10,000 yuan/standard coal). Energy intensity coefficient of the light sector.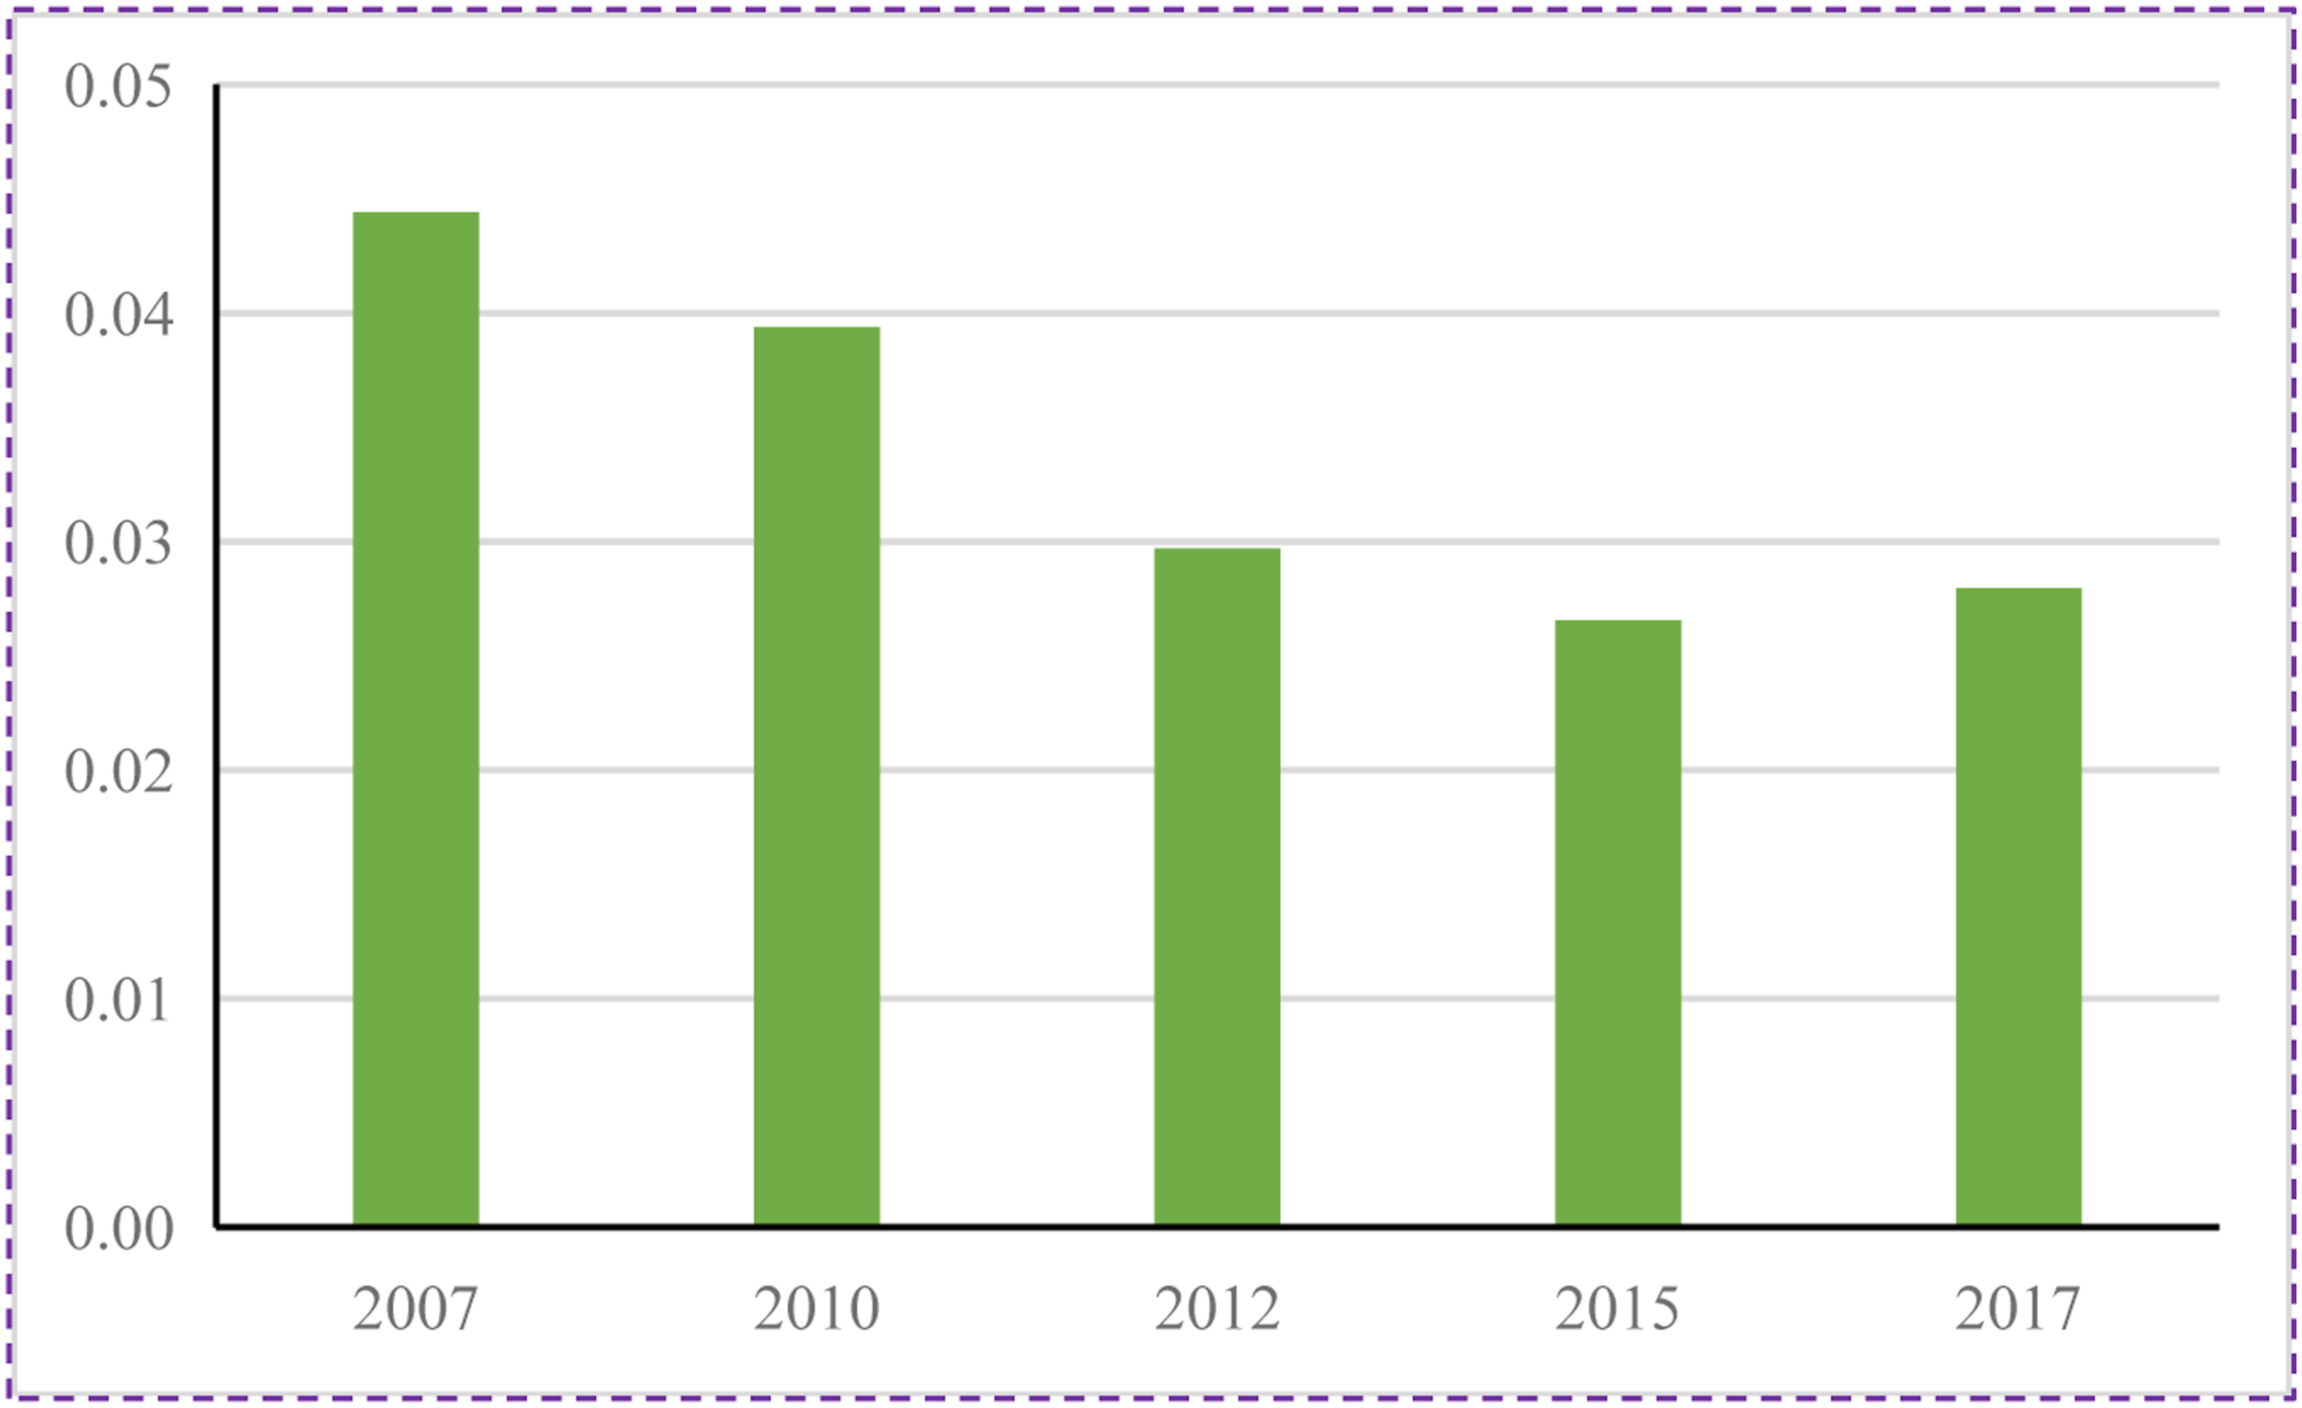
Through an analysis of Figure 5, the energy intensity coefficient of the light sector can be determined to be declining in all the time intervals, except 2015–2017. This explains that the energy intensity effect has been reducing the energy CO2e of China’s light sector in the other time intervals, except 2015–2017. At the same time, the energy consumption intensity coefficient can also be determined to have reduced the most from 2010 to 2012 and decreased the least from 2012 to 2015. This process led to the main emission reduction effect of the energy consumption intensity effect during 2010–2012 and the feebler emission reduction influencing the energy utilization intensity effect during 2012–2015. In light of the foregoing outcomes, the reduction of the energy intensity coefficient can be concluded to be the cause for the energy intensity effect playing a significant role in dipping the growth of energy CO2e of the light sector. The more influential the decline of the energy intensity coefficient is, the greater the emission reduction effect will be. This further shows that reducing the energy intensity and improving energy efficiency are important power points for CO2e reduction in the light sector. China’s economic growth has turned to a stage of high-quality development; however, the rigid demand for energy consumption for economic growth determines that China’s CO2e will keep growing. Only by exerting the role of reducing factors and inhibiting the increasing factors can the total CO2e be effectively reduced in the future.
Conclusion and Policy Implications
Based on this, this paper uses the energy consumption method, input-output method, and structural decomposition model to study the energy CO2e emission and structural emission reduction of China’s light sector from 2007 to 2017. This paper draws three main conclusions. First, China’s light sector energy CO2e maintained a slow-growth trend from 2007 to 2017, and the CO2e from high-carbon sources, such as raw coal and diesel, are still the main component of the light sector CO2e. Second, in the research range, energy intensity effect, energy structure effect, and the structure effect of China’s light sector energy CO2e reduction affect emissions growth as the light energy utilization technology upgrade, light sector supply-side energy consumption structure optimization, and response structure effect of common cause generalized technical progress rate optimization. Third, within the research interval, the final demand effect promotes the growth of light sector CO2e by expanding the demand for light sector in the national economy.
Based on the above conclusions, the following five important policy suggestions can be put forward. (1) Since the current energy carbon emission structure of the light sector is still dominated by maximum energy-related CO2e, such as coke and uncooked coal, Chinese policymakers should steadily endorse the light sector energy-related CO2e control and zero emission strategies in the future. (2) They should continue to encourage the maximization of the energy consumption structure on the supply side of the light sector; decrease the use of maximum-carbon energy, for instance, coke and uncooked coal; and raise the utilization of less CO2e-related energy sources, such as NGAS. At the same time, starting from the optimization of the energy structure of the light sector and accelerating the transformation of the energy consumption of the light sector, it is necessary to improve the energy price system, promote the improvement of the market competitiveness of clean energy and renewable energy with the help of fiscal policies such as energy tax, and accelerate the innovation of renewable energy utilization technology. (3) As the input structure effect and energy intensity effect of generalized technological development in the minimization of the light sector have a reduction effect on CO2e in the light sector, Chinese policymakers should actively encourage technological innovation in the light sector and optimize energy efficiency. Moreover, they should promote the growth of green productivity, reduce CO2e through technological innovation, and apply information and intelligence in the manufacturing process of light industries, to improve the added value of light sector products. (4) The expansion of the industrial system’s demand for the light sector is the essential factor that grows the light sector’s energy-linked CO2e. Thus, Chinese policymakers should aggressively enhance and wisely regulate the demand for the numerous industries of the light sector, especially the sectors with large contributions to circumvent the waste of natural resources caused by the extreme expansion of the light sector. (5) The light sector environmental regulation system should be improved with the light sector green development policy. The green development and low-carbon transformation of the light sector are always inseparable from the support and guidance of policies and measures, so it is particularly important to formulate green development policies for the light sector and further improve the environmental regulation system of the light sector.
The limitations of the research are mainly reflected in two aspects: (1) This paper considers only the direct CO2e from fossil energy consumption in the light sector and does not account for the indirect CO2e from the consumption of electric energy. Therefore, when studying the CO2e and emission reduction of China’s light sector, the implied CO2e of electricity consumption needs to be included. (2) This research is based on the analysis of the driving factors of light sector CO2e in a non-open environment. It fails to consider the impact of import and export factors on the change of light sector CO2e. Therefore, future research needs to consider both import and export factors.
Footnotes
Declaration of Conflicting Interests
The author(s) declared no potential conflicts of interest with respect to the research, authorship, and/or publication of this article.
Funding
The author(s) disclosed receipt of the following financial support for the research, authorship, and/or publication of this article: This work was supported by the National Social Science Found of China [grant number: 22CJY060].