
Abstract
The sharp increase in the number of experimental studies evaluating development programs raises the need for accurate intraclass correlations (ICC) to conduct power calculations so that researchers can design studies to detect meaningful effects with sufficient statistical power. The intraclass correlation is an important parameter for determining the statistical power of cluster-randomized trials. The parameter is rarely available to researchers planning a study until after the design is set and data are already collected. This paper takes an important step towards helping researchers working in sub-Saharan Africa to accurately estimate appropriate sample sizes for their clustered RCTs. The study draws from rich data sets in Kenya, Malawi, Zambia, and Zimbabwe. We present ICCs for a wide range of domains common for development research. Our results suggest that ICCs for commonly studied indicators in sub-Saharan Africa are lower than is often assumed in power calculations. ICC values are especially low for indicators associated with child nutrition and food security, suggesting that cluster-RCTs might be a viable design even when faced with limited budgets because sample size requirements are not much different from an individual random assignment design.
Introduction
Policymakers and donors increasingly rely on evidence from randomized controlled trials (RCTs) to make decisions about funding and scaling programs that aim to reduce poverty in low- and middle-income countries, for example, in sub-Saharan Africa. The increased demand for RCTs and their use for allocating scarce resources and informing program design highlight the importance of properly designing each study. The high costs associated with implementing many RCTs only further support the need to design them well. A well-designed study will have a sample size sufficiently large to detect meaningful effects, assessed by a power calculation with credible assumptions about the expected effect size, intraclass correlation, attrition rate and other key parameters.
Unfortunately, many evaluations lack a sufficient sample size to appropriately power their study, suggesting the need for power calculations with more credible assumptions. Button et al (2013), Ioannidis and Doucouliagos (2013), Isaakidis and Ioannidis (2003), and Ioannidis et al. (2017) argue that small sample sizes incapable of detecting desired impacts cast doubt on much of the economics literature. One way to account for this challenge is by having more information on intracluster correlations before the start of the study. However, researchers must often design a study without the benefit of existing data on the study sample, limiting their ability to determine intracluster correlations based on existing data. For example, a study may include randomization without baseline data. Alternatively, program implementation may start immediately upon completion of baseline data collection, preventing researchers to use intracluster correlations from the baseline for power calculations.
So what sample size is appropriate to detect meaningful effects for a randomized controlled trial? This usually depends on the unit of assignment. Often RCTs assign groups of units instead of individual units to the treatment or control condition, which is defined as a cluster-randomized design. Studies with cluster-randomized designs should account for the clustering by using cluster-robust standard errors that account for a lack of independence across observations (Duflo et al, 2007, Cohen, 1977, Abadie et al., 2022, Angrist & Jörn-Steffenm, 2010, Wooldridge & Jeffrey, 2010). For these cluster-randomized designs, determining the optimal sample size requires information about the intraclass correlation coefficient (ICC). The ICC is a statistic defined as the amount of correlation between units within and across clusters. Unfortunately, ICCs are rarely known prior to collecting data for a study since they can vary by domain, geography, and size of the cluster, creating a challenge for designing a cluster RCT with a sufficient sample size.
There are a limited number of studies that provide the value of ICCs in developing countries and none that provide a collection of ICCs across domains. Three studies in particular provide two-level ICC values for children’s learning outcomes when children are clustered in schools (Spybrook & Kelcey, 2016; Kelcey et al., 2016, Kelcey et al., 2017). These studies find that learning outcomes are highly clustered within schools but that the degree of clustering varies widely across countries. They provide tools to researchers to address the existing evidence that schools are heterogeneous and interventions have different effects in each school (Heneveld & Craig, 1996). Geyer et al. (2016) provide a similar set of design parameters, but their information is limited to agricultural outcomes in Mozambique. Zopluoglu (2012) estimates and compares ICCs across different countries and finds substantial differences, but this study focuses primarily on OECD countries.
Most research on ICCs focuses on the United States. Hedges and Hedberg (2007) provide ICC values for reading and mathematics outcomes at each K-12 grade level in the United States. They also show heterogeneity by state in a follow-up study (Hedges & Hedberg, 2013). They present the ICCs for educational outcomes under various contexts to help provide a guide for future studies. Similarly, Jacob et al. (2010) provide ICC values from education outcomes as well as a limited number of health outcomes. Westine et al. (2013) further develop the evidence for ICCs in the U.S. context, reporting ICCs for different subjects and different grade levels within the state of Texas. Gulliford et al. (1999) use a large-scale community survey to provide a database of ICC values for various health outcomes of English adults. However, the ICCs from studies in the United States are less relevant to determine the sample size of cluster-RCTs in sub-Saharan Africa leaving researchers guessing at what value to use for an ICC when designing their study.
This paper takes an important step towards helping researchers to accurately estimate appropriate sample sizes for their clustered RCTs by presenting ICCs for a wide range of domains common for development research in sub-Saharan Africa. Specifically, we present ICCs for frequently used development outcomes in eastern and southern Africa for labor constrained and very poor rural households, a common target population for programs aimed at reducing poverty in sub-Saharan Africa, such as cash transfer programs. We compare and contrast ICCs for several indicators within each domain, enabling researchers to see how the ICC might vary by the measure they choose for a particular domain. We also compare and contrast ICCs for several countries to understand the stability of an ICC across different political and geographic contexts, yet within the same region of the world. Finally, we present design effects and examine how much ICCs change after adjusting for covariates.
We are able to conduct this study because of the rare opportunity to access multiple datasets that share several important characteristics necessary for comparing ICCs including a similar target population of the sample, large sample size, similar time frame, documentation of clustered levels, common domains across studies and similar measures of indicators. We report ICCs for an array of common poverty and economic development indicators and domains including nutrition, health, education, food security, agriculture, household conditions, and economic wellbeing. The findings in this paper will enable researchers to design more accurate studies that produce higher quality evidence so that policymakers can make better decisions about how to allocate scarce resources to reduce poverty, ultimately benefitting the recipients of development programs.
Intraclass Correlation Coefficients
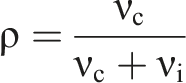
The ICC helps to determine the minimum detectable effect for a study, with larger ICCs making it more challenging to detect effects, all else equal. The design effect to adjust the sample size in a cluster-level randomization relative to an individual-level randomization is characterized as in equation (1)

In a cluster-randomized trial, the best practice is to cluster standard errors at the unit of randomization (Abadie et al., 2022). Wards or communities of villages were the unit of randomization for the cash transfer programs evaluated using this study’s data and are common administrative units in sub-Saharan Africa. Often, the next larger unit in sub-Saharan Africa is the district. Typically, there are too few districts in a country to achieve sufficient statistical power with district-level random assignment, unless experiments span the entire population of a large country. The next smaller unit in most sub-Sahara African datasets after community or Ward is typically the village. It’s possible to use villages as the unit of random assignment, but they often vary in size, with some being too small to contain a sufficient number of households. Choosing villages as the unit of random assignments may also increase the likelihood of contamination between treatment and control groups since villages can flow into each other. For these reasons, most cluster-randomized controlled trials in Eastern and Southern Africa randomly assign programs at the ward or community level.
This paper presents ICCs with and without covariate adjustment. Following Hedges & Hedberg (2007), we use the mixed command in Stata for linear model analysis to calculate ICCs with and without covariate adjustment.
We also calculated covariate-adjusted ICC estimates because adding covariates can increase statistical power substantially. Controlling for covariates could thus justify using lower ICCs in study planning [if the difference with ICCs without adjustment is substantial (Shoukri et al., 2013, Murray & Blitstein, 2003; McKenzie, 2012)]. To calculate covariate-adjusted ICC estimates, we selected a standard set of covariates regularly applied in cash transfer studies: household size and the age, gender, and primary school completion status of the survey respondent. While other covariates might also be relevant for certain outcomes or in certain settings, these four covariates apply to all outcomes in this study.
Description of Data
Characteristics of the cash transfer programs and data sources.
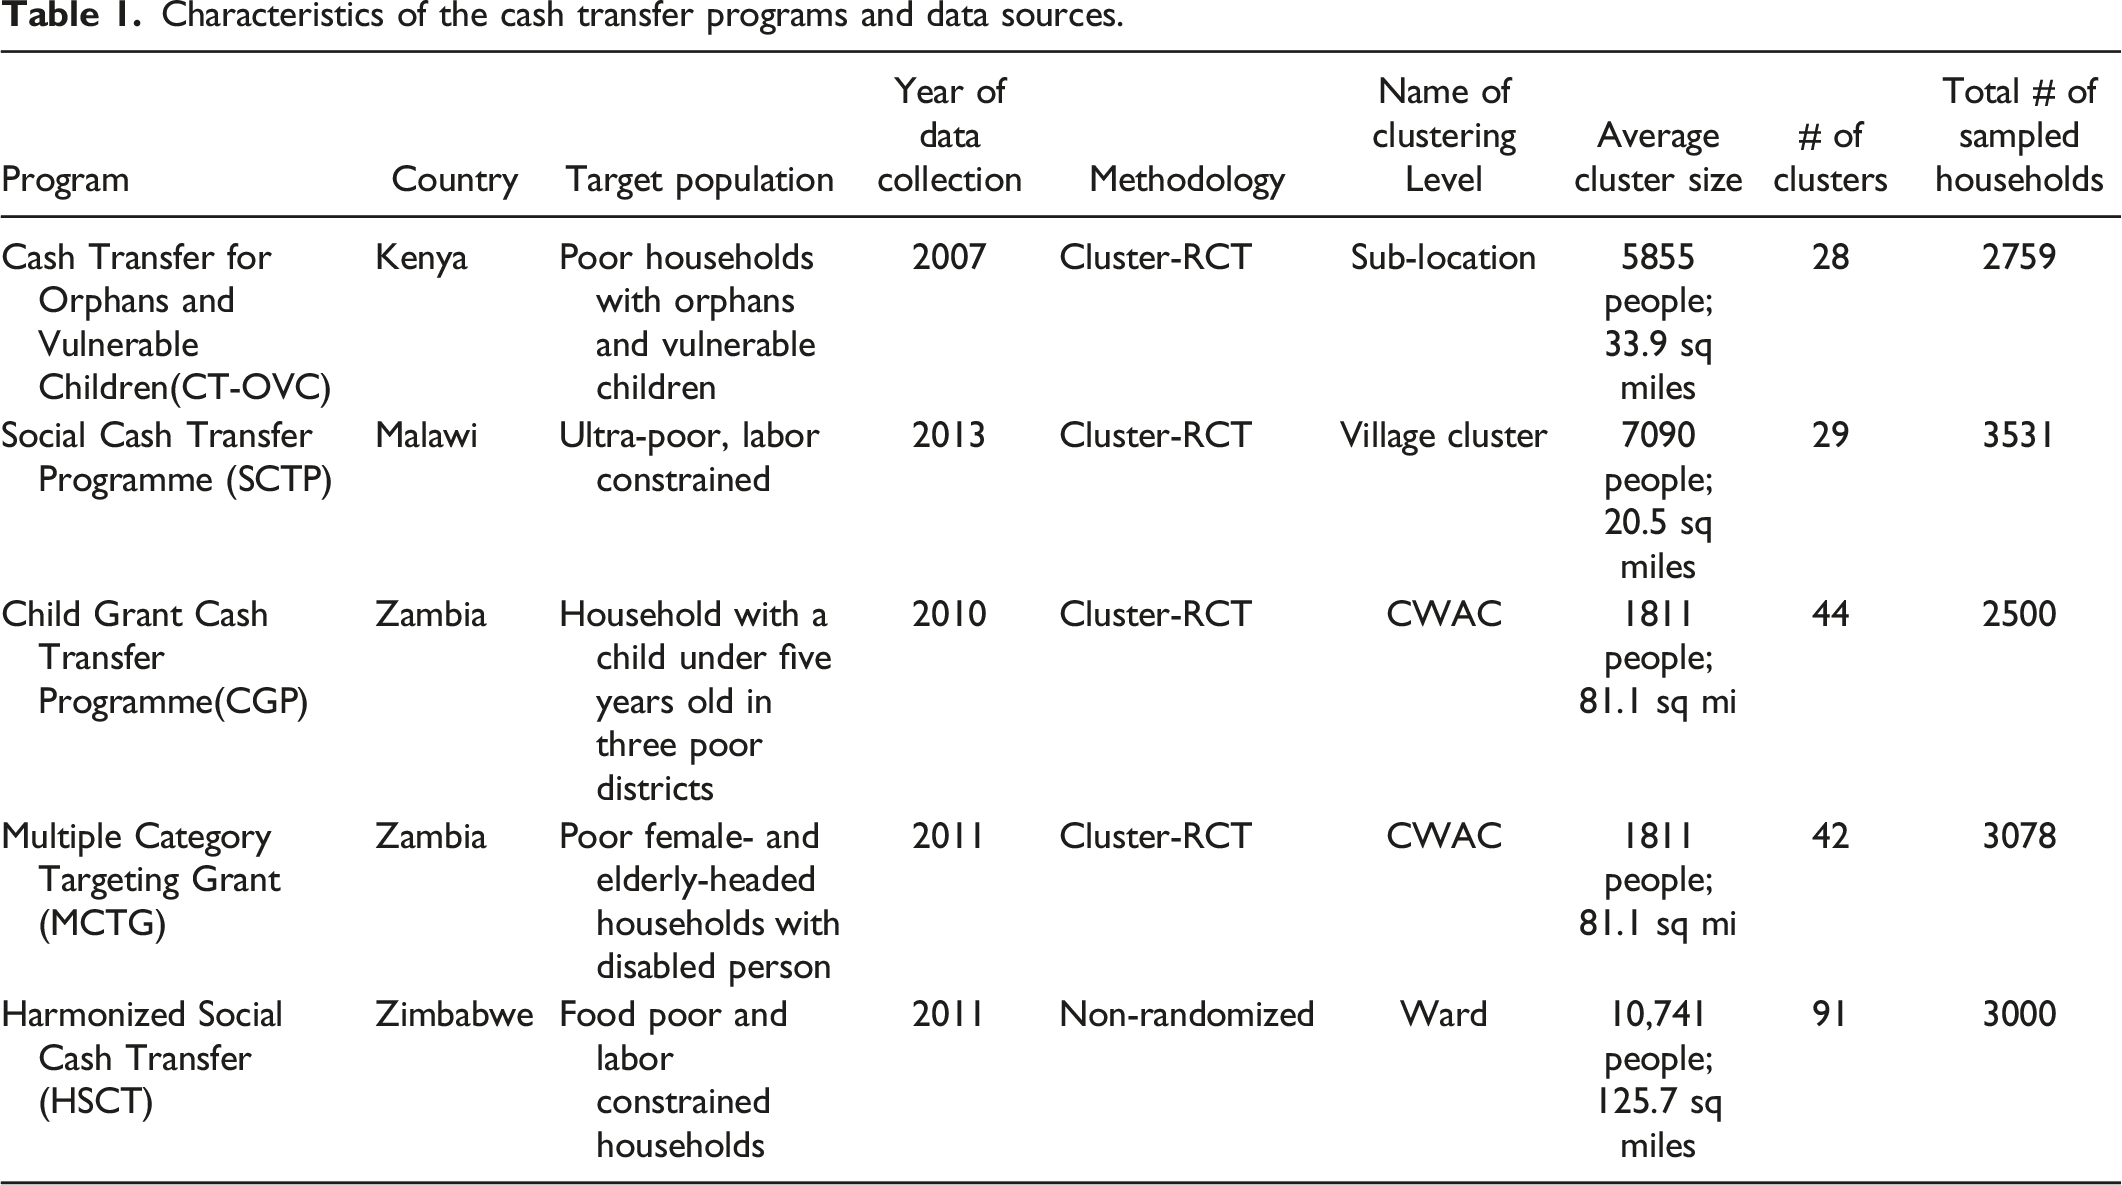
Table 1 summarizes the characteristics of each of the five evaluations whose data were used for this study. We use all households eligible for the program that were randomly selected as part of the treatment or control groups of each evaluation to calculate the ICCs. We use baseline data for the purpose of this study to ensure that ICCs are independent of the cash transfer program.
Several differences in the targeting strategy need to be considered in the interpretation of the results. The targeting strategy differed for each sample on the basis of the objectives of the cash transfer program and the eligibility criteria of households. All households were, in part, selected on the basis of poverty levels: households from the Zambia CGP program come from three poor districts targeted by the program, whereas evaluation samples of the other four programs included households below context-specific poverty lines. In addition, programs included the following secondary criteria: the Kenya CT-OVC program targeted households with orphan and vulnerable children; the Malawi SCTP and Zimbabwe HSCT targeted labor constrained households; the Zambia CGP program targeted households with children under five; and the Zambia MCTG program included female- and elderly-headed households and households with disabled members. Within each household in Kenya, Malawi and Zambia and Zimbabwe, enumerators primarily collected data from the primary caregiver (typically female).
We present ICCs at the community levels that are most comparable across these four countries. These geographic levels are sub-locations (mtaa mdogo) in Kenya, village clusters in Malawi, community welfare assistance committees (CWACs) in Zambia, and wards in Zimbabwe. Each of the studies used a similar sampling approach in which the total sample was divided evenly across clusters.
Indicators
This paper presents indicators from ten domains measured at either the household or individual level. Indicators at the household level focus on economic domains such as consumption, agricultural productivity, and livestock ownership, or poverty domains including food security, poverty level, and household conditions. Individual-level indicators focus primarily on children and include nutrition, education, and material needs domains. Next, we describe how we construct indicators for analysis, and any differences in construction across datasets.
Household Level Indicators
Consumption indicators are calculated as total reported consumption within the household. We examine total consumption, consumption on health and hygiene (such as medicine, hospital fees, toiletries, cleaning expenses, etc.), education expenditures (tuition fees, transportation, uniforms, school meals, etc.), food consumption (all food and drink), food consumption excluding alcohol, and total consumption per capita. Consumption indicators vary slightly across countries due to context-specific items that are included for one country but not another, such as the consumption of regionally specific food.
The Zambian and Malawian samples include indicators that measure the total value of agricultural production, the value of food consumed from own production, and agricultural productivity, which is measured as the value of agricultural production divided by the amount of land used for farming.
We construct two indexes of household wealth using principal component factor analysis: one of household goods (whether the household owns a stove, television, radio, bed, etc.) and one of agricultural productive assets (including mower, plough, shovel, axe, etc.). We calculate ICCs of livestock ownership using the number of cattle, chicken, donkeys, goats, and pigs owned by the household.
Indicators of housing conditions include binary variables for whether the household has access to clean drinking water, plumbing, access to toilet facilities, a toilet on household premises, electricity, purchased roof materials, and purchased fuel for cooking and lighting.
We also include the Household Hunger Scale (HHS) and the Household Food Insecurity Access Scale (HFIAS) to measure food insecurity for Zambia and Zimbabwe samples. The HHS is measured using three questions on hunger experienced in the household, such as: “In the past four weeks, did you or any household member go to sleep hungry?” The scale is measured as the sum of responses “None”/“Sometimes”/“Often” coded as 0, 1, and 2. The HFIAS is the sum of responses to nine questions on food insecurity such as: “In the past month, have you worried that your household will not have enough food?” and “In the past month, have you eaten a smaller meal than you felt you needed?” (Ballard et al., 2011). Responses of “Never,” “Rarely,” “Sometimes,” “Often” are coded from 0 to 3.
Individual Level Domains
Child nutrition measures are calculated for a randomly selected child within each household between 0–2 and 0–5 years of age. Using WHO guidelines, we calculated height-for-age, weight-for-age, and weight-for-height z scores and created indicators for children that are stunted, wasted, and underweight (z < −2), and those that are severely stunted, wasted, and underweight (z < −3).
We included indicators on school enrollment for a randomly selected child within each household between 7–14 and 15–18 years of age. Enrollment indicators include a binary variable for current enrollment, the number of school days the child attended class in the past week, and a binary variable for whether the child attended class every school day in the past week.
Indicators of female fertility are based on questions asked to all women in the household. If there were multiple women in a household, we prioritized the response of the household head’s spouse, or the household head, if it is a female-headed household. If the household did not include a female household head or wife of household head, we selected a woman aged 18–30 years old at random; if none was available, we selected the response of a female household member aged 31–49 years old. We measured fertility indicators by including the age of first pregnancy, number of biological children, and the number of biological children currently living in the household.
Results and Discussion
In this section, we present the ICC values for indicators by domain and by country. In each case, we calculate the ICCs as described above. Our findings provide the key aspects of reporting ICCs (Campbell et al., 2004).We discuss the results in three ways: 1) Are the ICC values for an indicator consistent across countries? 2) Are the ICC values for a domain consistent across indicators? 3) What do the ICC values mean for the domain?
We examine the consistency of an indicator across countries to see if the ICC values are stable or if they vary across geographies in the region. We then look at the consistency of ICC values for indicators within a domain to see if there is variation by the type of measure within the domain because that could help determine which indicators are the most relevant to use for power calculations. For example, we report ICCs for stunting, wasting, and underweight indicators within the child nutrition domain. If the ICCs for these different indicators vary from each other, then a study investigating child nutrition will have to decide about which ICC to use for the power calculation. However, if the ICCs for these nutrition indicators are all similar, then the researcher can choose to conduct power calculations based on one of the indicators. Last, we present the ICC values for each indictor so that researchers will understand better how their study’s power will be affected by a clustered design if one estimates the impact on that indicator, with higher ICCs providing lower power to detect effects, all else equal. We present the findings separately for each domain. The tables in this section present the ICC for each study/country by indicator with a 95% confidence interval for each ICC below it. We also present the weighted mean ICC for the indicator in the last column. These results represent a conservative upper-bound on ICC values that an applied researcher can use in designing their study. For a research design that will include other explanatory variables, covariate adjustment of ICCs can justify using even lower ICCs in study planning (Murray & Blitstein, 2003; McKenzie, 2012) if the difference between adjusted and unadjusted ICCs is meaningful.
Child nutrition ICC values.
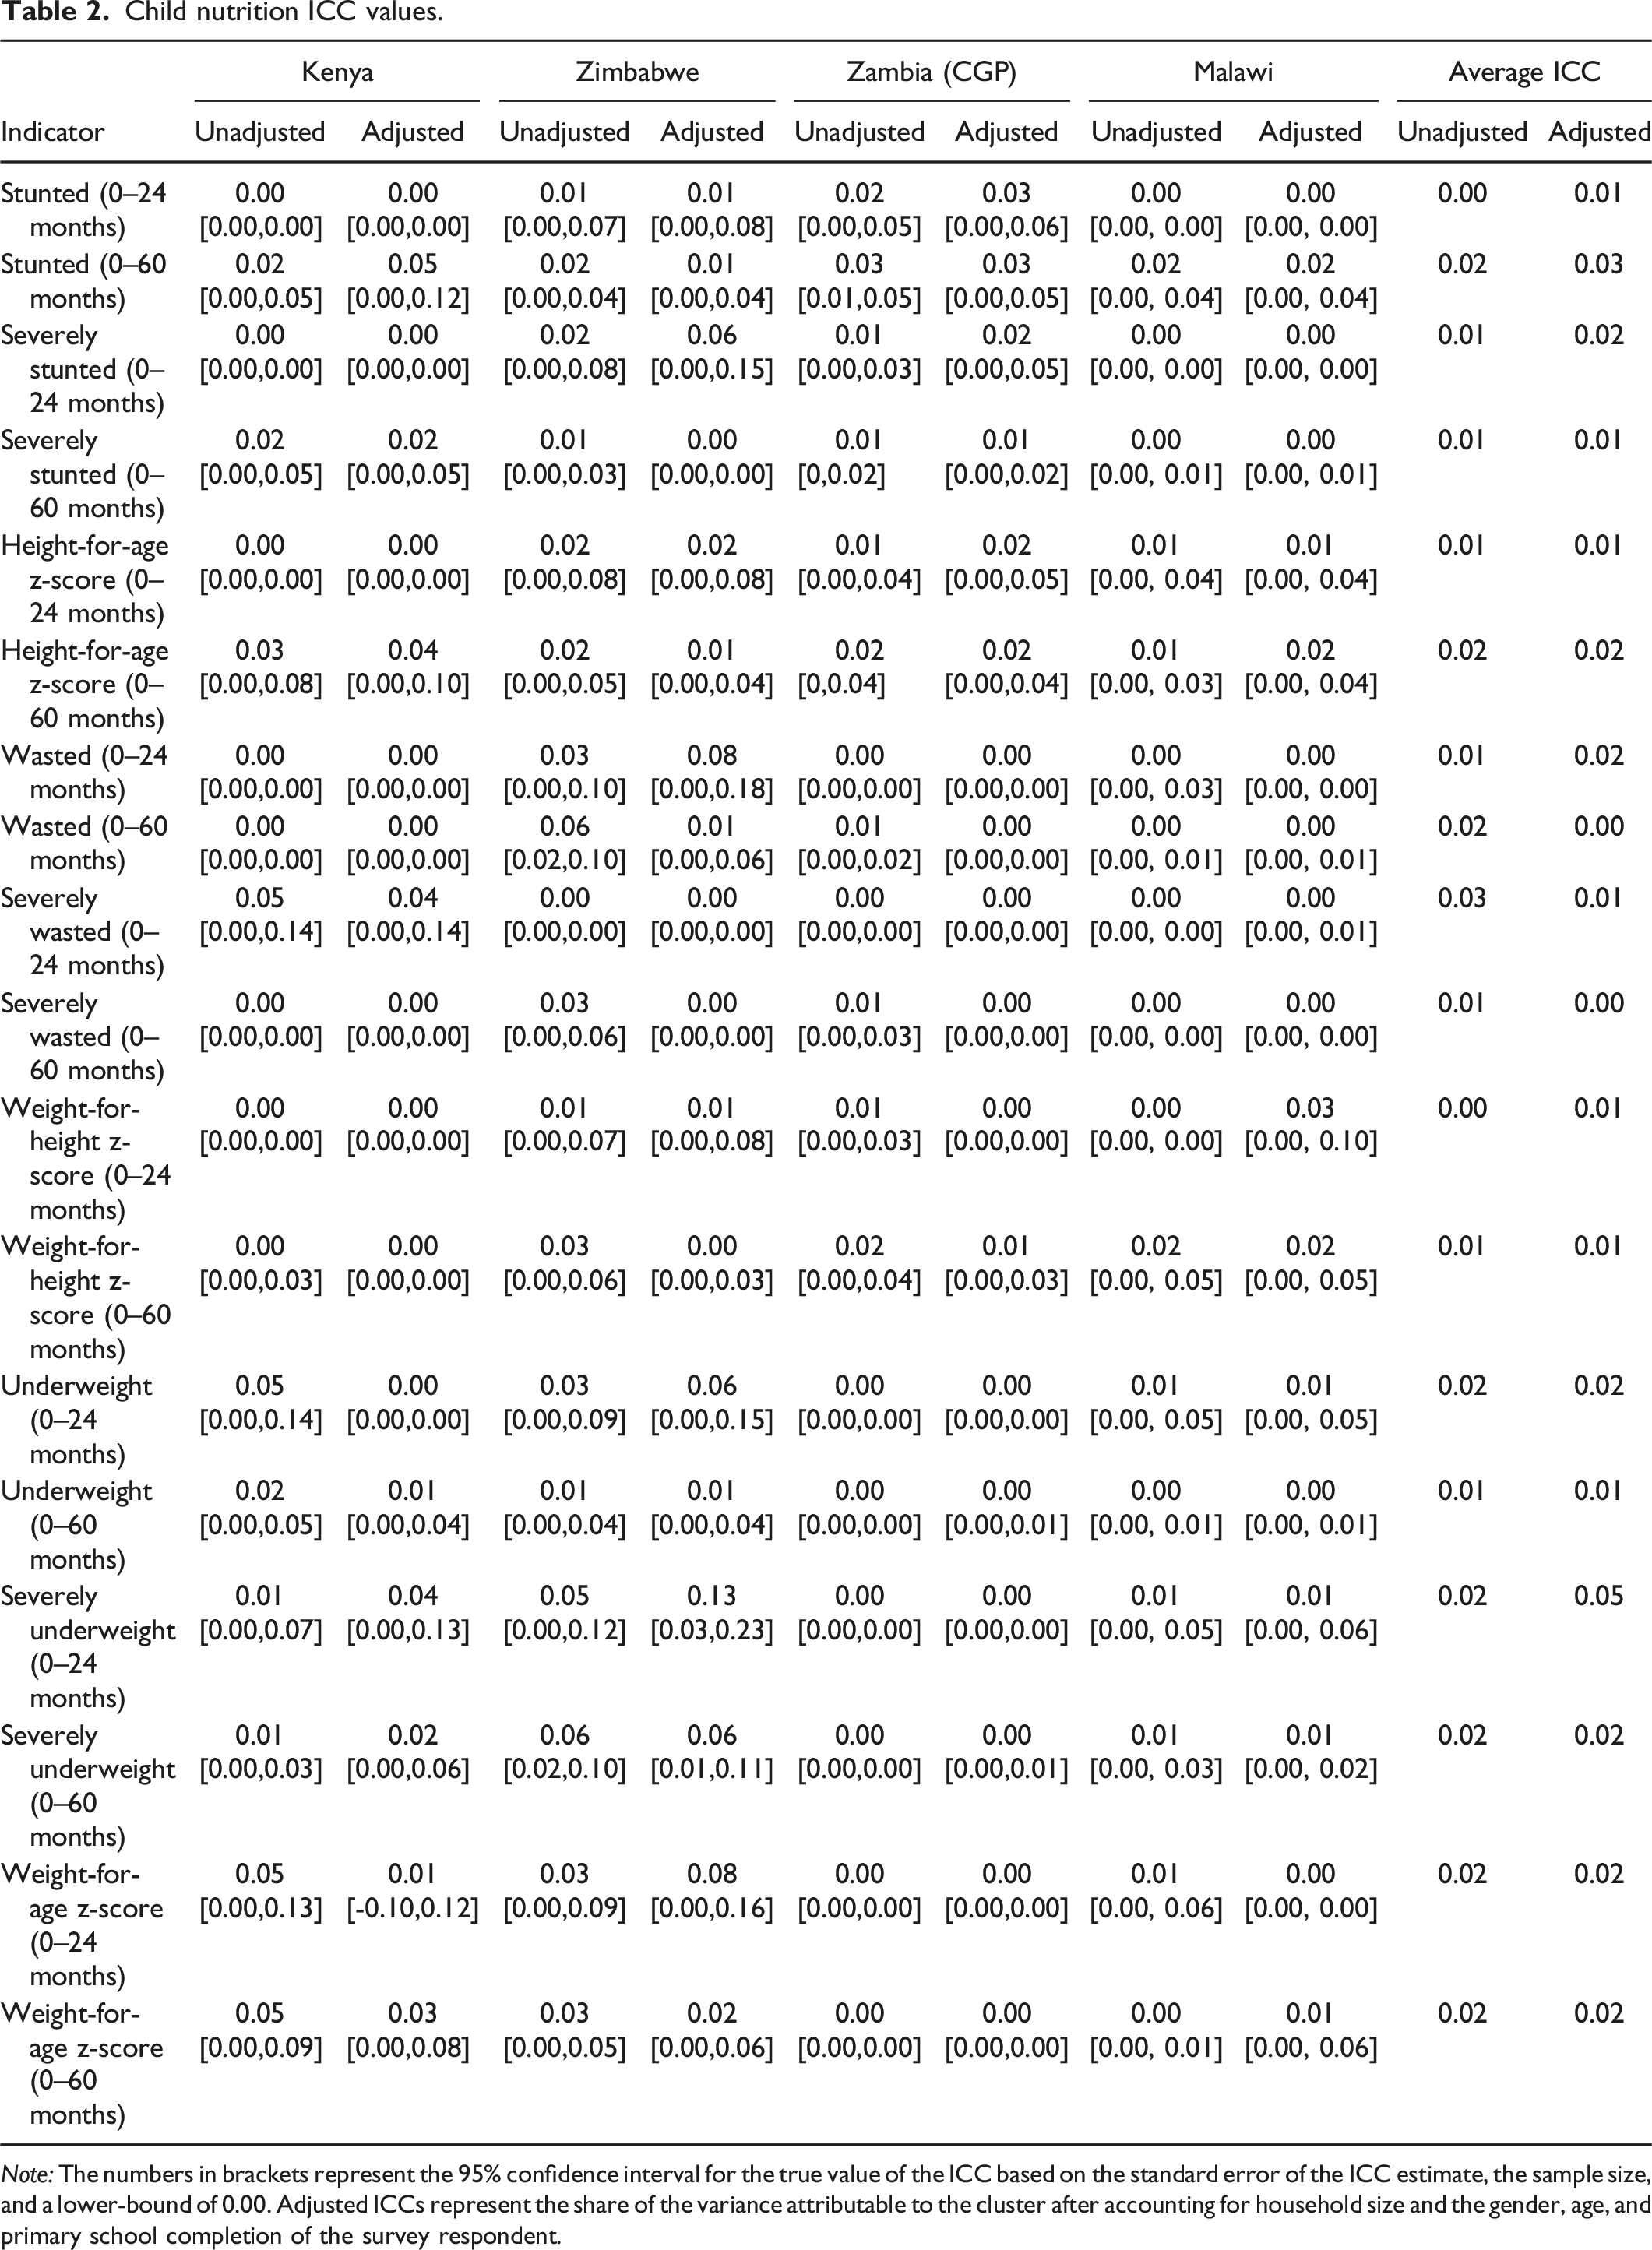
Note: The numbers in brackets represent the 95% confidence interval for the true value of the ICC based on the standard error of the ICC estimate, the sample size, and a lower-bound of 0.00. Adjusted ICCs represent the share of the variance attributable to the cluster after accounting for household size and the gender, age, and primary school completion of the survey respondent.
ICCs for child education indicators.
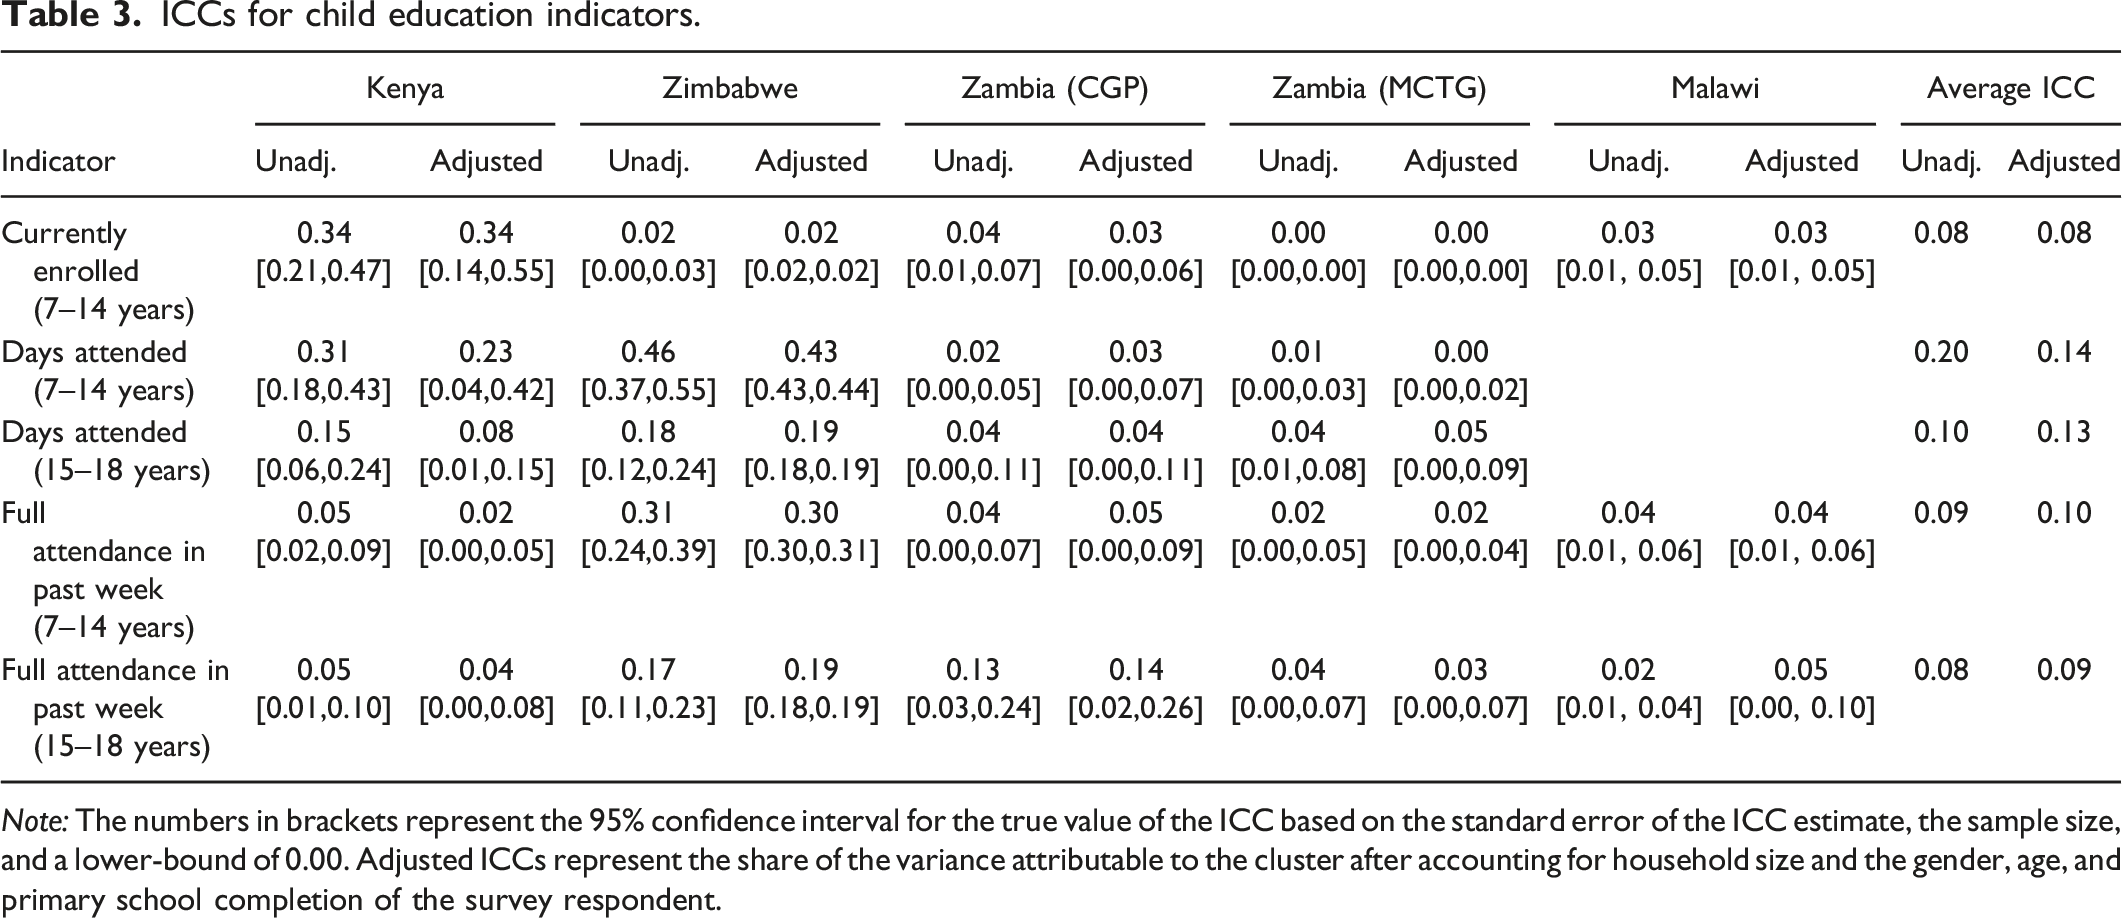
Note: The numbers in brackets represent the 95% confidence interval for the true value of the ICC based on the standard error of the ICC estimate, the sample size, and a lower-bound of 0.00. Adjusted ICCs represent the share of the variance attributable to the cluster after accounting for household size and the gender, age, and primary school completion of the survey respondent.
ICCs for fertility.
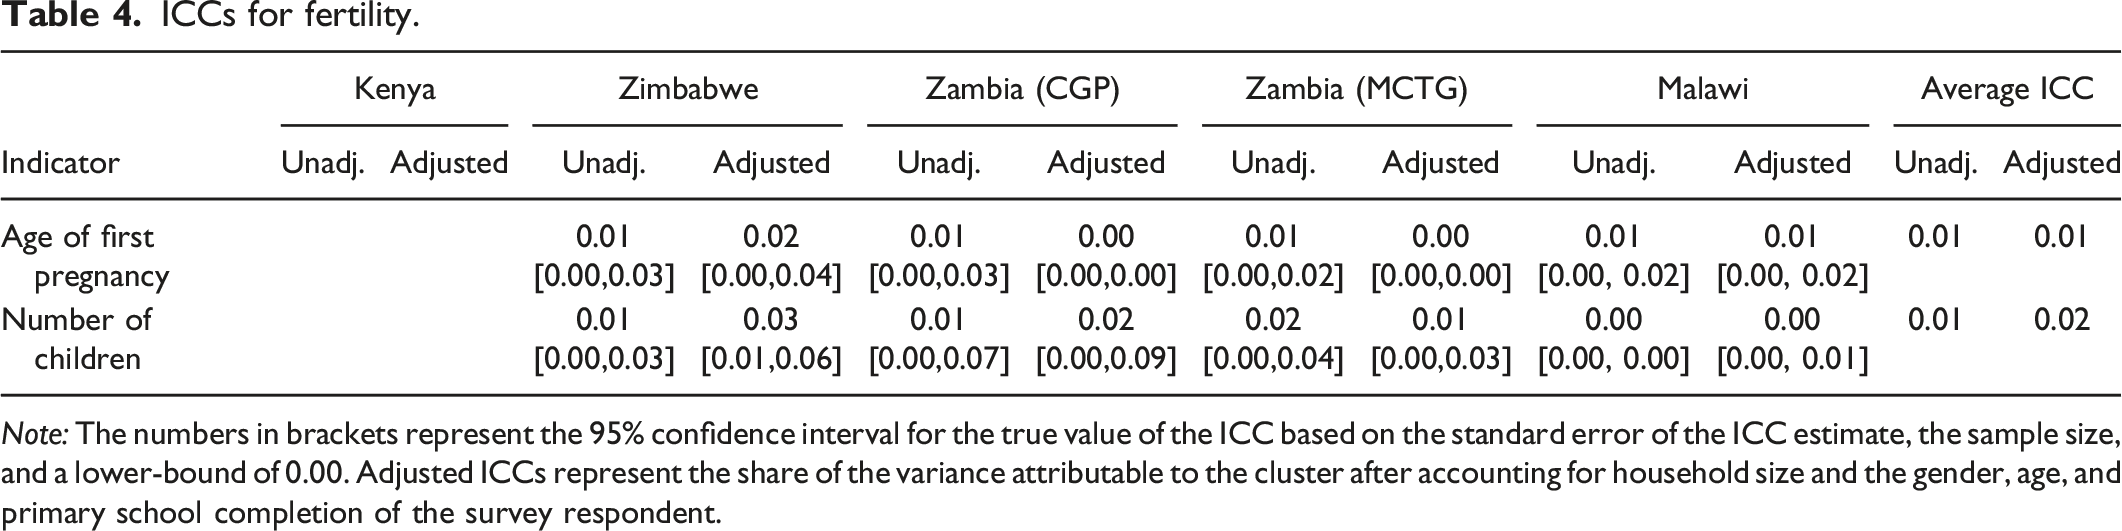
Note: The numbers in brackets represent the 95% confidence interval for the true value of the ICC based on the standard error of the ICC estimate, the sample size, and a lower-bound of 0.00. Adjusted ICCs represent the share of the variance attributable to the cluster after accounting for household size and the gender, age, and primary school completion of the survey respondent.
ICC values for household poverty and food security.
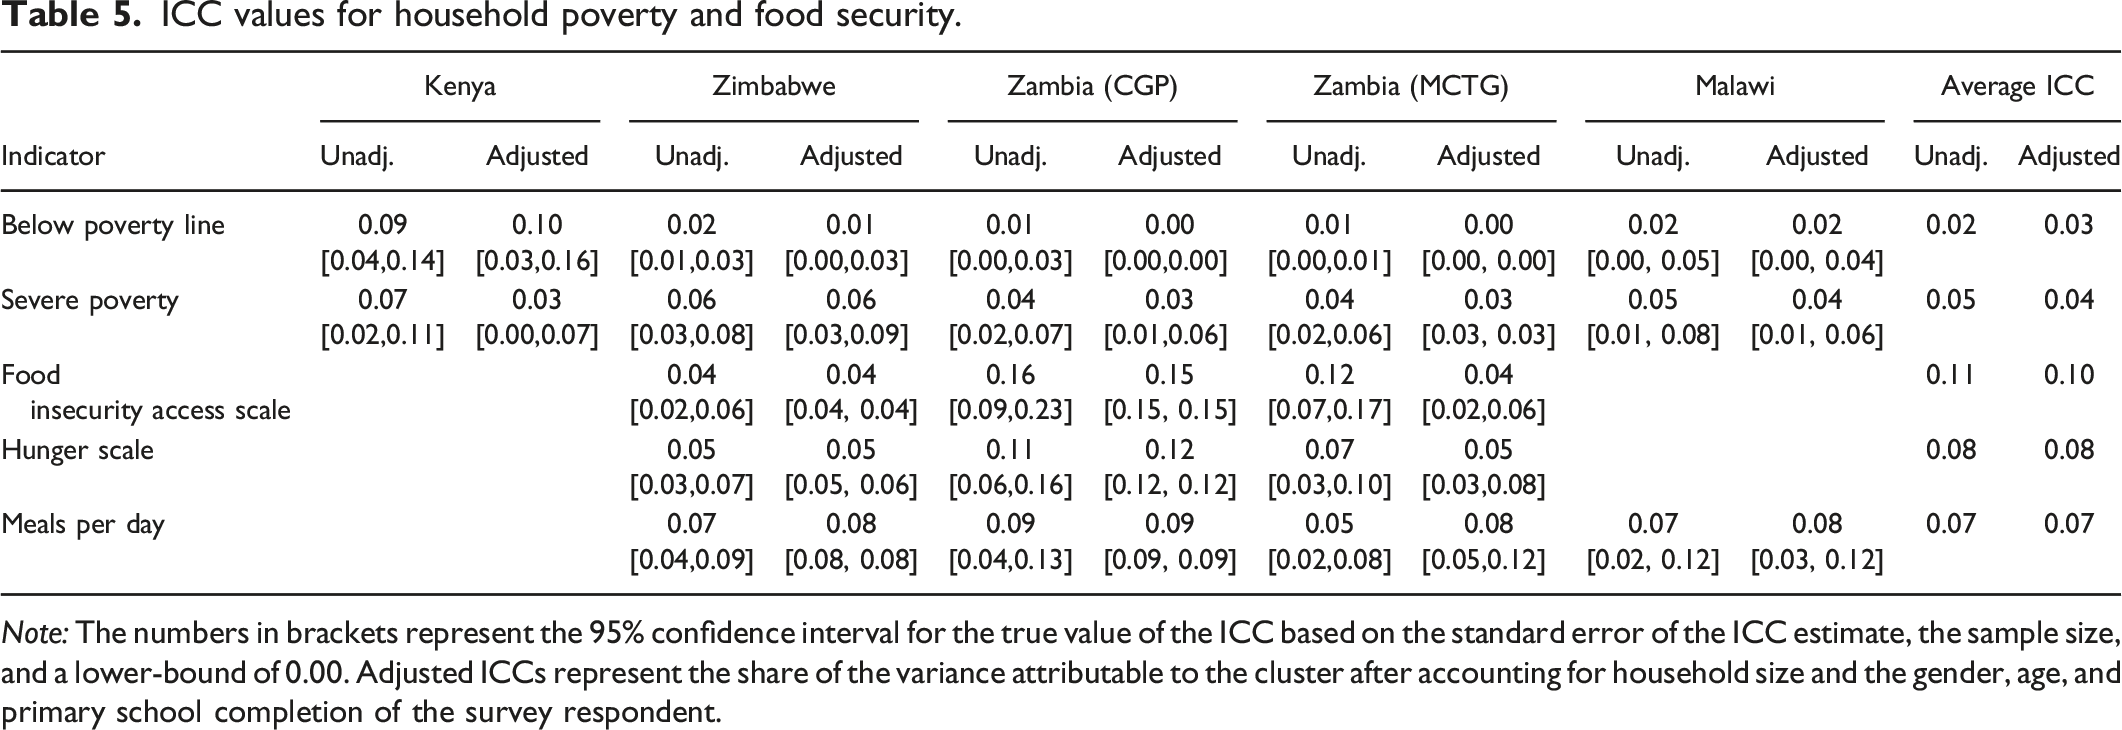
Note: The numbers in brackets represent the 95% confidence interval for the true value of the ICC based on the standard error of the ICC estimate, the sample size, and a lower-bound of 0.00. Adjusted ICCs represent the share of the variance attributable to the cluster after accounting for household size and the gender, age, and primary school completion of the survey respondent.
ICC values for livestock and agricultural assets.
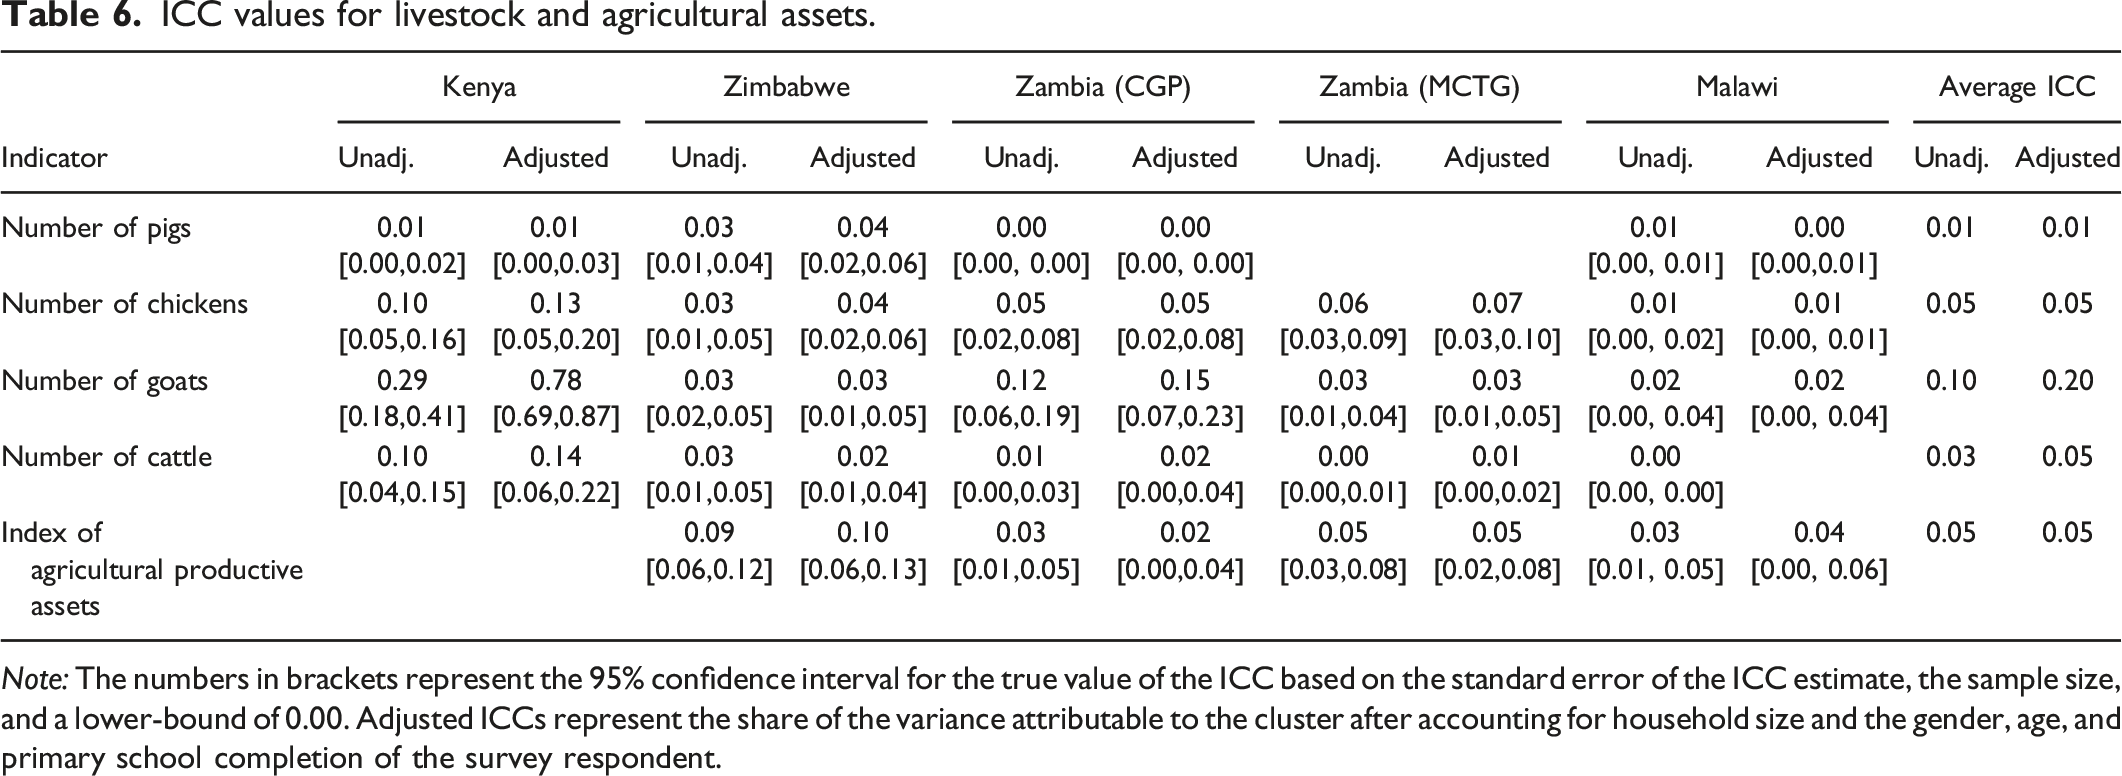
Note: The numbers in brackets represent the 95% confidence interval for the true value of the ICC based on the standard error of the ICC estimate, the sample size, and a lower-bound of 0.00. Adjusted ICCs represent the share of the variance attributable to the cluster after accounting for household size and the gender, age, and primary school completion of the survey respondent.
Agricultural production.
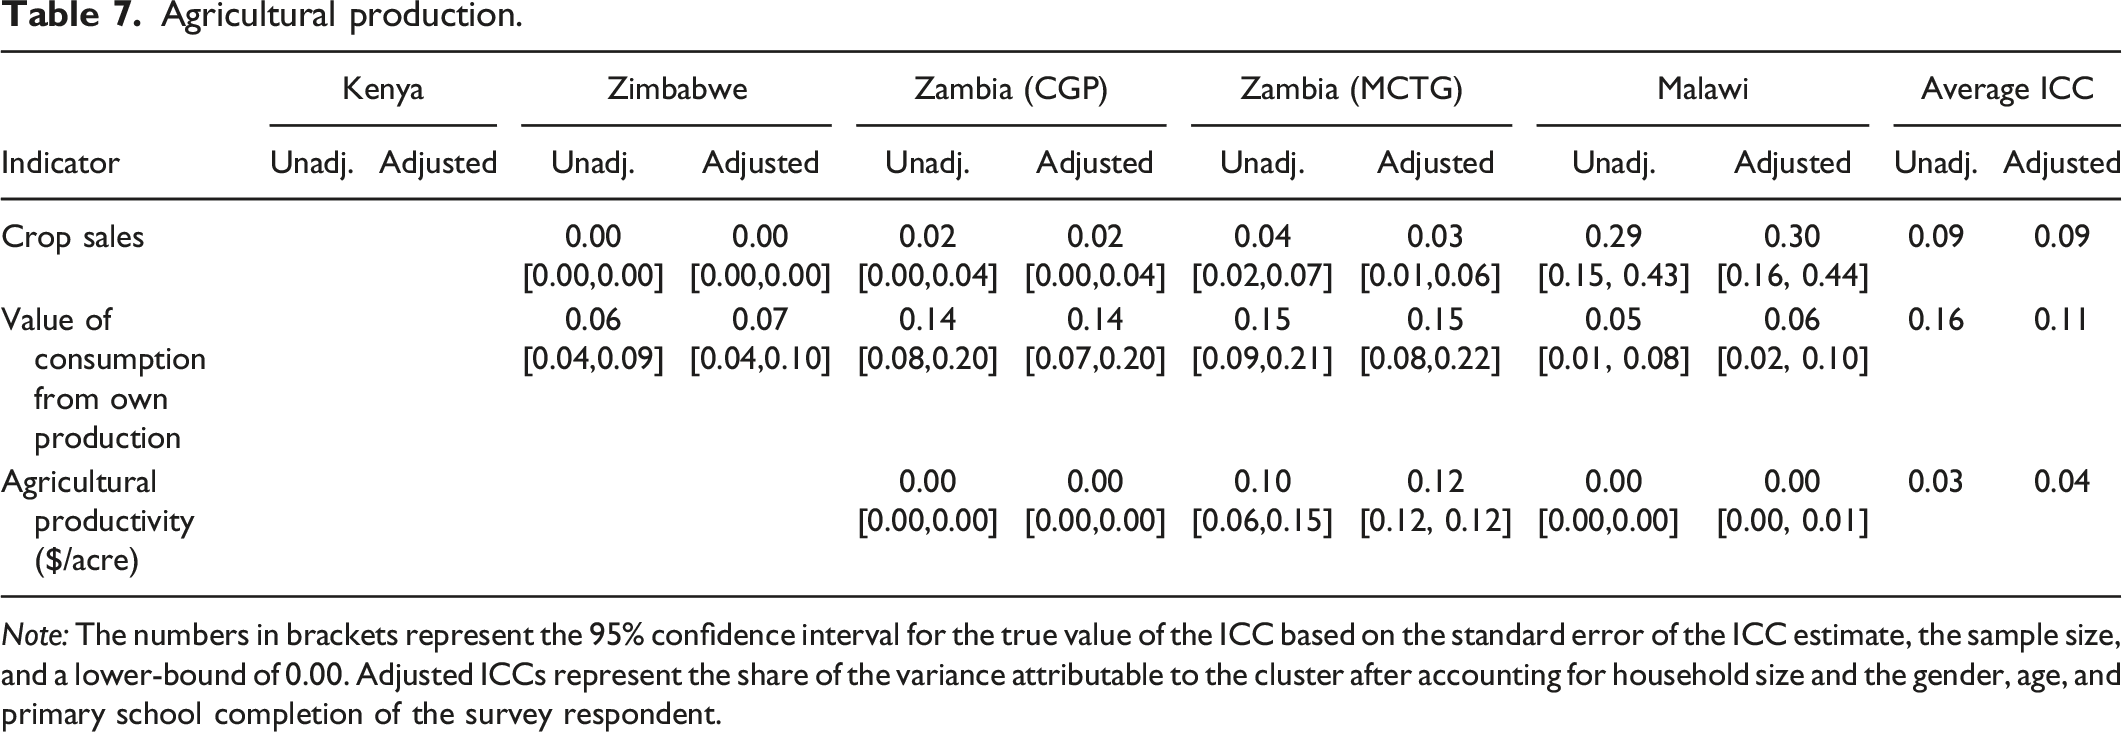
Note: The numbers in brackets represent the 95% confidence interval for the true value of the ICC based on the standard error of the ICC estimate, the sample size, and a lower-bound of 0.00. Adjusted ICCs represent the share of the variance attributable to the cluster after accounting for household size and the gender, age, and primary school completion of the survey respondent.
Consumption ICC values.
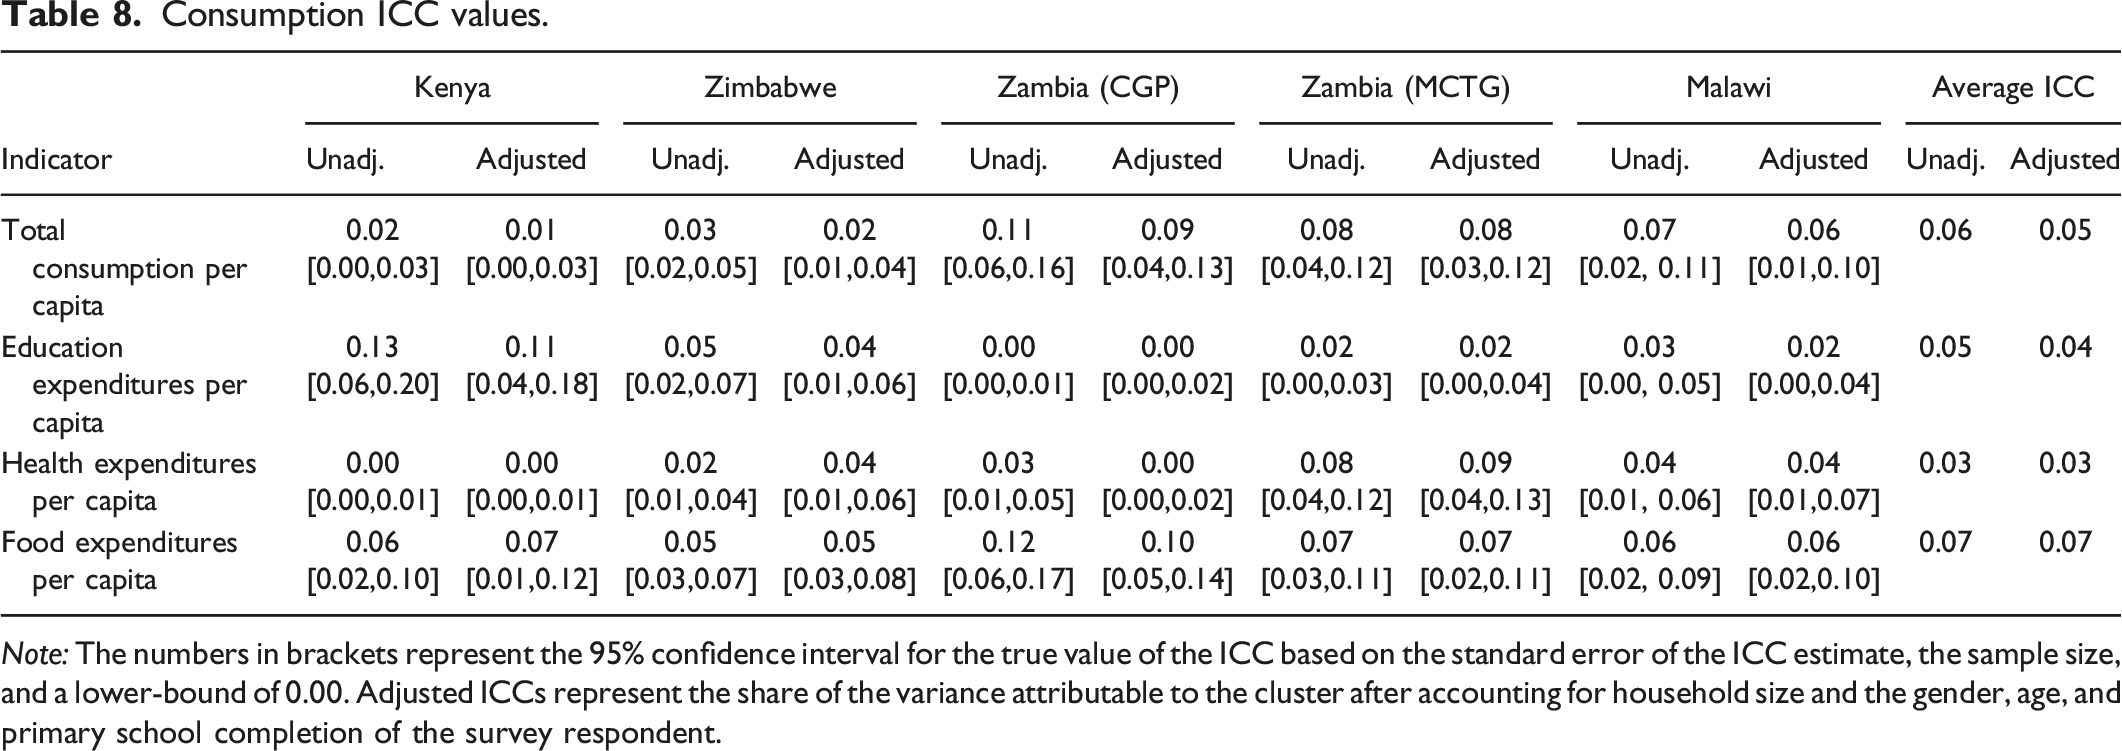
Note: The numbers in brackets represent the 95% confidence interval for the true value of the ICC based on the standard error of the ICC estimate, the sample size, and a lower-bound of 0.00. Adjusted ICCs represent the share of the variance attributable to the cluster after accounting for household size and the gender, age, and primary school completion of the survey respondent.
ICC values for household living conditions.
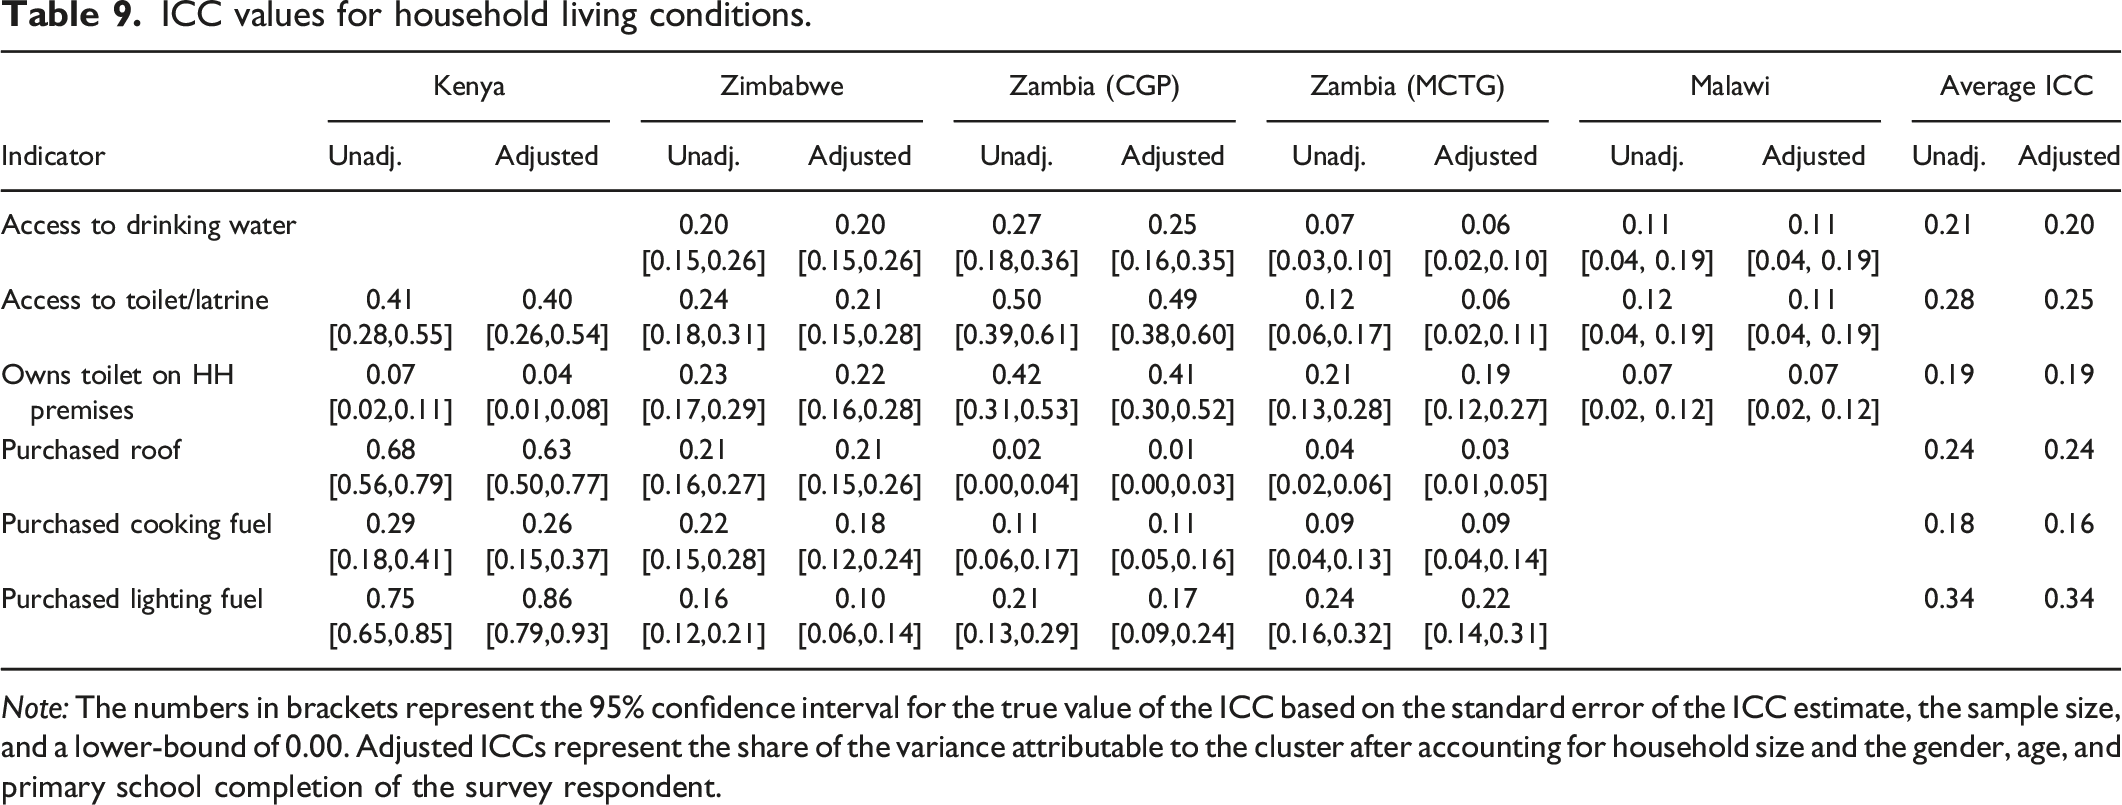
Note: The numbers in brackets represent the 95% confidence interval for the true value of the ICC based on the standard error of the ICC estimate, the sample size, and a lower-bound of 0.00. Adjusted ICCs represent the share of the variance attributable to the cluster after accounting for household size and the gender, age, and primary school completion of the survey respondent.
Throughout our discussion, we provide estimates of typical design effects for that domain. In doing so, we assume an average cluster size of 63 households, which is typical for the studies producing the data in this paper. Design effects produced using this assumption are larger than those with a research design using a smaller number of households per cluster.
To further aid in interpreting the results, we present descriptive statistics for all outcomes at the country-level in Annex A. These results provide the mean value and the standard deviation. These values are important because an outcome with very little variation may have more precisely estimated ICCs.
Individual-Level Indicators
Child Nutrition
Table 2 shows the ICC values for child nutrition indicators stunting, wasting, and underweight. We calculate ICCs for children under 5 years old and children under two years old. The ICCs for nutrition indicators are consistent across indicators and across countries. We find a maximum difference of 0.03 between the minimum and maximum value for each of the ICCs of the nutrition indicators. Similarly, the ICC values for different nutrition indicators are consistent within the same country with stunting, wasting, and underweight all showing roughly the same ICC value. The ICC values for nutrition indicators are low with almost all of them under 0.05 and most under 0.03. Thus, there is little difference in the variation of child nutrition within and between clusters in these countries. Clustering standard errors at the community level for these nutrition indicators will only have a small effect on statistical power compared to individual random assignment, all else equal, making a clustered RCT an attractive design for nutrition studies compared to outcomes for which ICC values are higher. Estimates of design effects suggest that a typical design effect is 2.24 for studies with similar cluster sizes to those in the evaluations we report on.
Child Education
Table 3 shows the ICC values for the two most common education outcomes, enrollment, and attendance. We break up each indicator by age group to represent primary and secondary school ages as supported by data from the cash transfer studies these data come from. We find consistent and low ICC values for enrollment for both age groups across Zimbabwe, Zambia (both studies) and Malawi. One possible explanation for the relatively low ICC values is that the programs all target vulnerable populations. The ICCs may thus be lower than ICCs estimated from a national census of child outcomes. Kenya does, however, stand out, especially for enrollment, with ICC values that are five to ten times higher. Part of the difference that leads to higher ICCs for Kenya may be the more urban nature of that dataset, where enrollment rates are much higher in urban settings than rural ones. Kenya and Zimbabwe have similar ICC values for attendance. These values are much higher than the ICC values for attendance in Zambia. Unfortunately, we do not have ICC values for attendance in Malawi because the study did not include this indicator. We find higher ICC values for primary school age children than secondary school age children. This pattern is especially pronounced in Kenya for both indicators and in Zimbabwe for attendance. It is unclear why Kenya has higher ICC education values, especially for enrollment. The higher ICC values for education outcomes in Kenya will affect the ability to detect impacts for these indicators, all else equal, especially for primary school age children for whom the ICC is estimated as 0.23. Across the five studies, our estimates suggest that cluster-RCTs of education programs may have design effects as high as 7.2. However, this design effect may be larger than in typical education-focused cluster-RCTs with random assignment at the classroom level (or school-level with a sample from a small number of grades), because these studies often have a smaller numbers of students per classroom or school.
Fertility
Table 4 shows the ICC values for fertility indicators, specifically age at first pregnancy and total number of children for all women in the study. These indicators have similar ICC values both within a country and across all five studies. The ICC values are quite low and stable with small confidence intervals. Thus, there is relatively little difference in the variation within a cluster as compared to across clusters for these indicators and the distribution of the population of the study closely resembles the distribution within any cluster. These results mean that the clustered aspect of a research design will reduce the power of a study to detect effects by less than for other outcomes with higher ICC values. Our estimates suggest that the design effect of a cluster RCT for fertility outcomes is around 1.93.
Household Level Indicators
We estimate ICCs for poverty and food security, livestock and agricultural assets, agricultural production, consumption, and household living conditions at the household level.
Poverty and Food Security
Table 5 shows the ICC values for regularly measured poverty and food security indicators. Many of the cash transfer programs target beneficiaries based on poverty levels and food security, so the selection process for eligibility into the evaluated programs should generate a sample that is fairly consistent across lusters. Therefore, we expect to find fairly low ICCs for these indicators. In line with this hypothesis, the ICC values for these indicators are fairly low and consistent across countries and across indicators within the same country (see Table 5). Our estimates suggest a design effect of 5.09 for poverty and food security outcomes.
Livestock and Agricultural Assets
Table 6 shows the ICC values for the number of livestock owned and an index of agricultural assets. Most of the households in the five studies are rural, subsistence farming households. With the exception of Kenya, we find fairly consistent ICC values across countries for each indicator, resulting in fairly robust ICC values. However, we find more variation in ICC values across indicators. ICCs for the ownership of chickens and goats seem higher than for the ownership of pigs and cattle. Regardless, the ICC values for all of these indicators are below 0.1 and some are lower than 0.05. The ICC for agricultural assets appears to have more variation across countries, however, and also is higher than for most livestock categories, thus potentially affecting statistical power more than for the livestock indicators. Our estimates suggest that the design effect of a cluster RCT for agricultural livestock and asset outcomes is around 4.10.
Agricultural Production
Table 7 shows the ICC values for several agricultural production indicators. We find a large range in ICC values both within indicators across countries and across indicators within a country. We do not have measures for all countries for these indicators, however, so have fewer opportunities for comparisons. The ICC for crop sales appears to be the most consistent across countries, with the exception of Malawi, which has a much higher ICC for crop sales than in the other four countries. Our estimates suggest a design effect of 3.98 for agricultural outcomes.
Consumption
Table 8 shows consumption and expenditure ICC values for different consumption categories. These values are all relatively low with most under 0.1. We find fairly consistent values across studies for the same indicator; however, there is some variation across indicators. Expenditures on education and health have higher ICC values than for food consumption and overall consumption. These higher values could relate to the higher ICCs for school enrollment observed in the education section. ICCs of health expenditures may be similar to ICCs of education expenditures, because some clusters have a clinic or school located near-by while others are further away, causing variation across clusters that is larger than the variation within a cluster. Across the disparate types of consumption and expenditure, our estimates suggest that a cluster RCT with 63 households per cluster typically has a design effect of 4.47.
Household Living Conditions
Table 9 shows the ICC values for household living conditions, specifically access to drinking water and access to a toilet or latrine. The values of the ICCs for these indicators have little consistency across studies with some of the highest values reported in Kenya, which may also be driven by urban data with different living conditions. These indicators also have some of the highest ICC values reported in this paper, meaning that they will have larger implications for power of a cluster-randomized design. The ICC values for Malawi and the MCTG Zambia study are fairly consistent within each of these studies as they hover around 0.1, but the ICC values within each of the other studies vary widely across the indicators and are substantially higher, especially in Kenya. In Kenya, the ICC values are especially high because of relatively limited variation for some of the outcomes (i.e., 92% of the households had purchased housing fuel) and because of a more urban setting. The higher ICCs result in a very high design effect of up to 15.88, which showcases the importance of keeping cluster sizes smaller in studies targeting housing and other infrastructure outcomes when these outcomes are geographically clustered.
Conclusion
This paper presents ICC values for a range of indicators within domains commonly studied in development economics and for four countries in sub-Saharan Africa serving as a reference for researchers when designing clustered RCTs in the region. We show for which outcomes ICCs are stable or fluctuate by providing multiple indicators within a domain and similar indicators across countries. The paper does not only provide ICC values for these countries/contexts, but also enables researchers to determine when an ICC might generalize to a similar country in the region when it is not listed here. A main finding from the paper is that the ICC values we present are lower than 0.10 in most cases, meaning that studies lose less power to detect effects when moving from individual to clustered randomization designs in comparison with situations in which ICCs are higher than 0.10. ICCs for the indicators associated with consumption, education, fertility, and nutrition are all lower than 0.10 in each of the Southern African countries in our sample. ICC values of indicators associated with agriculture, food security, and livestock are generally lower than 0.10, but we find higher ICCs and design effects for some of the housing and other infrastructure indicators. Many of the ICCs we present are lower than 0.05 or even 0.01, however. For example, ICC values are universally low for indicators associated with nutrition and expenditures. For nutrition in particular the ICC values are lower than usually anticipated in power calculations, which suggests that reductions in data collection costs can be achieved in impact evaluations that focus on nutrition. Although the ICCs for expenditures are not as low as for nutrition, our results also suggest that it may be feasible to reduce sample sizes for estimating the impact of international development programs that focus on expenditures. All findings only change marginally after using covariate-adjusted ICCs, which generally result in slightly smaller ICCs (ranging from 0.01–0.03).
We find some important differences in ICC values across countries. Specifically, we find higher ICC values for Kenya than in southern African countries across many domains, including educational enrollment and attendance, asset and livestock ownership, and fertility. We propose that the inclusion of urban settings drives up ICCs across outcomes, with different values across urban and rural settings and higher ICCs in urban settings. 2 These differences show the importance of accounting for contextual characteristics when conducting power calculations. It is not sufficient to rely on ICCs from different contexts for conducting power calculations. Instead, it will be important to widely document ICCs from different contexts across many indicators that are commonly used for impact evaluations in international development. The evaluations in this paper studied programs with very similar targeting mechanisms to identify program beneficiaries. The ICCs in this paper relate to predominantly rural populations of poor, food insecure, and labor constrained households. The ICCs might look different for the same indicators in the same countries if the studies targeted a different population. Therefore, it is important to consider the population served by a program in a particular evaluation before generalizing the ICCs from that evaluation to another study.
The number of impact evaluations in international development has increased significantly since 2009 (Brown et al. 2016). Meanwhile, recent evidence from the economics and other social science literature suggests reason for concern about the ability of current studies to detect meaningful effects with sufficient statistical power. Ioannidis et al. (2017) show that in half of the field of economics’ research areas, 90% or more of its studies are underpowered. In addition, Ioannidis (2005) shows that low power increases the likelihood of false positives. At the same time, Banerjee et al. (2015) highlight the importance of conducting ex-ante power calculations in development economics research. This paper can help researchers more accurately estimate their minimum detectable effect size and design well powered studies to avoid some of these problems of statistical power found in the literature.
In addition to providing more ICCs for other countries and domains, future research could also focus on estimating the other parameters that are relevant for power calculations in a wide range of settings. Researchers could focus on summarizing the effect sizes of common interventions in international development, for example, through the use of meta-analyses. In addition, future research could focus on summarizing take-up and attrition rates across interventions and contexts. Such evidence would enable researchers to conduct power calculations with more accurate assumptions, which could in turn result in higher-quality impact evaluations in international development.
Footnotes
Acknowledgments
The authors would like to thank Joshua Sennett, Frank Otchere, and John Downes for their key contributions to data analysis. This study would have not have been possible without the support of the UNICEF country offices that commissioned the program evaluations.
Declaration of Conflicting Interests
The author(s) declared the following potential conflicts of interest with respect to the research, authorship, and/or publication of this article: The article has not been published or submitted for publication in whole or part to any other publishing source. I certify that the underlying analysis is in compliance with the governing IRB standards at the American Institutes for Research.
Funding
The author(s) received no financial support for the research, authorship, and/or publication of this article.