
Abstract
Drug-induced nephrotoxicity is a major challenge in drug discovery and development, accounting for nearly a quarter of severe adverse effects in current pharmacotherapy. Antimicrobial use may be associated with this problem, with one-third of nephrotoxicity related to these drugs. During the lead optimization stage of our antibacterial programs, nephrotoxicity was observed with renal tubule degeneration and tubular granular casts. To examine the nephrotoxicity mechanisms and triage compounds, matrix-assisted laser desorption/ionization mass spectrometry imaging (MALDI-MSI) was used to investigate the compound distribution in rat kidney sections. MALDI-MSI has emerged as a powerful tool allowing for the spatial localization of drugs and metabolites directly from tissue surfaces without the need for labels. By comparing the renal distribution of toxic and non-toxic compounds, a correlation of preferential renal cortex and outer-medullar distribution with positive in vivo nephrotoxicity was discovered for most of the drug candidates being tested. This correlation facilitated the ranking of compounds to aid in the lead optimization process of antimicrobial drug discovery. We envision that MALDI-MSI can be used for drug-induced nephrotoxicity derisking during drug discovery and development when a correlation between tissue distribution and nephrotoxicity can be established.
Introduction
Since their discovery in the 20th century, antibiotics have saved millions of lives and increased life expectancy significantly throughout the world. Over the past decades, however, antimicrobial resistance (AMR) has emerged and threatens to nullify the effectiveness of our current arsenal of antibiotics. 4 Both the World Health Organization (WHO) in 2017 and the Centers for Disease Control and Prevention (CDC) in 2019 published reports identifying key bacterial pathogens that pose the greatest threat to human health due to their lack of treatment options.12,13 Prominent among these pathogens are gram-negative bacteria such as carbapenem-resistant Acinetobacter baumannii (CRAB), multidrug-resistant (MDR) Pseudomonas aeruginosa, and carbapenem-resistant Enterobacterales (CRE). With the potential for AMR to lead to ever-increasing mortality and economic damage, the need for new antibiotics to combat AMR infections has become paramount.
β-Lactam antibiotics, including cephalosporins, carbapenems, penicillins, and monobactams, are the most widely used therapeutic agents for the treatment of serious bacterial infections. 5 They act by inhibiting bacterial penicillin-binding proteins (PBPs) which results in interrupted cell wall synthesis and bacterial cell death. Resistance of gram-negative bacteria to β-lactams is due primarily to bacterial expression of enzymes called β-lactamases (BLs) that hydrolyze and inactivate β-lactams.1,11 BLs are grouped into class A, B, C, and D enzymes based on amino acid sequence homology and structural similarity.1,11 The class A, C, and D enzymes have an active site serine while the class B BLs require zinc in the active site and are referred to as metallo-β-lactamases (MBLs).
In an effort to identify new antibiotics, we initiated multiple programs to discover novel β-lactams or BL inhibitors that aim to have an increased or broad-spectrum coverage of gram-negative pathogens, especially against CRAB, MDR P. aeruginosa, and CRE. Since antimicrobials and β-lactams in particular have been associated with causing acute kidney injury (AKI), 8 meticulous attention was given to the potential for nephrotoxicity in our research. The kidney plays a crucial role in the excretion of drugs and is often a primary target for drug-induced toxicity. 10 Drug-induced nephrotoxicity refers to the impairment of kidneys caused by drugs, which can lead to the development of acute or chronic kidney diseases. Approximately 20% of acute renal failure can be attributed to drug-induced nephrotoxicity.2,9 In our antibacterial discovery programs, various drug candidates exhibited nephrotoxic effects, including tubule degeneration and the presence of tubular granular casts, while the creatinine and blood urea nitrogen levels have no to minimal change, as observed during exploratory toxicity studies in rats. This raised the question of whether a correlation exists between the distribution pattern of drugs and their nephrotoxicity, and whether drug distribution patterns can be utilized to predict the potential for nephrotoxicity.
To explore and understand the distribution pattern of drugs in the kidney, we utilized matrix-assisted laser desorption/ionization mass spectrometry imaging (MALDI-MSI). Since the first application on drug molecules in 2003, MALDI-MSI has become a key label-free imaging approach for spatial analysis of drug molecules, metabolites, and biomarkers. With advancements in instrumentation, sample preparation techniques, and data analysis strategies, MALDI-MSI has gained widespread use in the pharmaceutical industry to understand drug disposition, pharmacodynamic biomarker, and toxicity.3,9 Utilizing a label-free imaging method like MALDI-MSI during drug discovery is advantageous in terms of time and cost efficiency, as it eliminates the need to synthesize and develop radioactive or fluorescent labeled compounds. Furthermore, the MALDI-MSI approach allows for easy differentiation of drugs and their metabolites within a single imaging experiment based on their mass differences, which can be challenging with labeling approaches. 2 For example, Lenz et al. applied MALDI-MSI to identify the compositions of intratubular crystals in kidney sections after treatment of four drug candidates. The crystals consisted of either unchanged parent or metabolites with accurate mass matching. 6 Notably, this imaging technique also enables the simultaneous detection of other endogenous biomolecules within the mass range.
In this study, we describe the use of MALDI-MSI on thin kidney sections to examine nephrotoxicity mechanisms and triage candidate compounds. Results from MALDI-MSI analyses showed a direct correlation between renal cortex and outer medullary compound distribution with positive in vivo nephrotoxicity for most tested compounds. This correlation was used to prioritize antibacterial candidates that did not localize to the kidney periphery for further evaluation in our programs. We propose that MALDI-MSI may be used for derisking drug-induced nephrotoxicity in other drug development programs when a tissue distribution and nephrotoxicity correlation can be established.
Materials and Methods
Materials
All reagents and chemicals were used without additional purification. Indium tin oxide (ITO) coated glass slides were purchased from Bruker Daltonics (Billerica, MA). 2,5-Dihydroxybenzoic acid (DHB, 98%) was purchased from Sigma-Aldrich (St. Louis, MO). Methanol and acetonitrile used in this study were optima LC/MS grade and were purchased from Fisher Chemical (Waltham, MA). Deionized (DI) water was obtained with a Millipore system. All drug candidates (Compound A-L, Chart 1) were synthesized and purified internally.
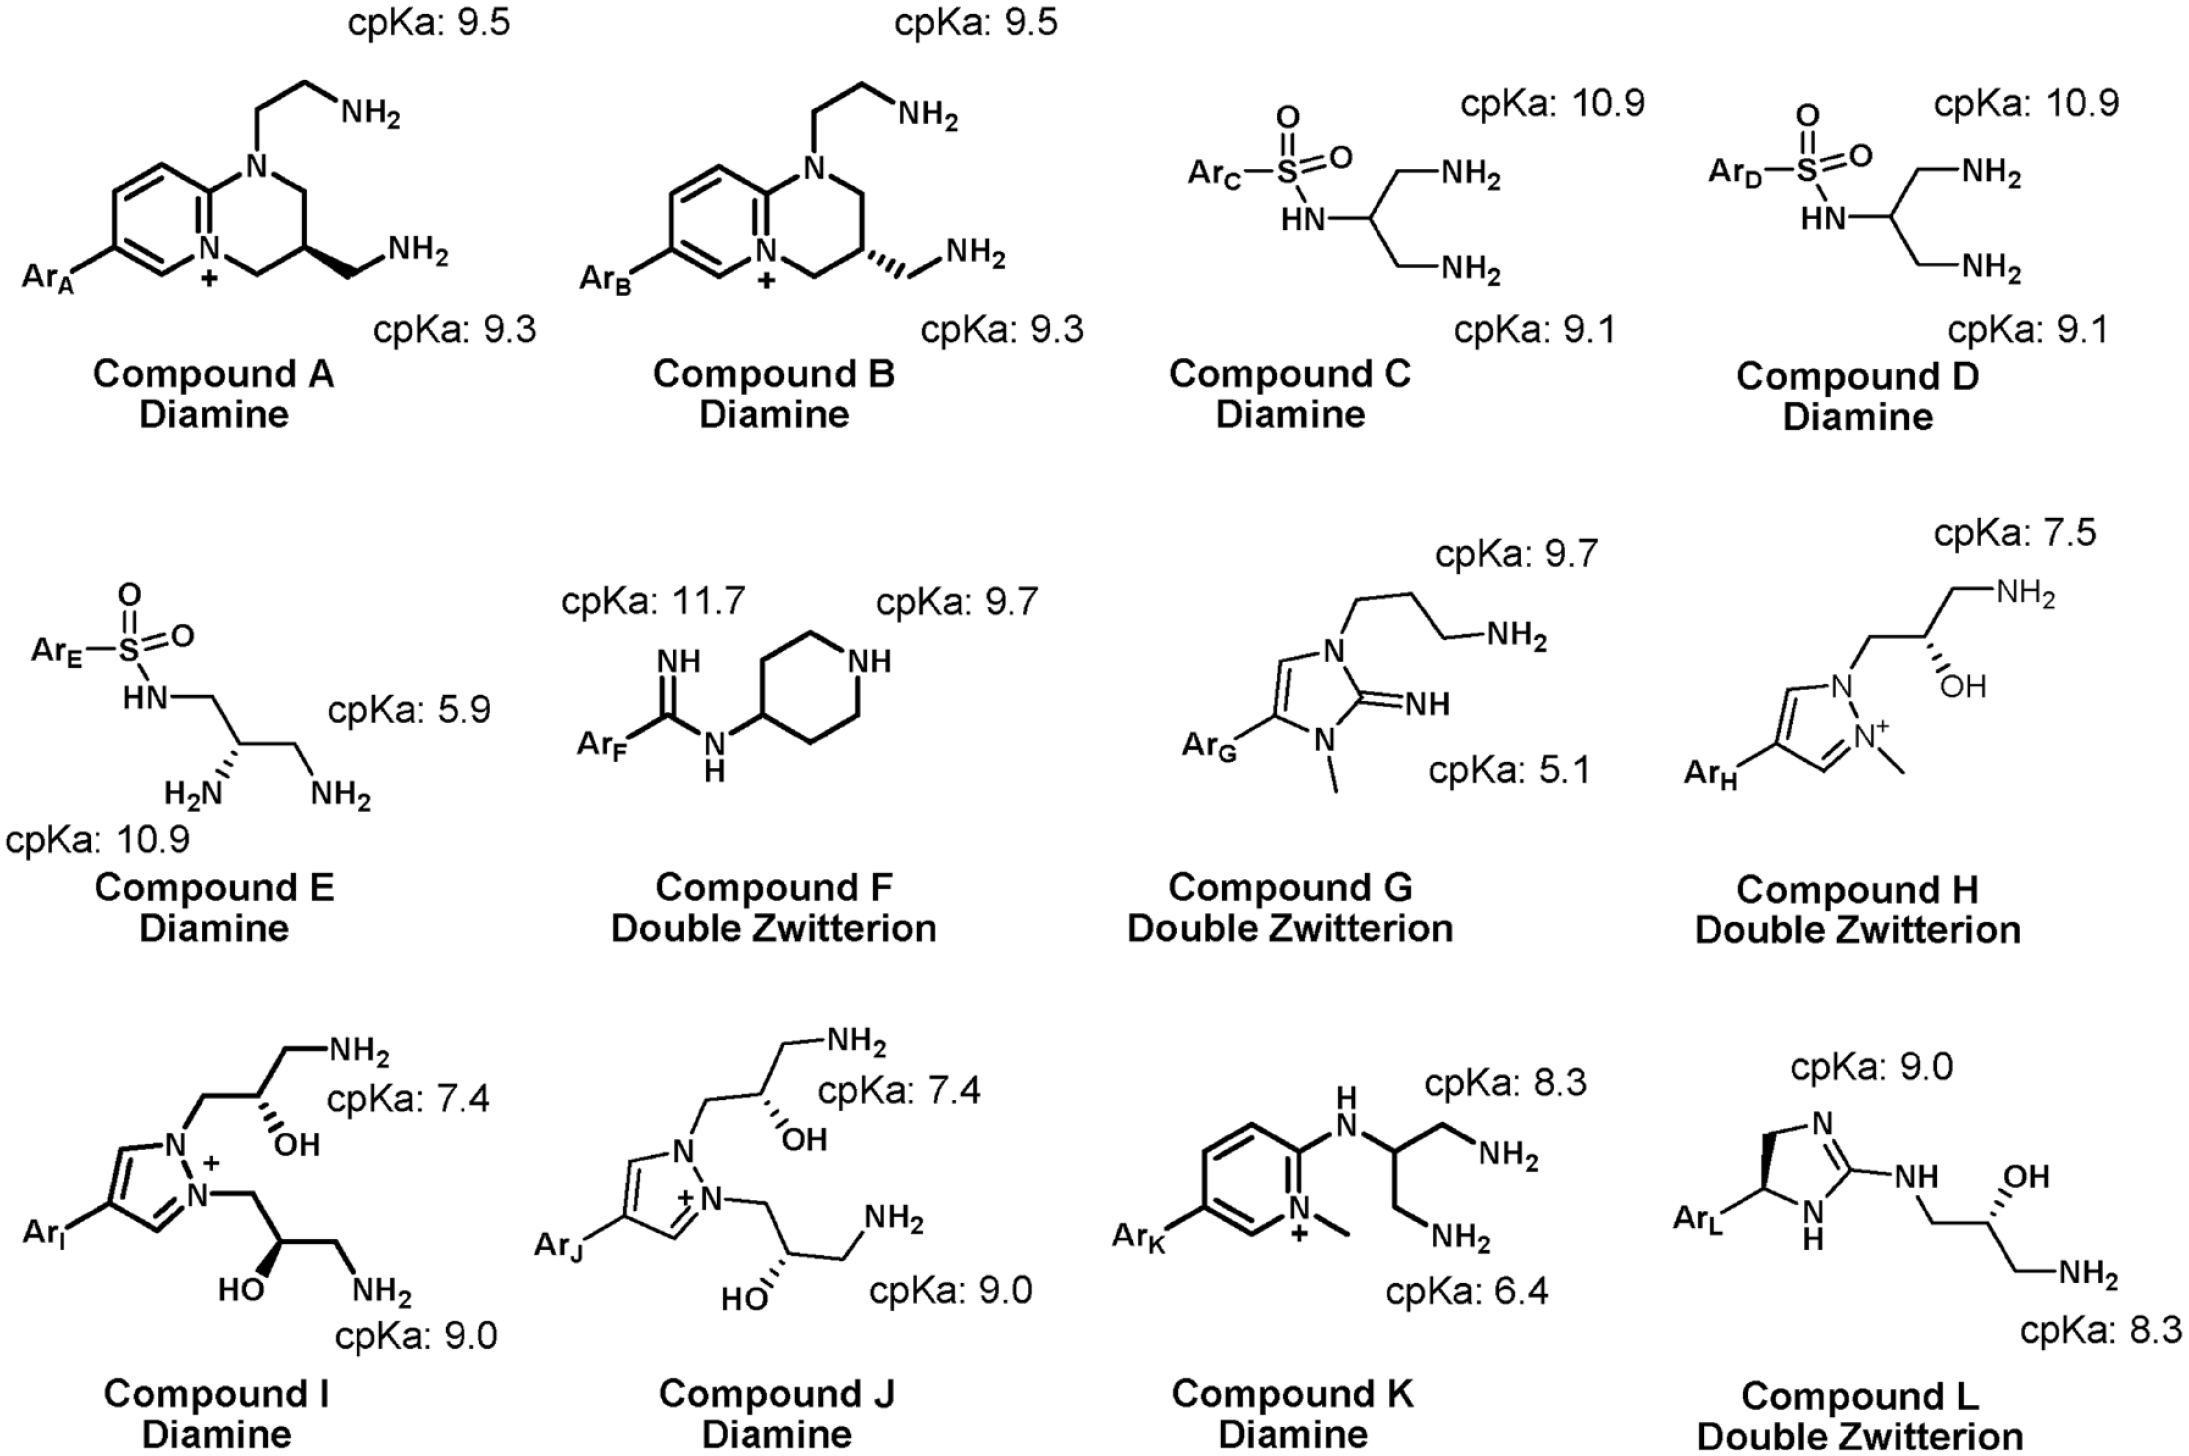
Partial structures of the research compounds used in the MALDI-MSI studies.
Animal Experiments
The animal use protocol was reviewed and approved by the Institutional Animal Care and Use Committee (IACUC) according to the Guide for the Care and Use of Laboratory Animals.
Four-day exploratory toxicity studies
To assess the potential toxicity of the research compounds, a 4-day exploratory toxicity study was performed using male Wistar Hannover rats. The rats were dosed subcutaneously (SC) twice a day (b.i.d.) in the following dosing groups for compound A: 225 mg/kg (450 mg/kg/day) in the high-dose group, 75 mg/kg (150 mg/kg/day) in the mid-dose group, 25 mg/kg (50 mg/kg/day) in the low-dose group, and 0 mg/kg in the control group with four rats per group. The rats were euthanized via carbon dioxide at the end of the study period. Measurements such as body weights, clinical signs, serum chemistry, tissue gross findings, and histomorphological findings, were recorded.
Five-hour intravenous (IV) infusion studies
For each tested compound, two pre-cannulated male Wistar Hannover rats were dosed via IV infusion for 5 hours. Test compounds were formulated with 30% captisol. Compound dosages and dosing concentrations are specified in Table 1. The rats were fasted overnight and then fed at 2 hours postdose. Plasma samples were collected at predose (0 hours) and 4 hours for 0.5 mL, and terminal time point (5 hours) for 1 mL and stored in a matrix tube. The rats were euthanized via carbon dioxide at the end of the infusion period. Kidneys and spleen were collected, weighed, fresh frozen with dry ice, and stored at −70ºC until sectioning.
A summary of research compounds and dosing information.
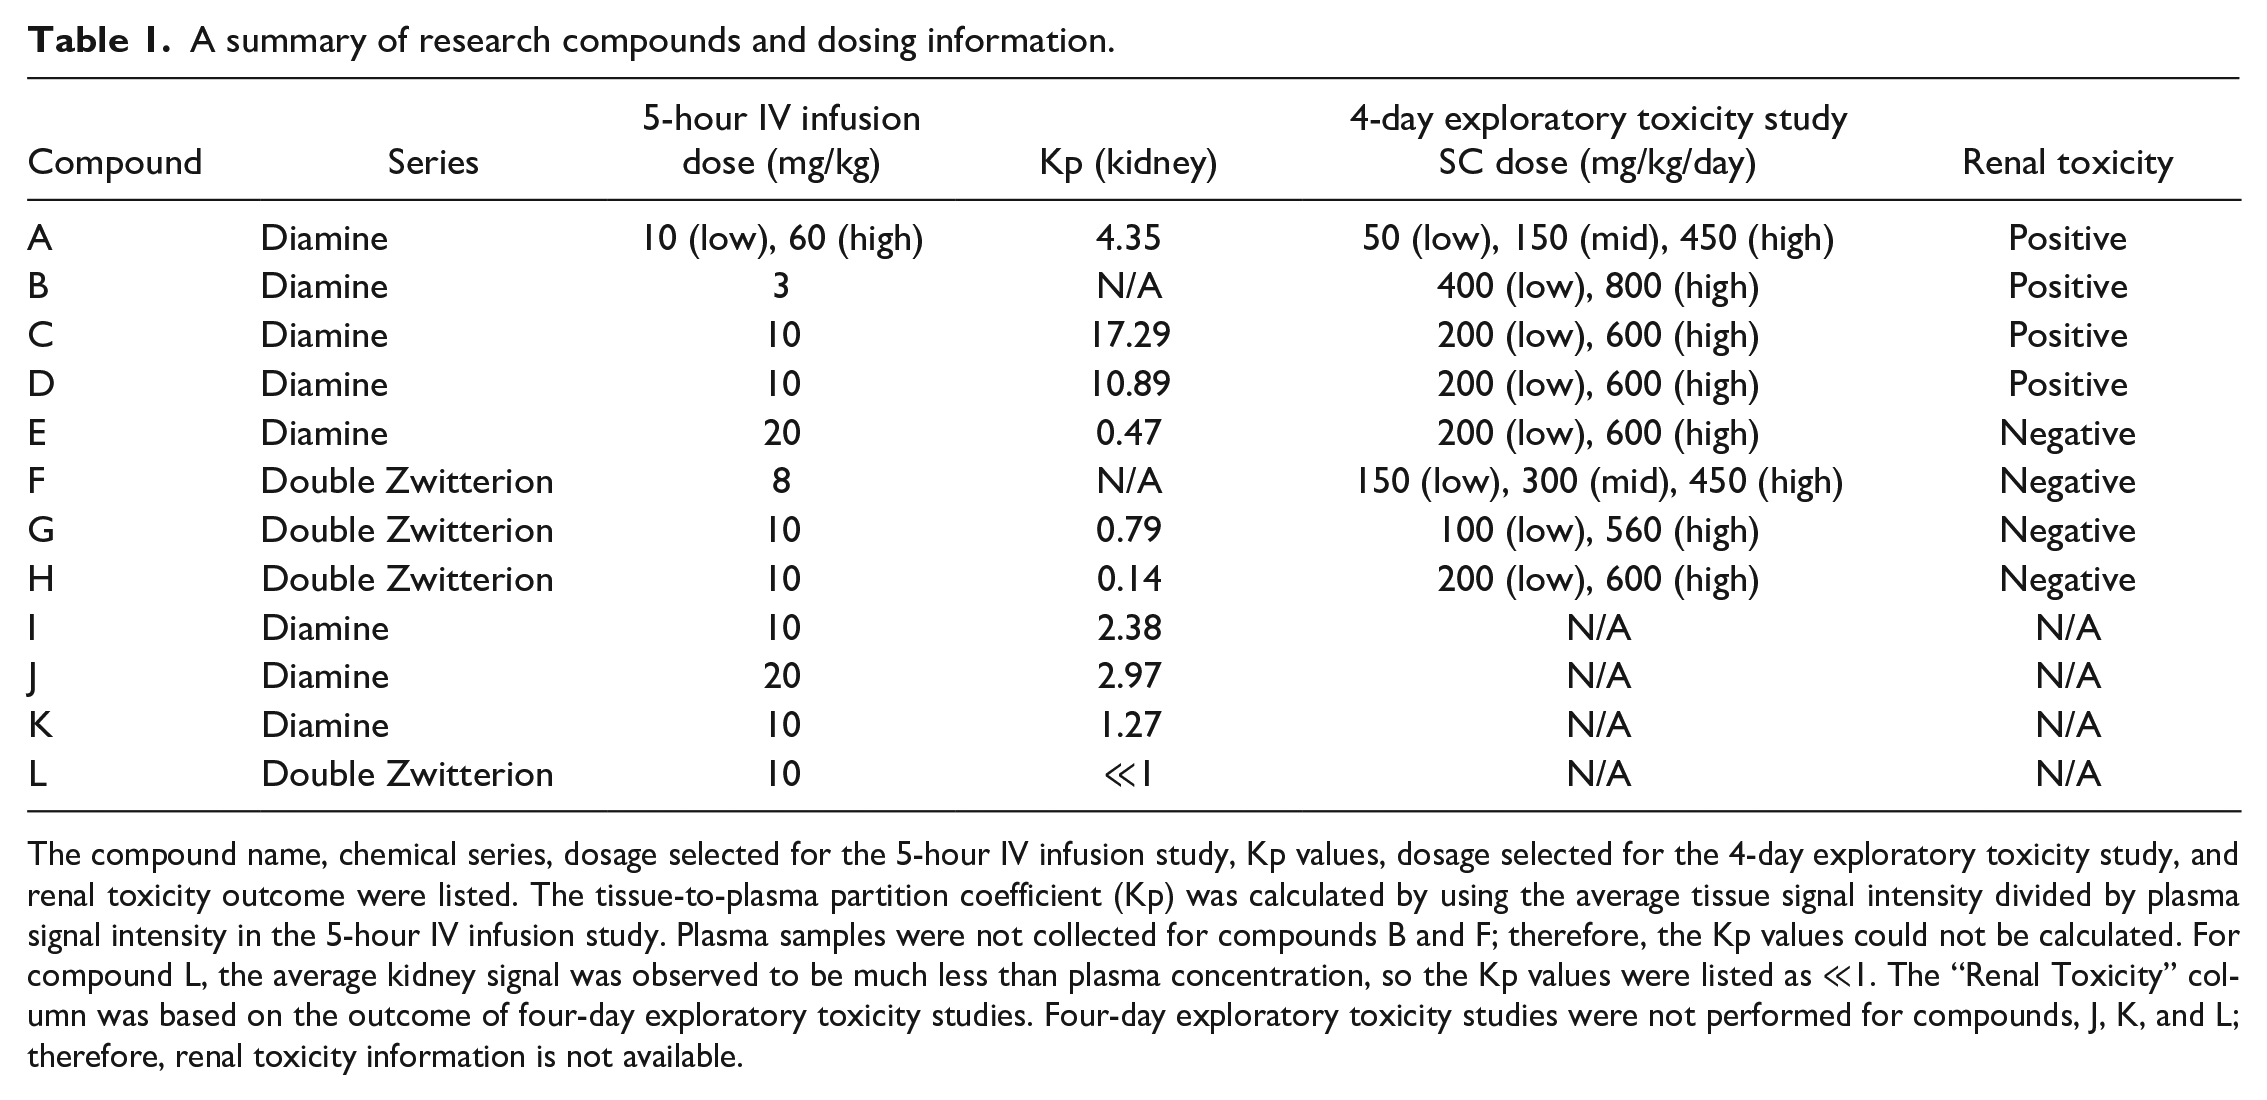
The compound name, chemical series, dosage selected for the 5-hour IV infusion study, Kp values, dosage selected for the 4-day exploratory toxicity study, and renal toxicity outcome were listed. The tissue-to-plasma partition coefficient (Kp) was calculated by using the average tissue signal intensity divided by plasma signal intensity in the 5-hour IV infusion study. Plasma samples were not collected for compounds B and F; therefore, the Kp values could not be calculated. For compound L, the average kidney signal was observed to be much less than plasma concentration, so the Kp values were listed as ≪1. The “Renal Toxicity” column was based on the outcome of four-day exploratory toxicity studies. Four-day exploratory toxicity studies were not performed for compounds, J, K, and L; therefore, renal toxicity information is not available.
Histology
At the necropsy of the four-day exploratory toxicity studies, tissues were collected for histology soon after the last blood collection and exsanguination. The right and left kidney (5 mm section including the papilla, cortex, and medulla) were isolated from each animal and placed in 10% neutral buffered formalin (NBF). Tissues were fixed for a minimum of 24 hours, processed, and embedded in paraffin. Embedded tissues were cut into 4 to 6 µm sections and stained with hematoxylin and eosin (H&E) using standard techniques for microscopic examination. Kidney sections were examined microscopically by a pathologist, and an informal peer review was performed according to routine laboratory work practice. An additional 5 mm sample of the right kidney adjacent to the sample collected for histology was collected and stored frozen at −70°C for MALDI-MSI.
MALDI-MSI Sample Preparation
MALDI-MSI studies were performed on fresh frozen kidney sections collected from the four-day exploratory toxicity study for compound A, and kidney, spleen, and plasma collected from the 5-hour IV infusion studies for all compounds listed in Table 1. Prior to sectioning, the kidney, spleen, and plasma matrix tube were transferred out of the −70ºC freezer and stored in a −20ºC microtome (Leica CM3050s, Leica Biosystems, Buffalo Grove, IL) for 30 minutes to balance temperature. The frozen kidney or spleen was placed onto a tissue chuck using a small drop of optimal cutting temperature solution. The kidney was trimmed from the edge until the cortex, medulla, and papilla were observed. The spleen was trimmed until approximately 10 mm2 surface area was presented for sectioning. Then, 12-µm sections were acquired and thaw-mounted onto an ITO glass slide. For plasma samples, the matrix tube containing plasma was sectioned on the microtome. A 12-µm frozen plasma section was placed next to the kidney section on the same ITO slide. The slide was stored in a −70ºC freezer until matrix application and imaging analysis.
Prior to matrix application, the slide was transferred to a desiccator at room temperature for 30 minutes. A thin layer of MALDI matrix, 40 mg/mL DHB in 1:1 (v:v) methanol:water, was applied onto the tissue slide using an automatic sprayer (Model M5, HTX Technologies, Chapel Hill, NC). The following parameter was used for spraying matrix: 10 psi nitrogen gas flow, 3 mm track spacing, 0.1 mL/min flow rat, 1000 mm/min nozzle movement speed, 75ºC nozzle temperature, and 8 passes.
MALDI-FTICR and Data Analysis
MALDI-MSI was performed on a 9.4T MALDI-Fourier transform-ion cyclotron resonance (FTICR) mass spectrometer (SolariX, Bruker Daltonics, Billerica, MA), which is a high-resolution accurate mass (HRAM) instrument. Positive ion mode was used with a continuous accumulation of selected ions function turned on. Q1 mass was set up based on the molecular weight of the drug candidate, and the isolation window was set between 160 and 220 m/z. A resolution of 512k with an average scan of 1 was used. Other instrument parameters were 15% laser power, 1 kHz laser frequency, and 200 laser shots, and 100 µm spatial resolution was used in the analysis unless otherwise stated.
For imaging data analysis, all ion images were generated using FlexImaging 5.0 (Bruker Daltonics, Billerica, MA). The maximum intensity of the window was extracted within a range of ± 0.002% unless otherwise stated. Microsoft Excel was used to calculate the tissue-to-plasma partition coefficient (Kp) using the average tissue signal intensity divided by plasma signal intensity. An overview of the workflow is shown in Figure 1.
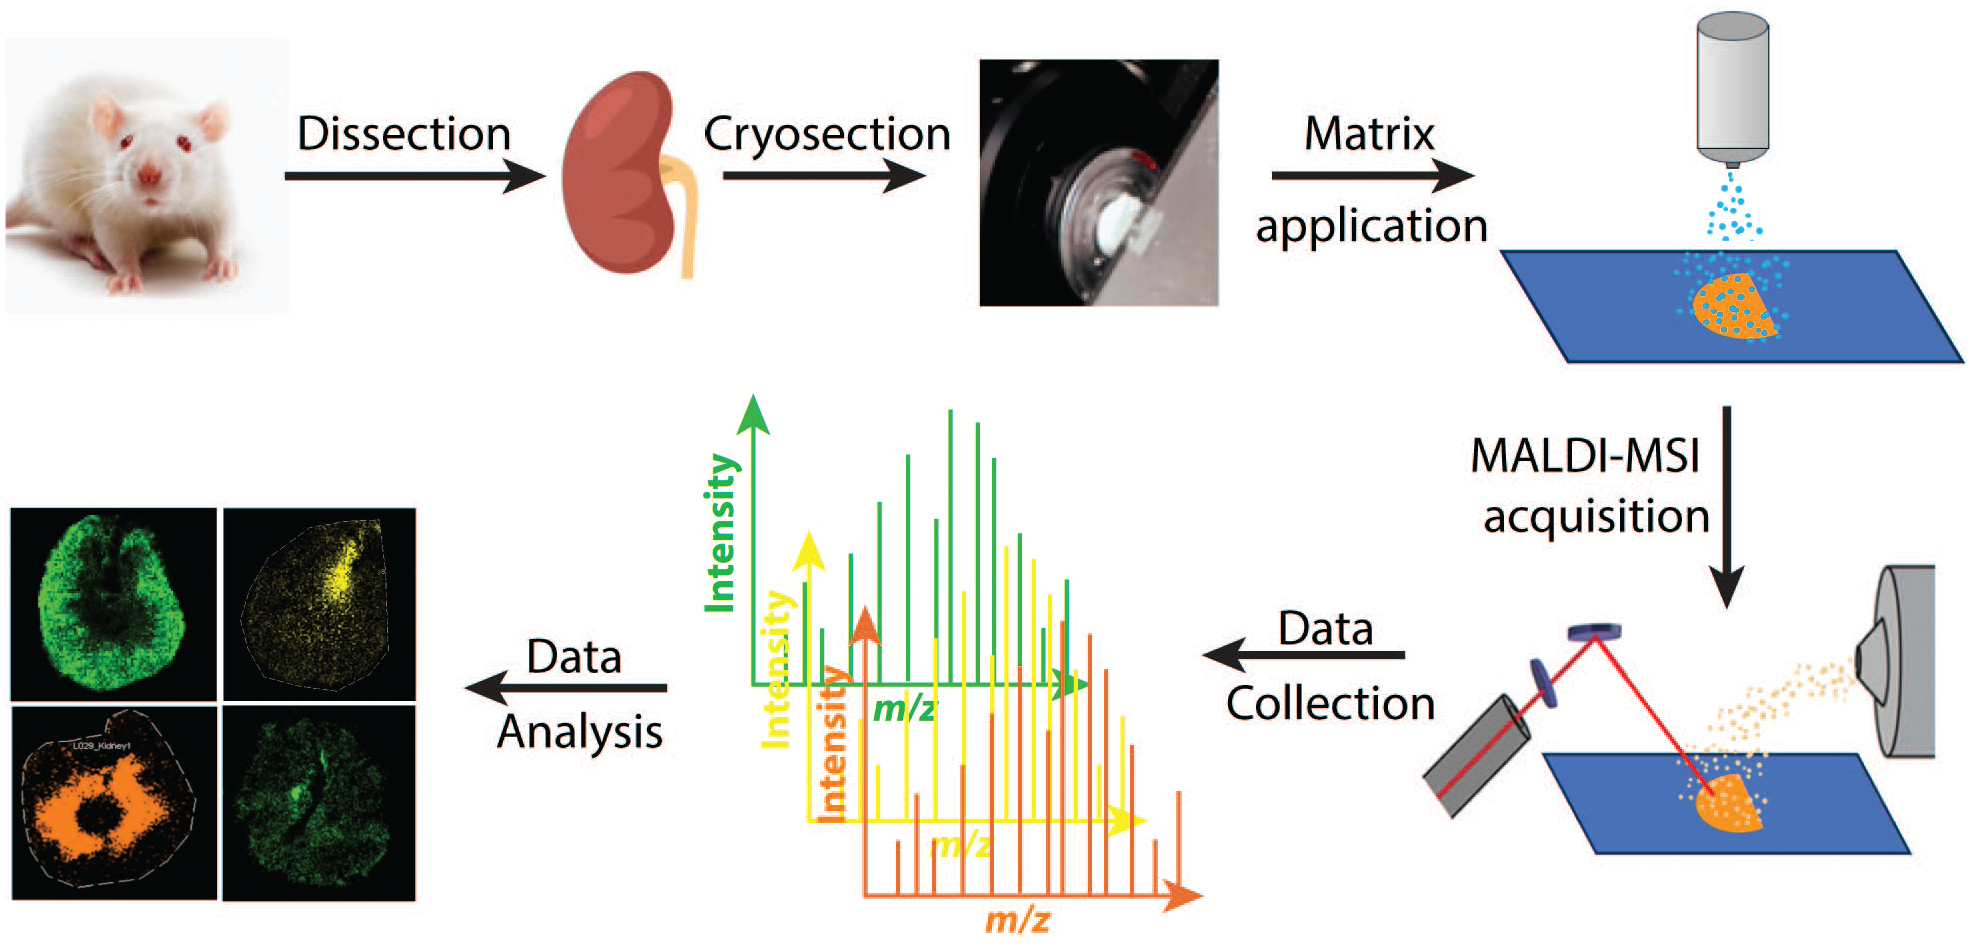
Schematic of MALDI-MSI workflow used in this study.
Results
Properties of Compound Set
In antibacterial drug discovery, it is a major challenge to obtain suitable whole-cell activity and broad coverage of clinical pathogens. One key reason is poor bacterial cell penetration and significant efflux that lead to low gram-negative cell accumulation and whole-cell activity. As shown in Chart 1, compounds A to L from our antibacterial programs were designed to bear two to three positive charges (as alkyl or quaternary amine; the calculated pKa values are shown and detailed medicinal chemistry development is a subject of separate publication elsewhere) in the basic tail portion, which facilitated overcoming the gram-negative cell penetration and efflux challenges. The remaining portion of each molecule is denoted as Ar, which carries one or two acidic moieties. The Ar portion of compounds C to E has one acidic moiety, and that of the rest compounds has two acidic moieties. Therefore, compounds A to E and I to K have a net positive charge and are defined as diamine series. On the contrary, compounds F to H and L are net neutral and defined as double zwitterion series. With the desired on-target profile achieved, these molecules were advanced to explore the safety profile.
Renal Histomorphology and MALDI-MSI Results of Compound A
The administration of compound A to rats for 4 days at doses of 50, 150, and 450 mg/kg/day resulted in test article-related renal histomorphologic changes at all dose levels. Minimal to marked renal tubular epithelial degeneration and tubular granular casts primarily localized to the cortex were observed in all animals in the mid- and high-dose groups with a dose-dependent increase in the severity of these findings. Tubular degeneration was characterized by dilated tubules lined by enlarged basophilic to flattened, attenuated epithelium with cell sloughing, and epithelium with cytoplasm containing variably sized eosinophilic granules and granular tubular casts. Granular casts, characterized by variable amounts of eosinophilic granular material, admixed with sloughed epithelial cells and/or yellowish-brown amorphous, birefringent material in the tubular lumen, were present and predominantly limited to the tubules with degeneration. In all compound A treated animals, the cytoplasm of the renal tubular epithelial cells showed minimal to mild increases in the numbers of irregular, variably sized, and deeply eosinophilic granular material, predominantly in the cortical epithelium (degenerate and non-degenerate), with a dose-dependent increase in severity. Figure 2B demonstrates the tubular degeneration of the renal cortex region in rats administered 450 mg/kg/day with H&E staining. The red arrows point to the area where tubular granular casts were observed. There were no test article-related changes in serum biochemistry parameters in the 50 mg/kg/day dosing group and very slight increases in blood urea nitrogen and creatinine in the 150 and 450 mg/kg/day dosing groups. Kidney weights were also measured and there were no noteworthy changes. Pale kidneys were observed in all animals from the 450 mg/kd/day and two out of four animals of the 150 mg/kg/day dose group as the gross pathological kidney changes.
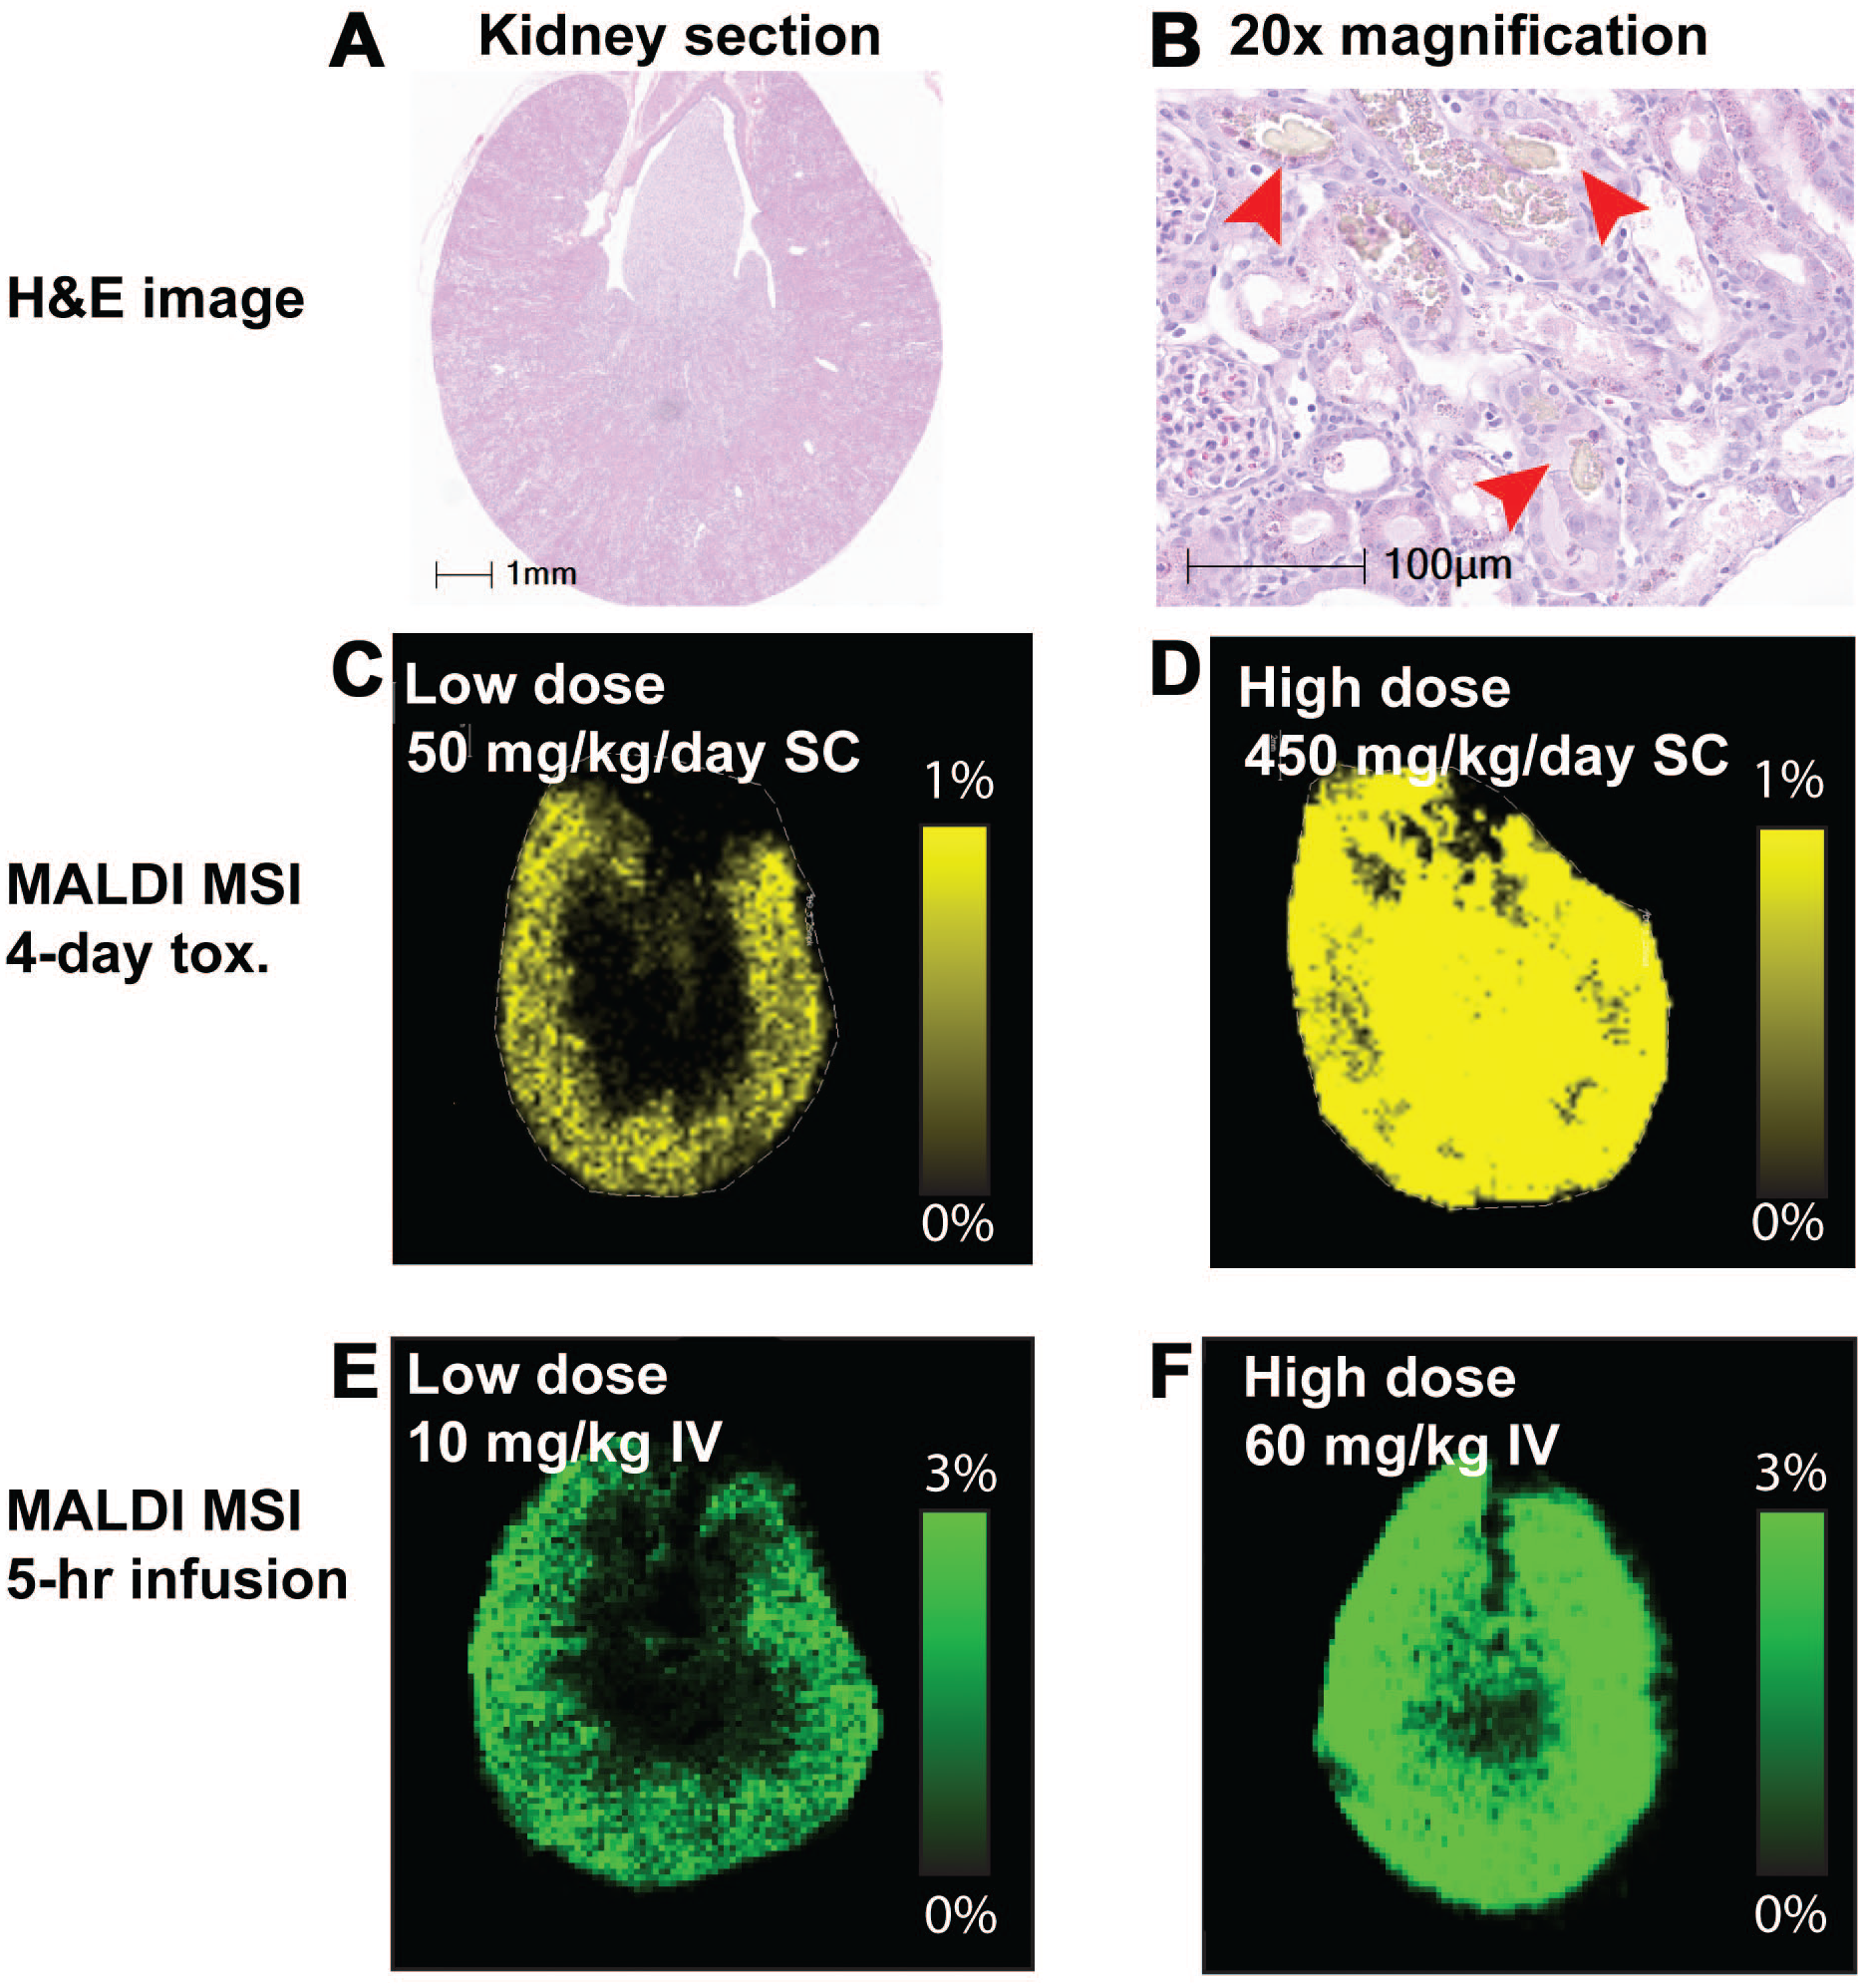
Histomorphologic and MALDI-MSI kidney imaging results for compound A. Histomorphologic and MALDI-MSI kidney imaging results for compound A. A. Representative H&E stained image of the kidney section at 450 mg/kg/day SC. B. 20x magnification showing histomorphologic findings at 450 mg/kg/day SC. The red arrows point to the area of crystal formation in kidney after treating rats with compound A at 450 mg/kg/day for four days. C & D: Compound A distribution measured by MALDI-MSI of the kidney sections from 4-day exploratory toxicity study of compound A at 50 mg/kg/day SC (C) and 450 mg/kg/day SC (D). E & F: Compound A distribution measured by MALDI-MSI of the kidney sections from IV infusion study of compound A at 10 mg/kg (E) and 60 mg/kg (F).
In addition to compound A, other compounds in the diamine series induced nephrotoxicity in the 4-day exploratory toxicity studies in rats based on histomorphology, including compounds B, C, and D. Compound E was the exception in the diamine series without evidence of nephrotoxicity. On the contrary, compounds F, G, and H, which belong to the double zwitterion series, did not exhibit evidence of nephrotoxicity.
MALDI-MSI experiments were performed on kidney sections collected at necropsy at the conclusion of the 4-day toxicity study to map the distribution of compound A in order to investigate if there is a correlation between drug distribution and localization of histomorphologic changes. Kidney sections from the low-dose (50 mg/kg/day) and high-dose groups (450 mg/kg/day) were analyzed by MALDI-MSI and the results are shown in Figure 2C and D. MALDI-MSI results of the low-dose group (Figure 2C) demonstrated that compound A distributed to the renal cortex region, which was the area where histomorphology changes were observed. Based on the results of MALDI-MSI, the dosed drug could contribute to the material observed in the tubular lumen. Scanning electron microscopy coupled with energy dispersive X-ray (SEM/EDX) spectroscopy could be used to further determine if any counter ions were colocalized with the drug-related material, similar to the study reported by Lenz et al. 12 For the high-dose group (Figure 2D), compound A distributed throughout the kidney section, which likely is secondary to the high systemic drug exposure achieved at this dose.
MALDI-MSI Results From IV Infusion Studies With Compounds A to H
An exploratory toxicity study is time- and resource-intensive, requiring grams of compounds and multiple days of dosing. Therefore, we decided to explore if a single-dose IV administration could achieve systemic drug exposure and renal distribution patterns similar to that of the high subcutaneous doses used in the toxicity study, thus reducing both compound and resource requirements. As a pilot study, a 5-hr IV infusion study of compound A at two dose levels was performed to compare with the tissue distribution pattern of the 4-day toxicity study. The 5-hr infusion time was selected to allow time to reach the steady state in distribution. An IV dose of 10 mg/kg was chosen to mimic the 50 mg/kg/day dose and 60 mg/kg was chosen to mimic the 450 mg/kg/day SC dose in the exploratory toxicity study. As shown in Figure 2E and F, the kidney distribution patterns of the IV infusion experiment were almost identical to the exploratory toxicity study. The MALDI-MSI result of the low-dose group (Figure 2E) showed the distribution of compound A to the renal cortex region, which was the same as Figure 2C. The resulting MALDI-MSI distribution of the high-dose group (Figure 2F) showed compound A distributed to the entire kidney section, which was similar to Figure 2D. Both Figure 2D and F showed a trend of expansion from the cortex to the medulla.
As the results of the IV infusion experiment aligned with the exploratory toxicity study, we performed a series of IV infusion and MALDI-MSI experiments on the drug candidates to mimic the exploratory toxicity study. The 3 to 20 mg/kg doses in the IV infusion experiments were selected based on compound A experience (Table 1). Stereoisomer compounds A and B, which are toxic to the kidney, were distributed to the renal cortex (Figure 3A and B). Compounds C and D, which are also renal toxic and share the same side chain structure (Chart 1), were distributed to the renal outer medulla (Figure 3C and D). For compounds that distributed to the renal cortex the tubular changes were primarily observed in the renal cortex, whereas for the compounds that distributed to the renal outer medulla, the tubular changes were primarily observed in the cortex adjacent to the medulla. In contrast, compounds E, F, G, and H, which are not renal toxicants, had a more restricted distribution pattern limited to the renal papilla region (Figure 3E-H).
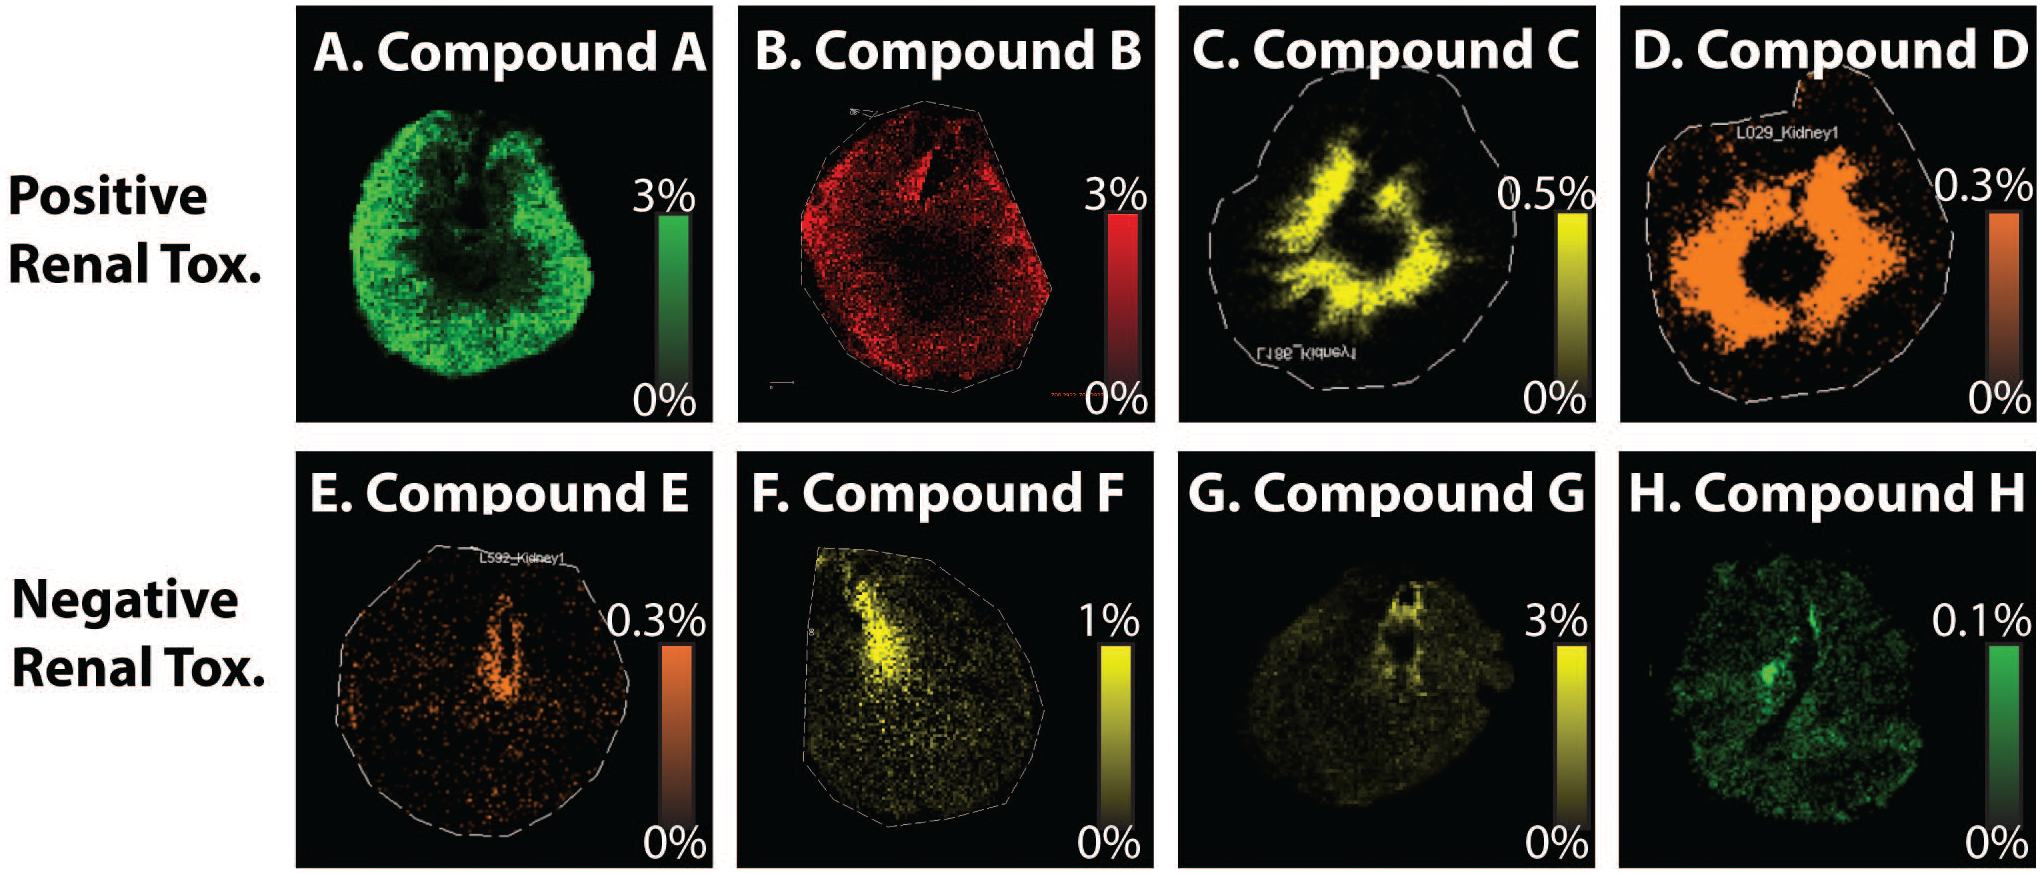
MALDI-MSI results of dosed kidney tissues. Rats were dosed with compounds known to cause renal toxicity (A-D, dosed with compounds A-D, respectively) and with compounds known to not cause renal toxicity (E-H, dosed with compounds E-H, respectively).
To better quantify the observation, we calculated the Kp values of the average kidney section utilizing the ratio of the average kidney signal intensity to the average plasma spot signal intensity (Table 1). Compounds A, C, and D, which are renal toxic, had Kp values of 4.35, 17.29, and 10.89, significantly higher than 1. In contrast, compounds E, G, and H, which are not renal toxic, had Kp values of 0.47, 0.79, and 0.14, all lower than 1.
Based on these data we concluded that antibacterial drug candidates that exhibit distribution to the renal cortex or outer medulla regions, with renal Kp values significantly higher than 1, are more likely to be associated with renal toxicity. In contrast, antibacterial drug candidates with distribution limited to the renal papilla region and renal Kp values lower than 1, tend not to be renal toxic. Therefore, we implemented the IV infusion and MALDI-MSI method as a time and resource-sparing approach to triage compounds. Four additional drug candidates were tested to evaluate the nephrotoxicity potential (Figure 4). Compounds I and J, which are both from the diamine series, were distributed throughout the kidney section (Figure 4A and B). The Kp values were calculated to be 2.38 and 2.97, respectively (Table 1). The results suggested a high potential for nephrotoxicity. On the contrary, compound L from the double zwitterion series was distributed to the renal papilla with a Kp value lower than 1, which indicated lower renal toxicity potential (Figure 4D). Compound K is an analog from the diamine series. The MALDI-MSI result suggested that it was distributed throughout the kidney section, but with a higher intensity at the papilla region (Figure 4C). Its Kp value was calculated to be 1.27 (Table 1), which is around 1. Neither the tissue distribution pattern nor the Kp value was able to provide a clear prediction on the nephrotoxicity potential of compound K. Due to the deprioritization of the diamine series, no repeat-dose toxicity study was performed on compound K to determine the potential for renal toxicity.
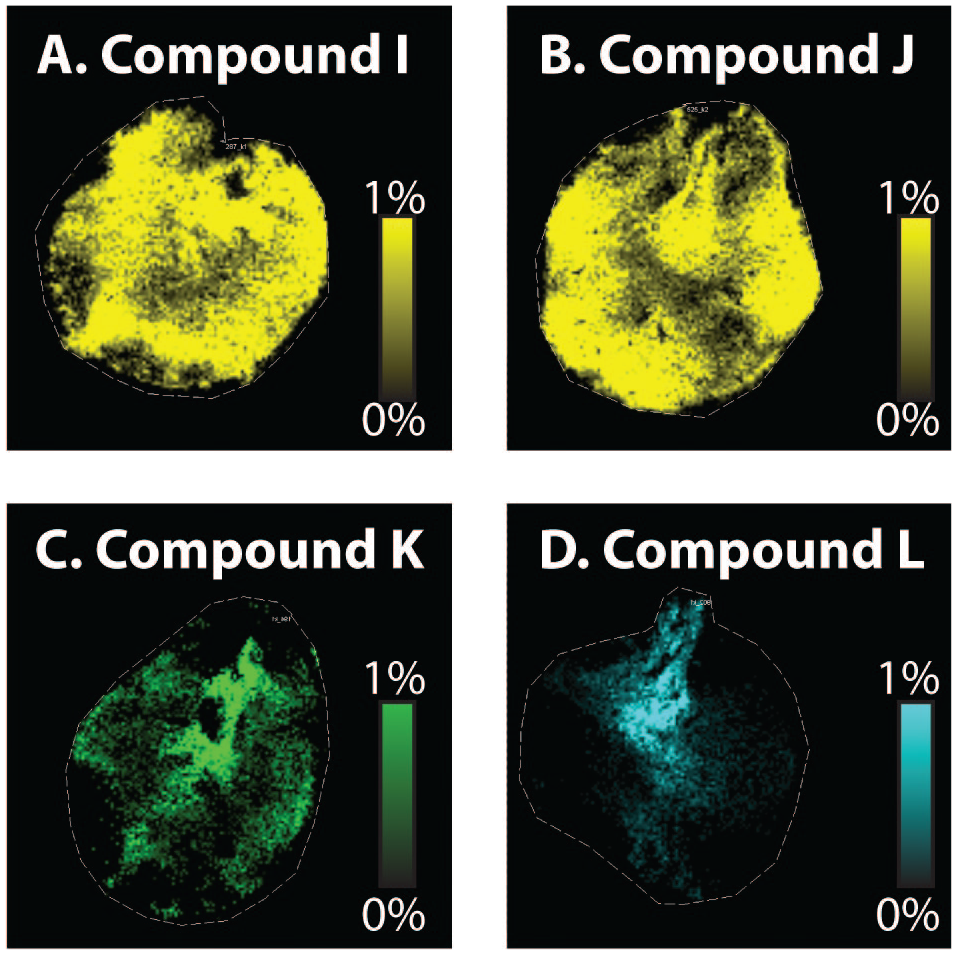
Applying IV infusion with MALDI-MSI approach to project renal toxicity outcome of newly designed molecules. MALDI-MSI results of compound I (A) and compound J (B) showing compounds distributed throughout the kidney section. Compound K (C) distributed more to the renal papilla but still showing distribution in renal cortex. Compound L (D) distributed only in the renal papilla and inner papilla region.
Additional benefits of MALDI-MSI studies: Endogenous biomolecule markers outlining histological features and the power of the HRAM instrument
In addition to the detection of drug distribution in the kidney, MALDI-MSI has the ability to simultaneously detect hundreds of endogenous molecules within the mass window of the experiment that can be used as markers to outline histological regions of the kidney. Figure 5 shows the dataset acquired in rat kidney with the administration of compound G. Figure 5A is an H&E stained kidney section highlighting the subgross anatomy: renal papilla (P), inner medulla (I.M.), outer medulla (O.M.), and cortex (C). During the data interpretation of the MALDI-MSI result, we observed the distribution of several ions perfectly matched one or more subgross kidney regions and can be used as markers to outline histological features (Figure 5B-F). Ions with m/z 724.5508 (Figure 5B) and m/z 844.5227 (Figure 5F) outline the region of the cortex. An ion with m/z 725.5608 outlines the regions of both cortex and outer medulla (Figure 5C). An ion with m/z 739.4723 outlines the region of the inner medulla (Figure 5D), and an ion with m/z 826.5709 outlines the regions of the inner medulla and papilla (Figure 5E). Based on the accurate mass information, the ion with m/z 826.5709 was identified to be the lipid phosphatidylcholine 36:1, and the ion with m/z 844.5227 was identified to be the lipid phosphatidylcholine 38:6.
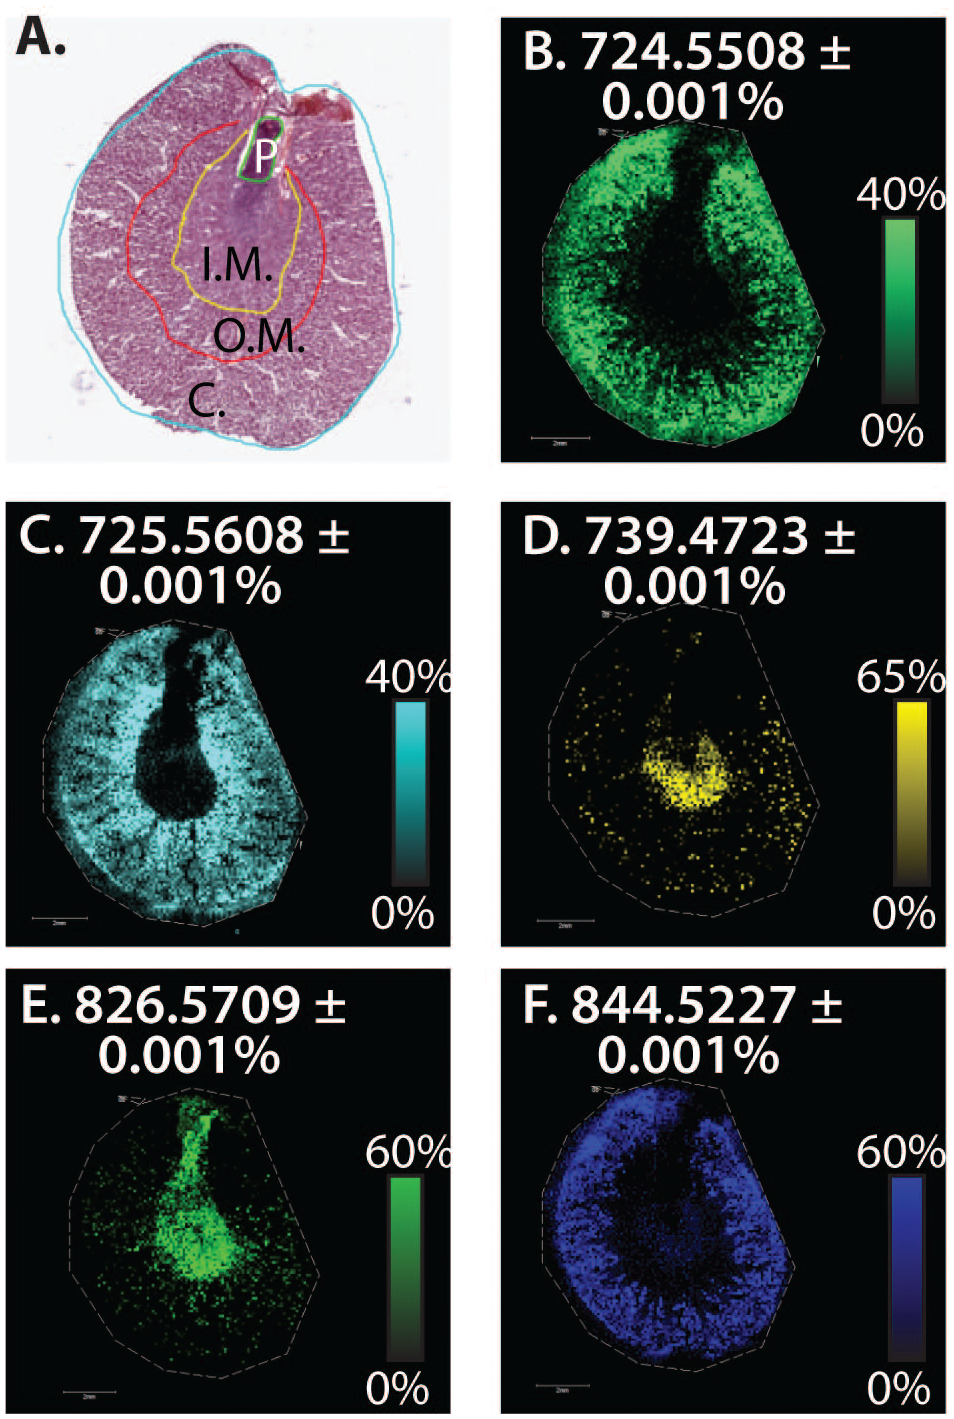
MALDI-MSI results of endogenous biomolecules which outlines the histologic regions of kidney cross-section from compound G dosed kidney. A. Representative H&E stained image of the kidney section. (P - papilla, I.M. – inner medulla, O.M. – outer medulla, C – cortex.) B. Endogenous biomolecule with m/z 724.5508 outlining the cortex region. C. Endogenous biomolecule with m/z 725.5608 outlining the cortex and outer medulla regions. D. Endogenous biomolecule with m/z 739.472 outlining the kidney inner medulla region. E. Endogenous biomolecule with m/z 826.5709 outlining the kidney inner medulla and papilla region, which is known to be phosphatidylcholine 36:1 based on accurate mass matching. F. Endogenous biomolecule with m/z 844.5227 outlining the cortex region, which is known to be phosphatidylcholine 38:6 based on accurate mass matching.
Another benefit of the MALDI-MSI studies is the high resolving power of the FTICR instrument (Figure 6). Heme, which forms the nonprotein part of hemoglobin, has an m/z value of 616.1768. It can be used as a marker of the lumen of blood vessels in MALDI-MSI studies. 7 The signature ion of compound G has a m/z value of 616.2296, which is 0.053 Da larger than heme. As shown in the average spectrum of the MALDI-MSI run (Figure 6A), the peak of heme (highlighted in red) and compound G (highlighted in yellow) can be baseline resolved due to the high resolving power of the FTICR instrument. In addition, an overwhelming heme signal was detected homogeneously in the kidney (Figure 6B) and spleen (Figure 6D). In contrast, compound G was only detected in the renal papilla (Figure 6C) and not detected at all in the spleen (Figure 6E), which is the expected distribution of compound G in the kidney as a non-renal toxic compound.
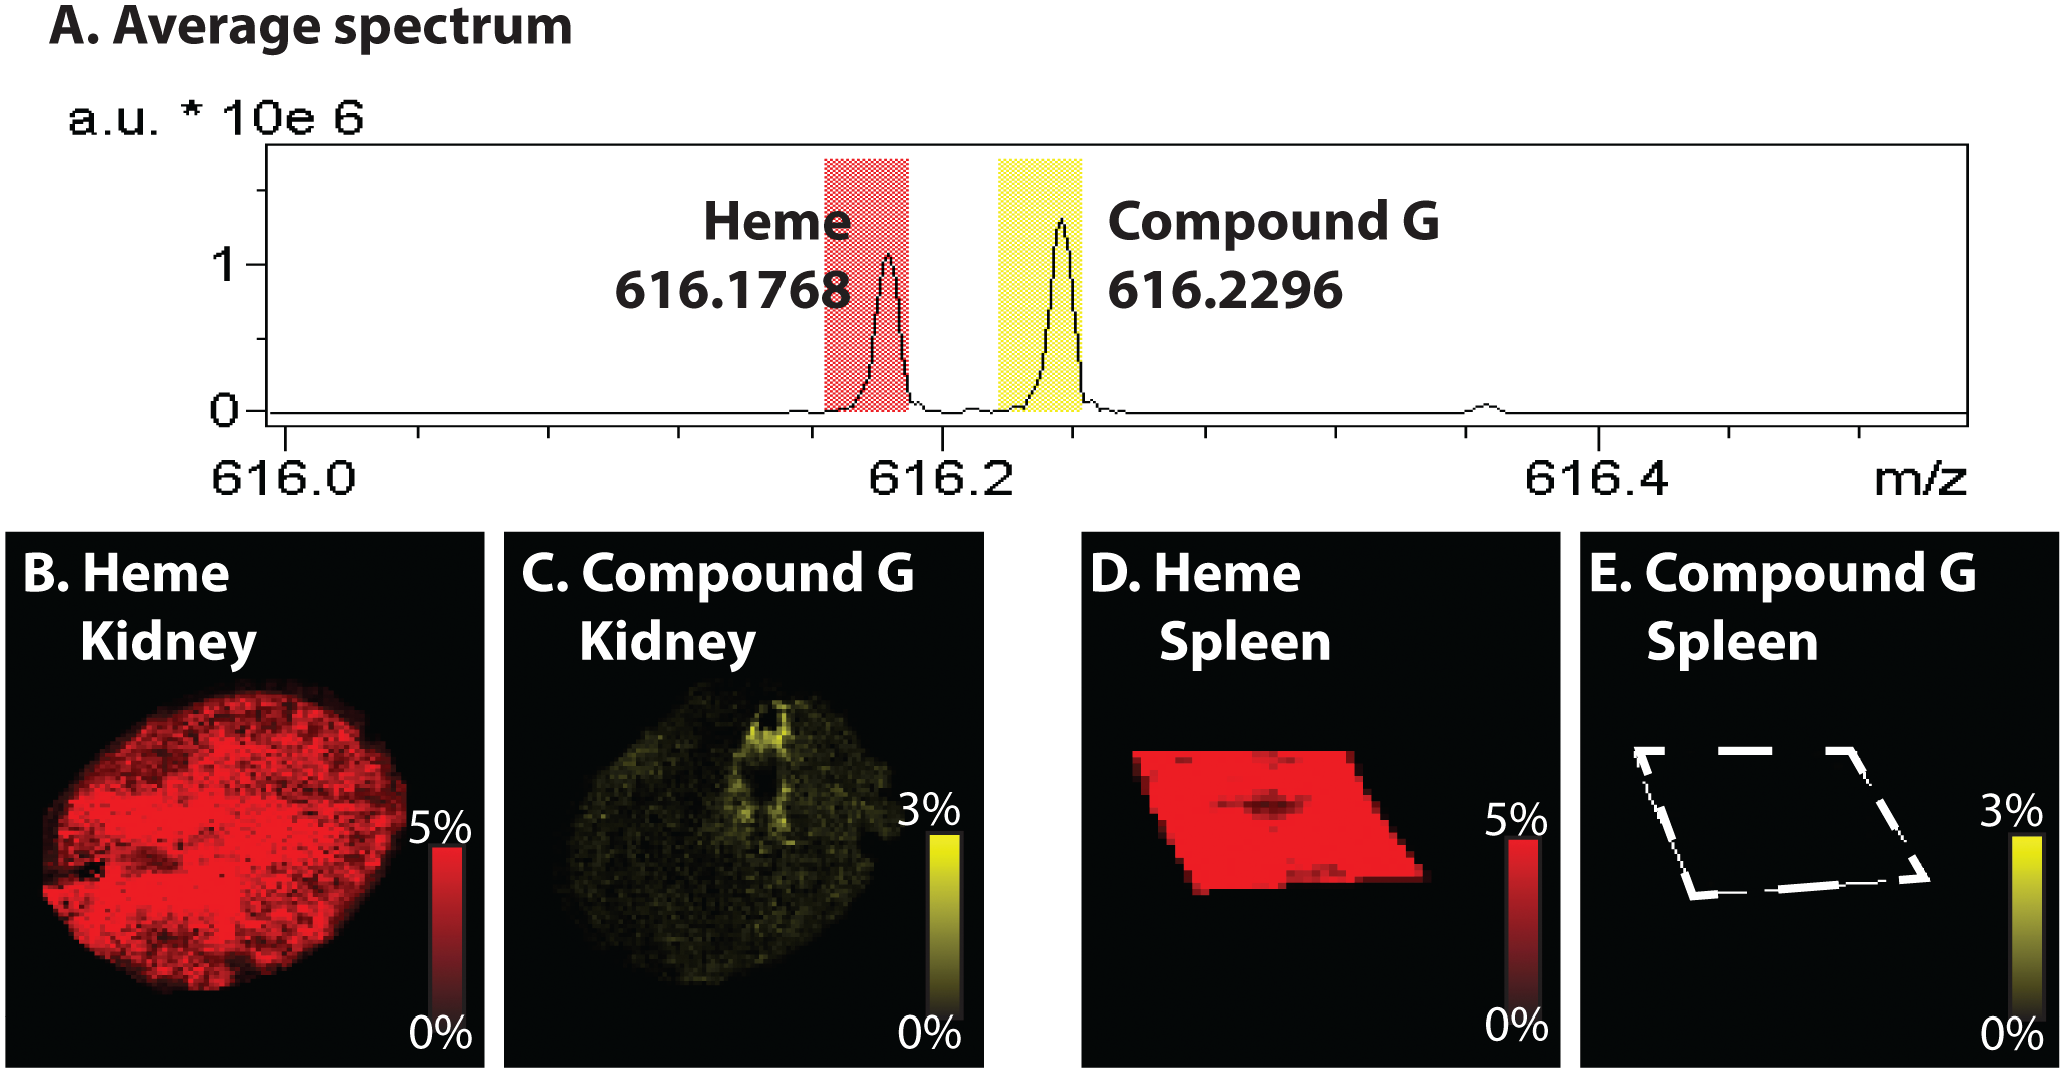
The power of HRAM instrument on separating drug (Compound G) and endogenous molecule (Heme) with close mass. A. Average spectrum of compound G with m/z 616.2296 and heme with m/z 616.1768 obtained from the kidney and spleen tissues of dosed rat. B & C. MALDI-MSI results of the kidney section showing the distribution of heme throughout the imaged area (B) and compound G located in the papilla region (C). D & E. MALDI-MSI results of the spleen section showing the distribution of heme throughout the imaged area (D). No compound G was detected in spleen (E).
Discussion
During the lead identification and optimization stages of drug discovery, it is essential to develop assays that are time and resource-efficient for effective compound triaging. While a 4-day exploratory toxicity study can provide more definitive answers regarding nephrotoxicity, it is a resource-intensive assay that requires grams of compounds, more than ten animals, and an average turnaround time of 1 to 2 months. By leveraging the IV infusion and MALDI-MSI capabilities, we can evaluate the nephrotoxic potential using 10 to 20 mg of research compounds and two animals within one week.
In the IV infusion and MALDI-MSI studies using compounds with known nephrotoxic outcomes, we have observed a notable trend. Nephrotoxic compounds tend to distribute to the renal cortex or outer medulla regions. Conversely, compounds with negative nephrotoxicity results typically had limited distribution to the renal papilla region. The cortical distribution of nephrotoxic compounds correlated with the observed histomorphologic changes, where tubular epithelial degeneration and tubular granular casts occurred in a dose-dependent manner, primarily within the renal cortex. This is consistent with the fact that the renal cortex contains the proximal and distal parts of the tubules, making it susceptible to drugs that accumulate in the proximal tubular cells. Additionally, the elimination of antibacterial drug candidates tends to occur primarily through glomerular filtration within the renal cortex, resulting in potential drug accumulation and subsequent toxicity to renal cells. In contrast, drugs distributed primarily to the papilla region are less likely to induce toxicity. The renal papilla connects the renal nephron to the renal pelvis and is responsible for transporting urine into the collecting ducts. With lower cell density in the papilla region and limited proximal tubular reabsorption, the exposure of renal cells to toxic compounds is reduced. In these studies, two rats were used for each condition, and the same tissue distribution patterns were observed for both animals. Therefore, we believe using one animal is enough for this type of screening analysis. Adding one more animal per compound could be helpful to confirm the distribution pattern, but not necessary.
In this case, the serum creatinine and blood urea nitrogen, which are kidney toxicity biomarkers, show minimal changes in clinical pathology testing. Therefore, drug distribution in the kidney section is the key to suggesting potential nephrotoxicity. MALDI-MSI offers advantages over other technologies, such as Raman and infrared microspectroscopy and SEM/EDX to identify crystals in the kidney and map biomolecule distributions. Raman and infrared microspectroscopy requires reference standards, which might not be available during the investigation. SEM/EDX could be useful in identifying counter ions that colocalize with the crystal, but not in revealing the identity of the crystal. Therefore, we agree with Lenz et al. 6 that MALDI-MSI can be used as the first-line methodology in characterizing crystal formation in the kidney. At the same time, it is worth noting that the sensitivity of MALDI-MSI is strongly affected by compound structure, biological matrix effect, and instrumentation platform. Therefore, method development should be thoroughly performed and evaluated.
The introduction of the Kp value provides additional information to facilitate compound triaging. The Kp value is the tissue-to-plasma partition coefficient, which is calculated by dividing the measured average tissue signal intensity by plasma signal intensity. The kidney Kp value represents the ratio of drug concentration in the kidney to the concentration in plasma, which provides insights into the relative distribution of a drug candidate to the kidney compared with plasma. A higher Kp value indicates a greater accumulation of the drug in the kidney, which can potentially lead to increased kidney-specific toxicity. In our study, we observed that most compounds with confirmed nephrotoxicity had Kp values significantly greater than 1, and vice versa. These investigations allowed us to establish structure-activity relationships in our chemical series and prioritize compounds with a reduced nephrotoxicity potential for advanced safety profiling using a resource-sparing approach.
Additionally, the MALDI-MSI studies revealed molecular biomarkers that delineate subgross anatomical regions. The two identified ions belong to the phosphatidylcholine lipid family, which is a major component of cell membranes. Phosphatidylcholines with different lengths of side chains and number of double bonds are present in different subregions of the kidney and play essential roles in membrane trafficking and maintaining cellular integrity. These ions, serving as histological markers, can assist in identifying subgross regions in the kidney without the need for additional H&E-stained sections. In our current workflow, we acquired one section for MALDI-MSI, and its adjacent section for H&E staining to accurately identify subregions. However, the two workflows required different section thicknesses, types of glass slides, and subsequent steps. By using the histology marker ions to identify the subgross structures within a kidney, we can omit the H&E staining steps in future imaging runs, improving the efficiency and turnaround time of the MALDI-MSI workflow.
Another advantage of MALDI-MSI highlights the power of HRAM instrumentation. Currently, the MALDI-FTICR instrument platform used in this study provides the highest resolving power and is capable of resolving isotopic fine structure. 9 Although our case did not involve the extreme scenario of separating isotopic fine structure, it is essential to have good mass accuracy and high resolving power to distinguish analyte signals from the overwhelming and ubiquitous heme signal. Both the kidney and spleen are highly perfused organs, resulting in a strong heme signal that can mask our analyte signal. However, with the HRAM nature of MALDI-FTICR, heme and compound G are baseline resolved without any hint of signal interference.
In conclusion, this study demonstrates that MALDI-MSI is a powerful analytical tool for use in drug discovery and development, particularly when histomorphologic findings correlate with compound or metabolite distribution. The MALDI-MSI technique has been in use for about three decades and is widely applied in academic research. We are looking forward to seeing the increasing use of MALDI-MSI technology in the pharmaceutical industry to support various applications in the drug discovery and development process.
Footnotes
Acknowledgements
The authors would like to acknowledge Scott Fauty of Laboratory Animals Resources for performing dosing experiments and the current or previous colleagues at Merck & Co., Inc. for their contribution to this program.
Declaration of Conflicting Interests
The author(s) declared the following potential conflicts of interest with respect to the research, authorship, and/or publication of this article: All authors are employees of and own stock in Merck & Co., Inc.
Funding
The author(s) disclosed receipt of the following financial support for the research, authorship, and/or publication of this article: Funding for this research was provided by Merck & Co., Inc.