
Abstract
The Golden Syrian hamster is a well-characterized rodent model for severe acute respiratory syndrome-coronavirus-2 (SARS-CoV-2)-associated pneumonia. We sought to characterize the pulmonary disease course during SARS-CoV-2 infection (strain USA-WA1/2020) in the hamster model using micro-computed tomography (micro-CT) and compare radiologic observations with histopathologic findings. We observed a range of radiologic abnormalities, including ground glass opacities (GGOs), consolidations, air bronchograms, and pneumomediastinum. The appearance, distribution, and progression of these abnormalities in hamsters were similar to those observed in the lungs of coronavirus disease 2019 (COVID-19) patients by clinical CT and chest X-rays, and correlated with clinical signs and weight loss during the course of disease. Histopathological analysis of infected hamsters revealed lung pathology characteristic of COVID-19 pneumonia, and we observed a strong association between CT and histopathologic scorings. We also analyzed accumulation of air in the thoracic cavity by both manual and automated threshold-based segmentation and found that automated analysis significantly decreases the time needed for data analysis. Data presented here demonstrate that micro-CT imaging can be a major tool in preclinical investigative studies using animal models by providing early and detailed assessment of disease severity and outcomes.
Keywords
Introduction
Coronavirus disease 2019 (COVID-19) caused by severe acute respiratory syndrome-coronavirus-2 (SARS-CoV-2) has killed and infected millions of people across the globe since the beginning of the 2020 pandemic. Since the virus is primarily transmitted through the respiratory tract, pulmonary manifestations of COVID-19 are most prominent and include cough, shortness of breath, sputum production, respiratory failure, and acute respiratory distress syndrome (ARDS). 35 ARDS is characterized by acute onset of hypoxemia that does not respond to supplemental oxygen treatment, decreased lung compliance, acute onset of bilateral chest radiograph opacities, and characteristic pathological findings of diffuse alveolar damage (acute/exudative phase followed by organizing/proliferative phase), inflammation, and vascular injury. 27
Computed tomography (CT) is a widely used non-invasive imaging technique to detect tissue abnormalities, tumors, infection, or disease progression in both human and veterinary medicine. CT is a computer-enhanced X-ray procedure that offers a much higher level of detail by generating three-dimensional (3D) images of various body organs unlike two-dimensional (2D) images produced by regular X-ray imaging (radiography).24,41 Like regular radiography, however, CT can be harmful to animals especially at higher doses (potential DNA damage), can affect the size of tumors, and may not be suitable for distinguishing similar types of tissues. 24
Although the reverse transcription-polymerase chain reaction (RT-PCR) assay is considered the gold standard diagnostic tool for detecting SARS-CoV-2 infection, imaging tools such as chest CT and/or X-ray images have been frequently used in the clinics for a rough, but fast, preliminary diagnosis of COVID-19. In addition, radiological examination plays a critical role in clinical management of lung-associated abnormalities (or guides treatment) by assessing disease progression or resolution.11,32
The most common features of COVID-19 pneumonia detected by chest X-ray or CT are ground glass opacities (GGOs) and consolidation; however, these features are not specific for SARS-CoV-2 virus pneumonia and can be signs of different pathologies as described below. 32 In acute phase of COVID-19 pneumonia, a high-resolution CT pattern includes the presence of peripheral, subpleural, bilateral, and basal GGOs and consolidations. 13 Chest CT has a higher sensitivity for COVID-19 detection than chest X-ray as CT can demonstrate GGOs and consolidation early on, even in the absence of significant chest X-ray findings. Consolidation on CT scans or radiographs refers to one or more fairly homogenous opacities caused by replacing the air within the affected air spaces (by fluid, cells or other substances) and/or the thickening of the alveolar walls or interstitium, leading to pulmonary attenuation and obscuration of underlying pulmonary vessels or bronchial walls. 25 GGOs, on the other hand, represent a partial occupation of the airspace without obscuring underlying pulmonary vessels or bronchial walls, and hence produce only a minor increase in opacity/density. GGOs often appear earlier in the disease course, preceding the appearance of consolidations. 20 In some COVID-19 patients’ crazy-paving pattern (GGOs with superimposed interlobular septal thickening), reversed halo sign or atoll sign (focal ground-glass opacity with a peripheral ring of consolidation), and air bronchogram (gas-filled bronchi surrounded by alveoli filled with fluid, pus or other material) can be present. 6 These pulmonary abnormalities reflect the presence of a various number of infectious or non-infectious pulmonary abnormalities including airspace diseases (pneumonia, pulmonary edema or hemorrhage, atelectasis), interstitial disease (interstitial thickening or fibrosis), or cancer. Histopathological analysis is the gold standard for diagnosing and confirming the type of pulmonary disease (alveolar or interstitial) or cancer.
Findings not affecting the lung parenchyma such as pleural effusions, lymphadenopathy, pneumothorax (air accumulation in the pleural space), and pneumomediastinum (air accumulation in the mediastinum) are less common during COVID-19 pneumonia and can also be detected by chest X-ray or CT.17,32,38 Air leakage into pleural or mediastinal spaces may occur secondary to alveolar damage by inflammation or increased pressure from the pronounced coughing during viral infection.
The COVID-19 outbreak necessitated rapid development of several animal models, including among others, mice, ferrets, hamsters, and non-human primates. Since animal models could recapitulate the clinical and pathological features of COVID-19 in humans, they have played a crucial role in studying viral pathogenesis and transmission and developing antiviral drugs and vaccines.8,10 The golden Syrian hamster (Mesocricetus auratus) has become the most popular and well-characterized small animal model due to their small size, ease of housing/care, and recapitulation of characteristic features of moderate COVID-19 disease in humans.8,29 Hamsters develop a spectrum of pulmonary disease severity similar to humans and reflect similar demographic differences such as more severe disease in aged and male animals.19,30 They also show similar clinical signs of labored breathing, disease transmission between individuals, and development of pneumonia.5,7
Micro-CT is a miniature version of clinical CT with significantly higher spatial resolution (voxel size ≤100 microns).12,24 Because of the smaller size and higher resolution, micro-CT is well-suited for imaging smaller animal models in biomedical research and hence considered a preclinical analogue of clinical CT. Micro-CT is considered fast (scanning duration ranges from few minutes to hours) compared with some other techniques, such as histology, which can take a few days to weeks. In the small animal modeling space, this technique is increasingly being used to characterize various lung abnormalities. 4 The use of micro-CT to assess lung pathology in the COVID-19 modeling space has gained significant traction lately.1,5,16,18,19,23,33,34,36,37 CT imaging characteristics and distribution among two commonly used animal models of COVID-19 (e.g., Syrian hamsters and non-human primates) have generally mirrored imaging of human lung abnormalities.18,19,34,36 Like human COVID-19 disease, GGOs and consolidations are most common CT abnormalities in these animal models. While most lung abnormalities resolve within 2 weeks in non-human primates who generally develop mild to rarely moderate disease, 36 mild CT abnormalities persisted at 2-week post-infection among infected hamsters as they develop moderate to severe disease. 19 In this article, we have sought to perform an in-depth characterization of COVID-19 disease in golden Syrian hamsters by taking serial micro-CT thoracic scans over the course of disease and then compare, and confirm the pulmonary radiologic abnormalities with histopathologic evaluation. In addition, we performed automated as well as manual segmentation of the micro-CT scans for the first time in a COVID-19 animal model to quantitatively evaluate the thoracic volume and the presence or absence of pneumomediastinum.
Materials and Methods
Virus
SARS-CoV-2 virus stocks were propagated on Vero E6 cells within an appropriate Biosafety Level 3 facility. Stock SARS-CoV-2 WA-1/2020 strain virus (BEI) was diluted to 100 µL/ with 4.90 mL of infection media, consisting of Dulbecco’s Modified Eagle Medium (DMEM) with 1% heat-inactivated fetal bovine serum (HI-FBS) and 100 U/mL PenStrep. After 20 minutes of incubation at 37°C, 5% CO2, 15 mL of infection media was added to each flask to bring the total volume up to 20 mL. Flasks were incubated again for 48 to 72 hours, or until severe (> 50%) cytopathic effect (CPE) occurs. Cell supernatant was then collected, centrifuged, aliquoted, and frozen for future use. To prepare diluted virus samples, the stock virus with a titer of 1.18 × 10⁸ plaque-forming unit/mL (PFU/mL) was thawed on the day of infection and diluted to 2 × 10⁶ PFU/mL for use in these studies.
Animals
All procedures performed on animals were in accordance with regulations, conducted in compliance with the Guide for the Care and Use of Laboratory Animals (National Research Council), and reviewed and approved by Pfizer’s Institutional Animal Care and Use Committee (IACUC). All animals were socially housed (2 per cage) under specific pathogen free conditions, in disposable (Innovive) individually ventilated caging with free choice food and water and corncob bedding. A running wheel, plastic hut and shredded paper were provided as shelter and enrichment. Female golden Syrian hamsters (Envigo), 8 to 10 weeks of age, were administered virus or phosphate-buffered saline (PBS) at study start, challenge day 0. A total of 1 × 10⁵ PFU of SARS-CoV-2 USA-WA-1/2020 strain in 50 µL DMEM with 1% HI-FBS media was given dropwise intranasally under ~3% to 4% inhaled isoflurane anesthesia. Animal body weights, body temperatures, and clinical observations were recorded at least once daily from three days prior to infection through the end of the study. Body weights were recorded twice daily starting at post-infection day 6 until the end of the study. Two mock-infected animals were taken down early at 5-day post-infection (dpi) for logistical reasons (to test various procedures). All other animals were euthanized at 9 dpi. During necropsy, lung tissues (right and left lobes) were collected in a uniform way, examined, and weighed. For histopathology, properly inflated lung lobes were fixed with 10% PBS-buffered formalin.
Micro-CT Imaging and Analysis
Micro-CT imaging was performed to evaluate lung abnormalities. For imaging, animals were anesthetized and maintained under 2% to 3% isoflurane anesthesia in oxygen under negative pressure (−0.1 to −3 mbar) in sealed tubes (MILabs rat beds) with integrated temperature-controlled heat support throughout the imaging session. Animals were not intubated or ventilated.
Images were acquired with a MILabs U-CT 6 -UHR (MILabs, the Netherlands) using a 0.5 cm Al filter at 160 μA, 60 kV, 40 μm resolution, and a step size of 0.5 per projection for 360° with scan time of ~5 minutes. Images were reconstructed with a 40 μm voxel size, Gaussian smoothing with a kernel size of 1.5, and a pixel matrix of approximately 750 × 650 × 600 (MILabs Reconstruction 12.00). Micro-CT scan identifications were blinded and scans were evaluated by three different methods: manual qualitative analysis and semiquantitative scoring by a board-certified veterinary radiologist, quantitative analysis by manual image segmentation, and a fully automated quantitative analysis using MLAST (Mouse Lung Automated Segmentation Tool). 28
The radiologist used Amira 6.3 image analysis software (ThermoFisher Scientific, Waltham, MA) for CT scoring. CT severity scores were graded on a scale of 0 to 4 based on distribution (% area involvement) of lung abnormalities (0 = normal; 1 = 1%-25%, 2 = 26%-50%, 3 = 51%-75%; 4 = 75%-100%). Size and severity of lung abnormalities were also considered while determining severity score. Each lung lobe was evaluated individually and assigned a score; final score for an animal was a sum of all lobe scores.
Manual segmentation was performed using Imalytics Preclinical 3.0 image analysis software (Gremse-IT) using thresholding (Hounsfield units): −800 to −200 for aerated lung tissue and <−800 for air as performed previously. 28 The caudal boundary of the thorax was set at the diaphragm and was excluded from segmentation. Automated analysis was performed as described in Montgomery et al 28 With some adjustments. Briefly, the MLAST algorithm segments the thoracic cavity using the ribcage, then thresholds the voxels within the thoracic cavity into three tissue types according to radiopacity. In this study, a fourth low-opacity tissue type was added to classify the air present in the scans.
Histopathology
Lung lobes were collected for histopathology at necropsy. Tissue samples were fixed in 10% neutral-buffered formalin and processed into paraffin tissue blocks. Tissue blocks were sectioned to 5 μm and stained with hematoxylin and eosin (Cat. No. 7212 & 7111; Fisher scientific, New York, NY) as per manufacturer’s protocol. Samples were blinded and microscopic evaluation was performed by a board-certified veterinary pathologist. Histopathology severity scores were graded on a scale of 0 to 5 based on distribution (% area involvement) of lung abnormalities (0 = normal; 1 = 1%-10%, 2 = 11%-30%, 3 = 31%-60%, 4 = 61%-80%, 5 = 81%-100%). Size and severity of lung abnormalities were also considered while determining severity score. All lung lobes from an animal were evaluated, and a final score was assigned.
Immunohistochemistry
Formalin-fixed, paraffin-embedded (FFPE) tissue sections were mounted on SuperFrost Plus slides (Cat. No. 12-550-15; Thermo Fisher Scientific, Waltham, MA) and sectioned to a thickness of 5 µm for immunohistochemistry (IHC) analysis.
The IHC was performed on the Leica Bond RX (Leica Biosystems, Buffalo Grove, IL) using a mouse monoclonal antibody directed against the SARS-CoV-2 nucleocapsid protein (N) (Cat. No. bsm-49131M; Bioss, Woburn, Massachusetts, clone 8G8A, 1/200 dilution). Tissues sections were pretreated with Epitope Retrieval 2 (Cat. No. AR9640; Leica Biosystems) for 20 minutes followed by primary antibody incubation for 30 minutes and detection with 3,3’-diaminobenzidine (DAB) (DS9800; Leica Biosystems). A mouse IgG2b κ isotype control was also tested for nonspecific staining (Cat. No. 557351; BD Biosciences, San Jose, CA). All slides were counterstained with hematoxylin, dehydrated through graded ethanol and xylene, and permanently mounted with coverslips.
Statistical Analysis
CT scores and histopathology scores were compared using simple linear regression. All data were graphed, and simple linear regressions were performed in Prism GraphPad (version 8.4.2).
Results
Clinical Features and Necropsy Observations
Hamsters were challenged with SARS-CoV-2 USA-WA1/2020 isolate (virus-infected, n = 4) or sterile PBS (mock-infected, n = 4) by the intranasal route. Images were taken 2 days prior to challenge and again at 2, 4, 6, 8 dpi, and immediately prior to euthanasia on 9 dpi (Figure 1A).
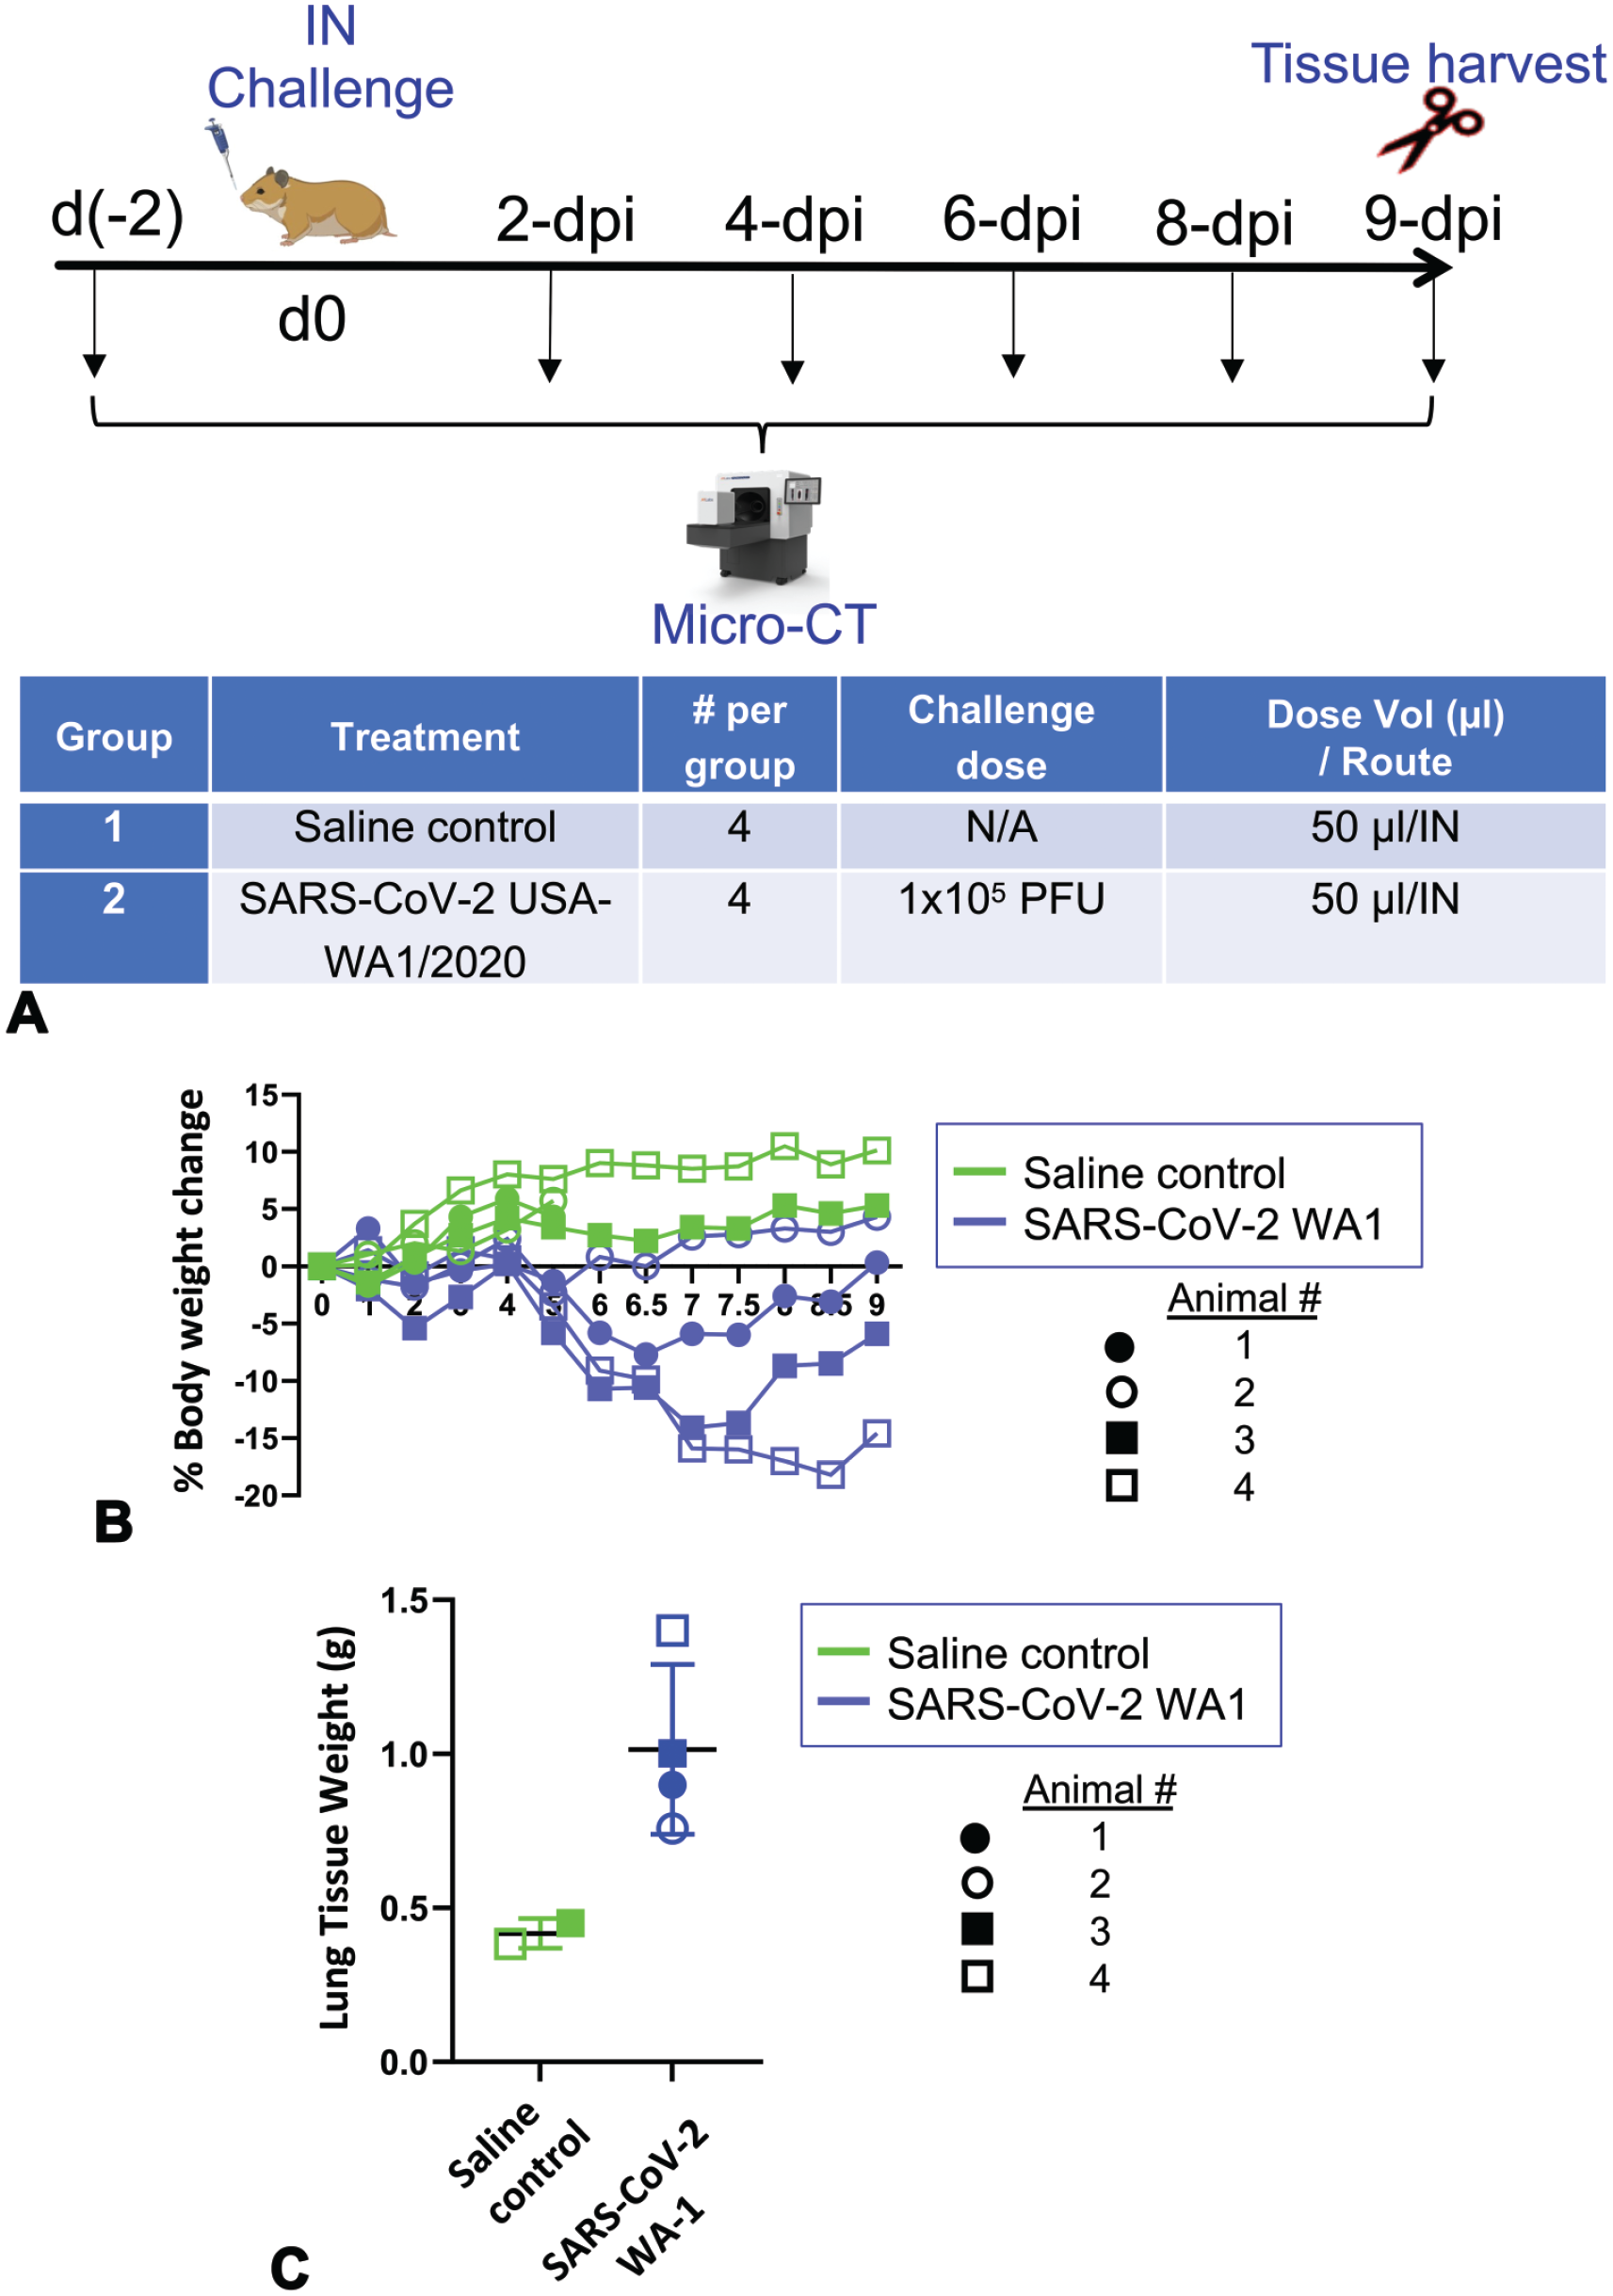
Imaging study design and model validation. A. Design of micro-CT imaging study in SARS-CoV-2 golden Syrian hamster intranasal infection model. Two mock-infected controls (animals 1 and 2) were imaged three times (once before and 2 times after infection) before being euthanized on 5 dpi. All other hamsters were imaged 6 times (once before and 5 times after infection) before being euthanized on 9 dpi. Lungs were harvested for histopathology from all hamsters. B & C. Body weight changes (B) and terminal lung weight (C) of SARS-CoV-2-infected and mock-infected hamsters. In each group, animal 1 is represented by solid circles, animal 2 is represented by open circles, animal 3 is represented by solid squares, and animal 4 is represented by open squares. IN = intranasal; d, days; dpi, days post-infection.
We have previously characterized virus infection and/or replication in the upper and lower respiratory tracts in hamsters through real-time quantitative PCR, IHC, in situ hybridization, and virus plaque forming assays. 9 Since all lung lobes were collected in formalin for histopathological evaluation in this study, virus infection in the lungs was confirmed by IHC (described below). Consistent with previous observation, SARS-CoV-2-infected, but not mock-infected, hamsters developed lethargy, ruffled fur, rapid breathing, and progressive mean body weight loss (approximately 15%) until 7 to 8 dpi, after which time body weight slightly increased (Figure 1B). At necropsy, whole lung weights increased in SARS-CoV-2 challenged animals (Figure 1C) and lung lobes were, edematous, and multifocally mottled dark red.
Micro-CT Imaging Reveals Pulmonary Abnormalities in SARS-CoV-2-Infected Animals
Analysis of micro-CT scans acquired over the course of the study revealed lung abnormalities in all infected animals that were not present in the mock-infected animals (Figure 2A). Lung abnormalities first appeared at 4 dpi as ill-defined, patchy GGO with peribronchial/perivascular, subpleural, basal, bilateral distributions. These abnormalities then progressed to a more severe, rounded, multilobular GGOs with multifocal areas of consolidation and air bronchogram by 6 dpi. Most severe abnormalities (largely consolidations) were observed by 8 dpi and correlated with highest CT severity scores (Figure 2B). Recovery of radiologic abnormalities began 8 to 9 dpi, with gradual decrease in consolidations, except for two infected animals (animals 3 and 4) who had more severe lung abnormalities at all time points. These two more affected animals also developed a pneumomediastinum around 6 dpi that appeared to resolve completely (infected animal 3) or markedly (infected animal 4) by 9 dpi (Figure 2A).
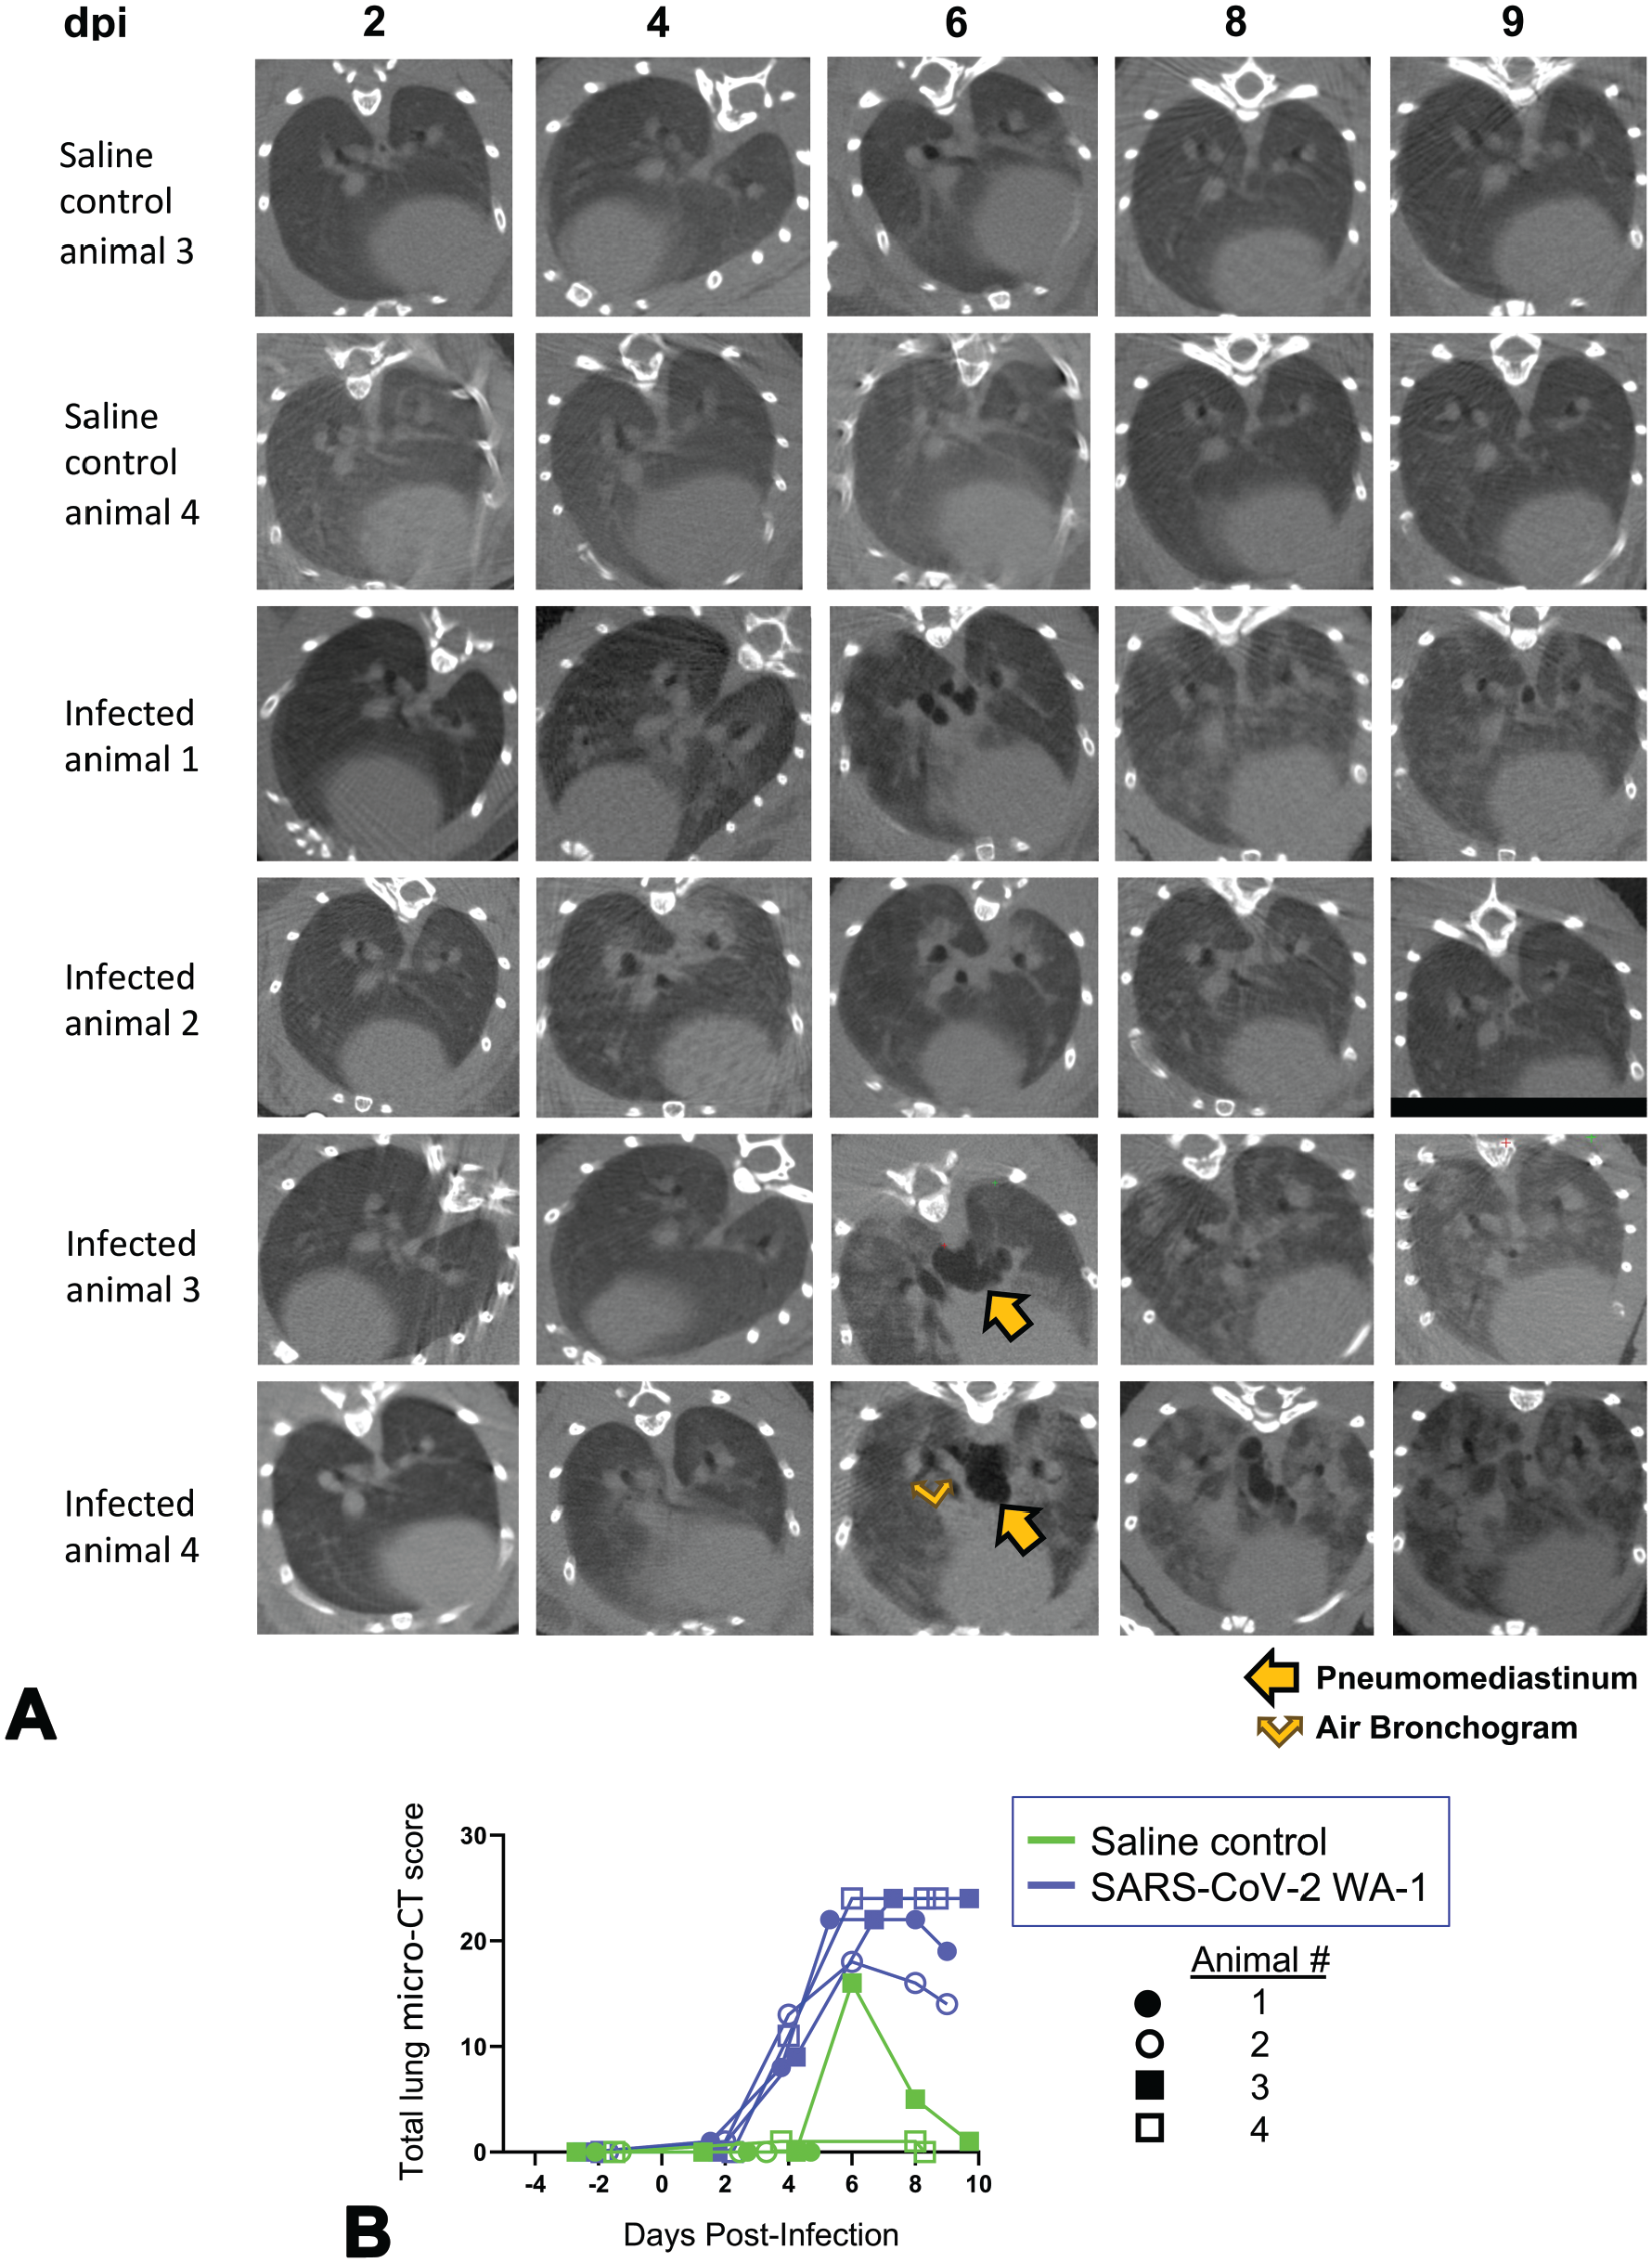
Micro-CT imaging of the lungs of mock- and SARS-CoV-2-infected hamsters. A. Axial CT images of the thorax in mock-infected controls and virus-infected animals from 2 to 9 dpi. Lung abnormalities were first detected 4 dpi, and the most severe changes were observed by 8 dpi. Pneumomediastinum is labeled by arrow and air bronchogram by split arrow. B. CT severity score of mock-infected control and virus-infected hamsters from 2 to 9 dpi. Dpi, days post-infection.
Of note, one uninfected animal presented with a CT score at 6 dpi only (Figure 2B). Upon further observation, the smaller size, cranioventral focal location, and a well-defined appearance of the abnormality were consistent with an aspiration pneumonia. We speculate this animal may have aspirated a foreign substance that was documented on the scan at 6 dpi, but rapidly resolved by 9 dpi. Accordingly, changes in the body weight or terminal lung weight were unremarkable and there were no noticeable gross pathology and histopathology findings in the lungs of this animal.
Characterization of Pneumomediastinum With Manual and Fully Automated Threshold-Based Segmentation
To further characterize the pneumomediastinum, we utilized both manual (Figure 3A) and automated (Figure 3B and C) threshold-based segmentation analysis to determine the volume of air present in the mediastinal space of infected animals over the course of the study and compared it with control animals. While the volume of air in the mediastinum remained consistent throughout the study for most animals, the most severely affected animals, infected animals 3 and 4, showed unexpected increases. Infected animal 3 developed a small pocket of air in the mediastinal spaces on 6 dpi that resolved by 9 dpi (Figure 3A, upper panel). Infected animal 4 developed a more severe pneumomediastinum around 6 dpi, which was still present on day 9 but appeared markedly reduced (Figure 3A, lower panel). The amount of body weight loss (Figure 1B) correlated with the severity of the pneumomediastinum in these animals (Figure 3A-C).
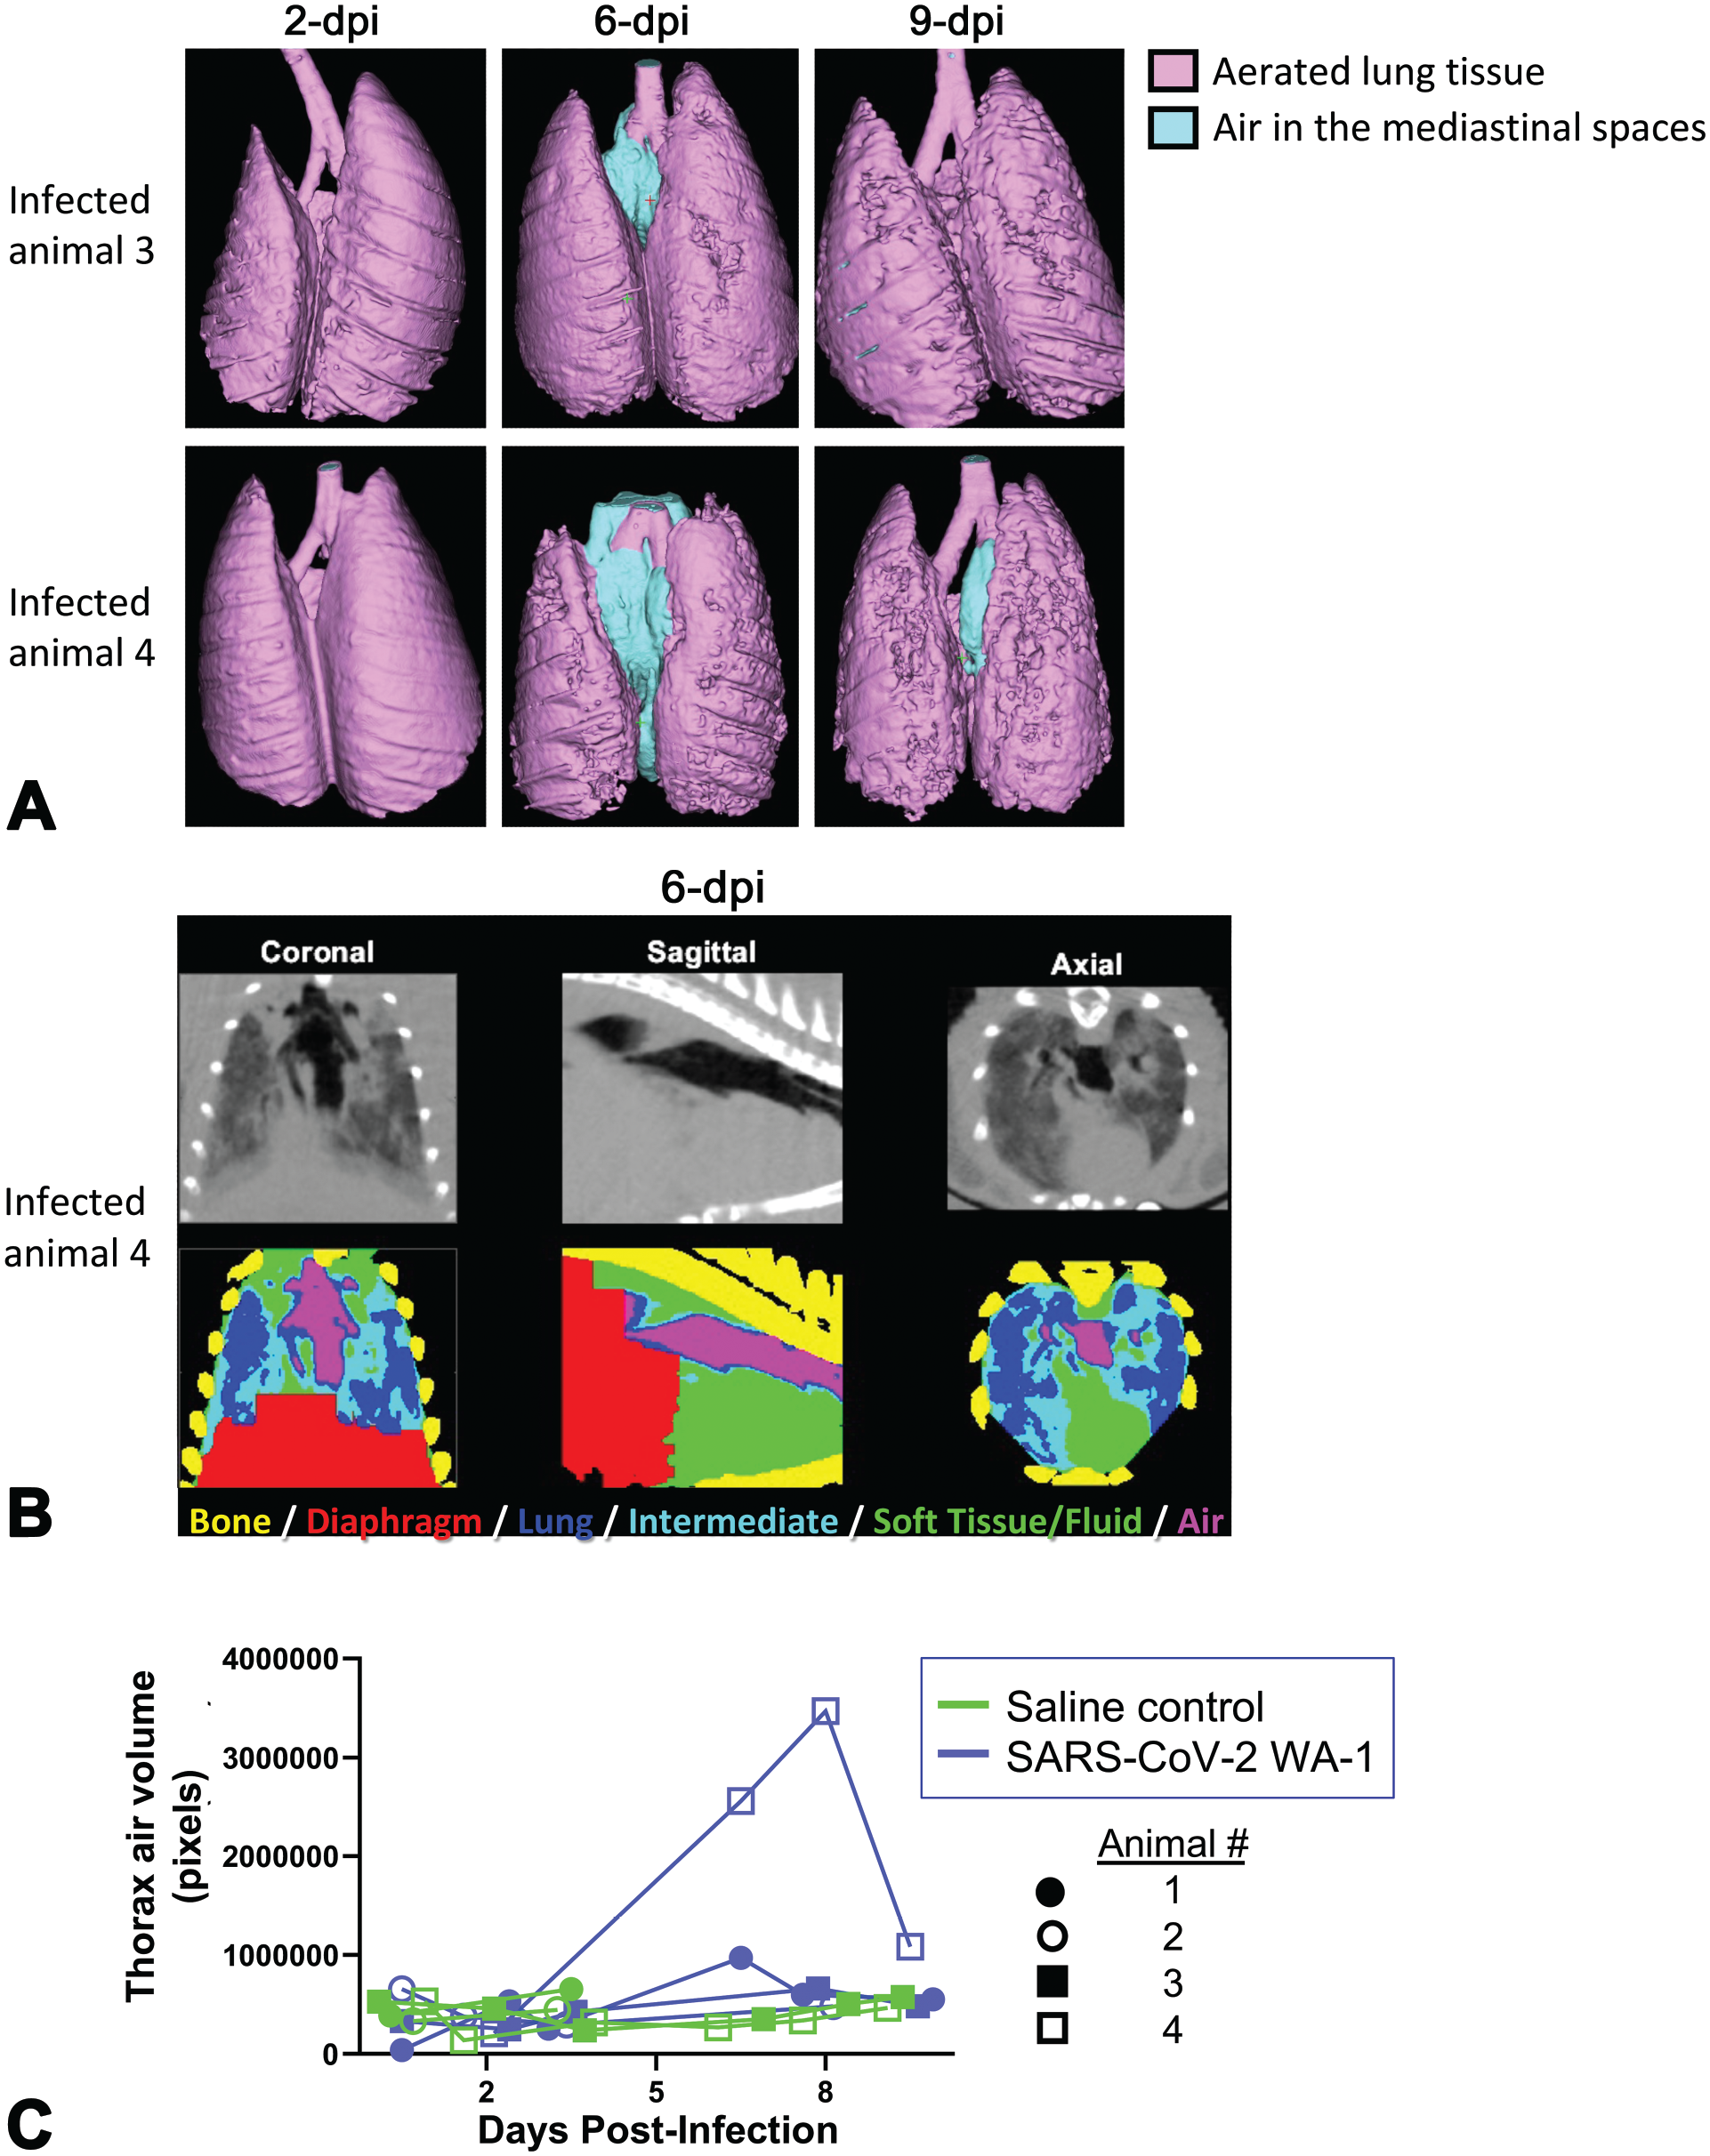
Analysis of pneumomediastinum with manual and automated segmentation (MLAST). A. Three-dimensional renderings of segmented aerated lung tissue (pink) and air (light blue) based on thresholding (Hounsfield units) are shown for infected animals 3 and 4 on 2, 6, and 9 dpi. B. Automated segmentation (MLAST) QC panel shown for infected animal 4 on 6 dpi with air segmentation representing pneumomediastinum shown in magenta. C. Volume of air within the thorax of individual animals over the course of the study, as determined via automated segmentation, indicating accumulation of air in the mediastinal space in infected animals 3 and 4. Dpi, days post-infection.
We obtained similar results from the automated segmentation analysis using MLAST (Figure 3B and C). Segmentation of four basic tissue types based on density (bone, soft tissue, aerated lung, air) is shown in the scan of thoracic cavity of infected animal 4 from 6 dpi with the notable air accumulation in the mediastinal space indicating pneumomediastinum (Figure 3B). The automated air segmentation from 2 to 9 dpi showed a spike in the most severely affected animal on days 6 to 8 (Figure 3C).
Histopathologic Evaluation of Lungs From SARS-CoV-2−Challenged Hamsters Trends With Radiologic Evaluation
To confirm the pulmonary abnormalities detected by micro-CT, lungs from SARS-CoV-2-infected and mock-infected animals at 9 dpi were microscopically evaluated. Consistent with micro-CT observations (GGOs and consolidations), SARS-CoV-2-infected animals had multifocal to coalescing areas of pulmonary consolidations characterized by extensive hypertrophy and hyperplasia of bronchiolar and alveolar (type II pneumocyte) epithelia along with increases in inflammatory cells (predominantly macrophages and lymphocytes with fewer neutrophils) (Figure 4A-C). IHC labeling for N (Figure 4D) was present in scattered pneumocytes in the regions of inflammation confirming virus infection in situ. These histopathological changes were consistent with our earlier observations in this model, 9 and were responsible for increased pulmonary density that appeared as hazy gray areas (GGOs) or homogeneous opacities (consolidations) by micro-CT. Consistent with micro-CT observations at 9 dpi, histopathological lesions were higher in infected animals 3 and 4 and lower in infected animal 2 (Figure 4E). Accordingly, the overall correlation between micro-CT and histopathology scores was r = 0.87 (Figure 4F).
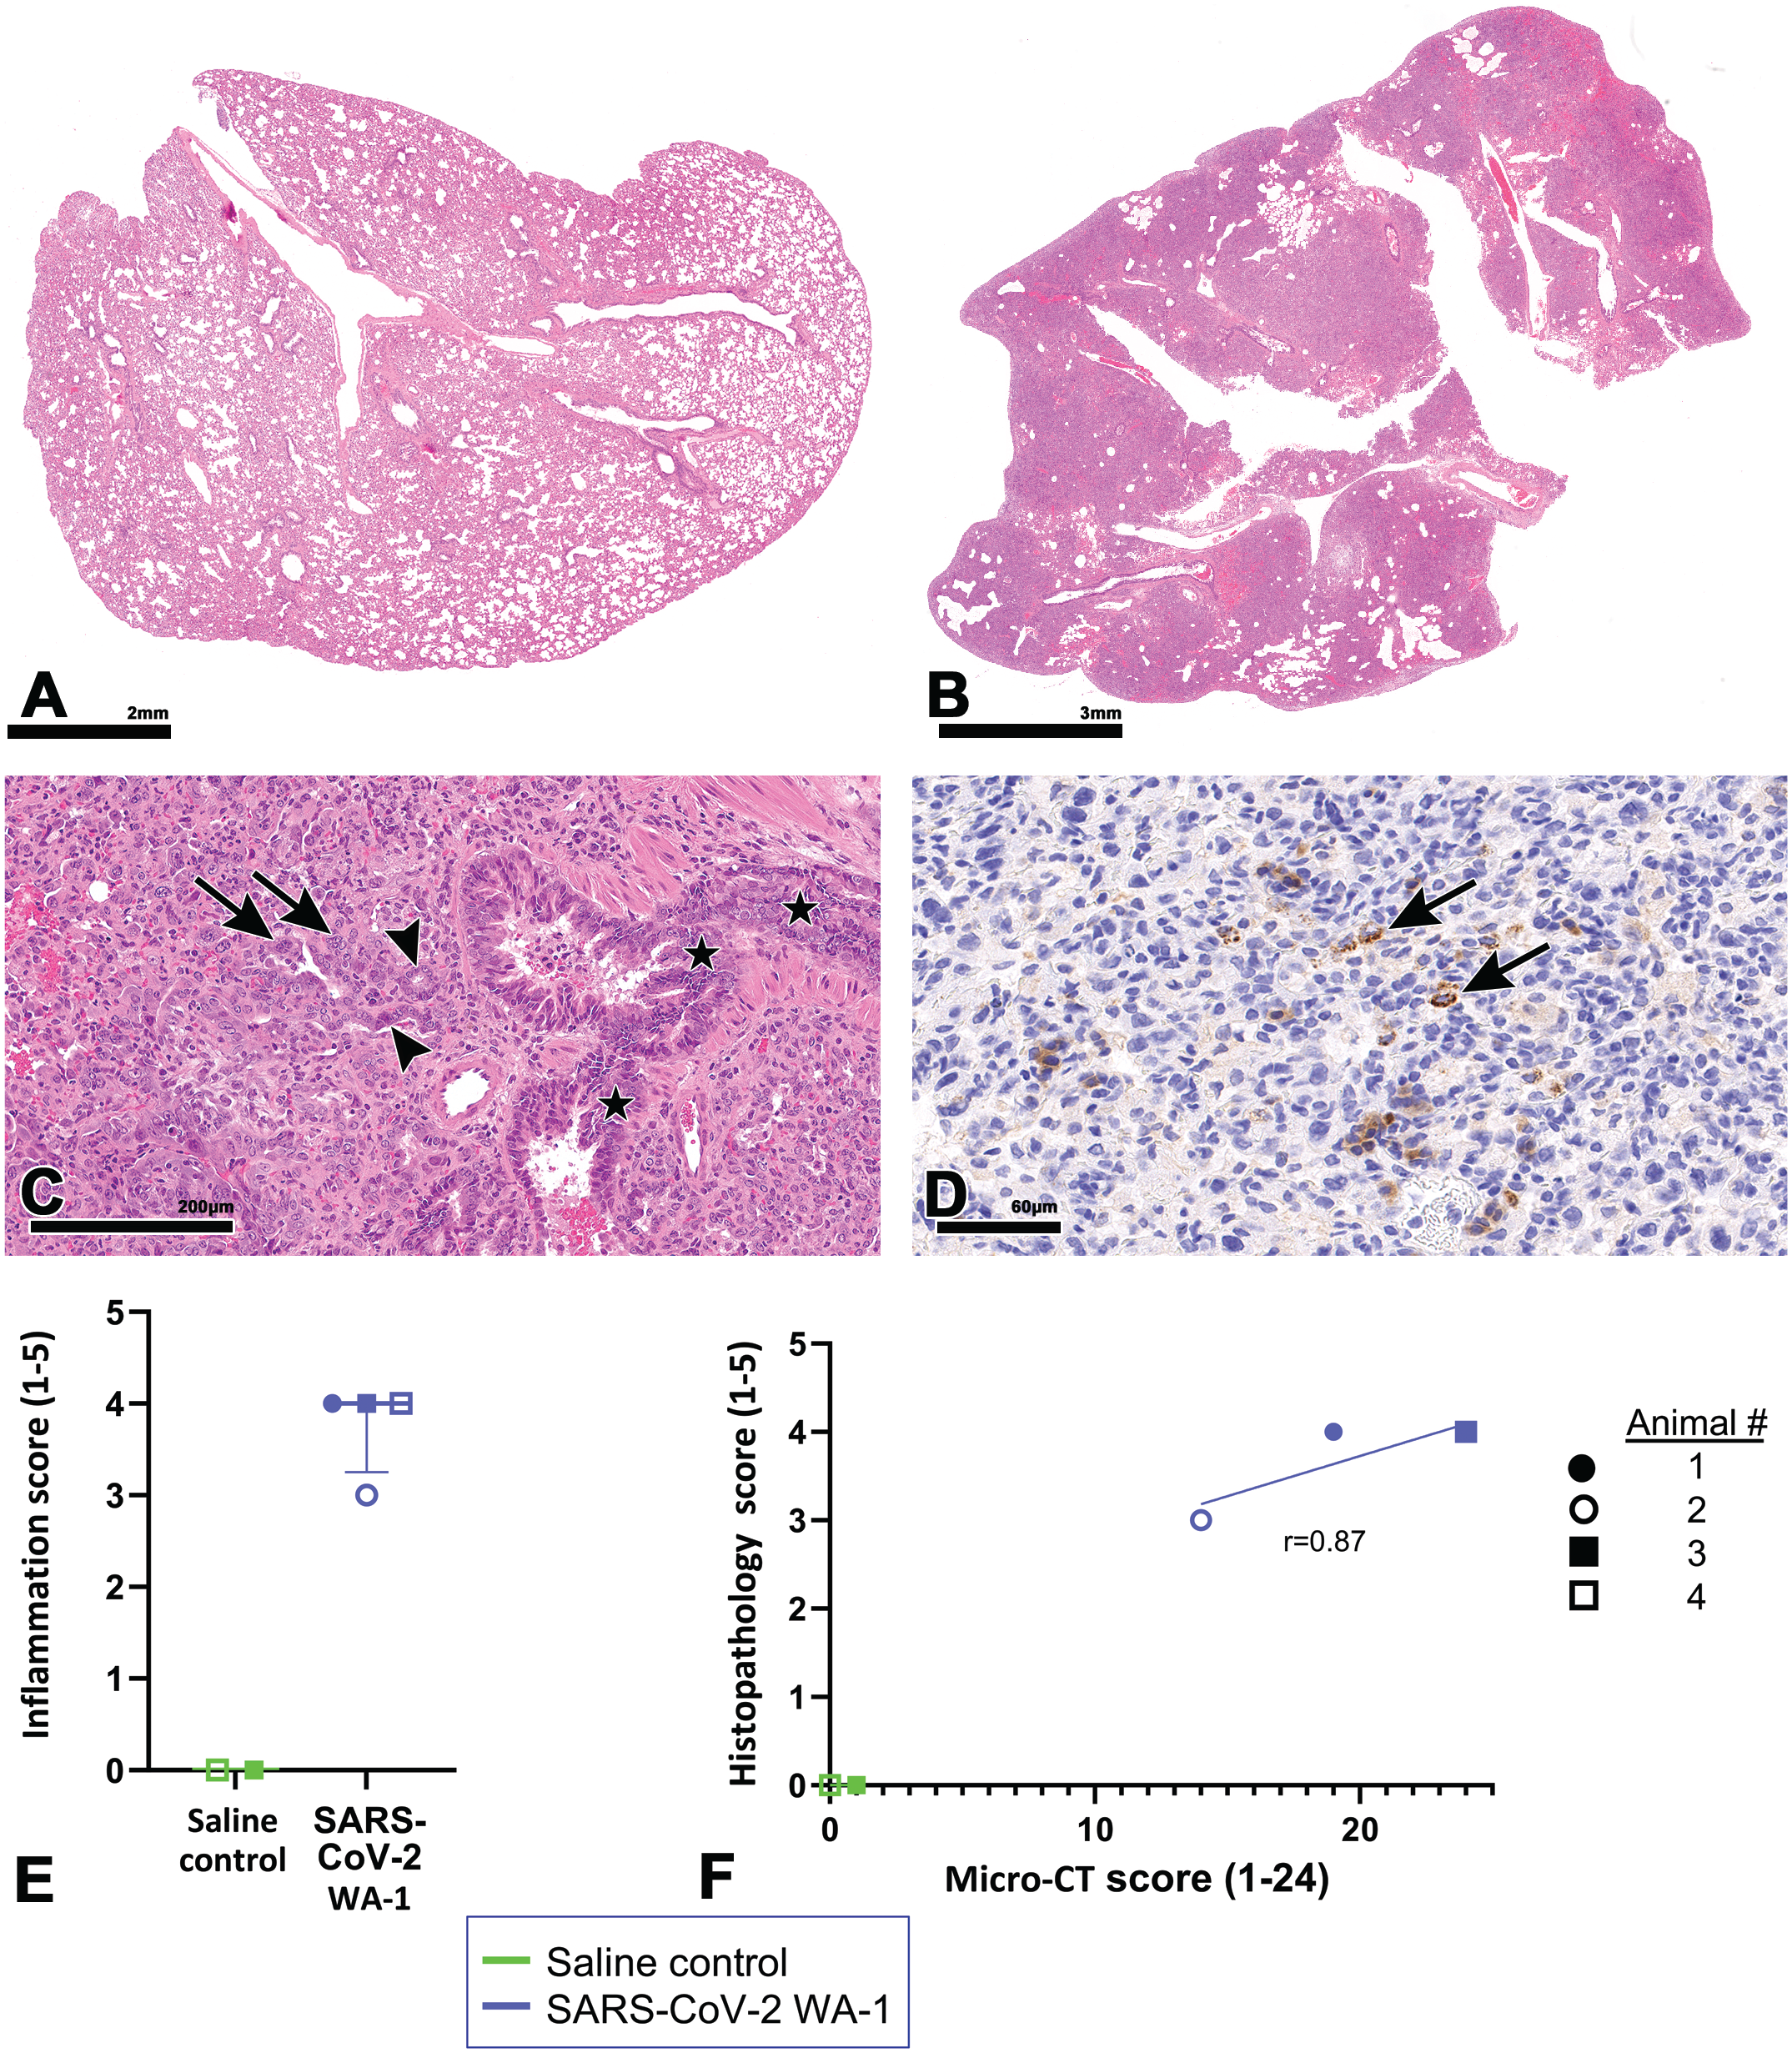
Histopathologic features of SARS-CoV-2 infection in hamster lungs at 9 dpi. A and B. Compared with a lung lobe from a mock-infected control animal (A) marked increases in lung cellularity of virus-infected animal (B) characterized by multifocal to coalescing areas of pulmonary consolidations. C. High magnification of (B) showing hyperplastic bronchiolar epithelium (asterisks) and adjacent hypercellular lung parenchyma with alveolar type II pneumocytes (arrowheads) and syncytia (arrows). D. Alveolar epithelium (pneumocytes) shows positivity for N by IHC (arrows). E. Histopathologic severity score of mock-infected control and virus-infected hamsters at 9 dpi. F. Comparison between histopathologic and CT scores, linear regression line shown; r = 0.87. Infected animals 3 and 4 are superimposed as they had identical micro-CT and histopathological scores. Dpi, days post-infection; H&E, hematoxylin and eosin; IHC, immunohistochemistry.
Discussion
Use of non-invasive imaging modalities in infectious disease modeling permit longitudinal measurement of disease progression and/or recovery in the same animal, and hence, help to reduce number of animals required per experiment. Since each animal can function as its own control over time, imaging also provides increased statistical power.14,21 Small animal imaging modalities such as micro-CT not only generate rapid, reproducible, high-resolution 3D images, but are also non-destructive to target tissues, which allows its combination with histology for confirmation of disease.12,24 Accordingly, this technique has potential to contribute significantly to our understanding of pathogenesis of infectious diseases and development of vaccines or antiviral therapies.
We have shown that Syrian hamsters successfully recapitulate the kinetics of pulmonary infection and pathology observed with severe COVID-19; pulmonary inflammation and clinical disease in hamsters continued to increase from 3 to 7 dpi even as replicating virus decreased. 9 Using micro-CT in the current study, we showed that the progression of radiologic abnormalities (GGOs, consolidations, air bronchogram) in hamsters followed the kinetics of histopathologic findings of pneumonia observed previously and were comparable with that observed in the lungs of COVID-19 patients. Similar to initial CT features of early-stage COVID-19 patients,5,13,39 GGO was the first radiological abnormality that appeared at 4 dpi among infected hamsters with peripheral, subpleural, bilateral, and basal distribution. Micro-CT features of progressive stage (6 dpi; GGOs with areas of consolidation and air bronchogram) and peak/most severe stage (8 dpi; mostly consolidation) in hamsters were also comparable with CT features of COVID-19 patients. Since GGOs with consolidation have other infectious (e.g., influenza virus, respiratory syncytial virus) or non-infectious (hemorrhage, proteinosis, cancer) causes, 13 we confirmed the COVID-19-specific lung pathology and SARS-CoV-2 infection in hamster lungs with histopathology and IHC, respectively. Histopathological features of infected lungs at 9 dpi, including proliferation of alveolar/bronchiolar epithelium (secondary to alveolar/bronchiolar damage by the virus) and airway inflammation, closely resemble those seen in COVID-19 pneumonia in patients,3,9 and were responsible for more dense/opaque areas (GGOs and consolidations). Accordingly, we observed a good association between radiologic and histopathologic findings. In fact, the evolution of radiologic abnormalities in this study (4-8 dpi) were comparable with the kinetics of histologic broncho-interstitial pneumonia (3-7 dpi) observed previously in our model despite a decline in replicating virus which is comparable with that observed in humans with severe COVID-19. 9 While the progressive proliferation of alveolar/bronchiolar epithelium in the late stages of disease is secondary to virus-induced direct epithelial damage or downregulation of ACE2 (leading to inflammation and tissue injury) during acute phase of disease (3-5 dpi), higher number of inflammatory cells despite low replicating virus during the late stages of disease among severe COVID-19 cases is not well understood. 8 Host factors such as a dysregulated immune system (impaired interferon responses or hyperactivated complement system) can result in an exacerbated inflammatory response. 8 Recently, perpetual pathogenic neutrophilia is shown to cause ARDS in severe COVID-19 even with low viral burden. 15
Apart from changes involving the lung parenchyma (GGO, consolidation, air bronchogram), we observed pneumomediastinum in the 2 most severely affected animals (infected animals 3 and 4). Although uncommon, pneumomediastinum has been observed in human COVID-19 patients in the absence of intubation and mechanical ventilation, which are the two leading causes of this change.17,22,26 Hamsters in this study were not intubated and likely this finding was secondary to severe pulmonary damage, alveolar wall rupture, and air leakage into the mediastinum. Similar to COVID-19 patients, 40 this finding appeared to resolve quickly in our study without treatment which further highlights the value of the hamster as a preclinical model for COVID-19-associated pneumonia. We did not notice any evidence of pneumothorax which can be one of rare complications of prolonged air buildup in the mediastinal spaces causing lungs to collapse. We confirmed pneumomediastinum by both manual and automated threshold-based segmentation analysis (MLAST) and observed a good correlation between these techniques. Readouts from MLAST are quantitative and objective and it takes only 1/5th of the time required for manual scoring. 28 As manual segmentation is time-consuming, and sensitive to intra-analyst and inter-analyst variations, our study suggests that replacing manual segmentation with fully automated analysis will accelerate the micro-CT data analysis and allow more frequent intermediate readouts in longitudinal studies. Future potential for automation includes training of deep learning models for either classification or segmentation of COVID-19 images. Such machine learning approaches have been extensively investigated for use in a wide variety of both clinical and preclinical imaging models, including diagnosis of COVID-19 pneumonia from chest radiographs and CT datasets.2,31 Many convolutional neural nets show tremendous potential for automation of CT scoring, delineation of lung lobes, or even semantic segmentation of various COVID-19 phenotypes. 42 Future studies utilizing machine learning to analyze CT scans by assigning CT scores, identifying score lesion severity, or perhaps even segmenting consolidations and GGOs could significantly increase data analysis throughput and improve data quantitation.
A handful of previous COVID-19 studies in hamsters have noted radiologic abnormalities.19,23,33,37 Similar to our study, Takamatsu et al 37 and Boudewijns et al 5 observed GGOs by 4 dpi in the lungs of SARS-CoV-2 infected hamsters. However, in contrast, Imai et al 19 observed GGOs at 2 dpi in hamster lungs which progressed to more severe GGOs with regions of consolidation by 4 dpi and to largely consolidated lungs by 8 dpi. Exposure to a higher amount of virus secondary to animals being infected via two different routes (intranasal and intraocular) might have led to early appearance and faster progression of radiological abnormalities compared with the single route (intranasal) of infection in our study. Although pneumomediastinum was observed among these studies, air bronchogram was not observed. We did not observe a crazy-paving pattern, lymphadenopathy, or reversed halo sign (atoll sign), which have not yet been described in the hamster model. 6
This study has potential limitations. The number of animals tested per time point was not sufficient to allow histopathological evaluation at earlier time points (2-8 dpi). Accordingly, we could not verify the disease pathology at earlier time points and confirm association between radiologic and histologic scorings. However, as discussed earlier, radiologic abnormalities in this study at earlier time points (4-8 dpi) were comparable with the kinetics of histologic findings (3-7 dpi) observed previously in our model. 9 The data discussed in this article constitute a pilot study and 2 mock-infected animals were taken down early at 5 dpi for logistical reasons (to test various procedures). This resulted in a small sample size and additional statistical analysis was not performed due to the lack of statistical power. Finally, although we observed slight recovery in 2 virus-infected animals by 9 dpi (decrease in GGOs/consolidations), we did not see a complete recovery or radiological changes associated with chronic phases of disease (fibrotic abnormalities, e.g., subpleural bands or traction bronchiectasis) in our model as animals were euthanized by 9 dpi.
In conclusion, our study supports prior radiological observations in hamsters and provides further evidence that micro-CT can be a powerful, non-invasive, 3D imaging tool for easy and fast characterization of COVID-19-associated lung lesions. Our model recapitulated a range of radiologic abnormalities observed during human COVID-19 pneumonia progression, and we observed a positive association with histologic findings characteristic of COVID-19 pneumonia. Manual and automated threshold-based segmentation analysis allowed further characterization of pneumomediastinum. Considering that a broad spectrum of pulmonary parenchymal diseases presents with GGO and consolidation and may mimic COVID-19 pneumonia, the methodology described here can be a useful asset to longitudinal preclinical studies evaluating various infectious respiratory diseases.
Footnotes
Acknowledgements
The authors would like to thank Vaccines Research and Development in vivo staffs, particularly Victoria Uhlhorn, Theresa Campbell, Caresse Lynn Torres; Comparative Medicine staffs, particularly Dan Whitten, Tariel Turner, Mark Arlauskas, Ryan Misonznick, Carlos Hall, and Michelle Rockwell for technical assistance; Viral Vaccines staffs, particularly Vidia Roopchand, Kate Moffat, Candy Rodriguez, and Stephen Maksimiv for passaging, growing, and stocking SARS-CoV-2 virus. They would also like to thank Beth Mahler (illustration editor, Toxicologic Pathology) for her assistance with manuscript image preparation.
Author Contributions
Conceptualization, SC, JR, MD; Methodology, JR, MD, MG, SC, TC, SL; Validation, SC, JR, MD, AW, IK, RP; Formal Analysis, SC, JR, MD; Investigation, SC, JR, MD, AW, RP; Resources, SC, JR, MD, IK; Data Curation, SC, JR, MD, AW, IK, RP; Writing – Original Draft Preparation, SC, JR, MD, MG; Writing – Review & Editing, SC, JR, MD, AW, IK, RP, MG, MM, TC, SL, KY; Visualization, SC, JR, MD, MG; Supervision, SC, JR, MD.; Project Administration, JR, MD, RP, AW, SC. All authors have read and agreed to the published version of the manuscript.
Declaration of Conflicting Interests
The author(s) declared the following potential conflicts of interest with respect to the research, authorship, and/or publication of this article: All authors are current or former employees of Pfizer Inc., and may, therefore, be shareholders.
Funding
The author(s) disclosed receipt of the following financial support for the research, authorship, and/or publication of this article: The study was funded by Pfizer Inc.