
Abstract
Antisense oligonucleotides (ASOs) are chemically modified nucleic acids with therapeutic potential, some of which have been approved for marketing. We performed a study in rats to investigate mechanisms of toxicity after administration of 3 tool locked nucleic acid (LNA)-containing ASOs with differing established safety profiles. Four male rats per group were dosed once, 3, or 6 times subcutaneously, with 7 days between dosing, and sacrificed 3 days after the last dose. These ASOs were either unconjugated (naked) or conjugated with N-acetylgalactosamine for hepatocyte-targeted delivery. The main readouts were in-life monitoring, clinical and anatomic pathology, exposure assessment and metabolite identification in liver and kidney by liquid chromatography coupled to tandem mass spectrometry, ASO detection in liver and kidney by immunohistochemistry, in situ hybridization, immune electron microscopy, and matrix-assisted laser desorption/ionization mass spectrometry imaging. The highly toxic compounds showed the greatest amount of metabolites and a low degree of tissue accumulation. This study reveals different patterns of cell death associated with toxicity in liver (apoptosis and necrosis) and kidney (necrosis only) and provides new ultrastructural insights on the tissue accumulation of ASOs. We observed that the immunostimulatory properties of ASOs can be either primary from sequence-dependent properties or secondary to cell necrosis.
Introduction
Therapeutic oligonucleotides, such as antisense oligonucleotides (ASOs) and small interfering RNAs, have recently gained much attention as next-generation pharmaceuticals. 1 Within the ASO family, RNase H-recruiting ASOs include a wide spectrum of synthetic short single-stranded nucleic acids with the potential to hybridize by Watson-Crick base pairing with target messenger RNA (mRNA) sequences and prevent the specific expression of “disease-related” protein products. 2 First-generation ASOs with substitutions of the phosphodiester backbone with phosphorothioates (PS) were used to increase both stability against nuclease degradation and protein binding. 3 This PS modification remains in most second- and third-generation ASOs, where additional modifications have been developed. 4 A widely used modification to increase stability and binding affinity to complementary sequences is the addition of locked nucleic acids (LNAs). 5,6 The so-called gapmer LNAs are frequently used designs of therapeutic ASOs with LNA-modified nucleotides in the wings and a central block of DNA nucleotides (“gap”) that binds the target mRNA to form an RNA/DNA heteroduplex, thus inducing RNase H–mediated mRNA cleavage. 7 Several ASO drugs are currently evaluated in clinical trials for various indications, 8,9 and to our knowledge, there are currently at least 9 oligonucleotide products on the market. 9,10
Despite their proven therapeutic value, some ASOs are associated with toxic effects that restrict their use. 11 Systemically administered ASOs distribute to various tissues and then accumulate particularly in the kidney and liver where they can exert toxic effects. Two main categories of potential ASO toxicities are recognized: hybridization-dependent toxicities, due to either on-target hybridization (exaggerated pharmacology) or off-target hybridization (binding to unintended mRNA sequences); and hybridization-independent toxicities (non-antisense effect). The latter fall into 3 (possibly overlapping) categories: accumulation-related effects, pro-inflammatory mechanisms, and protein binding-related effects. 11,12 Although high-affinity ASOs (such as those containing LNAs) have the potential to improve potency, they can in some cases be associated with hepatotoxicity, 13 which can potentially occur due to off-target hybridization to unintended mRNA 14 or as a result of interactions with cellular proteins. 15
For diseases originating in the liver, a common strategy to enhance uptake of ASOs by hepatocytes and, therefore, reduce the effective dose is the conjugation to triantennary N-acetylgalactosamine (GalNAc), a well-defined liver-targeted moiety with a high affinity for the hepatocyte-specific asialoglycoprotein receptor (ASGPR). 16 –18 GalNAc is a well-validated short-lived organic molecule 16 based on sugar and amino acids with no toxicity alert.
The bioanalytical quantification of oligonucleotide therapeutics is important in understanding their biodistribution and accumulation. However, there is no gold-standard technique for quantifying ASOs in biological matrices, and several aspects should be considered when selecting the appropriate techniques including spatial tissue resolution, sensitivity, or differentiation between parent and metabolized compounds.
Despite the presence of chemical modifications that provide improved stability and binding affinity, ASOs undergo metabolism and degradation that can affect their pharmacologic effect and potentially their toxicity. Understanding the biotransformation and in vivo fate of new therapeutics is essential for drug development. 19 Matrix-assisted laser desorption/ionization mass spectrometry imaging (MALDI MSI) has been proposed as one of the most advantageous spectral imaging techniques to determine in situ the presence of drugs and their metabolites in preclinical safety studies, 20,21 and the application of MALDI MSI in studies with ASOs is increasing. 22,23
In this study, we aimed to characterize mechanisms of toxicity of tool gapmer LNA-containing ASOs with different safety profiles in a rat model, comparing unconjugated (“naked”) and GalNAc-conjugated compounds, with a special focus on liver and kidney, the main organs of accumulation. We also aimed to investigate the metabolism of ASOs and trace their accumulation in tissues with different approaches, in order to further investigate the association with potential toxicity. An increased understanding of these mechanisms may support the development of safer therapeutic ASOs.
Materials and Methods
Study Design, Compound Selection, and Dose
Five tool gapmer LNA-containing ASOs with 3 different sequences and safety profiles (low/medium/high toxicity, LT, MT, HT, respectively) were selected based on previous in vitro and in vivo studies (Tables 1 and 2). 24 To compare the effect of a liver-targeted delivery system, these ASOs were used as both unconjugated compounds (“naked”) or conjugated with GalNAc (G), a high-affinity ligand for the hepatocyte-specific ASGPR. A phosphodiester linker (_c_a_) is present in Aso2-G between the GalNAc molecule and the ASO sequence and it favors cleavage by endonucleases (“cleavable linker”); this cleavable linker is not present in Aso3-G. Four male rats per group were dosed once, 3, or 6 times subcutaneously, with 7 days between doses, into the interscapular region, and sacrificed 3 days after the last dose (ie, sacrificed at day 4, 18, or 39, respectively). A corresponding vehicle control group was dosed at the same time points as the treated groups. Due to the expected higher toxicity of Aso3 and Aso3-G, animals received up to 3 consecutive doses only.
Experimental Design.a,b,c
Abbreviations: HT, high toxicity; LT, low toxicity; MT, moderate toxicity.
a AsoX denotes naked (= unconjugated); AsoX-G denotes GalNAc conjugated.
b n = 4 male Wistar rats per sacrifice day and compound.
c Dose: 40 mg/kg (naked ASOs) or 20 mg/kg (GalNAc-conjugated ASOs).
ASO Sequences With Chemical Modifications and Melting Temperatures (Tm).a
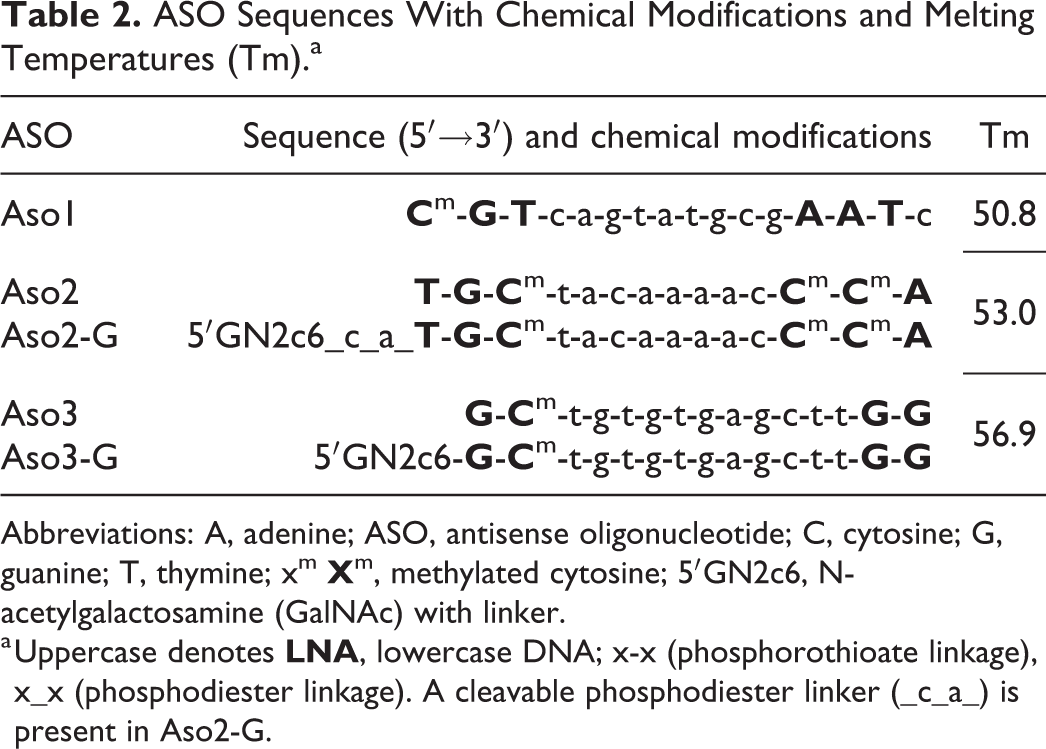
Abbreviations: A, adenine; ASO, antisense oligonucleotide; C, cytosine; G, guanine; T, thymine; xm
a Uppercase denotes
Compounds Aso2/Aso2-G and Aso3/Aso3-G target human PCSK9 (proprotein convertase subtilisin/kexin type 9), a potential therapeutic target for treating hypercholesterolemia. 25 No target engagement was expected for PCSK9 due to the presence of mismatches between the human and rat transcriptome for this enzyme. Aso1 has no perfect matches within the whole rat transcriptome (scramble sequence).
Sterile 0.9% NaCl solution was used as vehicle and was administered to a vehicle control group. Unconjugated compounds were used at 40 mg/kg, and GalNAc-conjugated compounds at 20 mg/kg body weight (dose levels are expressed as that of the naked moiety). The molecular weight of the GalNAc-conjugated compounds was approximately 40% to 50% greater than that of the naked compounds. Due to the liver-targeted delivery, the GalNAc-conjugated compounds were administered at lower doses to correct for their greater liver uptake. A dose volume of 2.5 mL/kg body weight was used for both vehicle- and compound-treated groups. All ASOs were synthesized according to standard protocols as previously described. 25 The formulation of each compound contained ≤5% impurities.
Animals
The study was performed on 64 male Han Wistar IGS rats (Charles River Laboratories, Sulzfeld, Germany). At the start of dosing, all rats were approximately 8 weeks old and weighed 250 to 260 g. They were housed as 4 animals per cage (makrolon, type IV, with autoclaved sawdust bedding). Rats were kept in air-conditioned rooms at 22 °C ± 2 °C and relative humidity of 40% to 80% with 12-hour light/dark cycle in a facility accredited by the Association for Assessment and Accreditation of Laboratory Animal Care International. Animals were regularly monitored and were offered a standard pelleted maintenance rodent diet and tap water ad libitum as well as environmental enrichment. All procedures were in accordance with the respective Swiss regulations and approved by the Cantonal Ethical Committee for Animal Research. Clinical observations (at least twice daily), body weight development, and food consumption (both twice weekly) were closely monitored throughout the study.
Blood and Urine Sampling
Shortly before euthanasia and following overnight fasting, blood samples were collected sublingually from animals under isoflurane anesthesia for clinical pathology analysis.
Once at pretest, and approximately 5 hours prior to euthanasia, animals were orally administered tap water (10 mL/kg body weight) and urine was collected in metabolic cages (Tecniplast) for approximately 5 hours. During the collection period, urine was maintained cooled (4 °C), and food and water was withheld.
Clinical Pathology and Urinary Biomarkers of Kidney Injury
Blood sampled prior to necropsy was examined for a full set of hematology, coagulation, and clinical chemistry parameters. Hematology parameters were determined using the Sysmex XT instrument, coagulation parameters with the ACL TOP500 (Instrumentation Laboratory), and clinical chemistry parameters with the Advia 1800 (Siemens) automated system. Results were expressed as fold change increases compared to the values obtained from control animals.
Urine samples were assessed for urine chemistry parameters with an Advia 1800 automated system. Additional urine aliquots were stored at −80 °C for the analysis of urinary kidney toxicity biomarkers with Luminex technology. The following Luminex-based ELISA kits from EMD Millipore were used according to manufacturer’s instructions: Milliplex MAP Rat Kidney Toxicity Magnetic Bead Panel 1 (#RKTX1MAG-37K, analytes: calbindin [CLBN], clusterin [CLST], α-glutathione S-transferase [αGST], interferon γ inducible protein 10 [IP-10], kidney injury molecule 1 [KIM-1], osteopontin [OPN], tissue inhibitor of metalloproteinase 1 [TIMP-1], vascular endothelial growth factor [VEGF]), and Milliplex MAP Rat Kidney Toxicity Magnetic Bead Panel 2 (RKTX2MAG-37K, analytes: albumin [ALBU], α 1-acid glycoprotein [AGP], β2-microglobulin [β2M], cystatin C [CYST], epidermal growth factor [EGF], neutrophil gelatinase-associated lipocalin [NGAL]/Lipocalin-2). After the assays, the samples were measured in a Luminex 200 System with xPONENT 4.2 software and analyzed with MILLIPLEX Analyst software. Results were normalized to urine creatinine and expressed as fold change increase compared to the mean values obtained from control animals (n = 4).
Necropsy, Gross, and Histological Examination
Immediately after blood sampling under isoflurane anesthesia, animals were sacrificed by exsanguination. A complete postmortem examination was performed, and an extensive range of organs were sampled and fixed in 10% buffered formalin for 24 to 30 hours, then routinely processed and paraffin wax embedded. Consecutive histological sections (3-4 µm) were prepared and routinely stained with hematoxylin–eosin (H&E) for microscopical examination, or were subjected to immunohistochemical staining or in situ hybridization (ISH).
Quantitative Exposure Assessment of Full-length Compounds
Liver and kidney cortex tissue samples were collected and weighed during necropsy and stored at −80 °C in homogenization tubes CK28 (Precellys) for subsequent bioanalytical examination by liquid chromatography coupled to tandem mass spectrometry (LC-MS/MS). Prior to extraction, tissue homogenates were diluted 5-fold in rat blank plasma. The quantification was performed against rat plasma calibration curve. Calibration ranges were 0.948 to 948, 1.08 to 1080, 0.297 to 742, 0.403 to 1010, and 0.304 to 761 nM for Aso1, Aso2, Aso2-G, Aso3, and Aso3-G, respectively. The performance of sample analysis was monitored by analyzing quality control samples in rat plasma.
Fifty microliter of calibration standards, quality control samples (freshly prepared in rat plasma), and tissue homogenate samples diluted in rat blank plasma were treated for protein denaturation with 150 µL of 4 M guanidine thiocyanate after addition of the internal standard (2000 ng/mL). After vigorously mixing (20 minutes at 1600 rpm), 200 µL of a H2O/HFIP/DIPEA solution (100:4:0.2, v/v/v) were added, followed by mixing (15 minutes at 1500 rpm). Then a clean-up step was performed using solid-phase extraction cartridges (Waters, OASIS HLB, 30 μm) after elution and evaporation to dryness (30-45 minutes at 40 °C), the samples were reconstituted in 200 µL of mobile phase (H2O/MeOH/HFIP/DIPEA, [95/5/1/0.1, v/v/v/v]). After vortex mixing (10 minutes at 1500 rpm), an aliquot (20 μL) was injected into the analytical column (Waters, Acquity BEH C18, 1.7 µm, 50 mm × 2.1 mm kept at 60 °C). The analyte and internal standard were separated from matrix interferences using gradient elution from H2O/MeOH/HFIP/DIPEA (95/5/1/0.1, v/v/v/v) to H2O/MeOH/HFIP/DIPEA (10/90/1/0.1, v/v/v/v) within 4 minutes at a flow rate of 0.4 mL/min. Mass spectrometric detection was carried out on an AB-Sciex 6500+ mass spectrometer using selected reaction monitoring (SRM) in the negative ion mode. The selected ion reactions (m/z) were 588.4/95.0, 576.5/95.0, 682.8/95.0, 714.1/95.0, and 828.7/95.0 for Aso1, Aso2, Aso2-G, Aso3, and Aso3-G, respectively, and 670.8/95.0 for internal standard. Detection was accomplished utilizing ion spray MS/MS in negative ion SRM mode. The precision and accuracy of the assay, as determined from the analysis of quality control samples, were satisfactory throughout the study.
In the case of animals dosed with GalNAc-conjugated compounds (Aso2-G and Aso3-G), total or partial cleavage of the GalNAc moiety was expected; therefore, we measured both the intact compound (with GalNAc) and also the naked moiety (corresponding to Aso2 and Aso3, respectively), in order to quantify the amount of GalNAc-cleavage compounds. All samples from vehicle-treated control rats were analyzed for the different compounds, and as expected, all were negative (data not shown).
Metabolite Identification
Liver and kidney cortex tissue samples were collected during necropsy in homogenization tubes CK28 (Precellys) and stored at −80 °C. Tissue homogenates were prepared by adding 300 µL of H2O to 100 mg of tissue in the CK28 tubes and homogenized using the Precellys homogenizer. A volume of 50 µL of homogenate was mixed with 250 µL of guanidine thiocyanate 4 M in 0.1 M Tris buffer pH 7.5 for 15 minutes at 25 °C in a thermomixer. H2O/HFIP/DIPEA (100/2/0.2, v/v/v; 700 µL) were then added and mixed for 1 hour at 25 °C. Following the addition of 4 to 8 µL of internal standard (20-1000 µM prepared in H2O/MeOH/HFIP/DIPEA (100/10/1/0.1, v/v/v/v), the samples were centrifuged for 5 minutes at 14,000 rpm. Subsequently, the supernatant was transferred to a solid-phase extraction OASIS HLB 1 mL 30 mg cartridge (Waters), extracted as described previously, 19 and analyzed by LC coupled with high-resolution MS. A Thermo Scientific Dionex UltiMate NCP-3200RS Binary Rapid Separation HPLC system was used in combination with a Pal autosampler (CTC Analytics AG) and a Thermo Scientific Orbitrap Fusion Tribrid Mass Spectrometer (Thermo Scientific) equipped with an electrospray ionization source. The oligonucleotide metabolites were analyzed in negative ionization mode with the method described previously. 19 In brief, a full scan MS experiment was combined with 2 parallel MS 2 experiments, one data-dependent scan and an untargeted all ion fragmentation (AIF) experiment applying high collision energy. In the AIF scan, a diagnostic fragment originating from the PS backbone (O2PS−: m/z 94.936 Da) was formed efficiently upon collisional activation. Based on this fragment, an accurate determination of metabolites of oligonucleotides was achieved, independent of their sequence or conjugation, in an untargeted but highly selective manner.
Matrix-Assisted Laser Desorption/Ionization Mass Spectrometry Imaging
To demonstrate the presence of ASOs in the kidney and liver, 10-μm-thick frozen sections (without optimal cutting temperature (OCT) polymer embedding) of both organs from vehicle- and ASO-dosed rats were mounted on Superfrost microscope glass slides (Thermo Scientific) and stored at −80 °C. Prior to processing for MALDI MS analysis, the slides were placed in a dry chamber at room temperature for at least 45 minutes. For coating the tissue slides with matrix, a solution of α-cyano-4-hydroxycinnamic acid at 10 mg/mL in 1:1 acetonitrile:0.1% 2,2,2-trifluoroethanoic acid in water was applied using an iMatrixSpray sprayer. 26 Four spraying cycles were applied at a flow rate of 5 µL/cm2. The tissue samples were analyzed on a 7 Tesla SolariX XR Fourier-Transform Ion Cyclotron Resonance (FTICR) MS instrument with a MALDI source equipped with a Smartbeam-II Laser System (Bruker). Polarity was negative, and 300 laser shots were applied at 2000 Hz at a lateral resolution of 50 µm. The quadrupole was used in full transferring mode (no isolation) followed by collision-induced dissociation at 60 eV. Full scan MS was acquired in the ion cyclotron resonance cell. For image generation, a diagnostic fragment formed efficiently upon collisional activation (60 eV) originating from the PS backbone (O2PS−: m/z 94.9362 Da) was used. This fragment is formed only from PS-linked oligonucleotides, independent of their sequence or potential conjugations (eg, GalNAc). Mass spectrometry images were generated, and data were analyzed using FlexImaging 4.0 software, Data Analysis 4.3 software, and/or SCiLS lab software.
Immunohistochemistry, ISH for ASOs, and Image Analysis
Immunohistochemical stains on sections of kidney and liver were performed on a Ventana Discovery XT automated stainer (Ventana Medical Systems), with primary antibodies directed against PS backbone-containing ASOs, 27 cleaved caspase 3 (apoptotic cells), CD3 (T lymphocytes), Iba-1 (macrophages), KIM-1, Ki67 (proliferating cells), and vimentin (mesenchymal cells). Antigen-retrieval methods, primary antibody working conditions as well as detection methods are listed in Supplementary Table S1. Rabbit, mouse, or goat nonimmune sera was used instead of the specific primary antibodies as isotype-matched negative controls. Sections were counterstained with hematoxylin II (Ventana, 790-2208).
For detection of ASOs by ISH, sections of kidney and liver were labeled with oligoprobes targeting the different ASO sequences using a Ventana Discovery ULTRA automated immunohistochemistry (IHC)/ISH stainer (Ventana Medical Systems). Three double-DIG-labeled miRCURY LNA detection probes complementary to Aso1, Aso2/Aso2-G, and Aso3/Aso3-G sequences were designed and provided by Qiagen. Briefly, tissue sections were de-paraffinized and pretreated with ISH-protease 3 (Ventana, 780-4149). Following hybridization with the specific probes, sections were incubated with anti-DIG HRP enzyme conjugate (Ventana, 760-4822), in conjunction with a tyramide-based Amplification BF Kit (Ventana, 760-226) and anti-BF HRP (Ventana, 760-4828). The DISCOVERY Purple kit (Ventana, 760-229) was used as chromogen, and specific staining signals were identified as purple, punctate dots, or diffuse staining in the cytoplasm. RNA diluent and LNA DIG-labeled U6 probes (provided by Qiagen) were used as negative and positive controls, respectively. Sections were counterstained with hematoxylin II (Ventana, 790-2208).
The IHC or ISH slides were scanned using an Aperio AT Turbo slide scanning system (Leica Biosystems) and visualized using Aperio ImageScope (Leica Biosystems). HALO imaging analysis software was used for the analysis. For the kidney, only the cortex was analyzed in cross sections, after manual annotation. Tissue gaps were automatically excluded from the analysis. For Aso (IHC and ISH), caspase 3, and KIM-1, the area quantification algorithm (expressed as percentage of positive tissue) was applied, and the settings were established to include the full range of staining intensities (weak to strong). For Iba-1 and Ki67, the immune cell algorithm (expressed as positive cells/mm2) was used, and cells immunolabeled with an intensity exceeding the settings threshold were counted as positive.
Immune Electron Microscopy for ASOs
In order to investigate the accumulation of LNA-containing ASOs in liver and renal cortex at subcellular level, tissue samples of both organs were fixed in 4% paraformaldehyde and routinely processed and embedded in Epon resin for immunogold transmission electron microscopy (EM). Briefly, ultrathin sections (90 nm) were cut, collected on 300 mesh gold grids and incubated for 17 hours at 4 °C with the same rabbit polyclonal antibody (anti-ASO pAb2) used to detect ASOs by IHC, diluted 1:800 in phosphate-buffered saline/Tris-buffered saline (PBS/TBS) buffer containing 1% bovine serum albumin (BSA). After incubation, grids were washed in PBS/TBS buffer and incubated for 2 hours at room temperature with 18 nm gold-labeled goat anti-rabbit immunoglobulin G antibody (Jackson ImmunoResearch, 111-215-144) diluted 1:20 in PBS/TBS buffer containing 1% BSA. After immunolabeling, grids were washed in PBS/TBS buffer, contrasted with uranyl acetate and lead citrate, and examined using a transmission electron microscope (CM10; Philips) equipped with a charge-coupled-device camera (Ultrascan 1000; Gatan) at an acceleration voltage of 100 kV.
Statistical Analysis
For each readout, we tested all dose regimens together for model assumptions by Brown-Forsythe and Bartlett tests for equal variance, and by Shapiro-Wilk test for normality of residuals. If all the criteria for parametric model assumptions were met, differences between the control group and compound-treated groups (n = 4 in each group) were determined by analysis of variance with Dunnett post hoc tests for multiple comparisons. If any of the criteria for parametric model assumptions were not met, a nonparametric analysis was performed by Kruskal-Wallis with Dunn post hoc tests for multiple comparisons. GraphPad Prism version 8 software was used for the statistical analysis, and values of P < 0.05 were considered statistically significant. All graphs in this study were generated using GraphPad Prism version 8 software, except for those illustrating body weights and food consumption, which were generated with Microsoft Office Excel 2013 software.
Results
In-Life Observations, Clinical Pathology, and Kidney Injury Biomarkers
All animals survived up to their scheduled sacrifice. A reduction in food consumption and body weight gain was seen in all ASO-dosed groups when compared with the controls (Supplementary Figure S1A and S1B). In addition, rats dosed with Aso3 showed a mild loss in body weight at day 18 (day of termination for this group) compared to day 1.
The monocyte count was the only hematology parameter that was altered; it showed statistically significant increase (>2-fold) compared to controls in rats treated with HT compounds (Aso3 and Aso3-G; Supplementary Table S2). Regarding coagulation parameters, rats dosed with Aso3-G showed mild and statistically significant increases compared to controls in activated partial thromboplastin time (Aso3-G) and prothrombin time (Supplementary Table S2).
Clinical chemistry parameters indicating hepatotoxicity were generally increased. Rats dosed with GalNAc-conjugated ASOs showed the highest increase in liver enzymes (alanine aminotransferase [ALT], aspartate transaminase, sorbitol dehydrogenase, glutamate dehydrogenase [GDH], alkaline phosphatase, and γ-glutamyltransferase [GGT]) compared to vehicle-treated rats; rats treated with Aso3-G had the highest increase (>100-fold change for ALT, GDH, and GGT after 3 doses), followed by those treated with Aso3 and Aso2-G (Table 3). These increases in hepatobiliary injury markers showed a strong association with the histopathological and immunohistochemical changes (see section “Pathological Findings”). Aso1-dosed rats showed increases only in cholesterol. All other clinical chemistry parameters were either not significantly altered or showed only minor (<2-fold) significant changes (Supplementary Table S3).
Summary of the Main Clinical Chemistry Parameters and Urinary Kidney Toxicity Biomarkers With the Most Relevant Increases. Results Expressed as Fold Change in Treated Rats Compared to Vehicle Control Animals.a,d,e,f
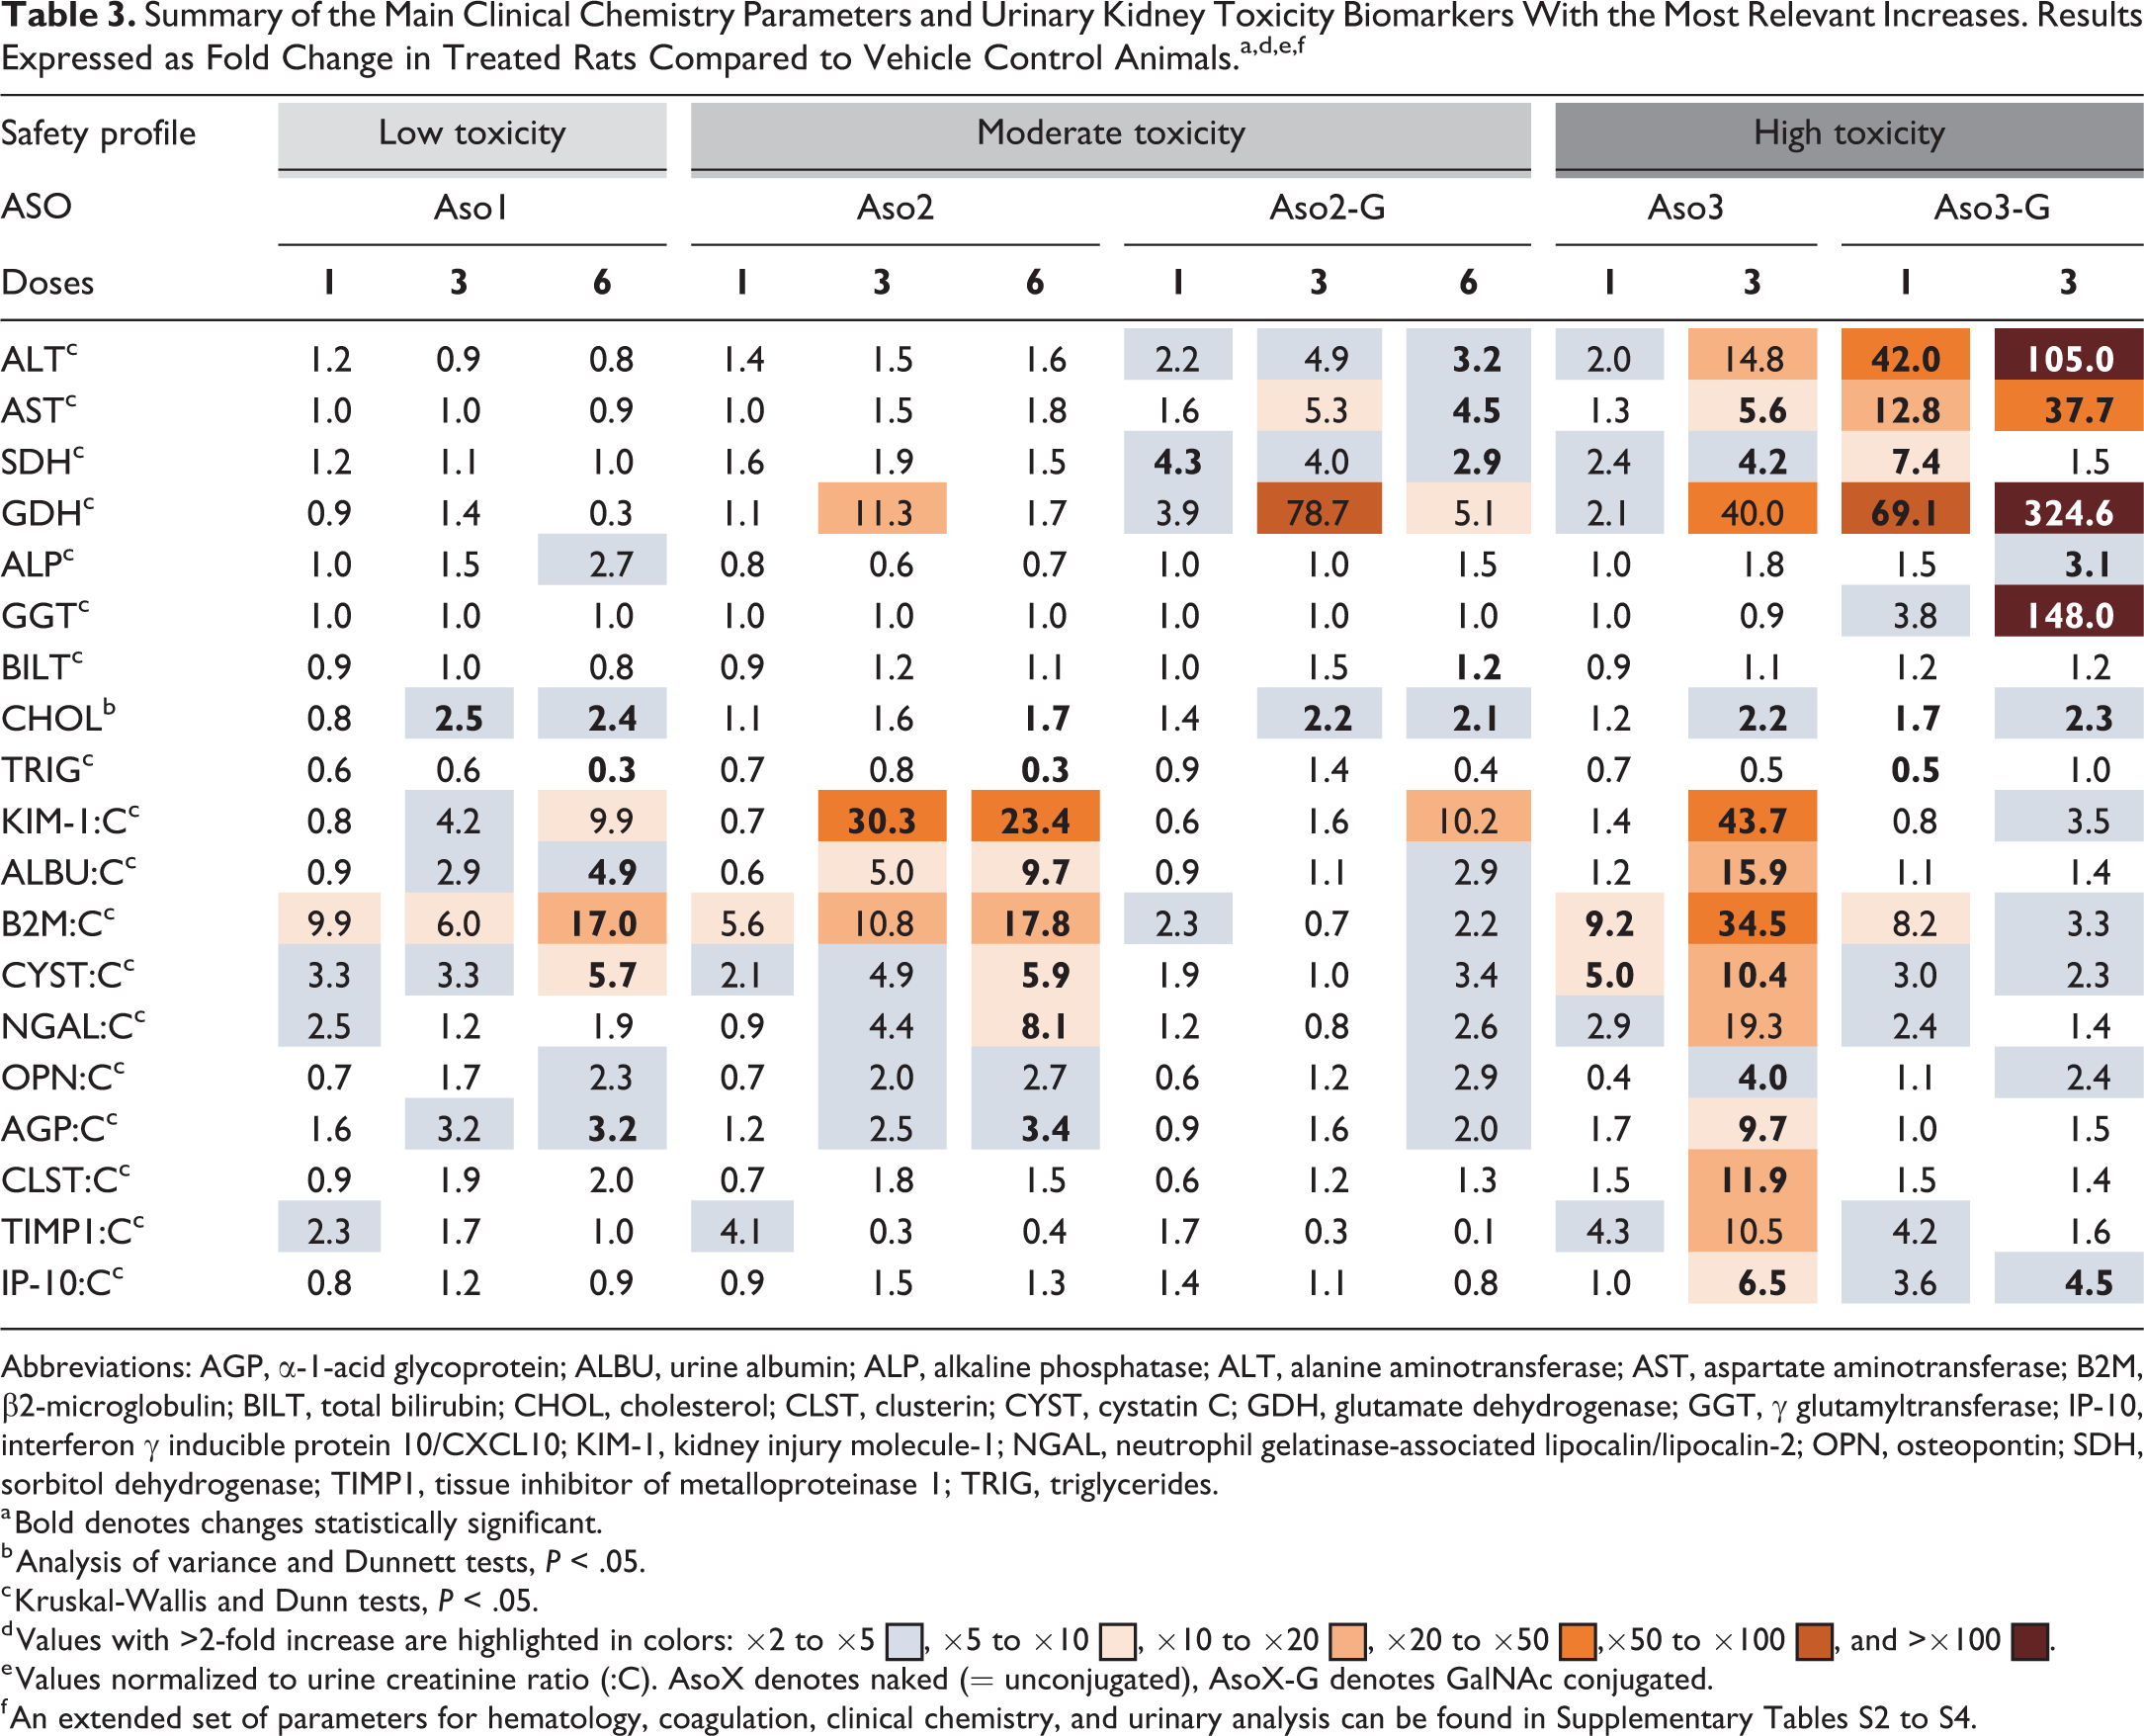
Abbreviations: AGP, α-1-acid glycoprotein; ALBU, urine albumin; ALP, alkaline phosphatase; ALT, alanine aminotransferase; AST, aspartate aminotransferase; B2M, β2-microglobulin; BILT, total bilirubin; CHOL, cholesterol; CLST, clusterin; CYST, cystatin C; GDH, glutamate dehydrogenase; GGT, γ glutamyltransferase; IP-10, interferon γ inducible protein 10/CXCL10; KIM-1, kidney injury molecule-1; NGAL, neutrophil gelatinase-associated lipocalin/lipocalin-2; OPN, osteopontin; SDH, sorbitol dehydrogenase; TIMP1, tissue inhibitor of metalloproteinase 1; TRIG, triglycerides.
a Bold denotes changes statistically significant.
b Analysis of variance and Dunnett tests, P < .05.
c Kruskal-Wallis and Dunn tests, P < .05.
d Values with >2-fold increase are highlighted in colors: ×2 to ×5  , ×5 to ×10
  , ×10 to ×20
  , ×20 to ×50
  ,×50 to ×100
  , and >×100
  .
.
e Values normalized to urine creatinine ratio (:C). AsoX denotes naked (= unconjugated), AsoX-G denotes GalNAc conjugated.
f An extended set of parameters for hematology, coagulation, clinical chemistry, and urinary analysis can be found in Supplementary Tables S2 to S4.
In general, rats dosed with naked ASOs (40 mg/kg) showed the most marked changes in urine parameters and in urinary kidney toxicity biomarkers compared with rats dosed with GalNAc-conjugated ASOs (20 mg/kg; Table 3 and Supplementary Table S4). The highest fold changes in the kidney toxicity parameters were observed with Aso3 (>10-fold change for KIM-1, ALBU, B2M, and CYST after 3 doses), followed by Aso2 and Aso1. In the case of urine N-acetyl-β-
Pathological Findings
Macroscopically, the kidney of some animals dosed with Aso2 and Aso3, and the liver of some animals dosed with Aso3-G exhibited a pale discoloration, which corresponded to the histopathological changes detected in the kidney or liver, respectively. Liver weights were mildly increased compared to controls in animals that had received 3 doses of Aso3 (Supplementary Table S5). The main histological change in the liver consisted of hepatocyte apoptosis/single-cell necrosis (Figure 1A and B), which correlated well with the quantitative assessment of caspase 3 positive cells, as it confirmed a statistically significant increase in apoptotic cells after dosing with GalNAc-conjugated ASOs, especially with the highly toxic Aso3-G (Figures 2A and 3). Alongside the degenerative changes, an increase in hepatocyte mitosis was noted (Figure 1A). This was most evident in rats treated with 3 doses of Aso3. In confirmation of this, the cell proliferation marker Ki67 was expressed in statistically significantly more hepatocytes in the liver of rats treated with the highly toxic compounds, Aso3 and Aso3-G (Figures 2C and 3). In addition, Kupffer cells were more numerous and/or increased in size and with vacuolated cytoplasm in the liver of rats treated with Aso2, Aso3, and Aso3-G. This finding was confirmed by IHC, which showed an increase in the number of Iba-1 positive cells, that is, Kupffer cells. After multiple dosing with GalNAc-conjugated compounds, higher increases of Iba1+ cells were seen compared to the naked counterparts (Figures 4A and 5). Some apoptotic bodies were observed within Iba1+ cellular membranes (Figure 5, inset), suggesting engulfment by Kupffer cells.
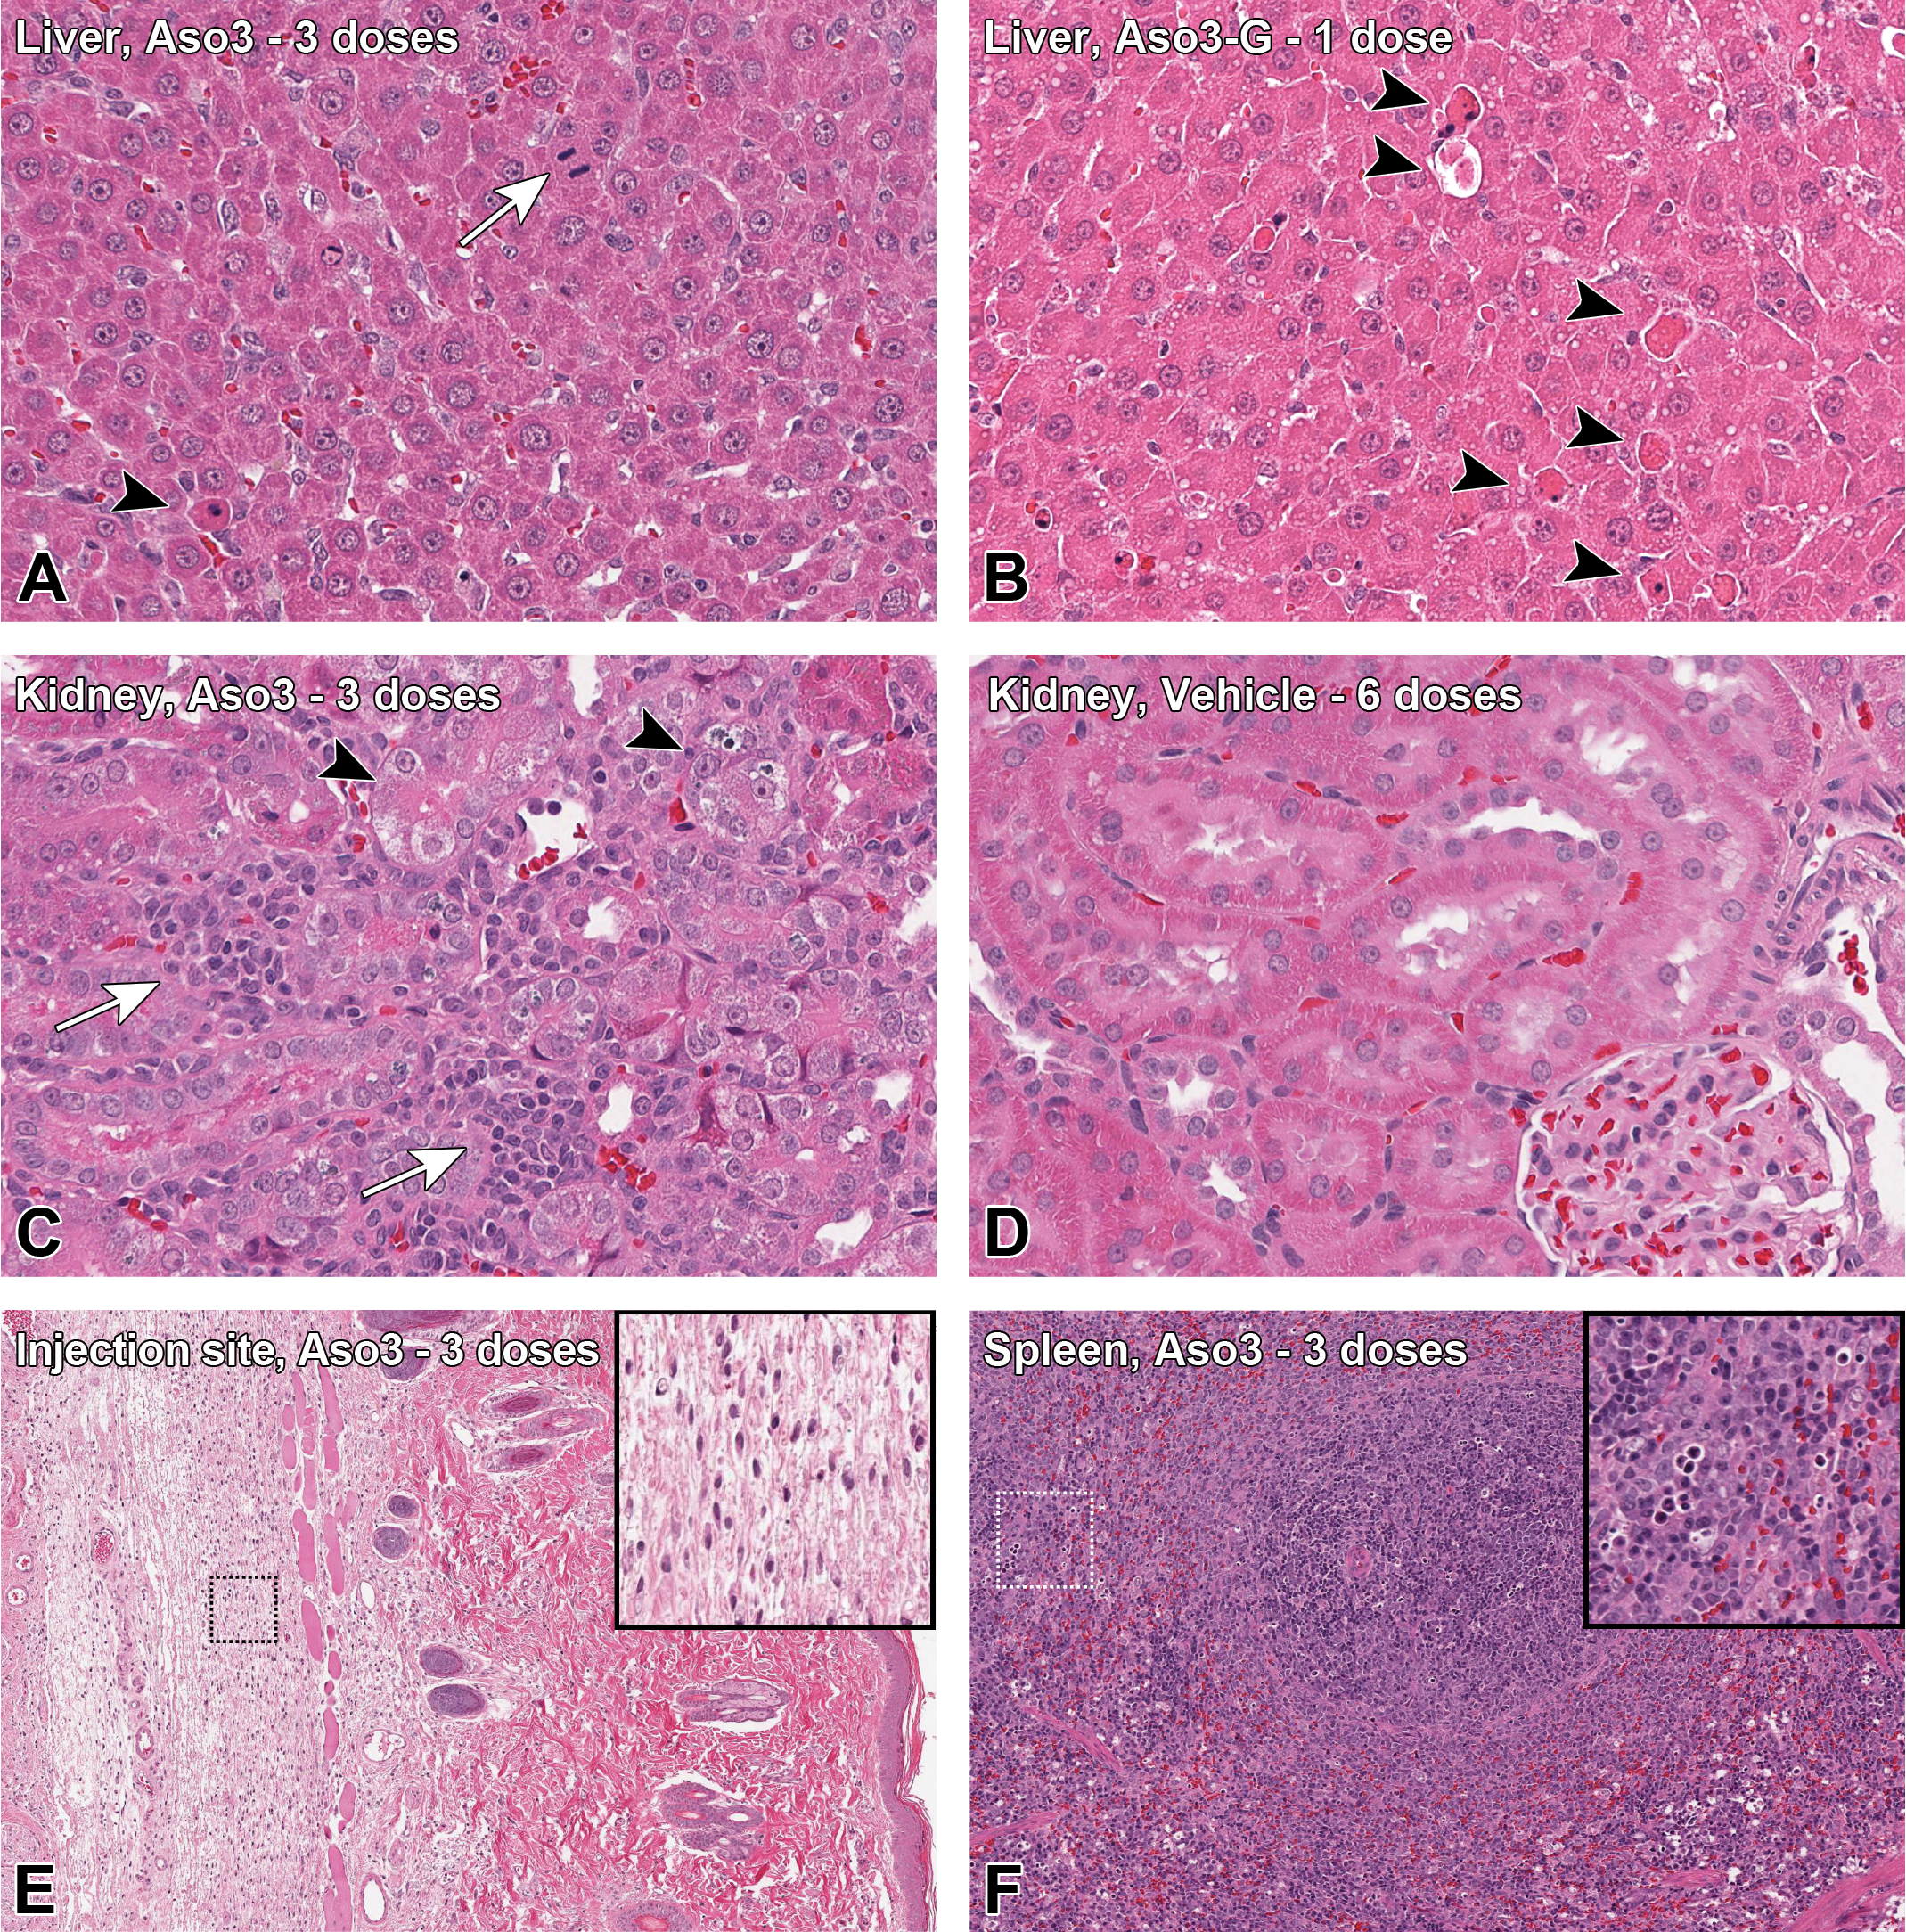
Histopathologic findings. A, Hepatocyte mitoses (arrow) and mild apoptosis/single-cell necrosis (arrowhead), 3 doses of Aso3 (high toxicity [HT]), 40 mg/kg. B, Severe apoptosis/single-cell necrosis (arrowheads), 1 dose of Aso3-G (HT), 20 mg/kg. C, Kidney: Tubular degeneration (arrowheads) and mononuclear inflammatory infiltrates (arrows), 3 doses of Aso3 (HT), 40 mg/kg. D, Kidney: Comparison with the unaffected kidney of a rat administered with 6 doses of vehicle. E, Injection site (skin, interscapular region): Mononuclear inflammatory infiltrates in the subcutis, 3 doses of Aso3 (HT), 40 mg/kg. F, Spleen: Lymphocyte apoptosis and lymphoid follicle hyperplasia, 3 doses of Aso3 (HT), 40 mg/kg. A-D, ×40 magnification; E, F, ×10 magnification. Hematoxylin and eosin stains.
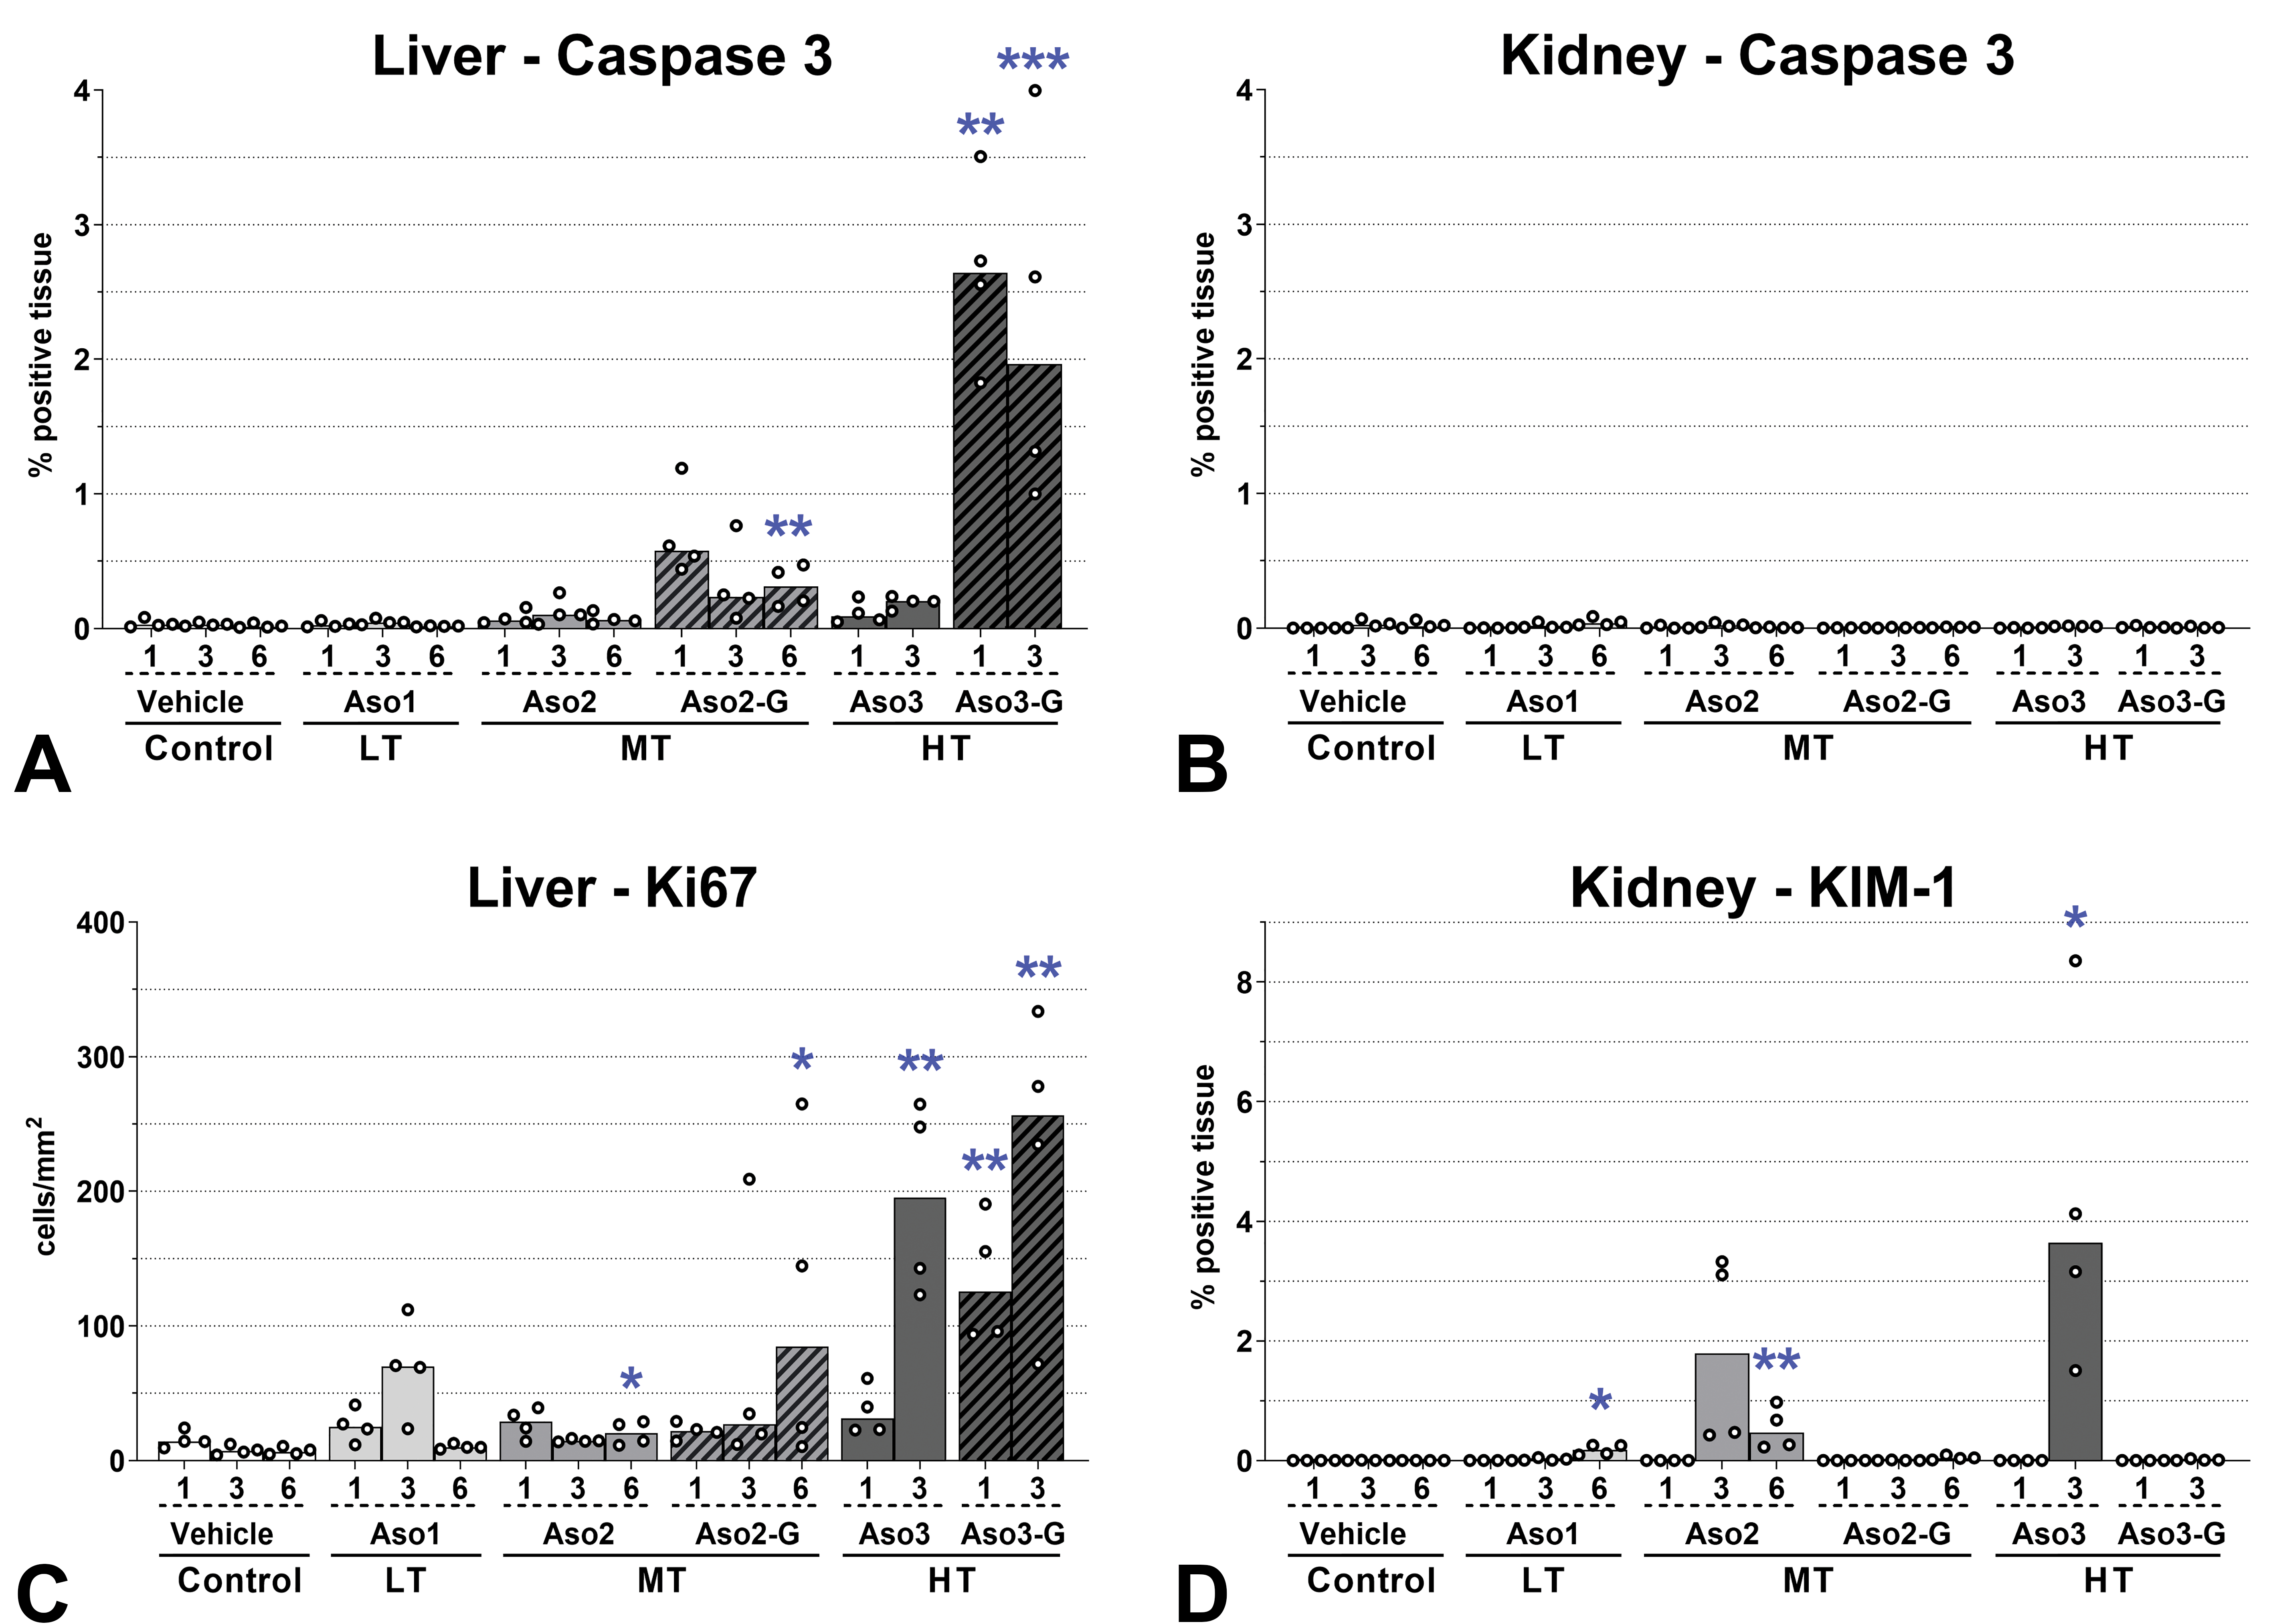
Cell death mechanisms and proliferation. Evaluation by immunohistochemistry of caspase 3 (apoptosis marker), kidney injury molecule 1 (KIM-1, upregulated marker in postischemic rat kidney), and Ki67 (proliferation marker). Values 1, 3, and 6 represent the total number of doses administered. The same scale was used for caspase 3 in liver and kidney. Only cortex was evaluated in the kidney by image analysis. Dots represent individual animals and bars represent median values. Differences between control group and groups dosed with LNA-containing ASOs were determined using a Kruskal-Wallis test followed by Dunn post hoc tests for multiple comparisons. *P < .05; **P < .01; ***P < .001 compared to control; n = 4. ASOs indicates antisense oligonucleotides; LNA, locked nucleic acid.
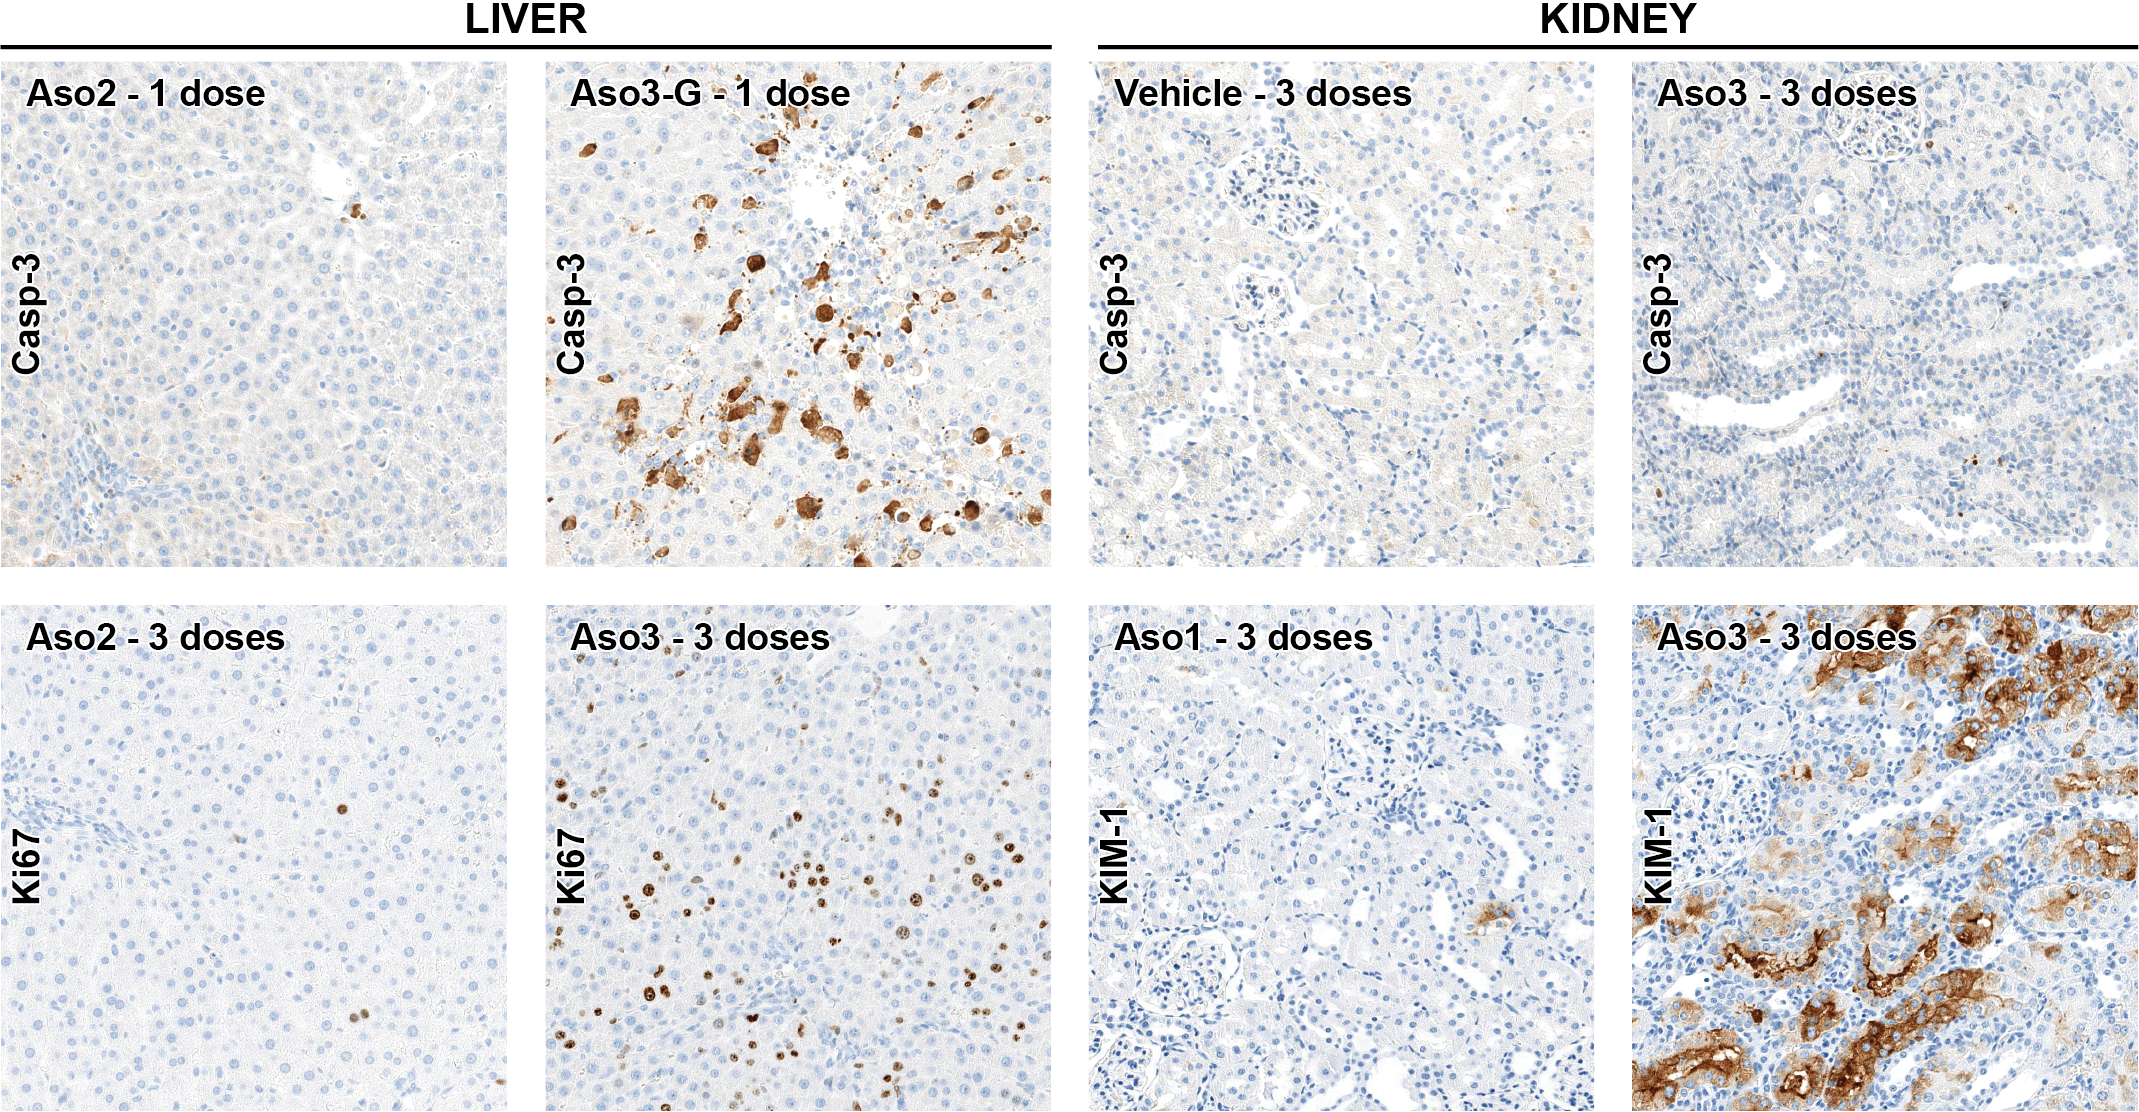
Cell death mechanisms and proliferation. Examples of the immunohistochemical stain for caspase 3, kidney injury molecule 1 (KIM-1), and Ki67 (proliferation marker). The images for Aso3-G/caspase 3/liver and Aso3/KIM-1/kidney represent focal areas of intense immunolabeling. The highest caspase 3 signal in the liver is observed after dosing with Aso3-G (HT), demonstrating cell death mechanisms by apoptosis in this organ. However, in the kidney, there is no difference in the expression of caspase 3 between ASO dosed and control rats. Increased numbers of Ki67+ proliferating cells (mostly in hepatocytes) are observed in the liver of rats dosed with HT compounds (Aso3 and Aso3-G). Aso3 (HT) exhibited the highest KIM-1 signal in proximal tubular epithelial cells, which is indicative of tubular necrosis. All images, ×20 magnification. Immunohistochemistry (DAB chromogen). ASO indicates antisense oligonucleotide; HT, high toxicity.
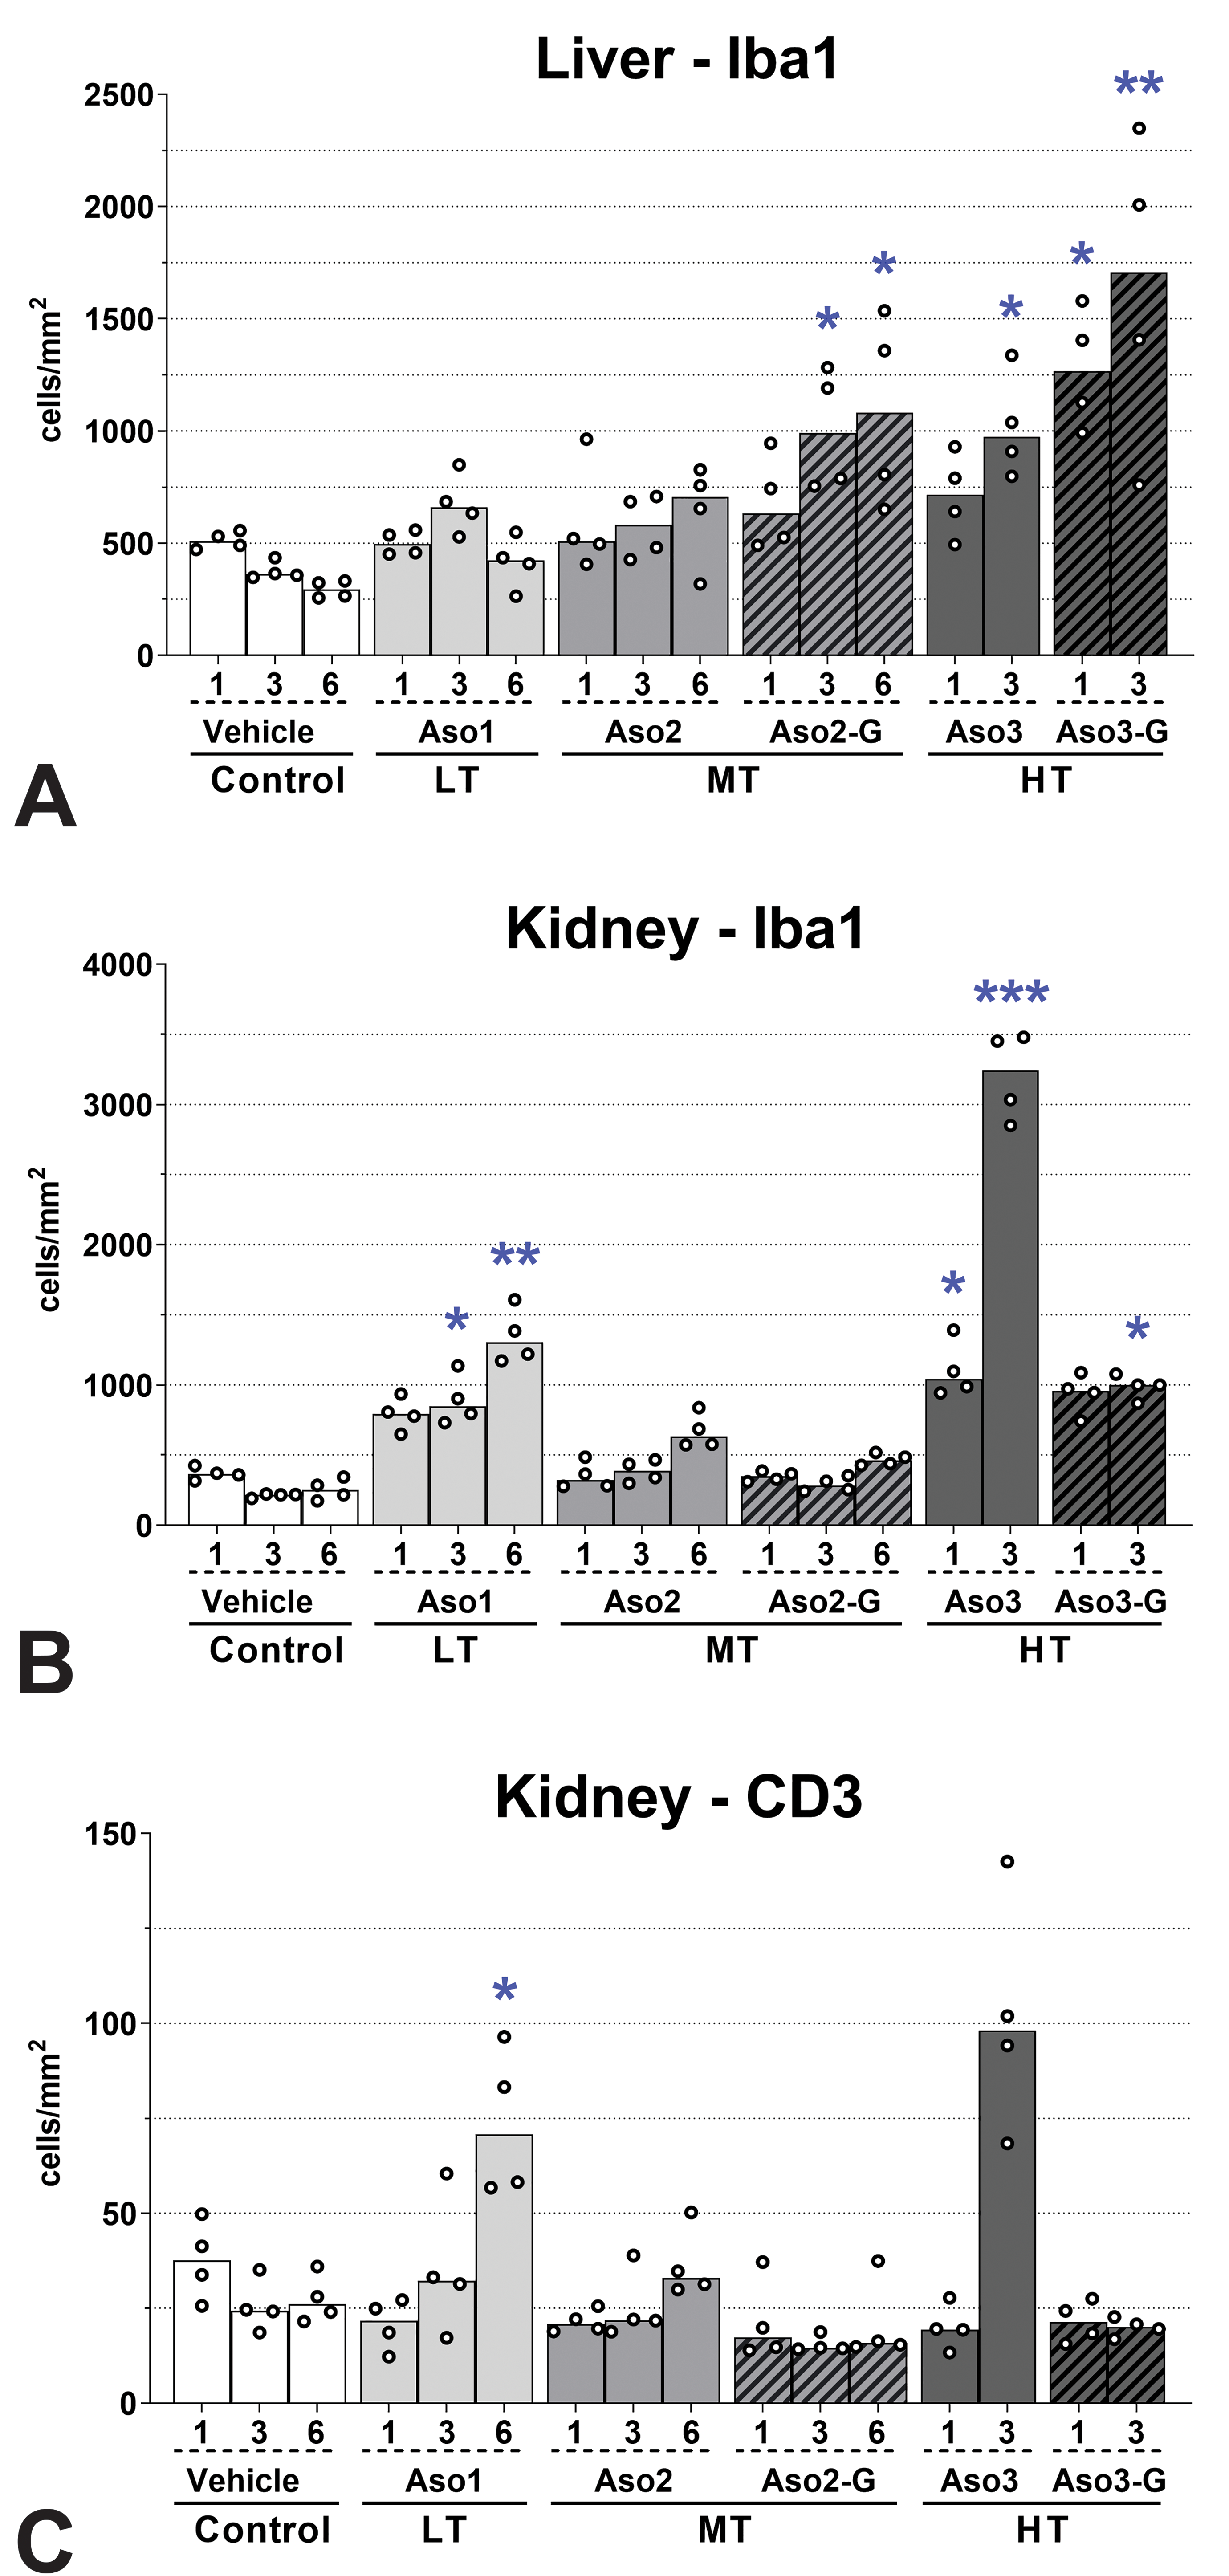
Inflammatory cells in the liver and kidney. Iba1 (macrophages; A, B), and CD3 (T lymphocytes; C). T lymphocytes were not evaluated in the liver, as no lymphoid infiltrates were found in the histopathological evaluation. Values 1, 3, and 6 represent the total number of doses administered. Only cortex was evaluated in the kidney by image analysis. Dots represent individual animals and bars represent median values. Differences between control group and groups dosed with LNA-containing ASOs were determined using a Kruskal-Wallis test followed by Dunn post hoc tests for multiple comparisons. *P < .05; **P < .01; ***P < .001 compared to control; n = 4. ASOs indicates antisense oligonucleotides; LNA, locked nucleic acid.
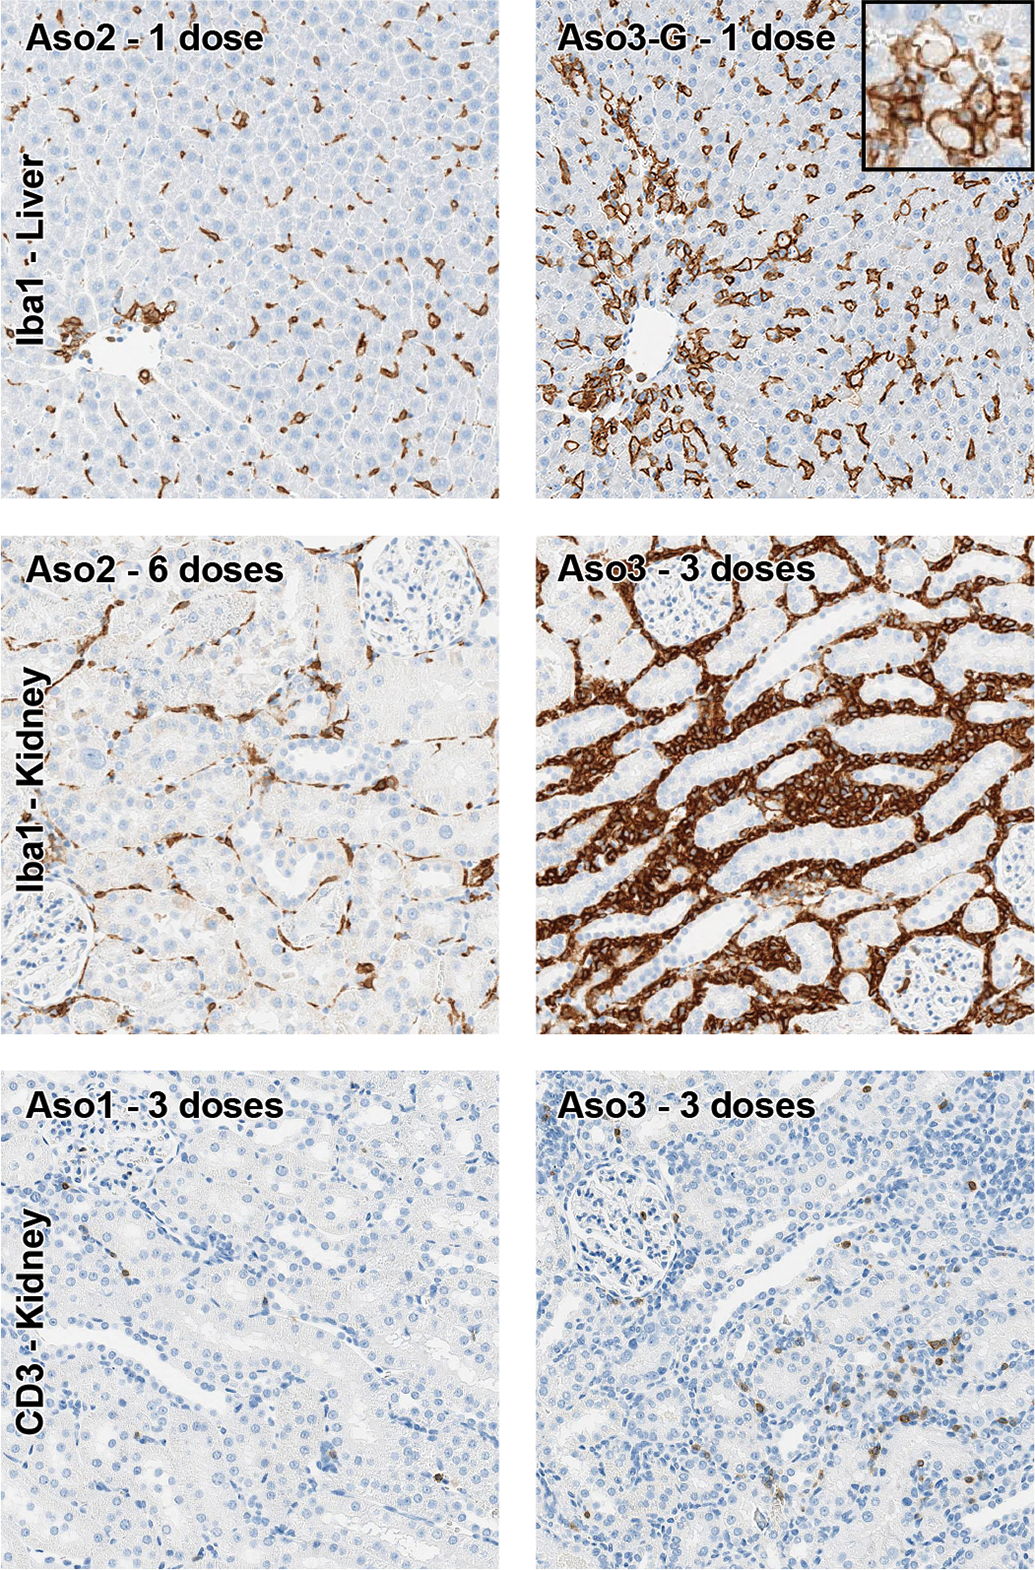
Inflammatory cells in liver and kidney. Representative pictures of the immunohistochemical stain of macrophages (Iba1) and T cells (CD3). Higher Iba1+ cell counts (consistent mostly with Kupffer cells) are observed in the liver with HT ASOs, which are even more numerous with GalNAc-conjugated compounds, compared with naked compounds. The inset represents apoptotic bodies engulfed by Iba1+ cells. In the kidney, Aso3 (HT) showed the highest amount of interstitial mononuclear infiltrates, composed by numerous macrophages (Iba1+) and a lower proportion of T lymphocytes (CD3+). All images, ×20 magnification. Immunohistochemistry (DAB chromogen). ASOs indicates antisense oligonucleotides; HT, high toxicity.
Kidney weights were moderately increased in animals administered 6 doses of Aso2 and 3 doses of Aso3 (Supplementary Table S5). The main histological findings in the kidneys consisted of tubular degeneration/regeneration and mononuclear interstitial infiltrates (Figures 1C and 5). The unconjugated compounds were associated with more severe changes than their GalNAc versions, possibly due to the higher dose and greater kidney uptake. Interestingly, the expression of caspase 3 in the kidney was extremely low in all animals, with no differences between ASO-dosed and vehicle control rats (Figures 2B and 3). However, the expression of KIM-1 revealed statistically significant increases after administration of naked ASOs of MT or HT (Figures 2D and 3). Vimentin, an intermediate filament normally expressed in mesenchymal cells but also in regenerating tubular epithelial cells, 28 was detected in serial sections (alternating with H&E and KIM-1 stains) and showed strong colocalization with KIM-1 in tubules undergoing degeneration/regeneration, but with some differences in the cellular localization (see legend in Figure 6). Assessment of the cell populations in the interstitial infiltrates revealed increased macrophage (Iba1+) counts after repeated doses, with naked compounds eliciting higher increases compared to their GalNAc-conjugated counterparts (Figures 4B and 5). Interestingly, the renal inflammatory cell infiltrates did not directly correlate with the renal toxicity of the compounds. Aso3 was clearly associated with the highest degree of macrophage infiltration. However, the LT compound (Aso1) showed greater macrophage counts than the moderately toxic compound (Aso2). The number of infiltrating T lymphocytes (CD3+) in the kidney was in all groups much lower than the amount of infiltrating macrophages; however, the differences among dosing groups were still evident, and similar to those observed for the macrophages, with Aso3 followed by Aso1 showing the highest cell counts (Figures 4C and 5).
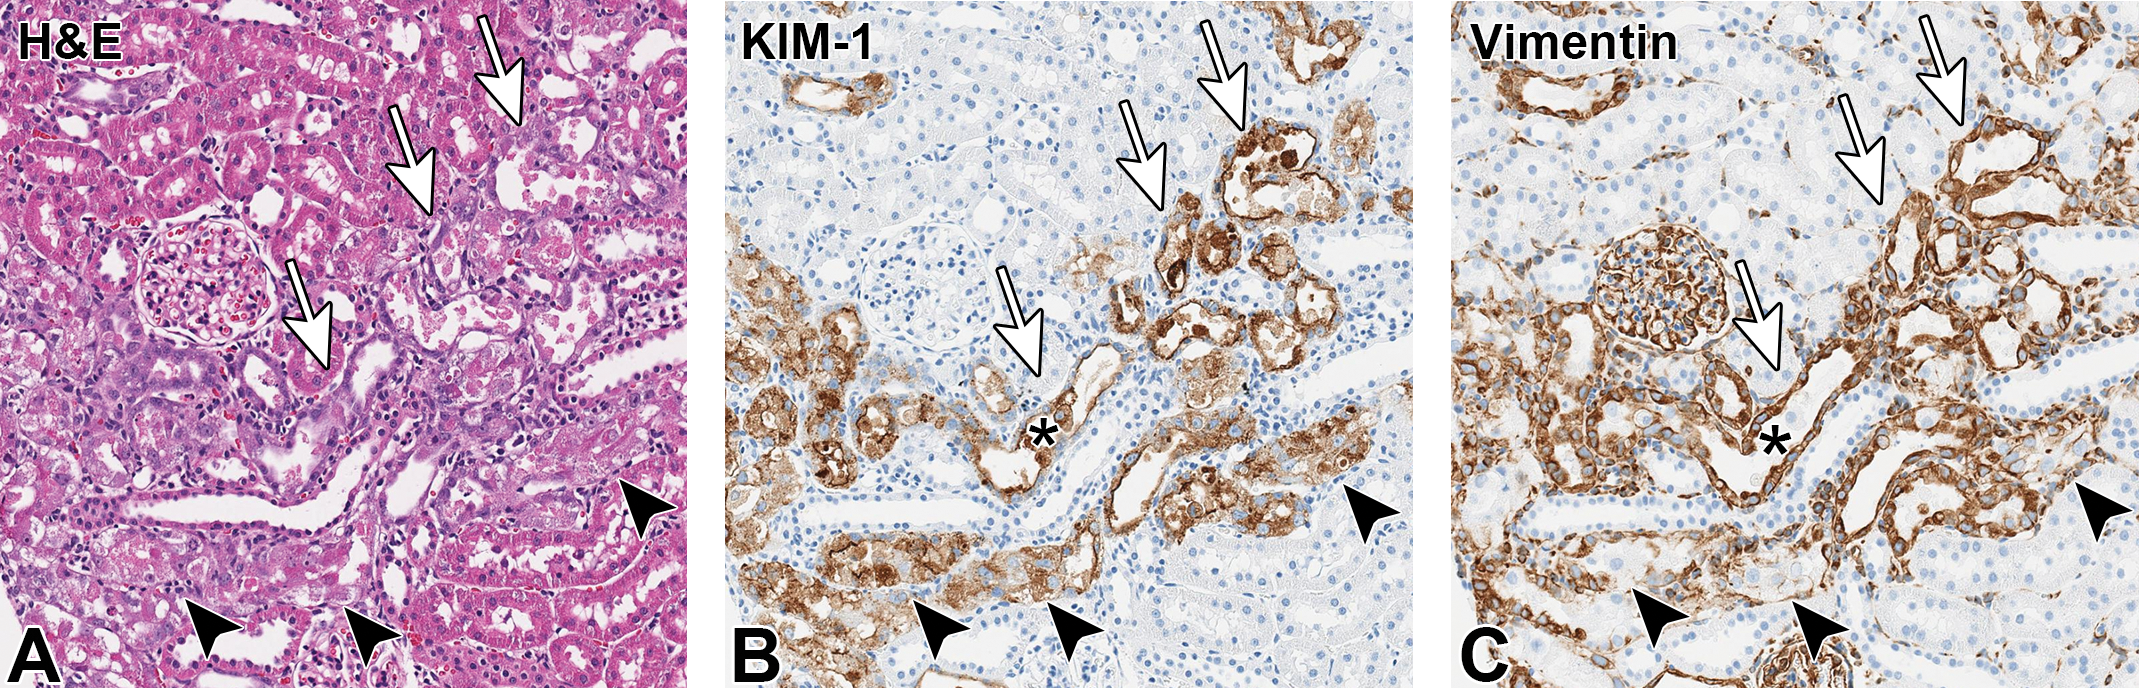
Serial sections of kidney (Aso3, naked, high toxicity, 3 doses). Tubular degeneration and regeneration observed in hematoxylin and eosin (H&E) stain (A), KIM-1 immunohistology (B), and vimentin immunohistology (C) showed a strong colocalization. Degenerating tubules (arrowheads) showed cell swelling, cytoplasmic vacuolation, terminal cellular sloughing, diffuse KIM-1 cytoplasmic staining, and vimentin expression mostly restricted to the basal surface. Regenerating tubules (arrows) show flattened epithelium, strong diffuse vimentin expression, and KIM-1 expression that is more intense in the apical surface. Note that dead cells sloughed into the lumen are KIM-1 positive and vimentin negative (asterisk). All images, ×20 magnification. A, H&E stain; B, C, immunohistochemistry (DAB chromogen).
At the injection site (interscapular region), the subcutis exhibited mononuclear inflammatory infiltrates of variable degree (Figure 1E); in some cases, these were accompanied by mild subcutaneous edema and hemorrhage and mild-to-moderate epidermal necrosis. The most marked changes were observed with Aso3, followed by Aso2.
Increases in spleen weights were observed in animals treated with 3 doses of Aso3, followed by 6 doses of Aso1 and 3 doses of Aso3-G (Supplementary Table S5). The main findings in the spleen consisted of lymphocyte apoptosis in the red pulp (Figure 1F) and lymphoid follicle hyperplasia (most severe after 3 doses of Aso3), as well as the presence of numerous macrophages in the white pulp (most severe after 3 doses of Aso3-G). The axillary lymph nodes, which drain the injection site (interscapular region), showed the most severe pathological changes compared with the mesenteric and mandibular lymph nodes and mainly consisted of lymphocyte apoptosis, inflammatory infiltrates in the pericapsular connective tissue, and abundant macrophages in the paracortex (mostly in rats dosed with Aso3; data not shown). The mesenteric and mandibular lymph nodes only showed minimal apoptosis in single animals, mostly from the Aso3-dosed group.
No treatment-related histopathological abnormalities were detected in the brain, lungs, heart, skeletal muscle, stomach, ileum, and skin distant from the injection site.
Quantitative Exposure Assessment of Full-Length Compounds
The quantitative exposure assessment of full-length tool ASOs (either naked or GalNAc conjugated) revealed higher concentrations in the renal cortex than in the liver, and increasing concentrations with repeat dosing in both organs (Figure 7A and B). The concentration of intact GalNAc-conjugated compounds (Aso2-G and Aso3-G) was extremely low or below the level of detection in both organs (Figure 7A and B, white arrows), confirming thorough cleavage of the GalNAc moiety.
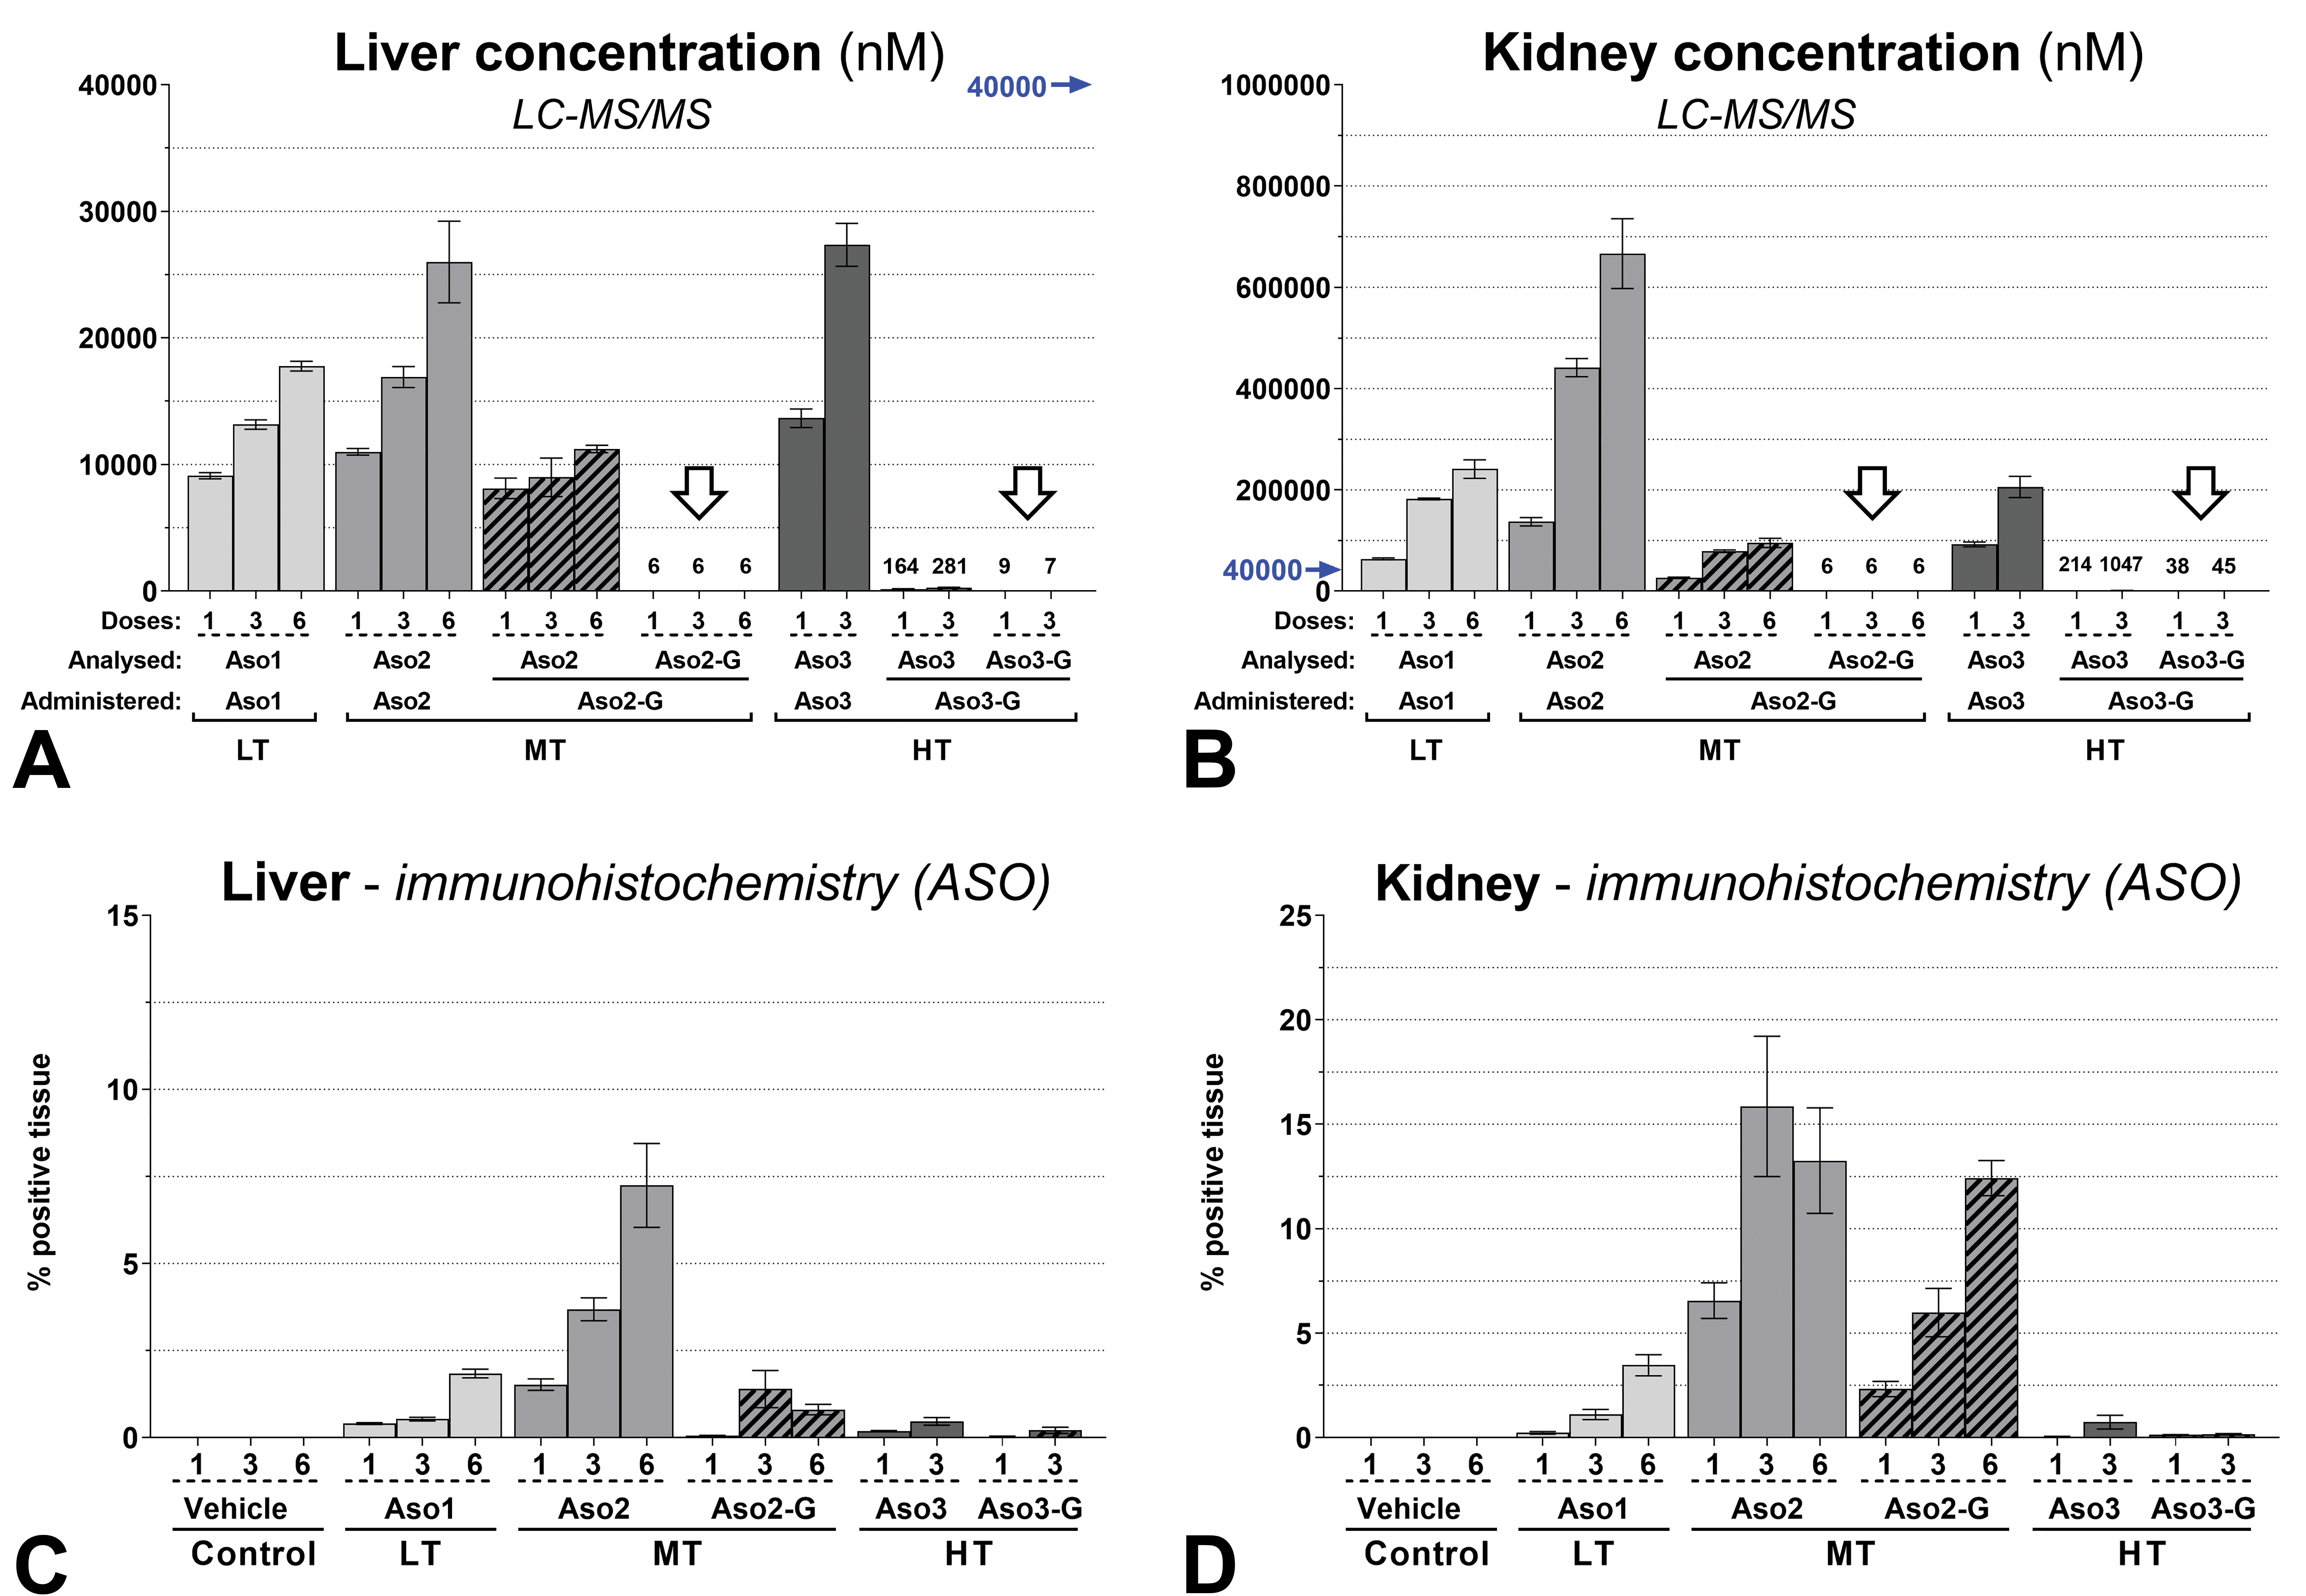
Accumulation of LNA-containing ASO in liver and kidney cortex, measured by LC-MS/MS (A, B) and immunohistochemistry (C, D). Note that LC-MS/MS analysis only measures full-length intact compounds (with or without GalNAc conjugation) and degradation products are not included in this quantification. Values 1, 3, and 6 represent the total number of doses administered. The highest value of the y-axis (A) is represented by a blue arrow (B) to highlight the lower concentration in the liver compared with the kidney cortex. The concentration of intact GalNAc-conjugated compounds (Aso2-G and Aso3-G) was extremely low or below the level of detection in both organs (white arrows), confirming a thorough cleavage of the GalNAc moiety. A-D: Mean values (n = 4) ± SEM. ASO indicates antisense oligonucleotide; LC-MS/MS, liquid chromatography coupled to tandem mass spectrometry; LNA, locked nucleic acid.
Localization of ASOs in Liver and Kidney by IHC, ISH, and Immune EM
All in situ approaches (IHC, ISH, and immune EM) confirmed accumulation of ASOs in a defined set of cell types in both organs.
In the liver, IHC demonstrated naked ASOs mainly in Kupffer cells (abundant cytoplasmic granules), while GalNAc-conjugated ASOs were shown to accumulate within the cytoplasm of both hepatocytes (scattered weak cytoplasmic dots) and Kupffer cells (Figure 8). Immunohistochemistry signal quantification, based on the total amount of immunolabeled ASOs without cell-type differentiation, revealed increased immunolabeling when the number of doses increased (Figure 7C), with Aso2 showing the strongest signal. For ISH, image analysis failed to show an increase in signal in association with repeated dosing (data not shown), possibly because the probe hybridization reaction may have been partially blocked when the ASOs accumulated at high rates, potentially forming strand aggregates. Immune EM showed electron-dense gold-positive vesicles (EGPVs) within Kupffer cells of rats dosed with both naked (Figure 9E) and GalNAc-conjugated ASOs. These mainly exhibited a round shape consistent with phagosomes (Figure 9E), unlike ASOs in the kidney, where more irregular shapes were observed. The EGPVs were observed within hepatocytes in rats dosed with GalNAc-conjugated ASOs (Figure 9F), but not in rats dosed with naked ASOs. No gold labeling was found within the nuclei of liver cells.
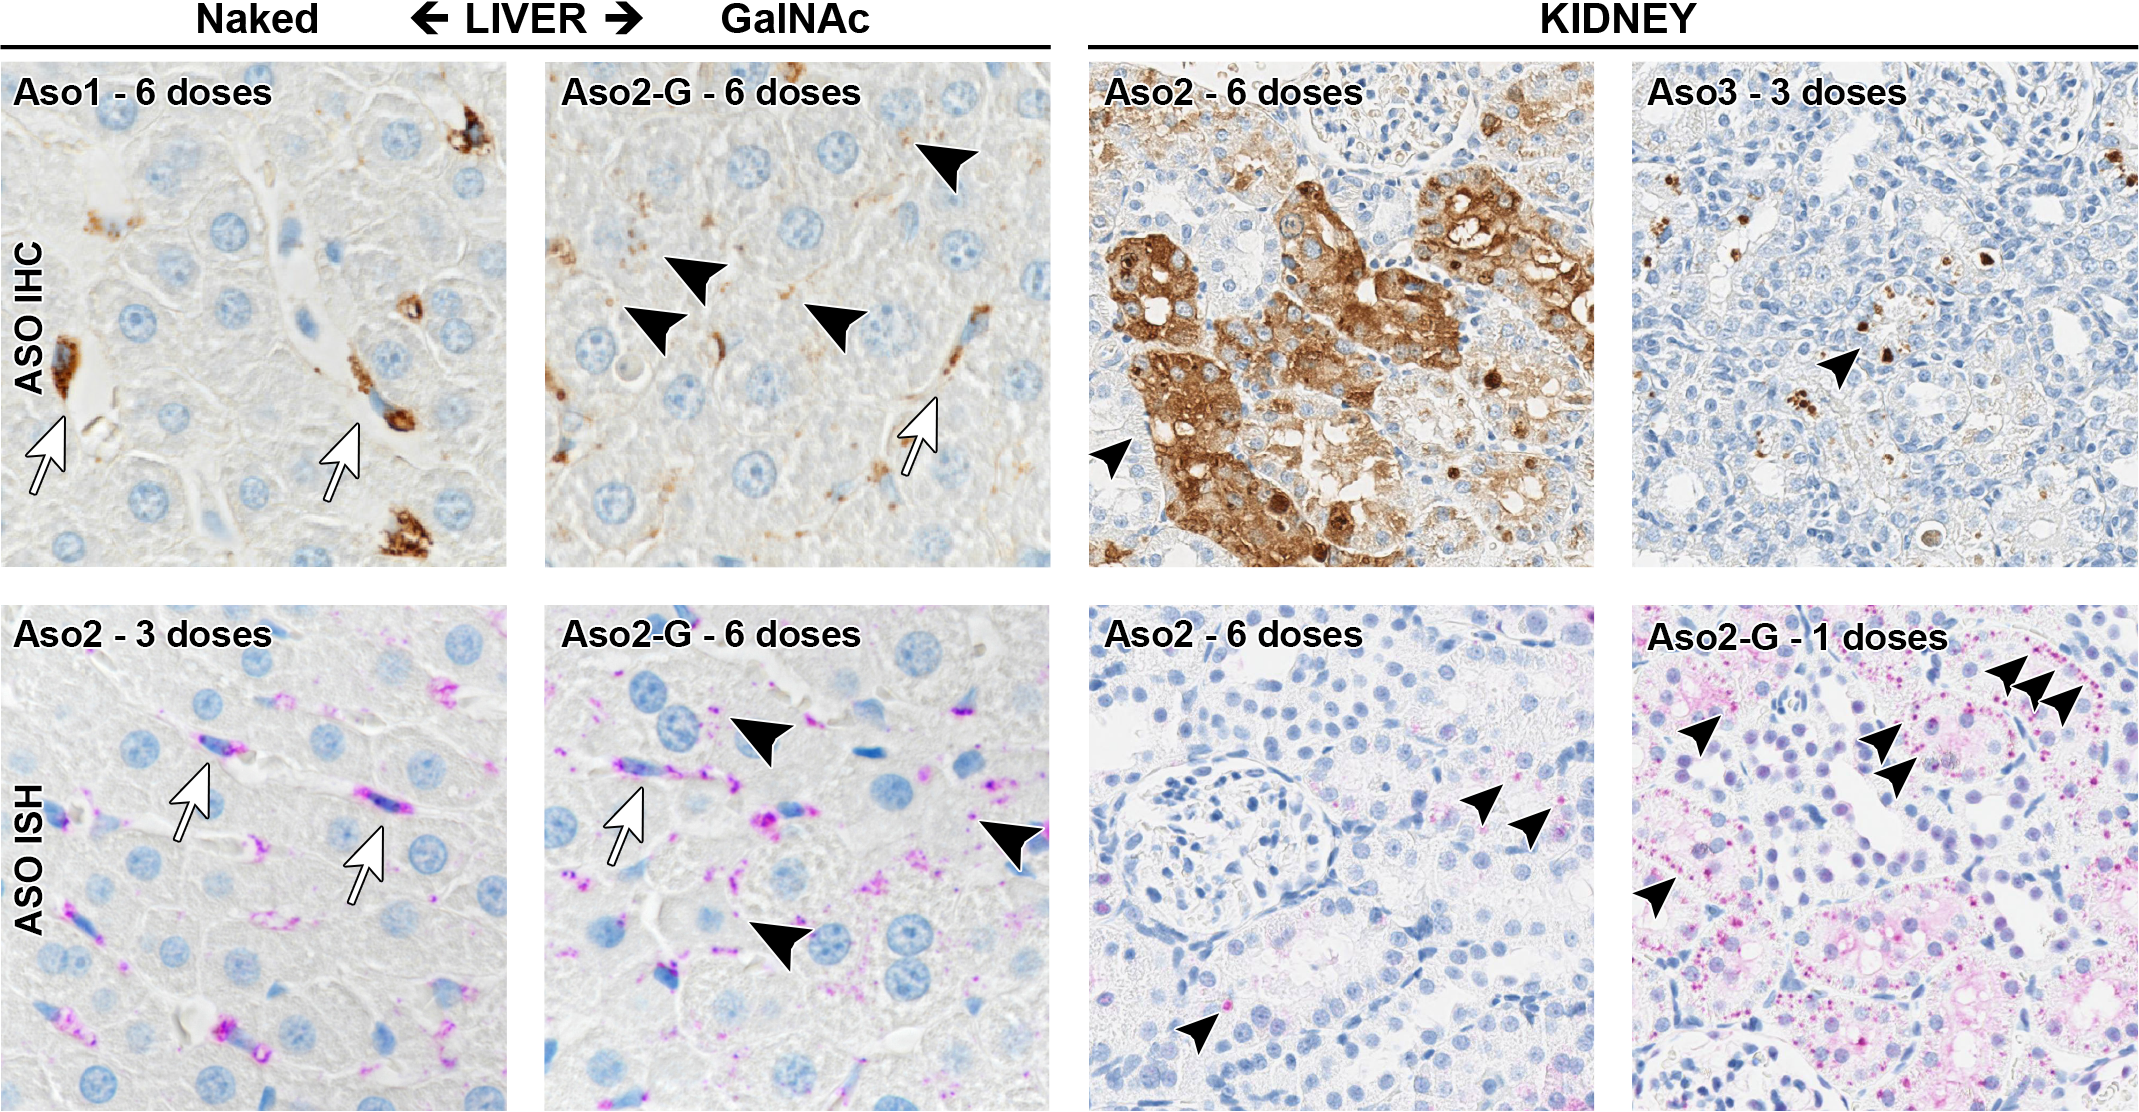
Accumulation of LNA-containing ASO in liver and kidney. Representative pictures of the localization by immunohistochemistry (IHC) and in situ hybridization (ISH). In the liver, naked ASOs accumulated mainly in Kupffer cells (arrows), and at very low levels within hepatocytes. GalNAc-conjugated ASOs accumulated not only within Kupffer cells (arrows) but also within hepatocytes (arrowheads). In the kidney, all tool LNAs, independent of their conjugation status, accumulated primarily in proximal tubular epithelial cells (arrowheads). Liver, ×60 magnification; kidney, ×40 magnification. IHC (DAB brown chromogen); ISH (purple chromogen). ASO indicates antisense oligonucleotides; LNA, locked nucleic acid.
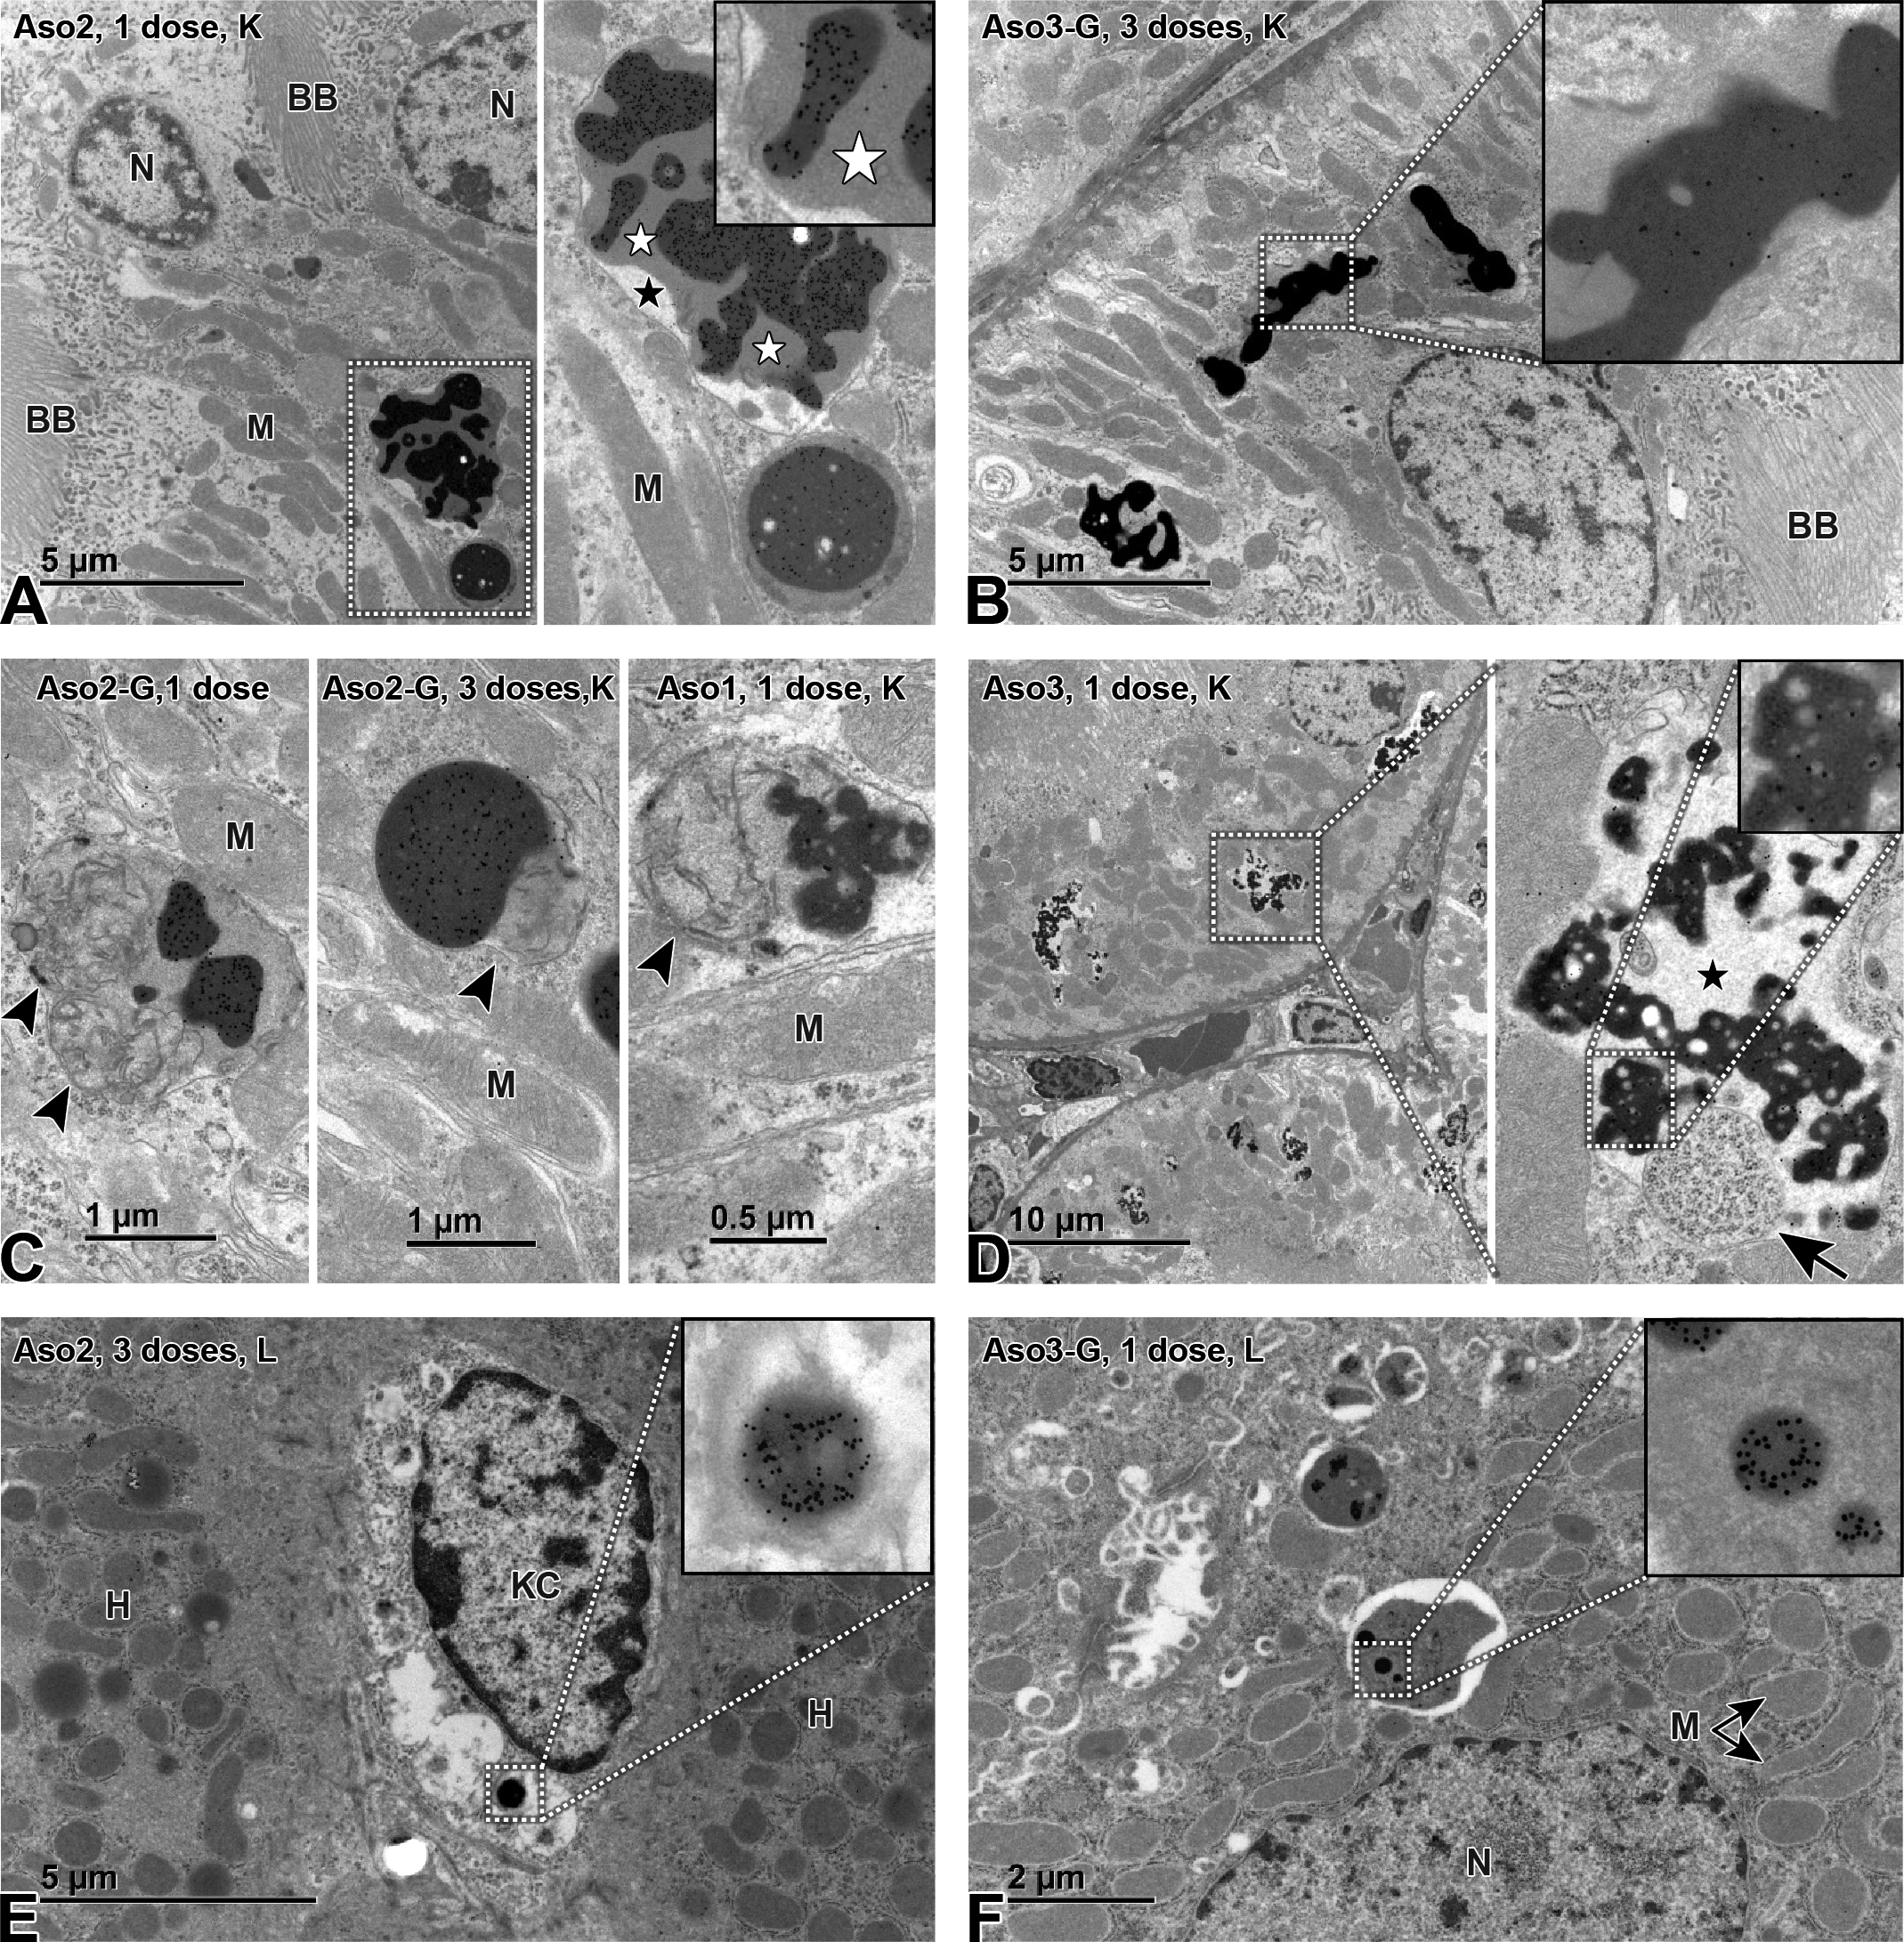
Immunogold transmission electron microscopy labeling of ASOs in kidney (K; A-D) and liver (L; E, F). The LNA-containing ASO were observed in the kidney in proximal tubular epithelial cells as electron-dense gold-positive vesicles (EGPVs) with irregular shape consistent with endosomes or secondary lysosomes (A-D). These EGPVs showed differences in the density of gold particles (A, top vs bottom EGPV, and A vs B). Some organelles undergoing degradation were observed in the kidney within some membranes containing the ASOs, suggesting (at least partially) common pathways with autophagy (mitochondria [C, arrowheads]; ribosomes and RER [D, arrow]). EGPVs were observed surrounded by a moderately electron-dense material (gray; A, white stars) and/or by electron-lucent material (white; A, D, black stars), which is highly suggestive of lysosomal content and osmotic swelling, respectively. In the liver, EGPVs were observed within Kupffer cells in rats dosed with both naked (E) and GalNAc-conjugated ASOs, showing a rounder morphology consistent with phagosomes. EGPVs were observed within hepatocytes in rats dosed with GalNAc-conjugated ASOs (F), but not in rats dosed with naked ASOs. ASO indicates antisense oligonucleotide; BB, brush border; KC, Kupffer cell; LNA, locked nucleic acid; M, mitochondria; N, nucleus; H, hepatocyte.
In the kidney, IHC showed that all tool LNAs, both naked and GalNAc conjugated, accumulated primarily in the cortex, in epithelial cells of the proximal tubuli (Figure 8). Again, IHC quantification revealed increased immunolabeling with repeated dosing (Figure 7D), with Aso2 showing the strongest signal. Interestingly, the immunolabeling of Aso3 (associated with high nephrotoxicity) was weaker than the immunolabeling of Aso2 (associated with a more moderate nephrotoxicity). Image analysis failed to show an increase in signal in association with repeated dosing (data not shown), possibly due to the same reason as suspected for the liver. Immune EM revealed LNA-containing ASOs in proximal tubular epithelial cells, as EGPV with irregular shape (Figures 9A-D) consistent with endosomes (before fusion with lysosomes), or secondary lysosomes (after fusion with lysosomes). Differences in the density of gold particles were observed within the same sample (Figure 9A) and across compounds (Figure 9A vs B). Aso2 and Aso2-G yielded a stronger gold reactivity (Figure 9A and C) compared with Aso1 (Figure 9C), Aso3 (Figure 9D), and Aso3-G. Some organelles undergoing degradation (mitochondria [Figure 9C], ribosomes and RER [Figure 9D]) were occasionally observed in the kidney within some membranes containing the LNA vesicles in all treated groups. The EGPVs were found to be surrounded by moderately electron-dense material (gray; Figure 9) and/or by electron-lucent material (white; Figure 9). Again, no gold labeling was found within the nuclei of renal cells.
Metabolite Identification
Metabolite identification was performed by high-resolution MS in liver and kidney cortex tissue homogenates. A summary of the different metabolites found is given in Figure 10. For the unconjugated Aso1 and Aso2, mainly the unchanged parent drug and one main metabolite resulting from cleavage of one nucleotide from the 3′-end, were observed in both the kidney and the liver. Further degradation from the 3′-end to short-mer metabolites (11-mers to 6-mers) of Aso1 and Aso2 were only found in the liver and only at smaller signal intensities. In the liver and kidney of rats treated with the GalNAc-conjugated Aso2-G, the most abundant metabolite found was the full-length oligonucleotide (= Aso2) resulting from cleavage at the cleavable phosphodiester linker, and the subsequent Aso2 metabolite resulting from cleavage of one nucleotide from the 3′-end. Aso2-G is composed of an ASO moiety (= full-length Aso2) that is conjugated with a triantennary GalNAc by 2 diphosphate-containing 2′-deoxyribonucleotides; thus, Aso2 was released by hydrolysis of the 2 diphosphate-linked nucleotide part (“cleavable linker”). Aso3 was metabolized to several shorter-mer metabolites in the liver and kidney, ranging from 14-mers to 6-mers (cleavage from 3′-end). Like Aso3, the GalNAc-conjugated Aso3-G also showed several main metabolites in liver and kidney, mainly consisting of cleavage of GalNAc and parts of the trishexylamino-C6 linker followed by further degradation from the 3′-end yielding shorter-mer oligonucleotides with a remaining part of the linker, an amino-hexyl moiety at the 5′-end. Unlike Aso1, Aso2, and Aso2-G, the metabolism of Aso3 and Aso3-G did not result in one main metabolite, but several shorter-mer metabolites present at comparable signal intensities.
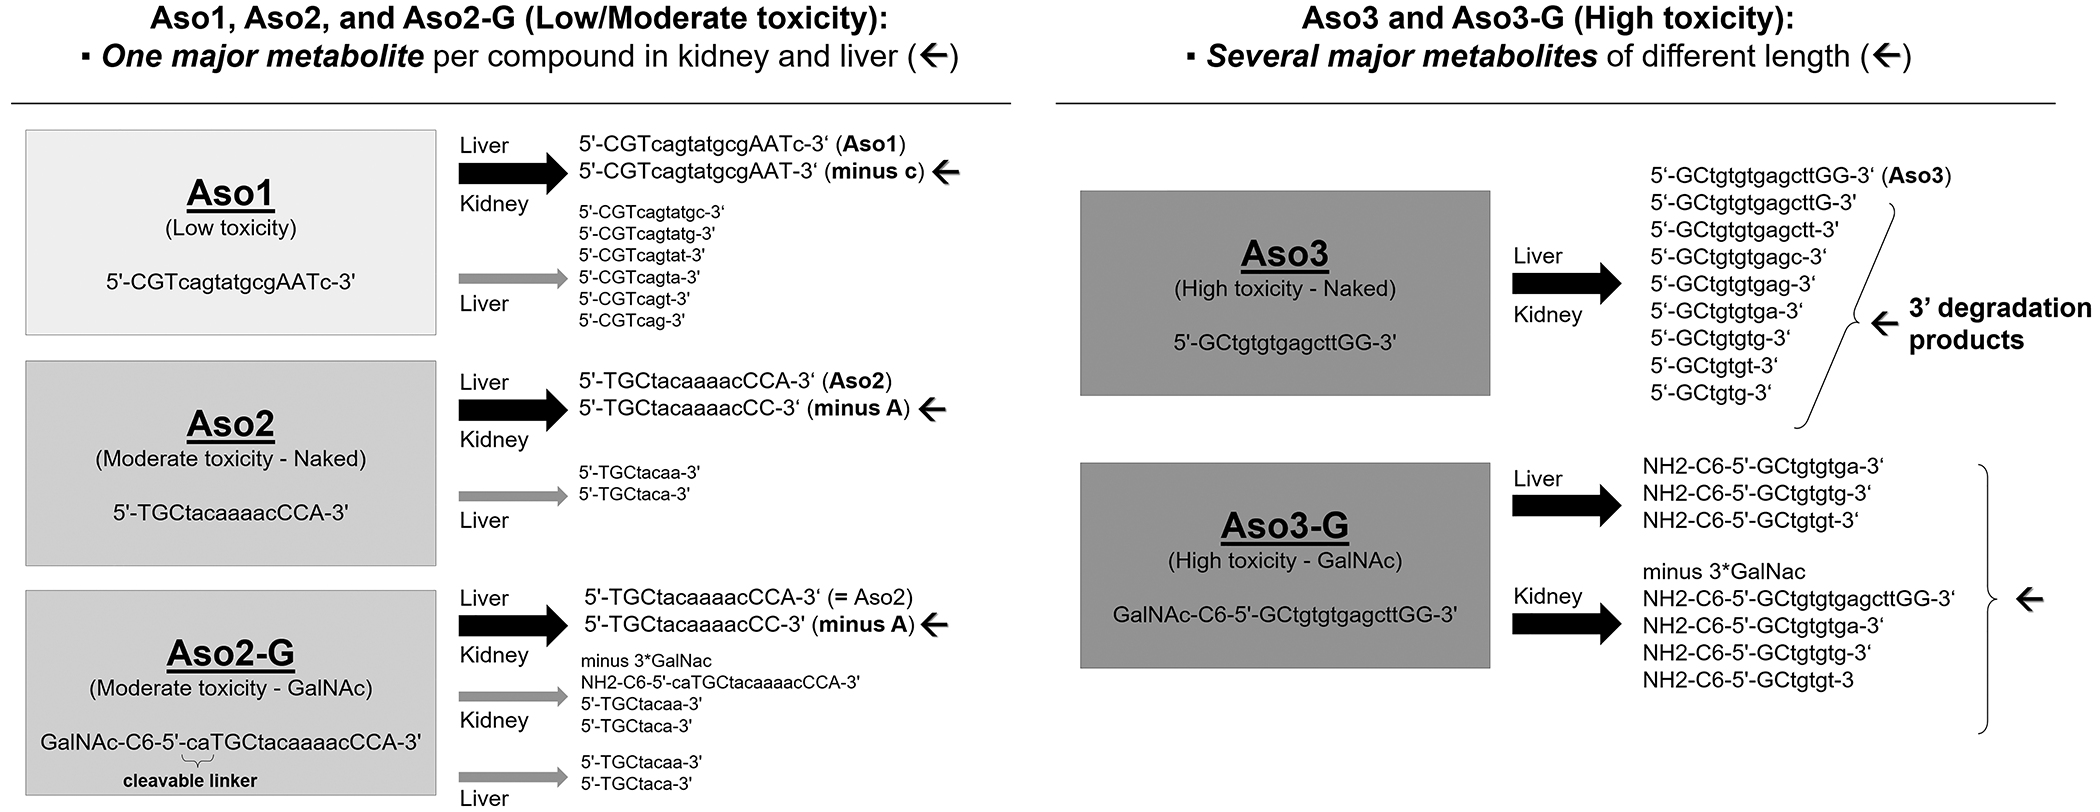
Metabolite identification. Summary of metabolites identified by liquid chromatography coupled to tandem mass spectrometry in liver and kidney tissue of rats dosed with different antisense oligonucleotides. Thick black arrows indicate the most abundant metabolites; gray thin arrows indicate minor (scarce) metabolites. The nucleotide sequence of the metabolites is represented with: a, adenine; g, guanine; c, cytosine; t, thymine; with lowercase standing for 2-deoxyribose nucleotides (DNA), and uppercase for their locked counterparts (locked nucleic acid).
For all ASO compounds investigated here, the metabolite profiles were generated in animals receiving 1, 3, or 6 successive doses, and the metabolites and their relative quantities appeared not to change as the number of doses increased.
Matrix-Assisted Laser Desorption/Ionization Fourier-Transform Ion Cyclotron Resonance MS Imaging
A fragment originating from the PS backbone (m/z 94.9362 Da) was successfully used to visualize the distribution of different ASOs in the tissues. Mass signals of PS-linked ASO-drug material were observed in the renal cortex for all 5 compounds with different intensities (Figure 11). In general, rats dosed with naked ASOs (40 mg/kg) showed a stronger ion intensity than rats dosed with GalNAc-conjugated ASOs (20 mg/kg). Among the naked compounds, Aso1 and Aso2 showed the most intense signals, unlike the very weak (but still present) ion intensity observed with Aso3. A very weak signal diffusely distributed in the cortex and medulla was observed in the vehicle-dosed control; this represents the background reaction. In the liver, mass signals of LNA-containing ASOs were also observed, but with lower intensity than in the kidney, and with a more diffuse pattern (data not shown).
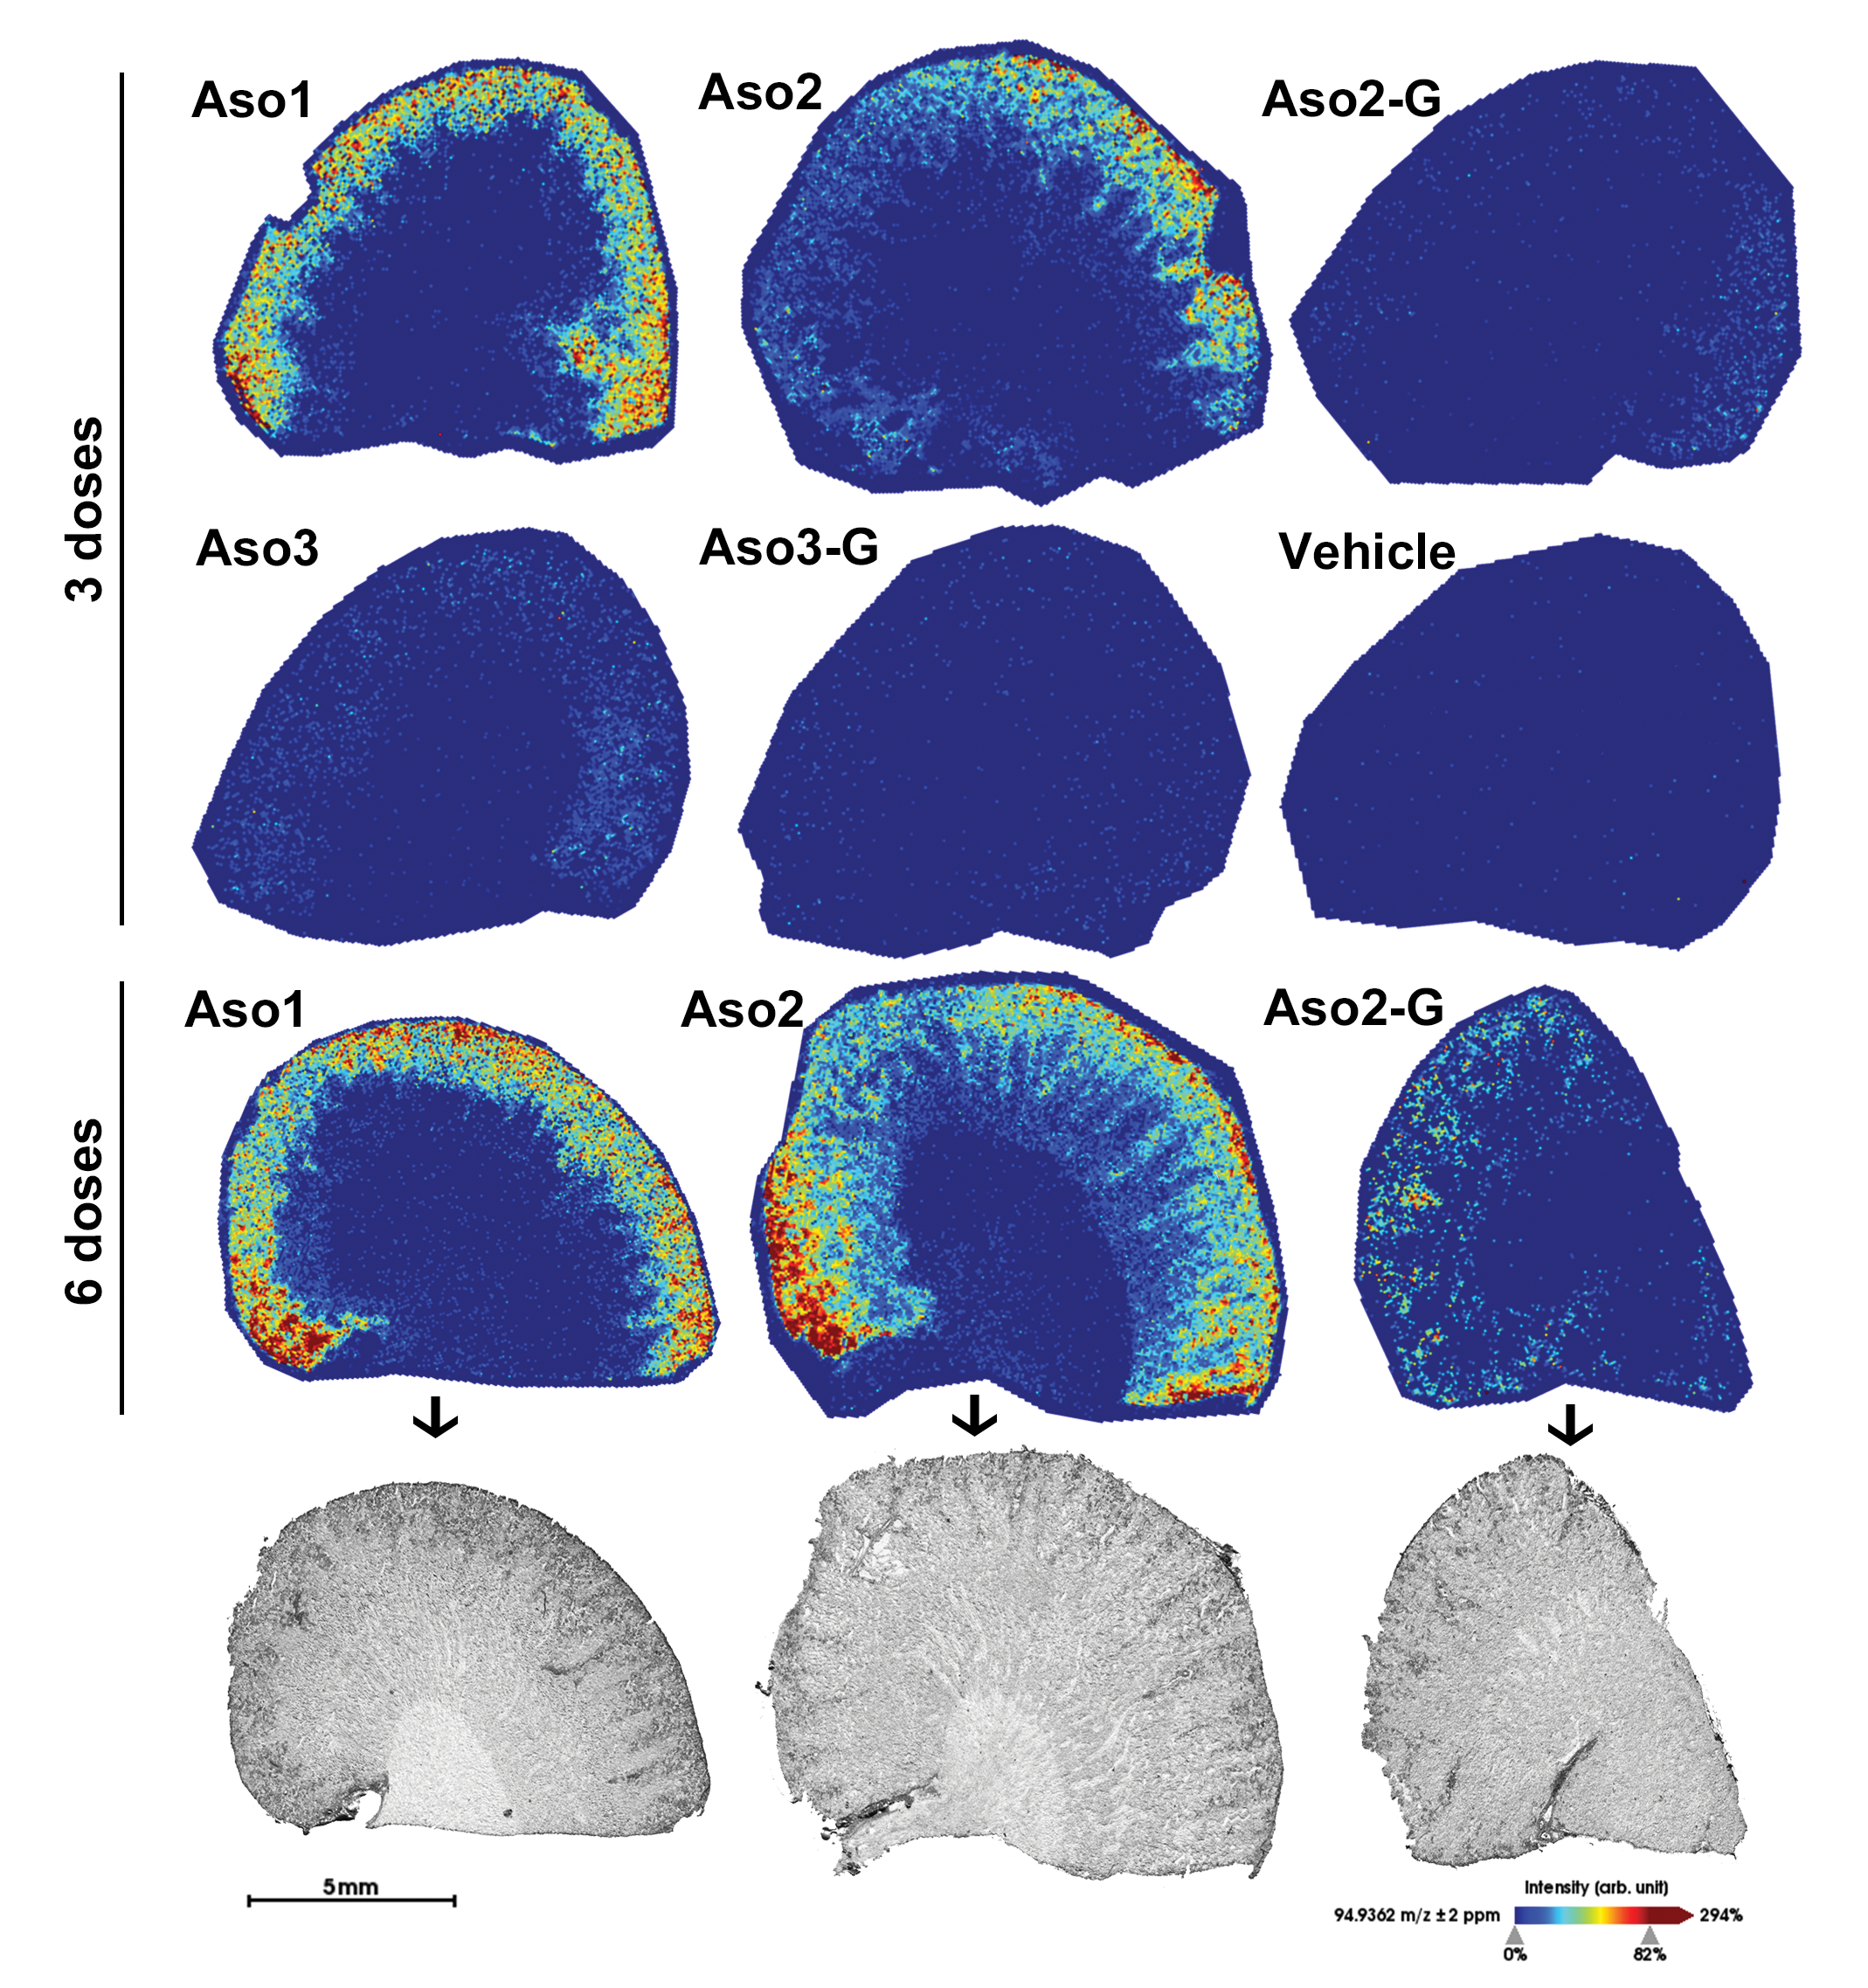
MALDI-FTICR-MS molecular imaging in rat kidney tissue. The images in rows 1 to 3 demonstrate in sagittal kidney sections the spatial distribution of 94.9362 m/z, a fragment specific to phosphorothioate-linked oligonucleotides, administered to the animals. The MS signal intensity was converted to images using a colormap ranging from blue (no signal) to red (highest signal intensity). Row 4 shows the optical scans of the kidney sections before MALDI MS corresponding to the images of row 3. FTICR indicates Fourier-Transform Ion Cyclotron Resonance; MALDI, matrix-assisted laser desorption/ionization; MS, mass spectrometry.
Discussion
In the present study, accumulation of naked and GalNAc-conjugated LNA-containing ASOs was confirmed in the liver and kidney with different approaches (bioanalytics, IHC, ISH, immune EM, and MALDI MSI). We confirmed their different safety profiles (based on clinical and anatomic pathology) and studied their metabolism, with the aim of characterizing mechanisms of toxicity.
Treatment with toxic GalNAc-conjugated compounds had a higher hepatotoxic effect than their naked counterparts. This finding possibly reflects the greater exposure of hepatocytes with GalNAc conjugates compared to naked ASOs. GalNAc-conjugated compounds had an apparent less intense toxic effect in the kidneys than their naked counterparts; this is likely due to the lower dose amplified by the fact that less compound reaches the kidney as a result of the hepatocyte-targeted delivery. Moreover, previous in vitro studies with proximal tubular epithelial cells have demonstrated that GalNAc conjugation attenuates ASO-induced renal toxicity. 24
Despite being considered a histological hallmark of the presence of ASOs, 29 basophilic granules were not observed in the proximal tubular epithelial cells in H&E-stained sections in the present study. However, evident dark blue granules (consistent with the gold positive vesicles observed by immune EM) were clearly visible in the renal tubular epithelium in toluidine blue–stained semithin sections (data not shown), and there was clear evidence of ASO accumulation by IHC and ISH. It is possible that a difference in the HE staining protocol, or components used in the present study, may be responsible for the lack of visible basophilic granules.
Staining of serial sections for KIM-1 and vimentin showed a strong colocalization of the markers with degenerating and regenerating tubules, respectively, and revealed that both degeneration and regeneration coexist during ASO-induced tubular injury. Renal tubule regeneration occurs in response to degeneration and/or necrosis of renal tubular epithelium. 30,31 The morphologic changes observed in the proximal tubular epithelium are consistent with oncotic necrosis 30,32 and supported by the expression of KIM-1 (known to be overexpressed during necrosis) 33 alongside the extremely minimal caspase 3 expression in both ASO-dosed and vehicle control rats. In contrast, in the liver, the expression of caspase 3 is indicative of apoptosis, although based on morphological evaluation, both apoptosis and necrosis appear as concomitant cell death mechanisms. 34,35 Further, both necrosis and apoptosis of hepatocytes have been shown to be associated with elevated serum transaminases. 36 Increased expression of caspase 3 in hepatocytes 37 but not in proximal tubular epithelial cells 38 has also been observed in vitro after treatment with toxic LNA-containing ASOs. It remains unclear why the presence of apoptosis is observed only in the liver, but not in the kidney, suggesting organ-dependent mechanisms of toxicity.
Quantitative assessment of Ki67 immunolabeling revealed increased cell proliferation in the liver after dosing with the highly toxic compounds, which mainly affected hepatocytes and, to a lesser extent, Kupffer cells. This hepatocyte proliferation is most likely a regenerative response to toxic injury. 39 Increased cell counts of Iba1+ cells in the liver revealed that Kupffer cells also proliferate in association with liver injury, possibly as an adaptive response to remove apoptotic hepatocytes. 40 Additional recruited macrophages may also contribute to the increased Iba1+ cell counts, but to a lower extent than Kupffer cells, since Kupffer cells are the largest resident tissue macrophage population and can proliferate in response to liver injury.
The present study included immune EM to gain knowledge on the subcellular distribution of LNA-containing ASOs. In the kidneys, this yielded EGPVs with irregular shape, consistent with endosomes or secondary lysosomes. Differences in the density of gold particles seen within the same sample were possibly due to different stages of ASO uptake and degradation. Differences observed across compounds, however, may be due to different concentrations of ASOs within vesicles, supporting the IHC, MALDI MS imaging, and quantitative exposure assessment findings. Differences in antibody binding affinity to the compounds may also contribute, since pairs of naked and GalNAc-conjugated ASOs showed similar gold particle densities. The presence of some organelles undergoing degradation in the kidney within the same membranes containing the LNA vesicles suggests common pathways with autophagy, but additional analyses are needed to explore this hypothesis. The EGPVs frequently found to be surrounded by either moderately electron-dense material and/or electron-lucent material are highly suggestive of lysosomal content and osmotic swelling, respectively. Primary lysosomes, known to contain enzymes exhibiting a homogeneous electron density, can become secondary lysosomes by merging, for example, with endosomes (as proposed here). The EGPVs contain ASOs, which could attract water by osmosis, explaining the electron-lucent areas surrounding some EGPV. In the liver, rounder shaped EGPVs were found in Kupffer cells, suggesting phagocytic uptake and storage in phagosomes/phagolysosomes, whereas they appeared to be in endosomes/endolysosomes in renal tubular epithelial cells from endocytic uptake. 41 –43 The present study did not find evidence of ASO deposition in the nucleus or within hepatocytes in rats dosed with naked ASOs, despite the fact that ASOs can also act within the nucleus and that naked ASOs can penetrate hepatocytes, although at much lower rates than GalNAc-conjugated ASOs. 4,18 The nonproductive uptake pathway of ASOs accounts for the bulk of ASO accumulating in cells, and a much reduced amount is delivered to the target RNA cellular compartment (productive uptake). 44,45 Therefore, immunogold labeling may be insufficiently sensitive to detect minor amounts of ASOs escaping the nonproductive uptake.
Previous studies in rats have used the kidney toxicity biomarkers used in this study. 46 After dosing with tool toxic ASO, we observed fold-increase values, which correlated with the toxicity grades. B2M, CYST, NGAL, OPN, and AGP, and especially ALBU and KIM-1, reflected the expected safety profiles for the concerned ASOs. We confirmed the correlation of KIM-1 both in situ and in urine samples, supporting its high diagnostic value (at least in the rat) to evaluate in vivo the nephrotoxicity of ASOs. B2M and CYST showed significant changes compared to controls even after only 1 dose, highlighting their potential to predict kidney dysfunction. Six of these biomarkers (KIM-1, B2M, CYST, NGAL, OPN, and CLST) have been recently assessed for ASO-induced tubular toxicity in a mouse model, and 5 of them (KIM-1, B2M, CYST, NGAL, and CLST) resulted in treatment-related elevations associated with proximal tubular pathology, confirming their value as kidney injury biomarkers. 47
To our knowledge, only 2 recent studies on rat eyes and mouse kidneys have so far successfully detected oligonucleotides in tissue sections by MALDI MSI, 22,23 with approaches based on a time of flight detector. In the present study, an FTICR high mass-resolving analyzer was applied for the first time to ASO imaging, leading to major improvement in sensitivity and spatial resolution of MS imaging technologies. 48 Our method is based on a diagnostic fragment formed efficiently upon strong collisional activation originating from the PS backbone (O2PS−: m/z 94.9362 Da). This fragment allowed sensitive determination of PS-linked oligonucleotides, independent of their sequence or GalNAc conjugation. Since PS linkage is a common modification of therapeutic oligonucleotides, this approach might be more broadly applicable in investigating tissue distribution of this evolving therapeutic modality. The MALDI-FTICR MSI enabled unequivocal identification of PS-linked ASOs in the renal cortex. The intense signal observed in the kidney after dosing with the naked compounds compared with the GalNAc-conjugated counterparts was most likely related to the different dose levels administered (40 mg/kg of naked vs 20 mg/kg GalNAc conjugated) and resulting higher concentrations. However, among the naked compounds, Aso1 and Aso2 yielded much more intense signals than the highly toxic compound Aso3, which was in agreement with the IHC and quantitative LC-MS/MS results. Since the MALDI-MS approach used is based on the detection of a diagnostic fragment originating from the PS backbone, it can be assumed that not only full-length ASOs but also shorter-mer metabolites (provided they generate the fragment) are detected, though with potentially different efficacy. This approach shares similarities with IHC to detect ASOs, since the antibody used is also directed against the PS backbone. The more extensive degradation of Aso3 into shorter chain metabolites, likely resulting in easier elimination in the urine, may explain the weak signal obtained in kidneys from Aso3-dosed animals by both MALDI-MS imaging and IHC.
The results discussed so far show that greater nephrotoxicity can be seen in molecules with low kidney cortex accumulation (eg, Aso3), while other molecules are less toxic despite accumulating to higher degrees (eg, Aso2). This suggests that compound-specific properties account for toxicity thresholds. We, therefore, hypothesize hereafter that the metabolic profile of an ASO may play a contributory role.
Using LC-MS/MS bioanalytical quantification, only full-length intact compounds, with and without the GalNAc moiety, were measured. The metabolite identification explained why Aso3 and specially Aso3-G were found at very low levels during the bioanalytical exposure assessment. Aso3 and Aso3-G, the most toxic of the ASOs, had several major metabolites. Notably, Aso2-G has a cleavable linker (“_c_a_” dimer with phosphodiester linkage) between the GalNAc and the ASO moieties that favors a “clean” cleavage without remnants of the linker attached to the ASO moiety, thereby allowing the detection of the ASO moiety by LC-MS/MS. Aso3-G, however, has by design no cleavable point (Table 2), explaining why part of the linker remains attached to the ASO moiety, thus preventing the detection of the ASO moiety by LC-MS/MS. The presence of LNA-modified nucleotides in the wings increases the binding affinity to mRNA sequences and the resistance to nuclease degradation. 5 Aso3/Aso3-G have 2 LNA nucleotides in the wings, unlike the 3 nucleotides in Aso1 and Aso2/Aso2-G (Table 2), partially explaining the different metabolism/degradation patterns. The present study showed that the most toxic compounds are also the most extensively catabolized ones, suggesting that they release a pool of potentially toxic metabolic by-products. However, catabolism may favor clearance, and intuitively, a greater clearance would be expected to reduce toxicity. Further investigations are needed to address the potential role of metabolites in cytotoxicity.
The expression of KIM-1 in the kidney reflected the safety profile, with the highest levels observed after multiple doses of Aso3 (HT), followed by Aso2 (MT) and Aso1 (LT). However, the pro-inflammatory or immunostimulatory properties did not strictly follow the safety profiles. Interestingly, the LT compound (Aso1) showed more intense inflammatory cell infiltrates and higher spleen weights than the moderately toxic compound (Aso2). Unlike apoptosis, in cell death by necrosis, an inflammatory response proportional to the degree of necrosis in the kidney is expected. 32 This was the case for the highly toxic compound (Aso3), but not for Aso1 (LT), which showed more pronounced inflammatory responses than Aso2 (MT), suggesting that the inflammatory cell infiltrations with Aso1 are likely primary, rather than a consequence of tubular necrosis. The presence of unmethylated cytosine-phosphorus-guanine dinucleotides within specific flanking bases (CpG motifs) serves as a marker (recognized by TLR9 in mammalian cells) to distinguish bacterial from mammalian DNA. 49,50 In our tool compounds, the LNA residues have methylated cytosine to abolish immunostimulatory effects. 51 However, in the DNA gap region of Aso1, there is a CpG dinucleotide that possibly contributed to the observed renal inflammatory infiltrations and increased spleen weights. Two different mechanisms associated with inflammation for Aso1 and Aso3, respectively, are suggested: the presence of a CpG dinucleotide in the case of the low toxic compound with scramble sequence (Aso1), and inflammation secondary to tubular necrosis in the case of the highly toxic compound (Aso3), which may be in turn related to hybridization-dependent off-target effects within the rat transcriptome.
Recent studies show that maintaining the melting temperature (Tm) of LNA-ASOs below a threshold level of around 55 °C greatly diminishes the hepatotoxic potential 52 associated with hybridization-dependent off-targets effects. The LNA-ASOs used in our study (Table 2) support this 52 and suggest that potential off-target effects may have contributed to the toxicity observed here. For those ASOs with fast and extensive catabolism, the intensity of these off-target hybridization events may have waned as the ASOs were degrading, suggesting that the off-target effects may not be the sole mechanism of toxicity. Additional mechanisms of toxicity triggered by smaller metabolites unrelated to off-target effects (eg, different binding to intracellular proteins) cannot be excluded.
In conclusion, our in vivo study with LNA-containing ASOs demonstrates that in the kidney, the predominant cell death mechanism associated with toxicity is necrosis, unlike the liver, where both apoptosis and necrosis play a role. We also corroborate the concept in the oligonucleotide field, that across compounds, a higher tubular nephrotoxicity is not necessarily associated with higher accumulation of ASOs. The quantification of both inflammatory infiltrates and tubular toxicity in the kidney supports that the immunostimulatory properties of ASOs can either be a primary effect due to sequence-dependent specific properties or secondary to cell necrosis. The present study also provides new ultrastructural insights into the uptake and intracellular compartmentalization of ASOs.
Supplemental Material
sj-docx-1-tpx-10.1177_01926233211011615 – Supplemental material for Safety, Tissue Distribution, and Metabolism of LNA-Containing Antisense Oligonucleotides in Rats
Supplemental material, sj-docx-1-tpx-10.1177_01926233211011615 for Safety, Tissue Distribution, and Metabolism of LNA-Containing Antisense Oligonucleotides in Rats by Fernando Romero-Palomo, Matthias Festag, Barbara Lenz, Simone Schadt, Andreas Brink, Anja Kipar, Bernd Steinhuber, Christophe Husser, Erich Koller, Sabine Sewing, Yann Tessier, Pawel Dzygiel, Guy Fischer, Michael Winter, Udo Hetzel, Michael J. Mihatsch and Annamaria Braendli-Baiocco in Toxicologic Pathology
Supplemental Material
sj-docx-2-tpx-10.1177_01926233211011615 – Supplemental material for Safety, Tissue Distribution, and Metabolism of LNA-Containing Antisense Oligonucleotides in Rats
Supplemental material, sj-docx-2-tpx-10.1177_01926233211011615 for Safety, Tissue Distribution, and Metabolism of LNA-Containing Antisense Oligonucleotides in Rats by Fernando Romero-Palomo, Matthias Festag, Barbara Lenz, Simone Schadt, Andreas Brink, Anja Kipar, Bernd Steinhuber, Christophe Husser, Erich Koller, Sabine Sewing, Yann Tessier, Pawel Dzygiel, Guy Fischer, Michael Winter, Udo Hetzel, Michael J. Mihatsch and Annamaria Braendli-Baiocco in Toxicologic Pathology
Footnotes
Acknowledgments
This research project would not have been possible without the highly skilled technical support of F. Hoffmann-La Roche personnel from in vivo, clinical pathology, histopathology, bioanalytical, and toxicokinetics laboratories, as well as from the Electron Microscopy Unit at the Institute of Veterinary Pathology in Zurich. The authors thank Annie Moisan for fruitful discussions on study design, as well as Balazs Banfai and Jasmin Kuratli for their valuable support and discussions with the statistical analysis. The authors also thank Andreas Dieckmann for providing his expert opinion and for calculating the melting temperatures (Tm).
Declaration of Conflicting Interests
All authors, except for MJM, AK, and UH are, or were, employed by F. Hoffmann-La Roche, Ltd. The author(s) declared no potential conflicts of interest with respect to the research, authorship, and/or publication of this article.
Funding
The author(s) disclosed receipt of the following financial support for the research, authorship, and/or publication of this article: This work was supported and funded by F. Hoffmann-La Roche Ltd, Basel, Switzerland, under the Roche Postdoctoral Fellowship (RPF) program.
Supplemental material
Supplemental material for this article is available online.
References
Supplementary Material
Please find the following supplemental material available below.
For Open Access articles published under a Creative Commons License, all supplemental material carries the same license as the article it is associated with.
For non-Open Access articles published, all supplemental material carries a non-exclusive license, and permission requests for re-use of supplemental material or any part of supplemental material shall be sent directly to the copyright owner as specified in the copyright notice associated with the article.