
Abstract
Quantification of retinal atrophy, caused by therapeutics and/or light, by manual measurement of retinal layers is labor intensive and time-consuming. In this study, we explored the role of deep learning (DL) in automating the assessment of retinal atrophy, particularly of the outer and inner nuclear layers, in rats. Herein, we report our experience creating and employing a hybrid approach, which combines conventional image processing and DL to quantify rodent retinal atrophy. Utilizing a DL approach based upon the VGG16 model architecture, models were trained, tested, and validated using 10,746 image patches scanned from whole slide images (WSIs) of hematoxylin-eosin stained rodent retina. The accuracy of this computational method was validated using pathologist annotated WSIs throughout and used to separately quantify the thickness of the outer and inner nuclear layers of the retina. Our results show that DL can facilitate the evaluation of therapeutic and/or light-induced atrophy, particularly of the outer retina, efficiently in rodents. In addition, this study provides a template which can be used to train, validate, and analyze the results of toxicologic pathology DL models across different animal species used in preclinical efficacy and safety studies.
Keywords
Introduction
Routine histopathology evaluation in rodent and nonrodent preclinical/toxicity studies involves light microscopic evaluation of a standard list of at least 40 organs/tissues (resulting in hundreds to thousands of slides) in male and female animals. 1,2 The purposes of these qualitative or semiquantitative evaluations are to identify test item-related morphologic differences between control and treated/diseased groups of animals and their severity as well as the integration of these data with other study data. 3 Conventional histopathology is limited to a qualitative or semiquantitative assessment (normal, minimal, mild, moderate, or marked) and may be imprecise for assessing minimal changes. Semiquantitative scoring of pathology findings (eg, incidence, size, distribution, cell number or density, features such as vacuolation, mitosis, apoptosis, and others) enhances the quality, reproducibility, and rigorous interpretation (through appropriate statistical analysis) of toxicology or translational animal studies. 4 –7
The practice of toxicologic pathology is increasingly enabled by digital or computational tools such as image analysis that can automate manual assays, eliminate subjective scoring, and provide quantitative results rapidly, 8 -10 as well as aid in the qualification of translational biomarkers. 11 These new tools can also mitigate some of the drawbacks of traditional toxicologic pathology evaluation, including the potential for “diagnostic drift” or a gradual change in diagnoses or severity scores over time, 12 as well as observational bias arising from the knowledge of treatment groups, doses, or animal gender during evaluation. 2,13
More recently, machine learning and deep learning (DL) models have been proposed and utilized during histopathology assessment in toxicity studies. 14 -27 These approaches generate quantitative data automatically from large data sets that can be applied in general toxicity studies as well as to studies aimed at elucidating mechanisms of toxicity. These tools also enable high throughput digital image analysis that increases the accuracy, efficiency, and speed of histopathology evaluation, and allow integration of other study data (eg, clinical pathology, transcriptomics) to determine pathomechanisms of disease or toxicity. 28
Retinal toxicity may arise from a direct effect of a test item, intraocular administration of a therapeutic or vehicle for ocular disease, or laboratory animal husbandry such as light exposure. 29 -36 Animal models of retinal degeneration and atrophy are also widely used to increase understanding of human disease and to test potential treatments and diagnostic tools. 12,37,38 Rodent retinal atrophy, particularly light-induced retinal atrophy, typically starts with the loss of cells in the outer nuclear layer (ONL) through apoptosis. This results in reduced ONL thickness that may extend to the inner nuclear layer (INL) and disrupt the photoreceptor layer in severe cases. Quantification of retinal atrophy, specifically thinning of the ONL and INL of the retina, by manual measurement of retinal layers is labor intensive and time-consuming. 39,40 In addition, traditional image segmentation and analysis techniques were found in our early development work on these images to be inadequate for reliably identifying retinal layers. Herein, we report the development of 2 different DL models (2-class and 3-class) to sequentially assess retinal atrophy, particularly of the ONL and INL, in rats.
Materials and Methods
In this study, a hybrid approach combining conventional image processing and DL was used to identify and quantify rodent retinal atrophy; Figure 1 describes the workflow of this approach.
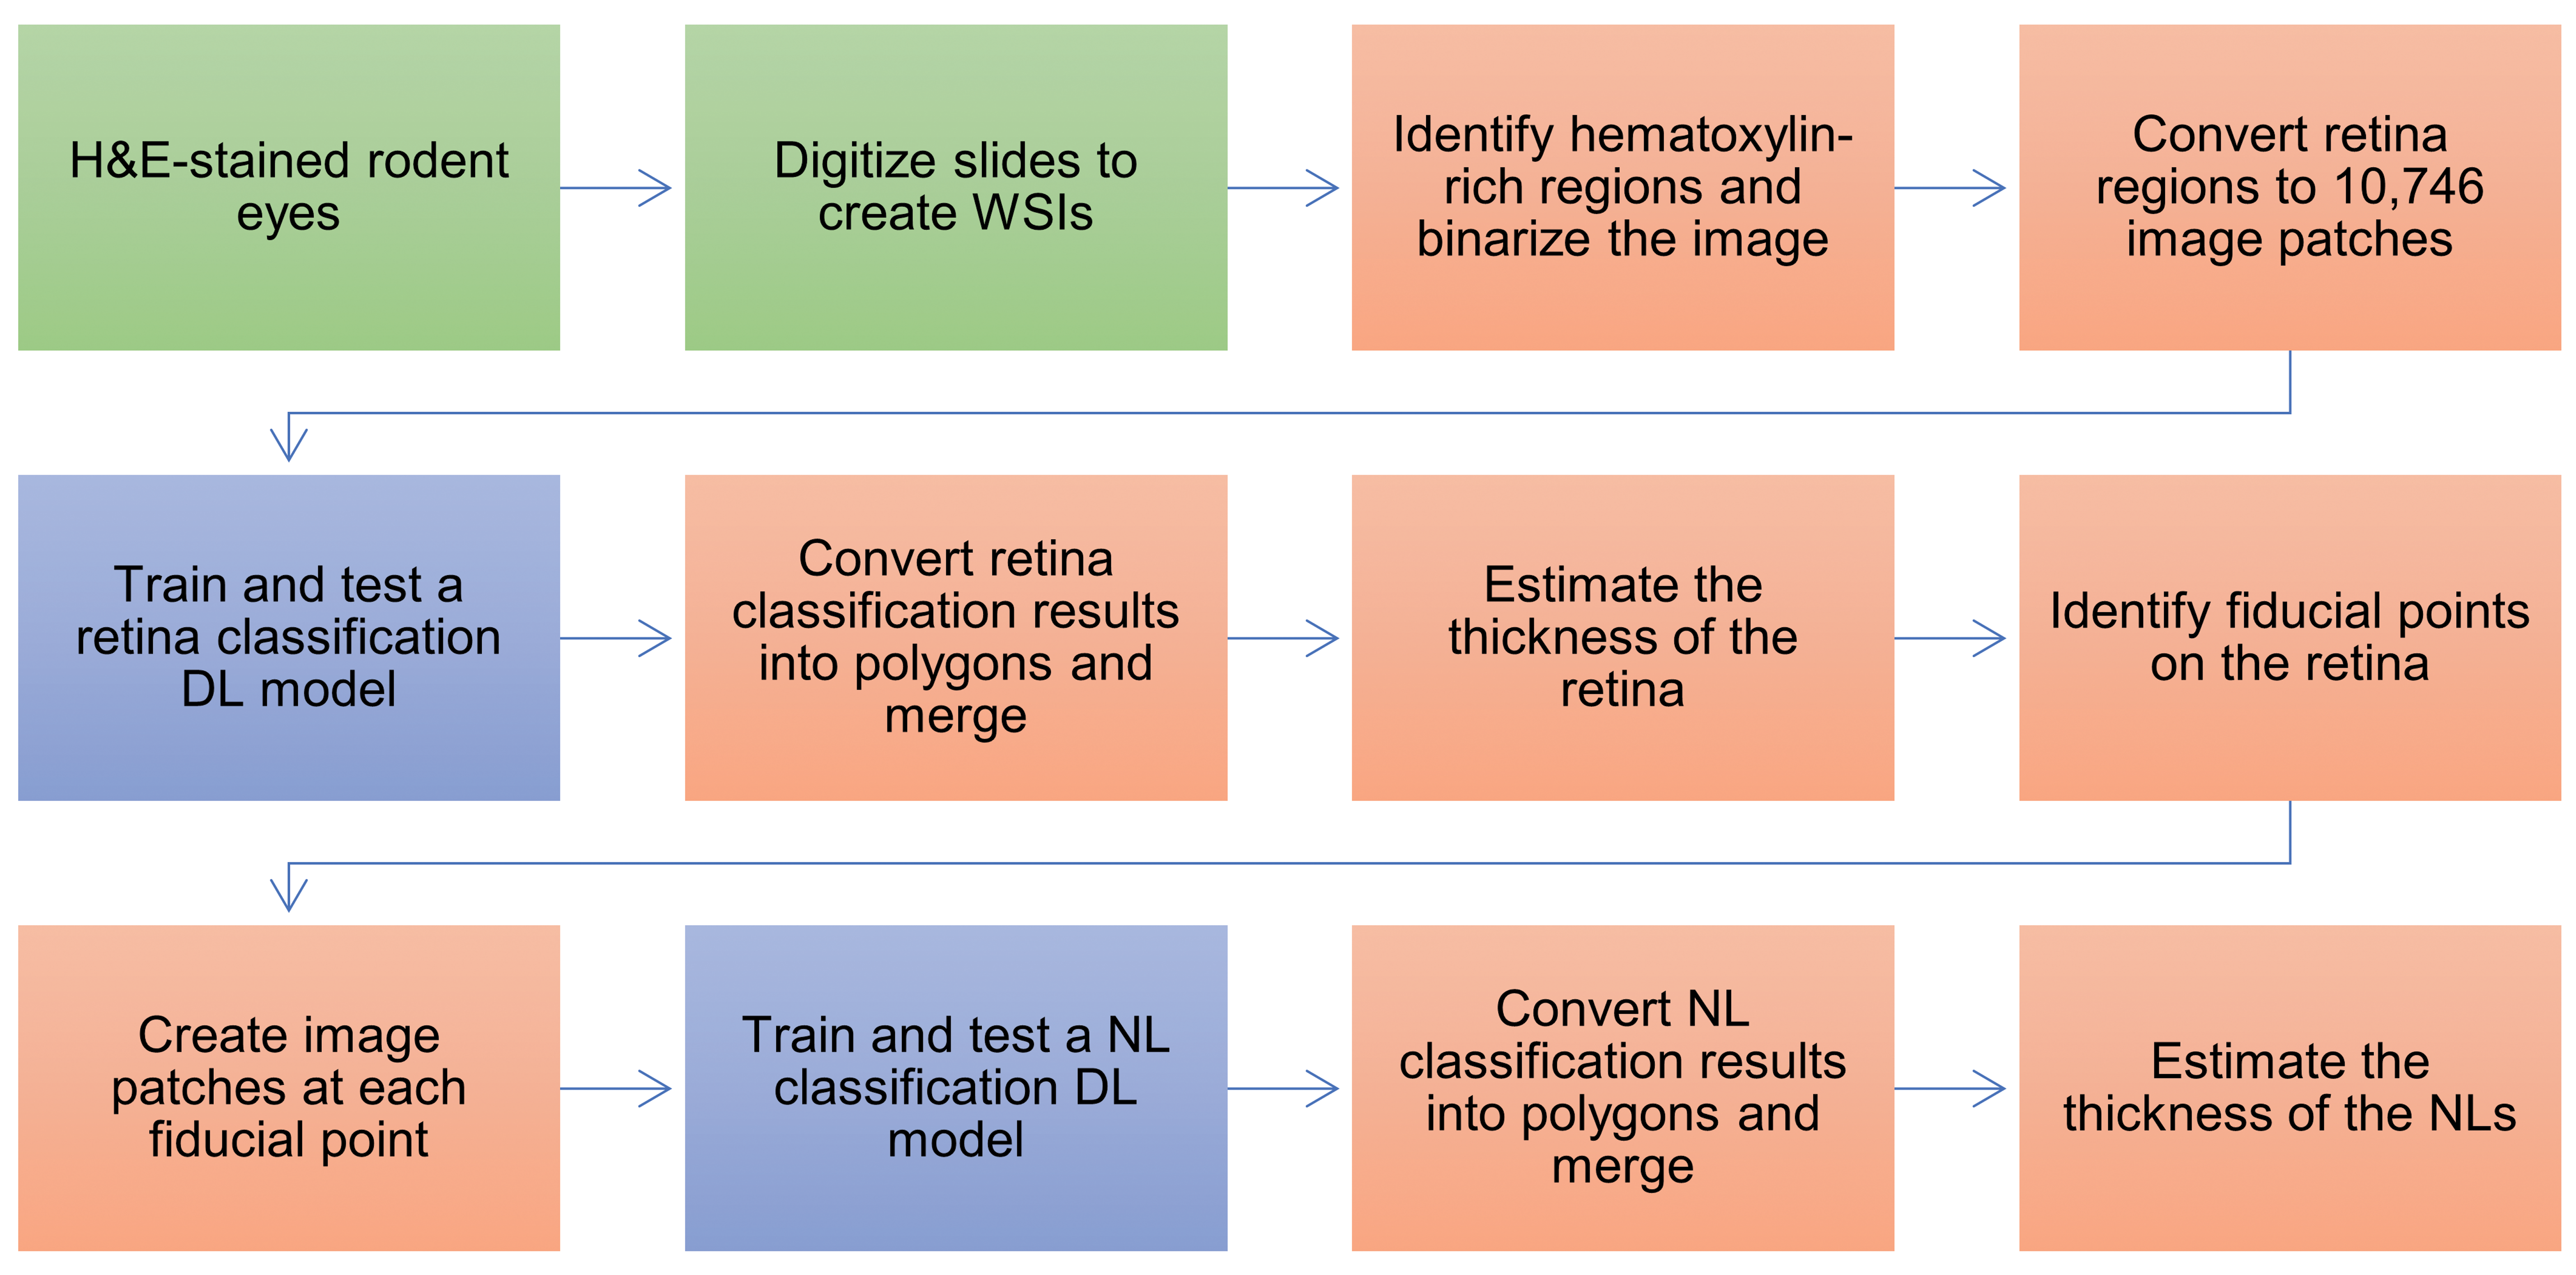
Flowchart of the hybrid approach combining conventional image processing and DL used to quantify rodent retinal atrophy. This approach includes the collection of H&E-stained eyes from 2 toxicity studies in Wistar rats that are digitized to create WSIs. Following the manual annotation of retinal regions in the WSIs, 2 DL models (based upon VGG16) were trained, tested, and validated to classify areas as retina/not retina or NLs. Distance images were used to estimate changes in the thickness of the retina and the NL. (Manual steps are shown in green; conventional image processing steps are shown in orange; DL steps are shown in blue.). DL indicates deep learning; H&E, hematoxylin and eosin; NL, nuclear layer; WSI, whole slide image.
Histology
The eyes used in this research were obtained from 2 toxicity studies, in which rats were administered a test item or vehicle; neither test item nor vehicle contributed to the ophthalmological or histopathological findings in the eyes. In both studies, the eyes were examined by light microscopy and findings were graded semiquantitatively (0 = no finding; 1 = minimal; 2 = slight; 3 = moderate; 4 = severe; 5 = marked) for severity.
The first study was a 14-day dose range finding toxicity study performed at the Test Facility Pharma Research Basel (currently named pRED), which is accredited by the Association for Assessment and Accreditation of Laboratory Animal Care International. This study was conducted in accordance with the study plan and standard operating procedures governing the specific study activities, employed good scientific practices under high quality standards, and qualified methods. This study was based on guidelines proposed by the International Conference on Harmonisation of Technical Requirements for Registration of Pharmaceuticals for Human Use, the Committee for Medicinal Products for Human Use of the European Agency for the Evaluation of Medicinal Products, and the Organization for Economic Cooperation and Development (OECD). In this study, 20 male and 20 female Wistar rats (Han IGS Crl: WI[Han], Charles River Laboratories) were orally administered (once daily by gavage) 4 dose levels of a test item or its vehicle. The rats involved in this study were confirmed to not have retinal atrophy using ophthalmological or histopathological evaluation. As a result, histological sections of eyes sourced from this study are referred to as the control group.
The second study was performed in 2003 and retrieved from the archive. This study was a 28-day chronic toxicity study performed at F. Hoffmann-La Roche Ltd according to the Swiss Ordinance on Good Laboratory Practice (2002) and the revised OECD Principles of GLP (1997) and the OECD Consensus Document 13 on the Application of the OECD Principles of GLP to the Organization and Management of Multi-Site Studies (2002). In this study, 56 male and 56 female Wistar rats (HanBrl: WIST [SP], RCC Ltd) were orally administered (twice daily by gavage) 3 dose levels of a test item or its vehicle, followed by a 28-day treatment-free recovery period. Retinal atrophy was observed in the rats histopathologically, following confirmed prolonged exposure to light and not due to the test item and/or the vehicle. Retinal atrophy in the second study was characterized by bilateral and diffuse alterations of moderate severity in the outer retina. These included significant reductions in thickness (and cellularity) or loss of the outer nuclear, outer plexiform, and photoreceptor cell layers; these changes were more marked in the superior and inferior retina surrounding the optic nerve. 41,42 As a result, histological sections of the eyes of the vehicle-treated male and female rats sourced from this study are referred to as the diseased group.
The eyes from both studies were fixed in Davidson’s solution for 1 to 3 days, routinely processed, and embedded in paraffin. Sections were cut at a nominal thickness of 3 µm and stained with hematoxylin-eosin (H&E). The whole slide images (WSIs) were scanned using the Ventana iScan HT at ×40 magnification. The images were uploaded to a file share drive and visualized using an internal Roche software platform which is employed for research use only. A pathologist-trained technician manually made ground truth annotations on 7 random rats of the control group. The annotations included the entire retina as well as each nuclear layer (NL) separately. The preprocessing steps in the algorithm of healthy eyes is shown in Supplementary Figure 1.
Deep Learning Approach
Two DL models were developed and used sequentially during this research, a 2-class retina segmentation DL model (Supplementary Figure 2), followed by a 3-class NL segmentation DL model (Figure 2). Each DL model classifies pixels in the image patches, using a 2-class or 3-class approach depending on the DL model. The retina classification DL model was used to identify the retina after the binarization of the hematoxylin (HTX) signal for the WSI. The NL classification DL model was used to identify the INL and ONL within the retina, at the measurement rectangles determined by the algorithm. The thickness of the INL and ONL was subsequently measured, and the results were used to determine the presence of retinal atrophy. The thickness of ONL and INL was assessed rather than total retinal thickness as they are a more sensitive measure of retinal atrophy.
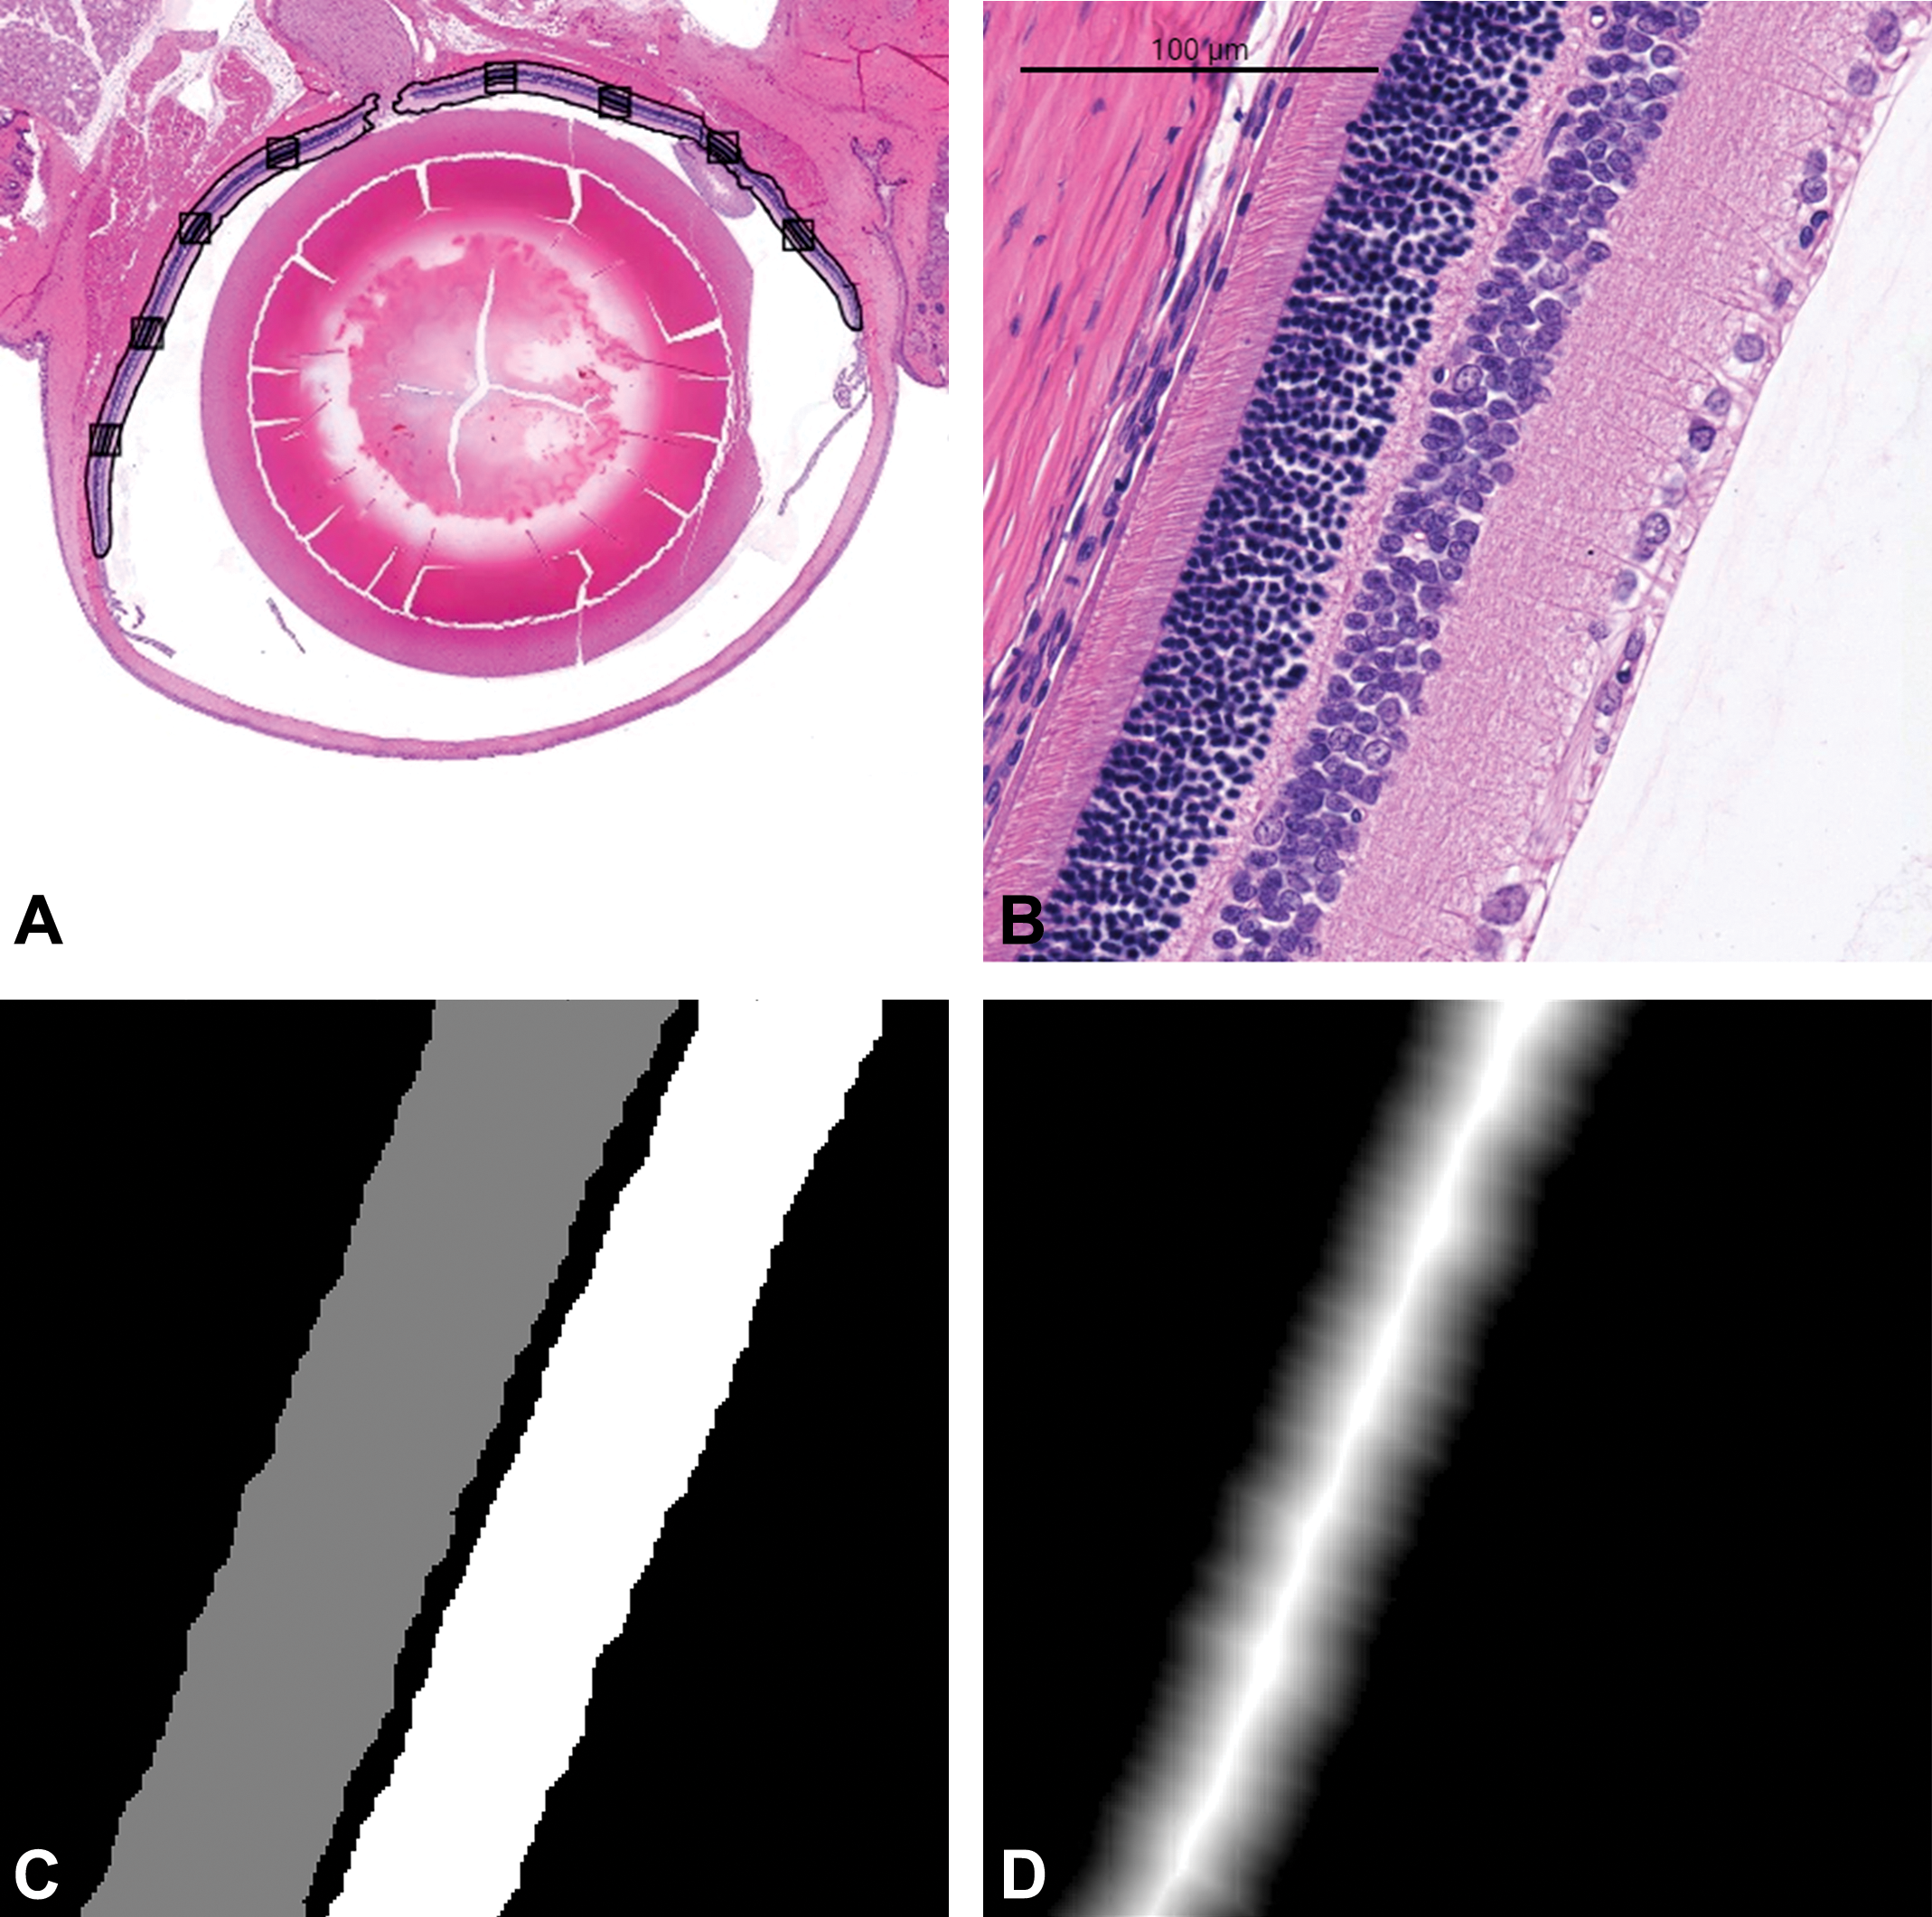
Assignment of NL regions using a 3-class DL model. A, Eight measurement rectangles are found to be used as fiducial points along the retina. B, At each measurement rectangle, an 800 × 800 image patch is extracted. C, Image patch pixels are classified into ONL (grey), INL (white), or not NL (black). D, The resulting ONL part of (C) is used to create a distance image in order to estimate the thickness of each of NL. A similar process is carried out for the INL mask. DL indicates deep learning; INL, inner nuclear layer; NL, nuclear layer; ONL, outer nuclear layer.
In order to accelerate the processing time, an image processing method, using the bluish tint of the NLs, was utilized to identify likely retinal regions. Adjoining image patches were extracted from the WSI across these regions, and the 2-class DL model for retina (vs nonretina) applied to each. Each image patch was segmented into “retina” and “nonretina” regions. The retina region in each mask was converted to create 1 polygon for that mask. For the 3-class INL/ONL model, each mask yielded up to 2 polygons, 1 for INL and 1 for ONL. The image patch polygons were then merged where the extracted image patches adjoined each other, using conventional geometrical methods. This yielded typically 1 or 2 polygons circumscribing the retina for each eye, depending on whether the retina was in 1 or 2 segments within an eye. These polygons were visualized in an internal Roche software platform, which allows for editing of WSI annotations. The retina polygon annotations were manually inspected, occasionally edited, and utilized in the next steps of the method.
In 1 step, the thickness of the retina of each eye was measured at intervals along its length, using the retina polygons for that eye. In a subsequent step, 8 measurement points were determined geometrically and an image patch for each, extracted and centered on the measurement point. The 3-class ONL/INL model was applied to each patch, and the thickness of the ONL and INL was measured. These steps are described in more detail in the Results section.
The 2 DL models were trained, validated, and tested using images patched from WSIs, which were manually annotated, as previously mentioned. In total, 10,746 fully labelled image patches (800 × 800 pixels each) were created from 14 WSIs of the control group; each patch corresponded to approximately 188 ×188 µm of the retina. Of these, 9761 image patches were utilized for DL model training, of which 1451 were used as the validation data set for tracking accuracy during training; the remaining 1075 image patches were set aside for DL model testing (Table 1). Six of the WSIs came from both eyes of 6 animals; the other 8 WSIs came from 8 serial sections of both eyes of an additional animal. The image patches overlapped by approximately 90% in both vertical and horizontal directions. These were then resized to 256 × 256 pixels each, in order to reduce memory requirements during training.
Description of Training, Test, and Validation Data Sets for Both DL Models.
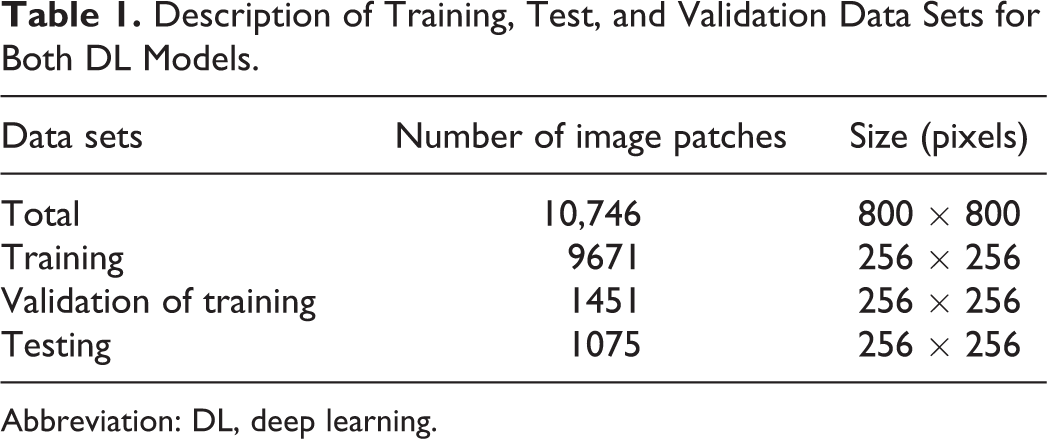
Abbreviation: DL, deep learning.
A fully convolutional network was used to train the models, based on the Deep Learning Toolbox Model for VGG-16 Network from MATLAB; this was modified to allow classification of pixels resulting in image segmentation models. A detailed description of the original algorithm along with the mathematical derivation has been reported previously by Simonyan and Zisserman. 43
For additional studies into the retina thickness or NL thickness, the mask-derived polygons were used to create distance images using MATLAB’s bwdist function, which computes the Euclidean distance transform of a binary image. In the distance images, the brightness at each pixel in the distance image was calculated using the distance (in pixels) to the nearest background (black) pixel in the mask. As the masked polygons are typically a parallelepiped shape, the distance image has a ridge of brightness along its length, following the centerline. In the retina DL model, the intensity of the distance image along the ridge was equivalent to approximately half the retinal thickness (scaled to μm). The equivalence of intensity to retinal thickness was determined by manual inspection, where the distance from the pixels on the centerline of the image patch mask to the nearest background pixel is half of the mask width at that point. In the NL DL model, the intensity along the ridge in the distance image yields an estimate of the NL thickness.
Optimization of Model Accuracy
To optimize DL models during training and calculate the total DL model’s accuracy, the accuracy of a given image patch was defined to be the number of correctly classified pixels divided by the total number of pixels in each image patch. During training, the accuracy was evaluated against manually annotated image patches, referred to as the validation set. The validation set equates to 15% of the training image patches and was used repeatedly during training to track accuracy. Using the training accuracy as a guide, the parameters for each DL model were adjusted automatically in several successive training runs, in order to increase the accuracy. Using customary methods for testing a DL model, the final accuracy of the DL model was measured and logged using the test image patches.
Software and Hardware
Development was performed on a Windows 10 laptop (64-bit OS, x-64 based processor Xeon(R) E-2176M and a 16GB RAM). All DL model training and high-speed inference was performed on 2 Exxact GPU workstations (x86_64, Intel Architecture, 12 CPUs, Intel(R) Core(TM) i7-5930K CPU @ 3.50GHz, 4 GPUs [GeForce GTX 1080 Ti, 8GB RAM each]).
The software tools employed in this research were run in MATLAB R2018b Update 4 (Version: 9.5.0.1067069), with the following packages: Computer Vision System Toolbox (Version 8.2), Deep Learning Toolbox (Version 12.0), Image Processing Toolbox (Version 10.3), Parallel Computing Toolbox (Version 6.13), Statistics and Machine Learning Toolbox (Version 11.4), and Deep Learning Toolbox Model for VGG-16 Network. 43 Image augmentation was performed with MATLAB’s “imageDataAugmenter” function, with the following parameters: “RandXReflection,” true, “RandYReflection,” true, “RandXScale,” [0.9 1.1], “RandYScale,” [0.9 1.1], “RandXShear,” [-10 10], “RandYShear,” [-10 10], “RandXTranslation,” [-10 10] and “RandYTranslation,” [-10 10]. The model architecture used the following training hyperparameters: “sgdm,” “Momentum” (0.9), “InitialLearnRate” (2e-4), “L2Regularization” (5e-4), “MaxEpochs” (MaxEpochs), “MiniBatchSize” (32), “Shuffle” (every-epoch), “ExecutionEnvironment” (multi-gpu).
Execution Time Analysis
In all DL models, the execution time for the inference and image processing was approximately 20 minutes per image; the inference time for each patch was less than 2 seconds. The execution time for each DL model training was typically 8 to 12 hours depending on the number of epochs used.
Results
Implementation of a DL-Based Approach to Detect and Measure the Retina
The first DL model used a 2-class-based analysis that classified tissue from the control rats as retina/not retina. The DL approach was based upon a large-scale image recognition algorithm VGG16 model architecture, 43 resulting in an estimation of the retinal region in the WSI (Supplementary Figure 2). The ground truth used to train the DL model did not include diseased eyes and was, therefore, unable to assess varying grades of retinal atrophy. As such, the algorithm frequently failed to identify the layers in diseased eyes, occasionally missing the ONL altogether (Figure 3B). In addition, severity grading using the algorithm was beyond the scope of this current proof-of-concept study. Nevertheless, the algorithm measurements clearly reflect gross changes in the ONL and where it correctly identifies the ONL, it roughly follows the trend visible in the diseased eye. The prediction accuracy of the retina classification DL model was 95.3% compared to the pathologist annotations (Figure 4A).
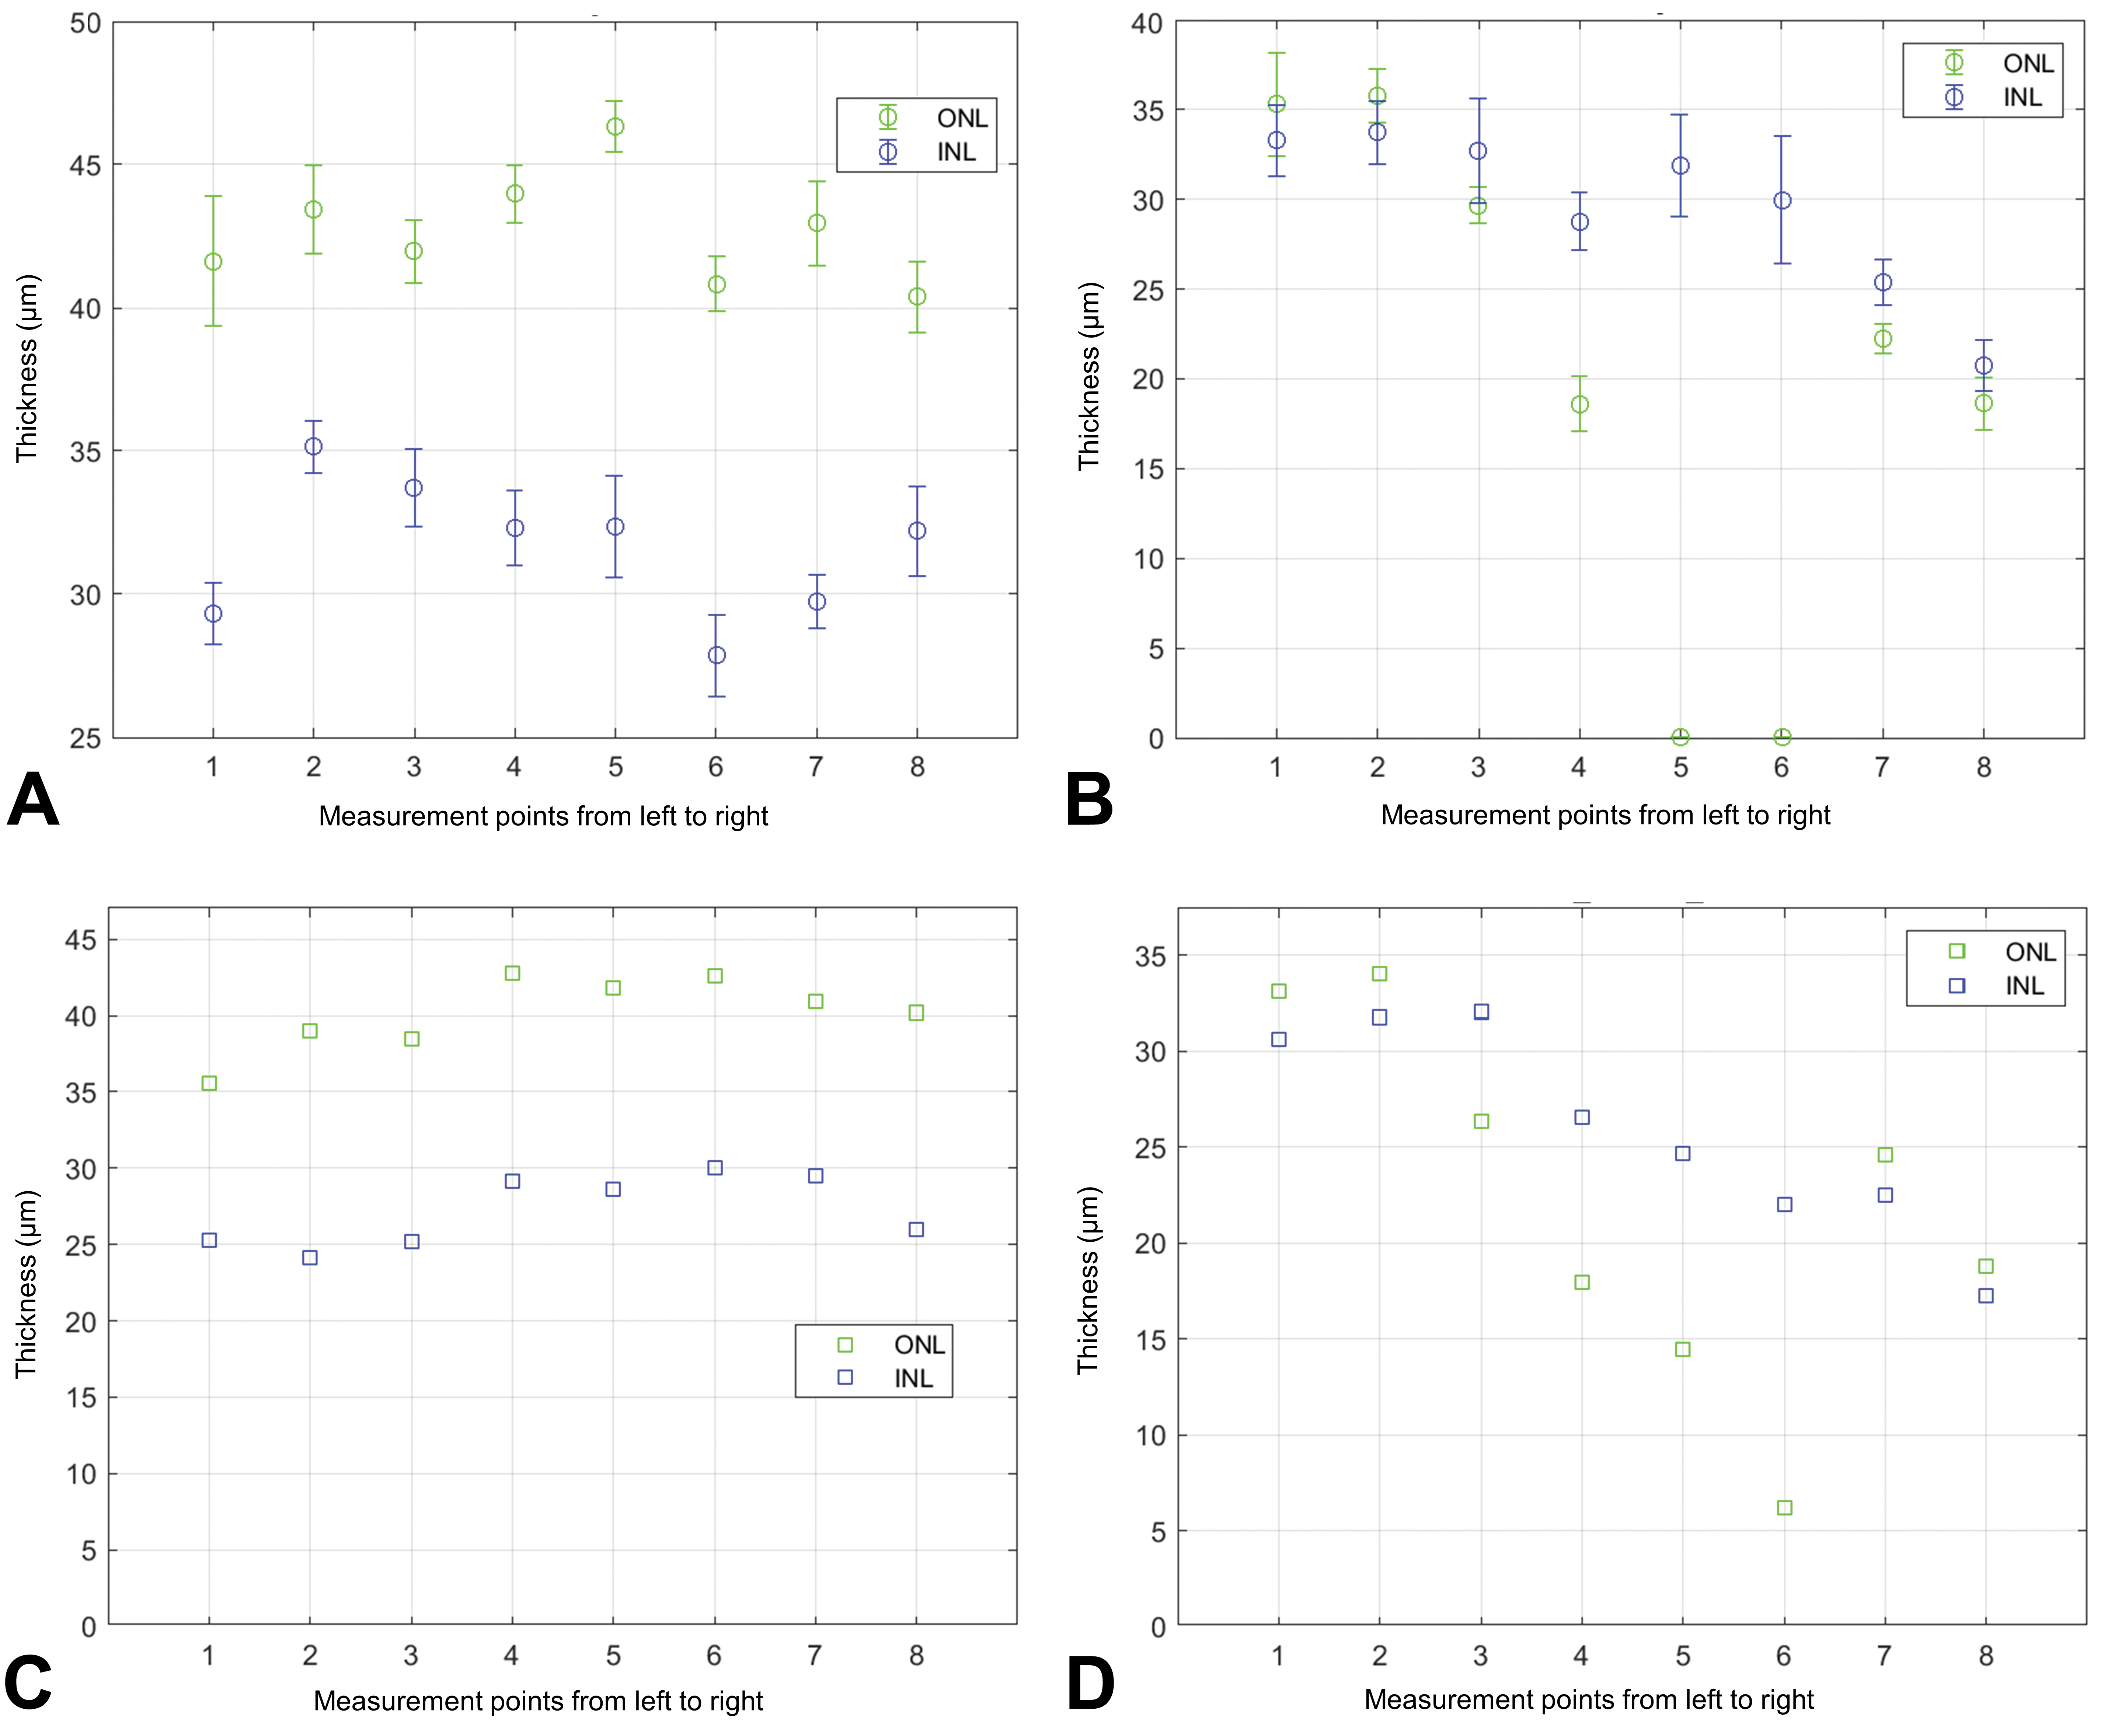
Comparison of algorithm predicted and manual measurements of the ONL and INL in the left eye of a control and diseased animal. Algorithm predicted (A = control; B = light-induced retinal atrophy) and manual measurements (C = control; D = light-induced retinal atrophy) of the ONL and INL. INL indicates inner nuclear layer; ONL, outer nuclear layer.
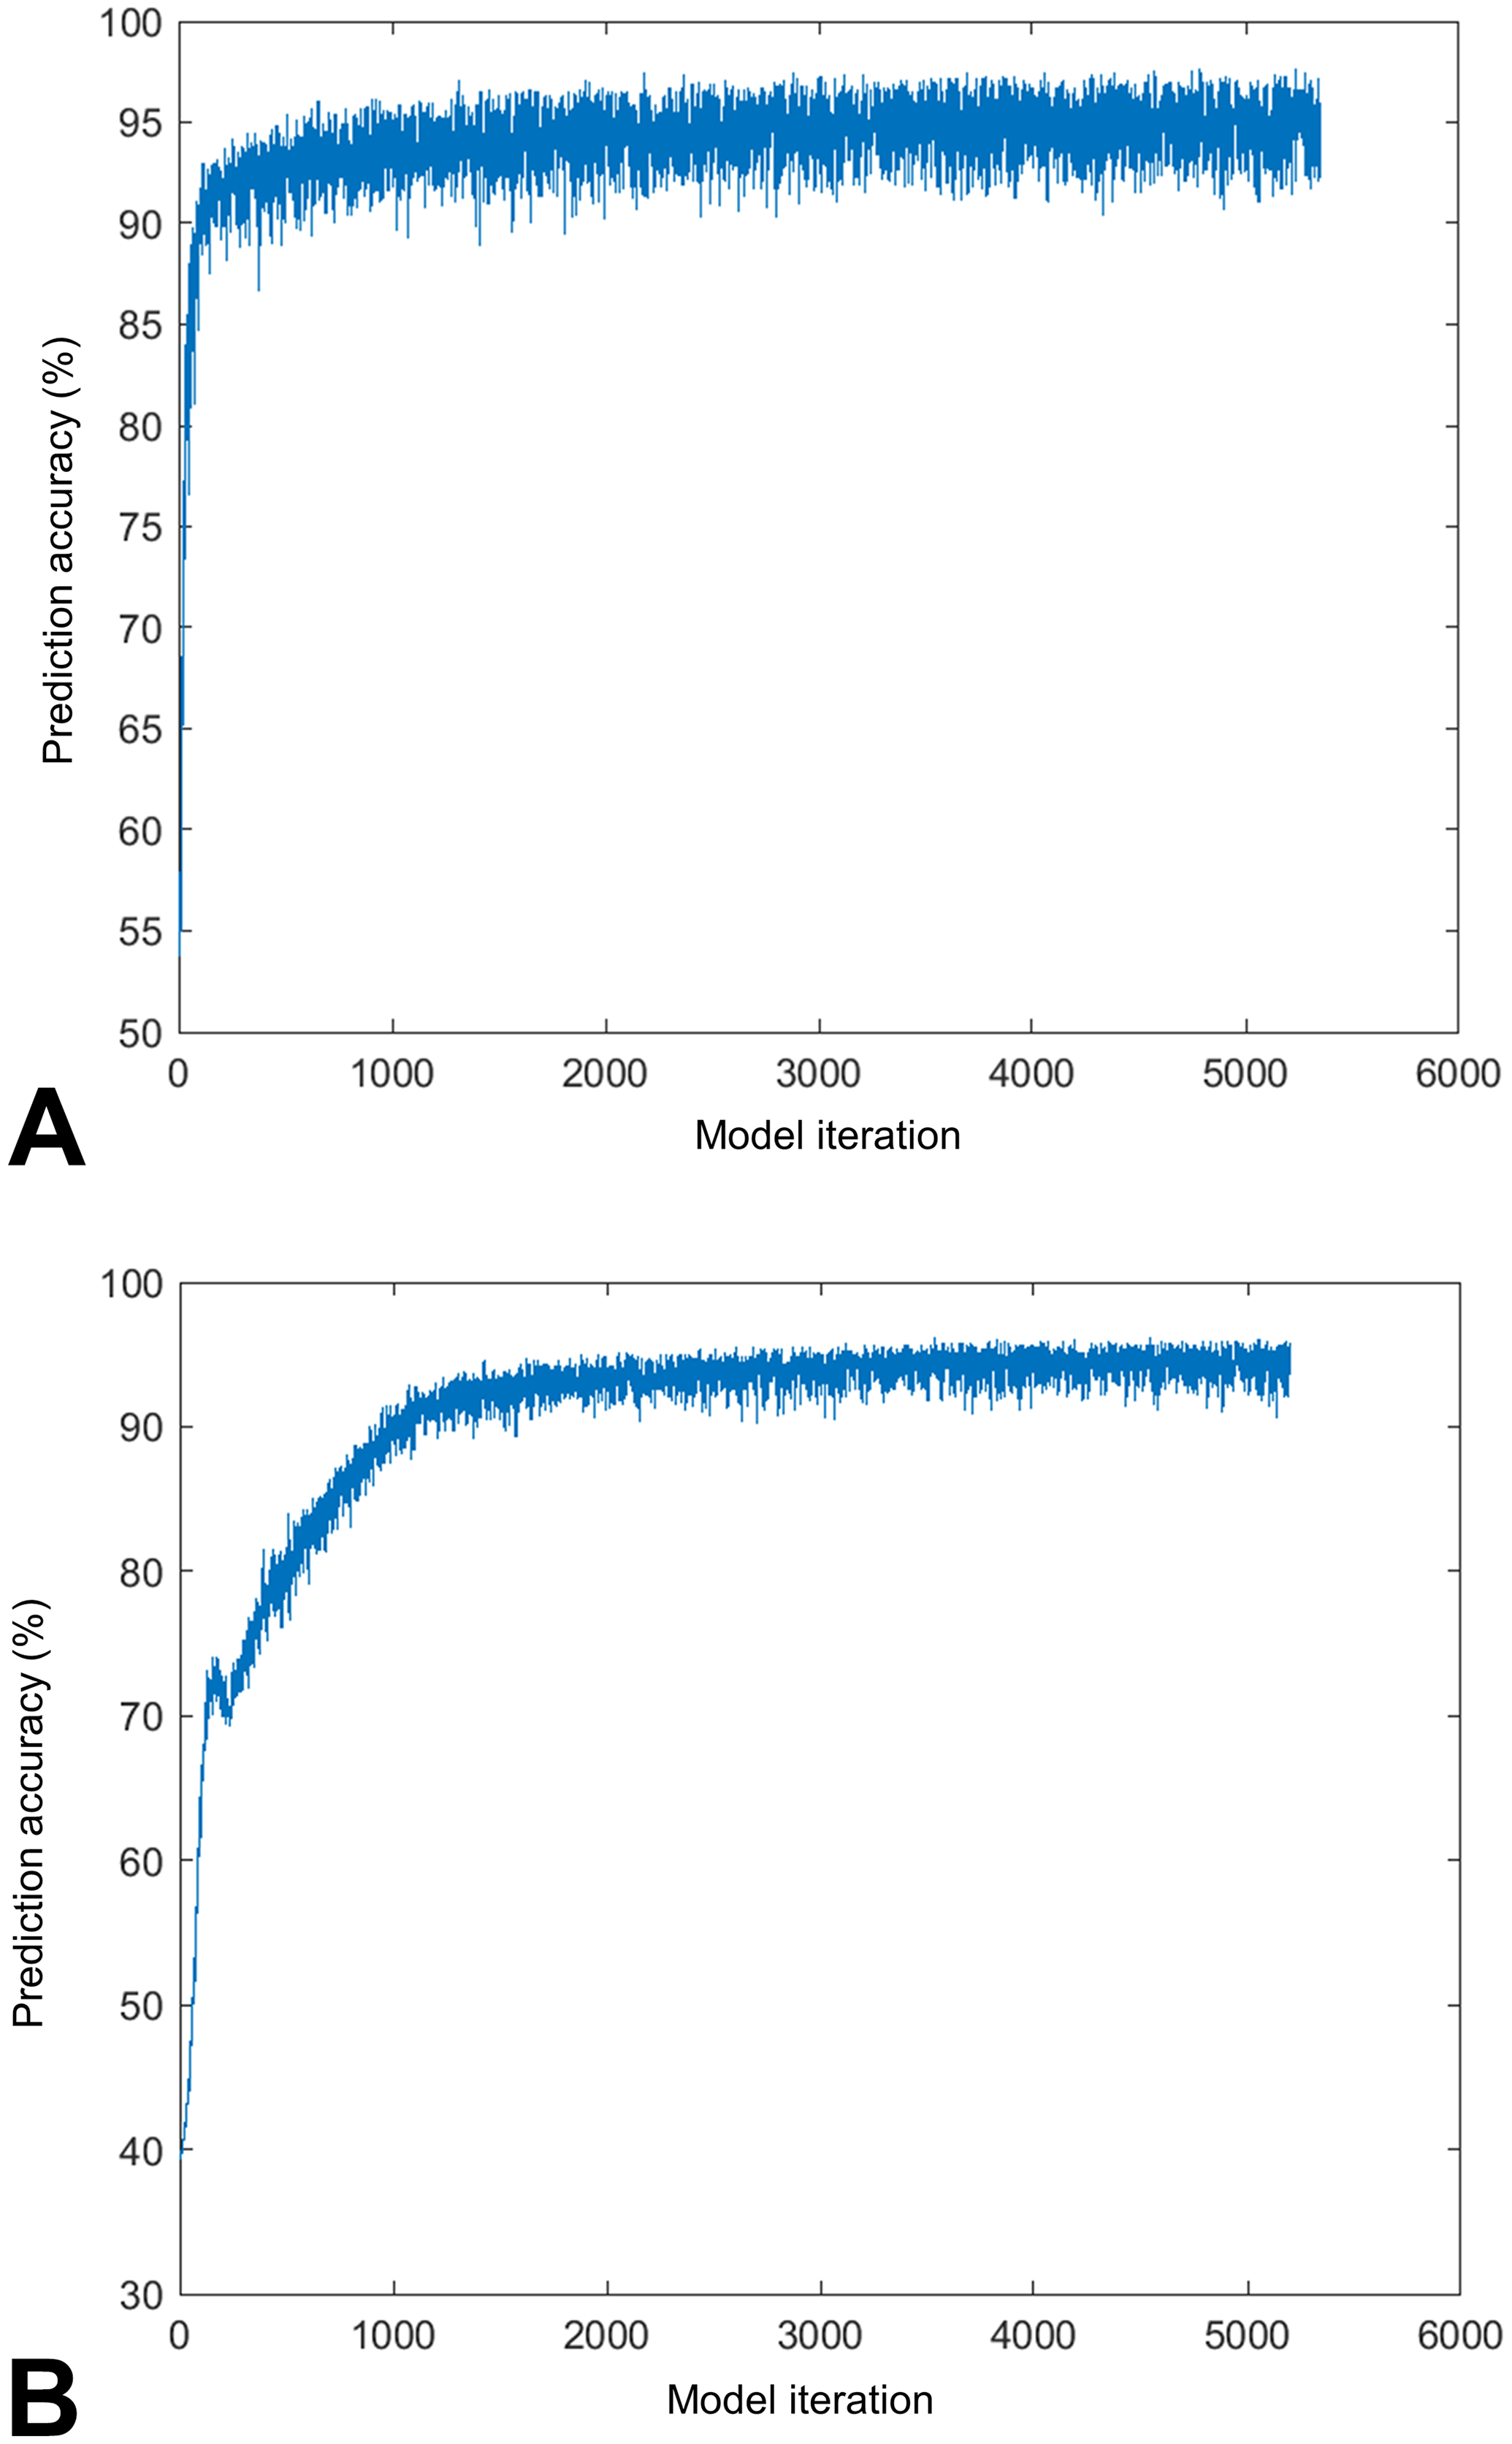
Logged accuracy of the DL models during training. Accuracy was evaluated against manually annotated image patches, referred to as the validation set. A, Retina classification DL model. B, NL classification DL model. DL indicates deep learning; NL, nuclear layer.
Implementation of a DL-Based Approach to Detect and Measure NLs in the Retina
To identify the NLs in the control image patches, a second DL model was developed using a 3-class (INL, ONL, and “not NL” regions) system (Figure 2). The DL model was then tested with image patches which were manually annotated by a pathologist. Polygons were transformed into masks, and the distance image was created using MATLAB’s bwdist function, in order to estimate the thickness of the retina along its length. The overall prediction accuracy of the NL classification DL model was 94.4% compared to the pathologist annotations (Figure 4B).
Following the masking of the INL and the ONL in the image patches, distance images were created in order to determine the thickness of the NLs. It should be noted that the NL measurements were extracted for image patches that only had both INL and ONL regions present. Using a distance image, the thickness of the NL (including the ONL, outer plexiform layer, and INL) was measured at fiducial points on the left and right eyes of 4 rats (Figure 5).
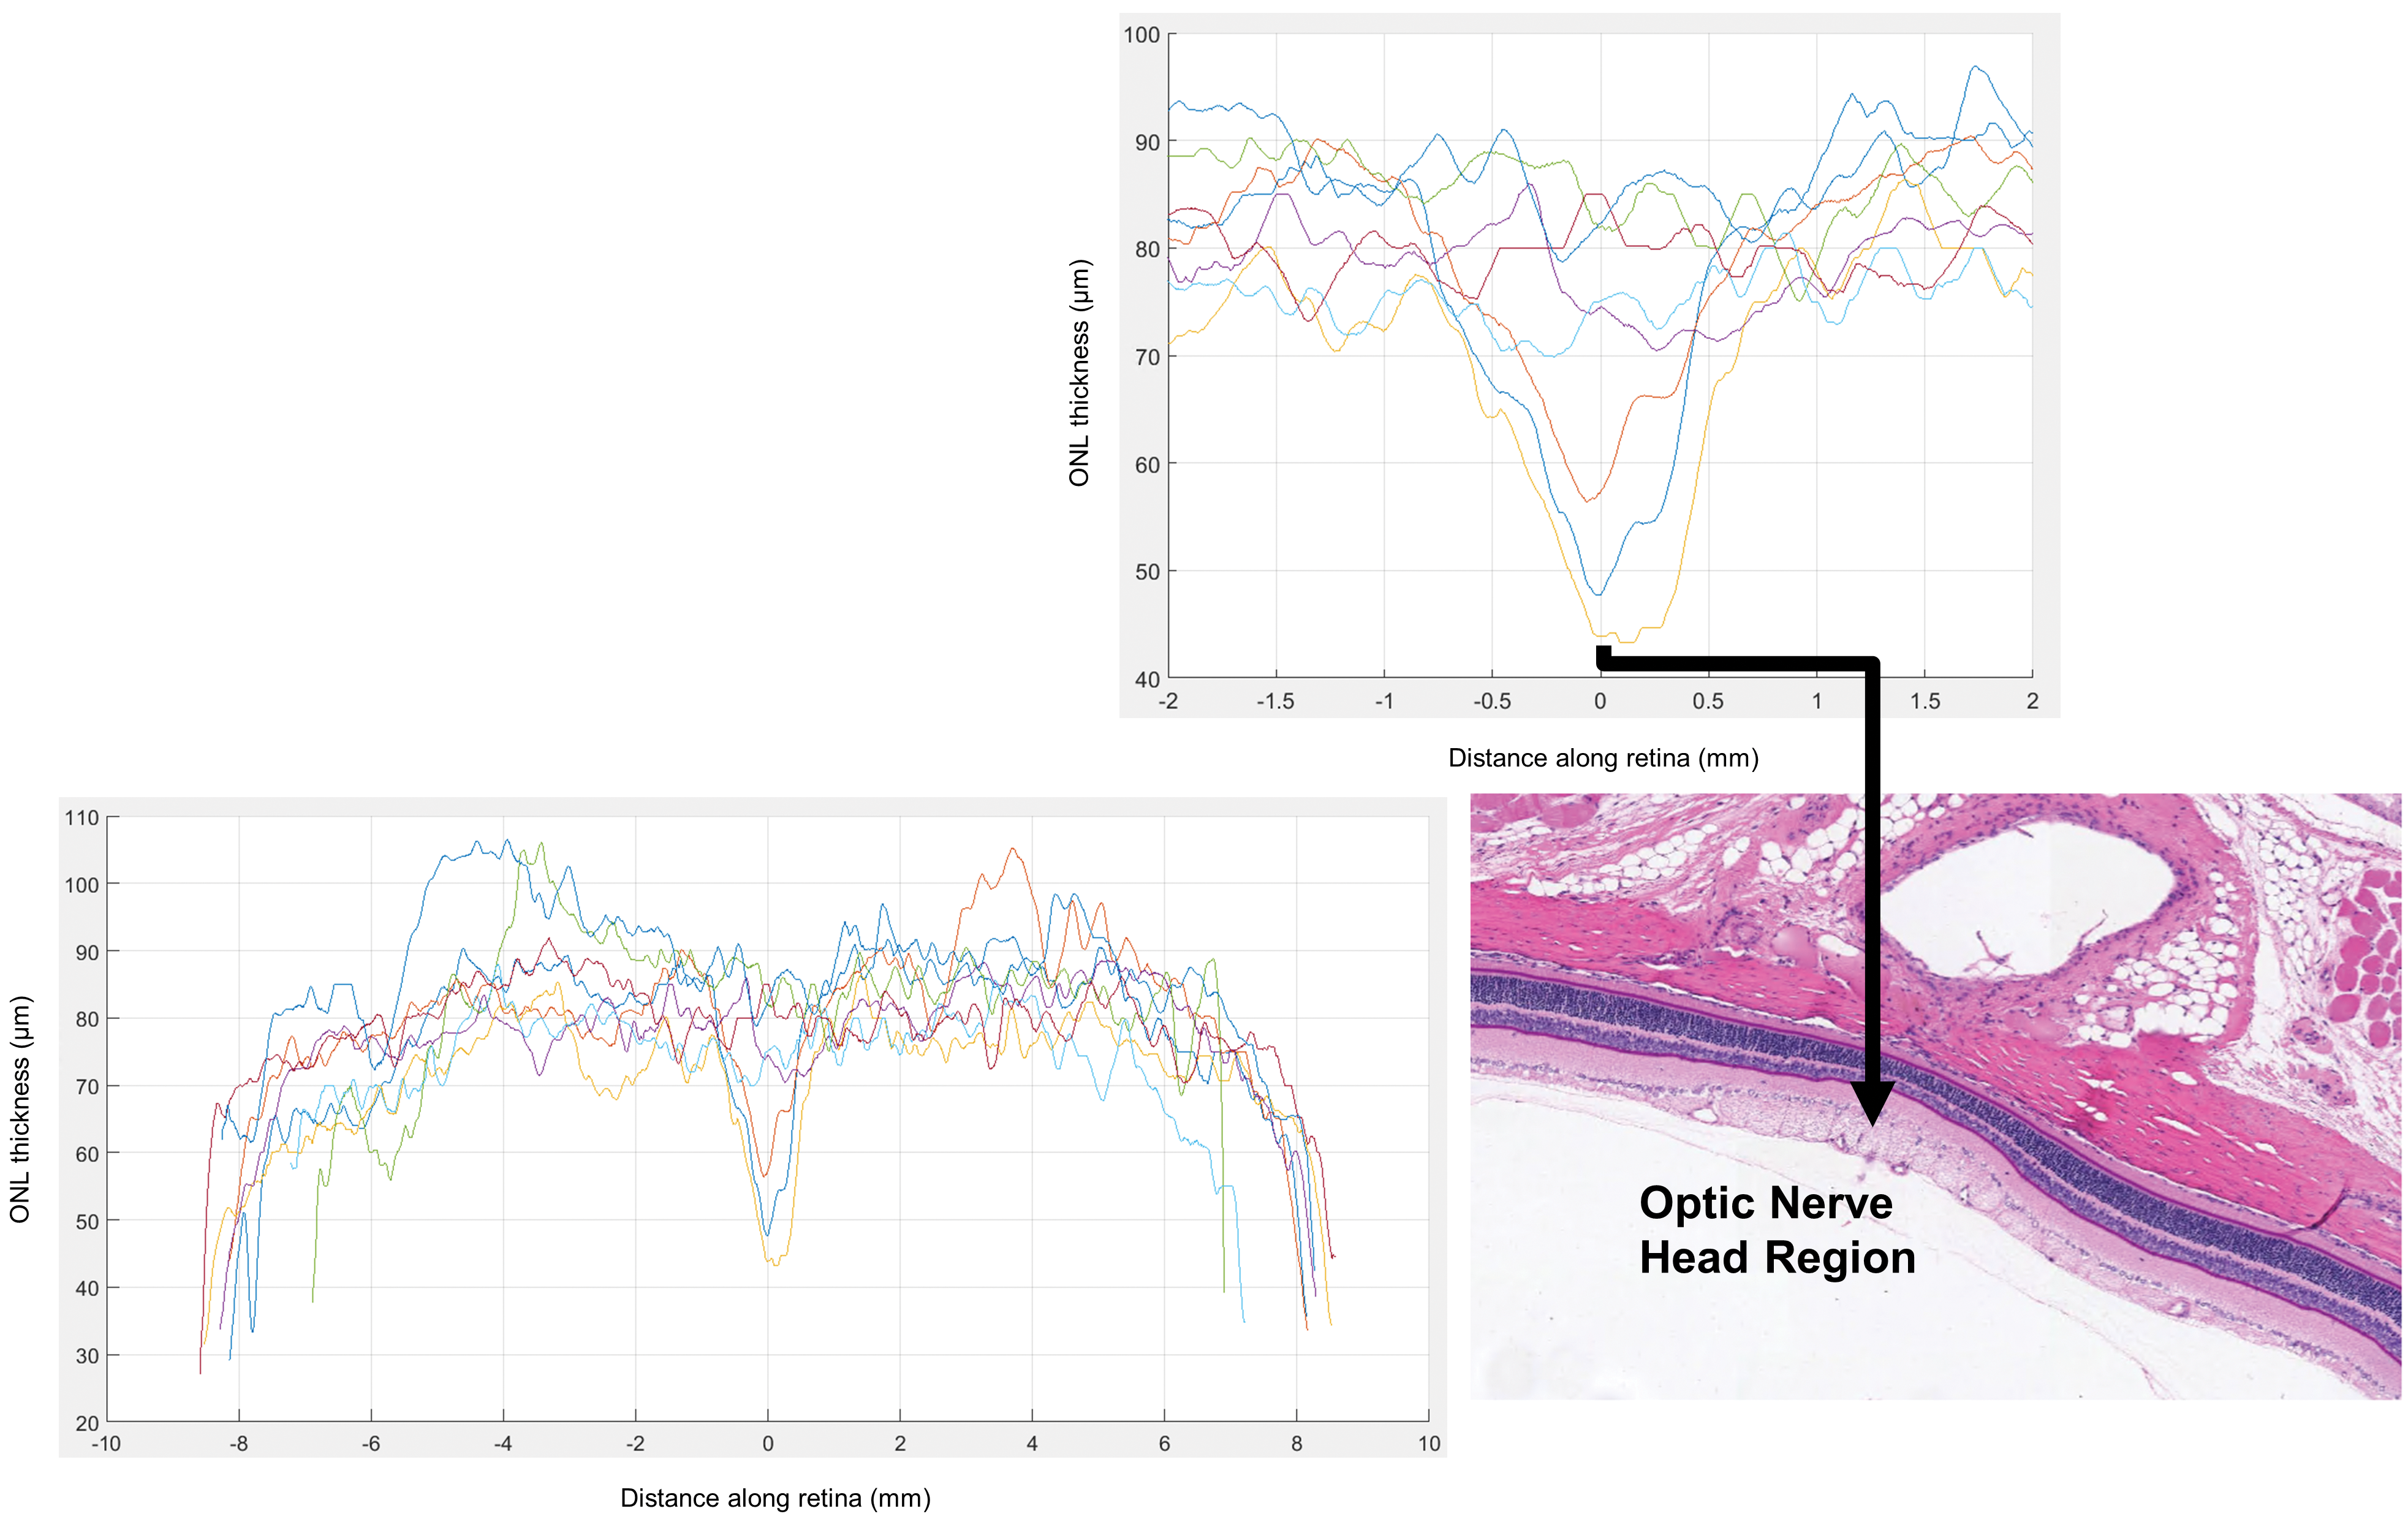
Application of distance imaging to estimate the NL region thickness along the length of the retina in 4 control animals. Taking “0” on the abscissa as the point on the retinal section closest to the optic nerve head region, the other abscissa values are in mm along the length of the retina. The ordinate values represent the estimated thickness of the retina in µm. NL indicates nuclear layer.
The NL DL model was implemented to assess the thickness of the NLs of control group rats sourced from the 14-day study. The thickness of the ONL and INL at each of the 8 fiducial points of 1 eye per rat was recorded. When the predicted algorithm thickness measurements were compared to manual thickness measurements (Figure 3), the predicted measurements were typically larger than the manual measurements in control and diseased eyes, and the algorithm frequently misidentified the NLs in the diseased eyes (Figure 3B).
Figure 6 shows the spidergraph of the mean thickness and standard deviation for the ONL and INL of male and female rats in the vehicle and test item-treated groups. The results show that the test item at 4 doses had no effect on ONL and INL thickness, in agreement with the histopathological assessment.
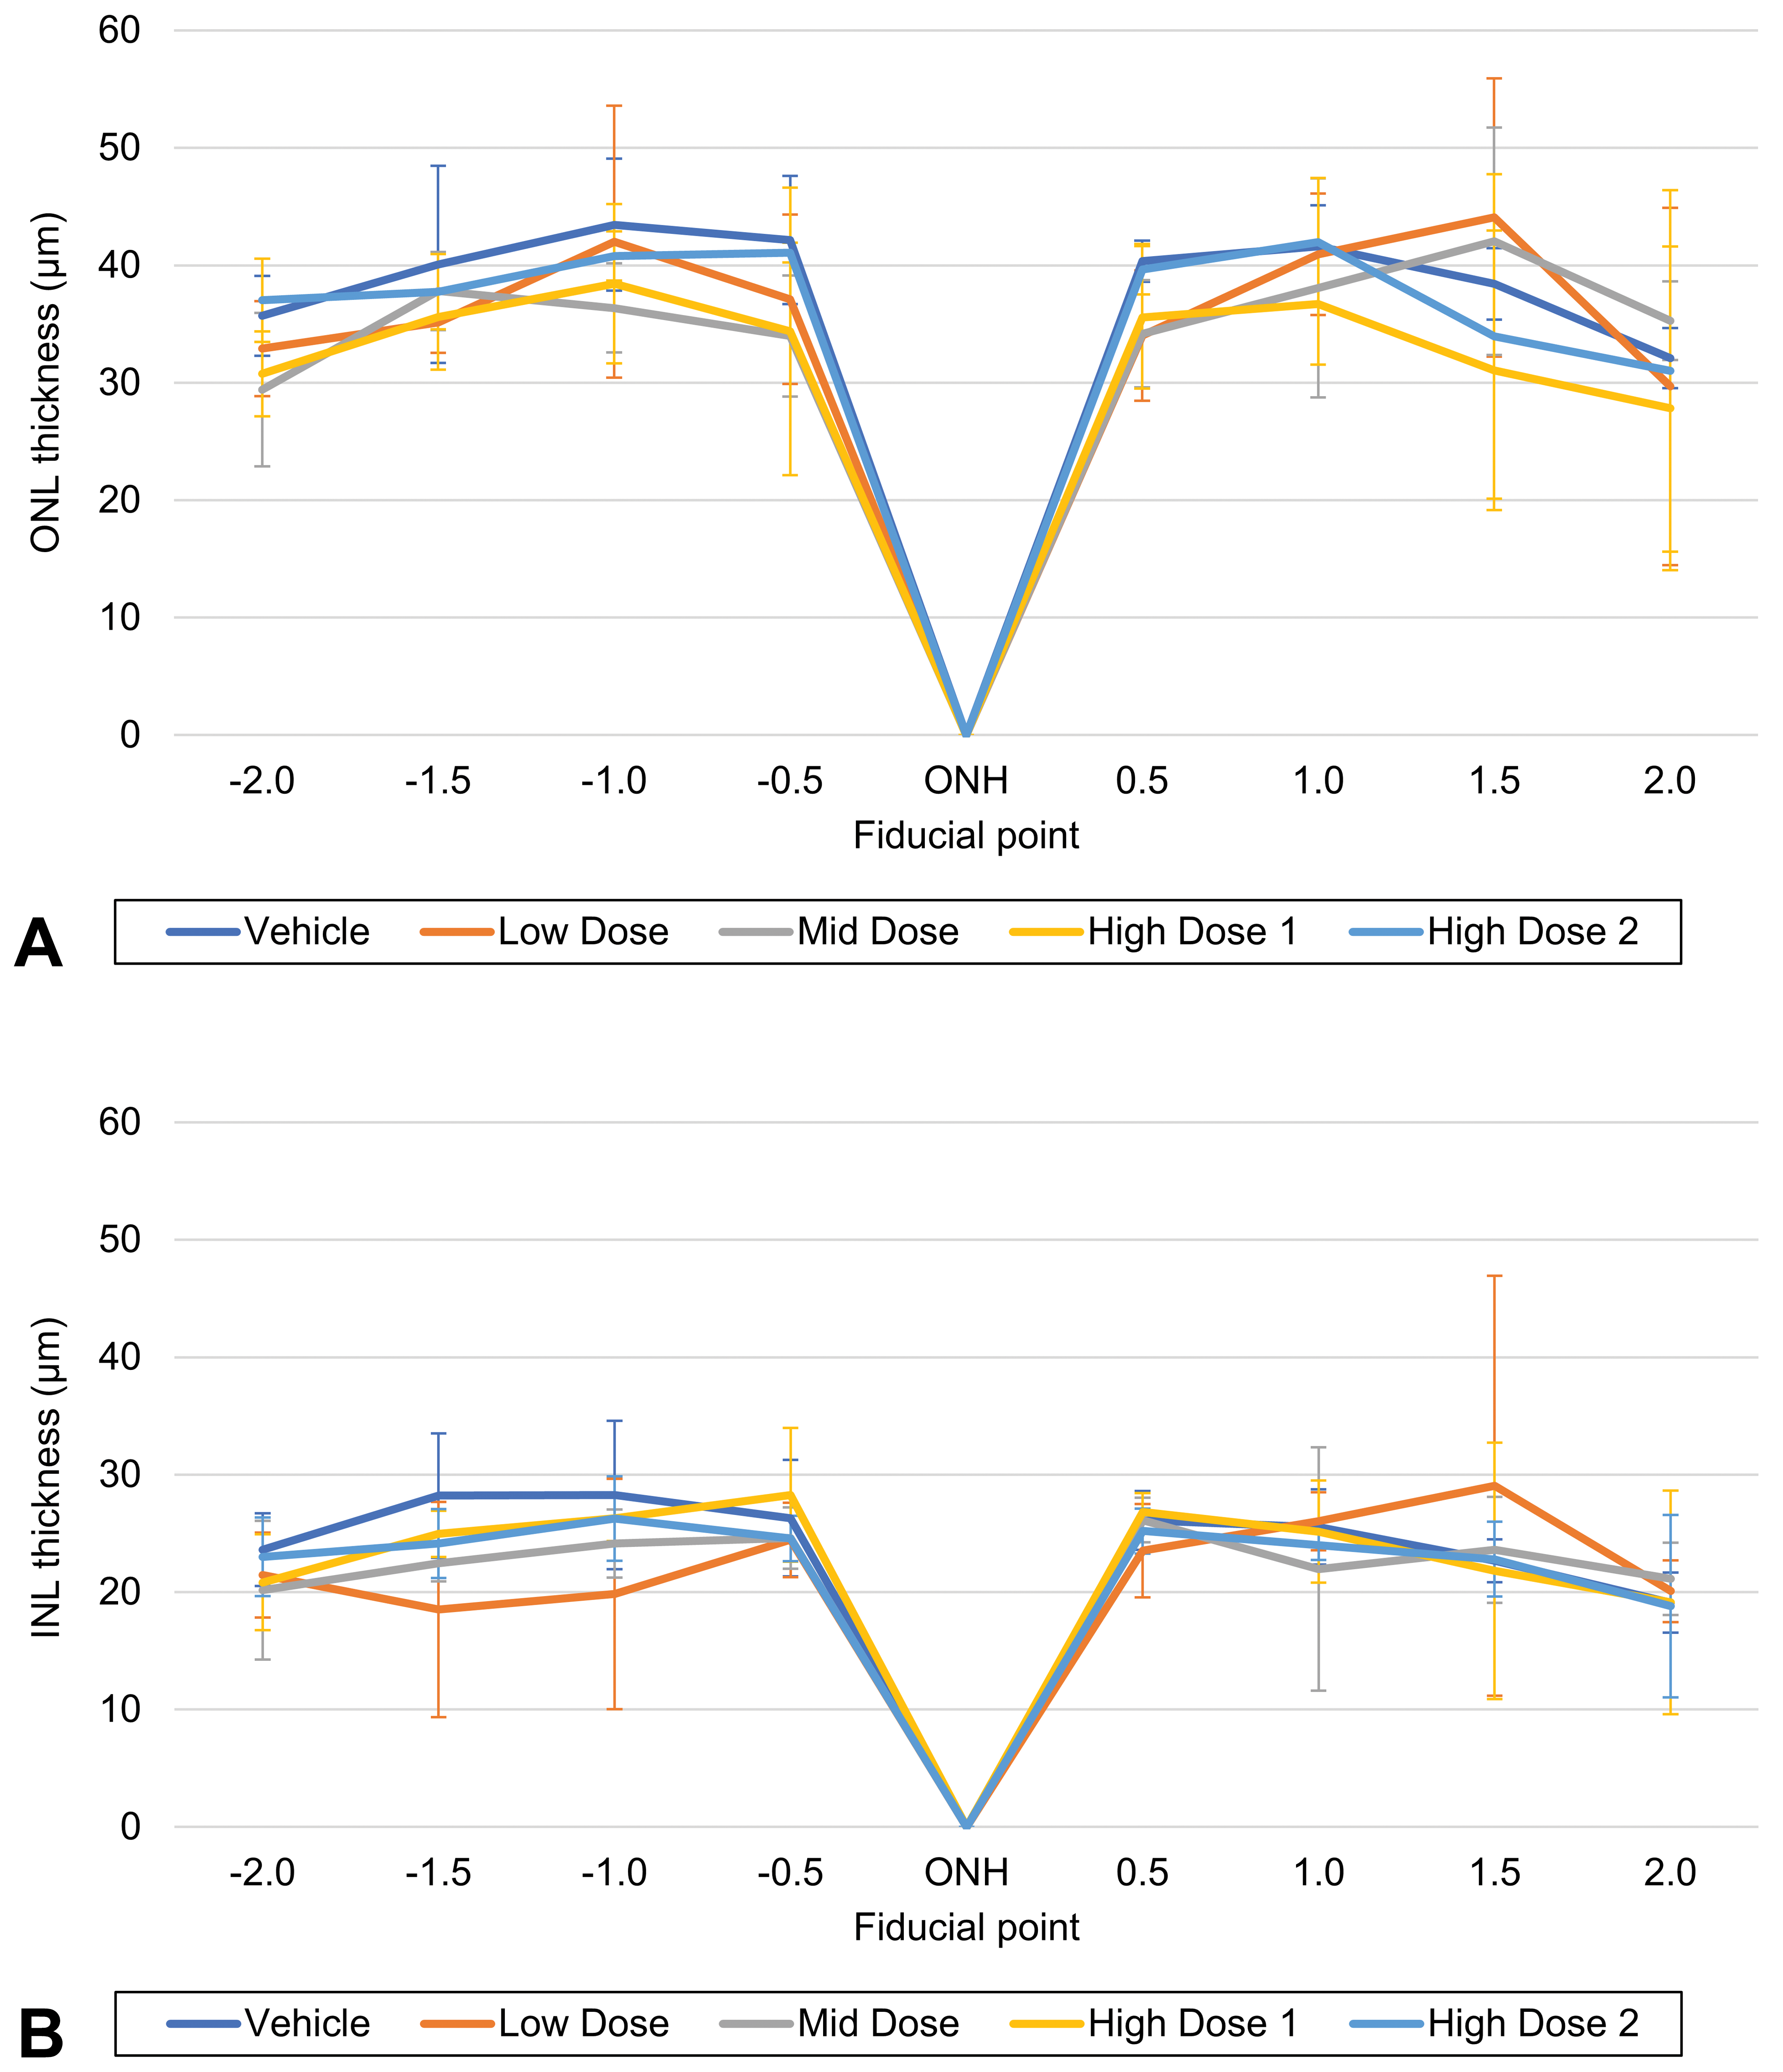
Thickness (µm) of the nuclear layers of rats in a 14-day dose range toxicity study, as reported by the algorithm. A, Outer nuclear layer. B, Inner nuclear layer. INL indicates inner nuclear layer; ONH, optic nerve head; ONL, outer nuclear layer.
Application of DL Approach to Measure Retinal Atrophy
The rats in the 28-day study (test item and vehicle treated) all showed moderate bilateral and diffuse retinal atrophy at terminal sacrifice and at recovery sacrifice, which was consistent with light-induced retinopathy following prolonged exposure to artificial light. 42 These included significant reductions in thickness (and cellularity) or loss of the outer nuclear, outer plexiform, and photoreceptor cell layers, especially in the superior and inferior retina surrounding the optic nerve.
The DL models were employed to measure thickness of the ONL eyes of a diseased rat from the 28-day study from the archive (Supplementary Figure 3). However, many of the slides of the eyes in this archival study showed significant fading of the HTX stain. Consequently, the retina classification DL model failed to detect the entire retina (Supplementary Figure 3A, 3B, and 3C), and the resulting NL region delineated by the NL classification DL model was discontinuous due to the faded or low HTX signal (Supplementary Figure 3D, 3E, and 3F).
In contrast, Supplementary Figure 4 shows the WSI of a freshly cut and stained section of a diseased rat from the same study. The reduced thickness particularly of the ONL is shown in Supplementary Figure 4A; the successful binarization of the HTX signal and masking of the NL by algorithm is shown in Supplementary Figure 4B to 4E; and the fiducial points created along the length of the NL are shown in Supplementary Figure 4F.
Discussion
In this study, we explored the role of DL in automating assessment of retinal atrophy, particularly of the ONL and INL. This was achieved by combining conventional image processing and DL methods to initially distinguish between layers of the retina and subsequently detect the presence of retinal atrophy. The accuracy of these computational methods was validated by pathologist annotated WSIs throughout. It should be noted that although this study was performed in rodents, the method can be modified with new training data from other animal species, used in efficacy and safety studies of therapeutics, in order to accommodate the anatomical differences in those species.
Although our study utilizes a change in NL thickness to quantify retinal atrophy, the algorithm can be adapted to make alternative measurements indicative of retinal atrophy, such as cell number (density) or number of apoptotic nuclei. Our DL approach, which assesses retinal region or NL thickness, is a significant improvement in ease and speed over manual or semidigitized methods of measurement using ocular micrometer. 44 -47 Recently, Hadi Hosseini et al reported a DL and Mask R-CNN model to automatically detect and count retina cell nuclei (ONL) on transmission electron microscopy images of rodent eyes. 48 We plan to extend our algorithm to perform similar metrics to detect and count apoptotic cells in the NLs.
Our method addresses the limitations of traditional image segmentation and quantification of toxicologic pathology findings, as it automatically identifies the retinal region and NLs and detects retinal atrophy. As a result, when a study demands quantification in order to better characterize findings, accurately set control ranges, or determine minimal change, this computational method could potentially increase the reproducibility, efficiency, and precision used to evaluate retinal atrophy. 42
However, the impact of this study is limited in that it only assessed rats. As rat and mouse eyes are very similar histologically, it is reasonable to assume that the algorithm would likely perform well on mouse eyes. Since mouse models of human ocular disease such as retinal developmental or degenerative disease are used in translational research, 37 we propose as a next step to explore the utility of our model in mouse eyes. In contrast, the eyes of other species used in toxicology studies, such as nonhuman primates, dogs, rabbits, and minipigs, have important anatomical differences from rodent eyes (eg, the presence of the macula in nonhuman primates). Consequently, the method requires validation in other animals.
In digital pathology, results must be validated against pathologist evaluations. However, for any given task, there is always some level of interpathologist variance that must be taken into account. 49,50 Occasionally, where tedious manual annotation is required, quite large errors can be made that are not simply a difference in judgment. Hence it is critical for those working in digital pathology to ensure close communication between those developing an algorithm and those responsible for judging the algorithm’s ability to solve a problem for them. To the degree that a large data set of ground truth, ranging over a realistic variation in tissues and stains, can be created, the resulting algorithm can be made to be as reliable as the average pathologist for that task. However, such an algorithm is unable to adapt, as a pathologist can, to variations in tissue or staining that fall outside the range in which it was trained. 51 The prediction accuracy of the retina classification DL model and the NL classification DL model may be higher than reported, as a result of human error during ground truth annotation. All the test patches with lower than 75% accuracy were inspected and compared to the ground truth masks. Of those, approximately 40% were found to have large errors in the ground truth labeling. As a result, the true prediction accuracy per pixel may be approximately 97.3% and 96.6% for the retina classification DL model and the NL classification DL model, respectively. In the present study, these errors could have been mitigated by a step in which the ground truth labels for each image were corrected, as needed.
Two systematic errors were observed when comparing the algorithm measurements to the manual measurements. First, the thickness measurements of ONL and INL at the fiducial points, using this method, were typically larger than the manual measurements. This was caused by the nature of the ground truth annotations, which tended to circumscribe the ONL and INL with polygons that overlapped into the tissue surrounding the NLs. A relatively robust combination of image processing techniques and geometric techniques will resolve the enlargement caused by the over-large masks in a future study.
In addition, because diseased animals were not included in the ground truth, the algorithm frequently misidentified the NLs in the diseased eyes, occasionally missing the ONL altogether. For the nondiseased eyes (ie, control group eyes) measured with this method, this error did not occur. We believe that this can be addressed with appropriate ground truth representation. Nevertheless, the algorithm measurements clearly reflect the fact that for the diseased eye, the ONL has gross changes, and where it correctly identifies the ONL, it roughly follows the trend found with manual measurements in the diseased eyes.
Although this technique worked well on our WSIs of eyes without abnormal findings (the control group), the algorithm performed only partially to identify the retina and separate the NLs on diseased eyes, mainly due to the absence of ground truth diseased eye annotations. In addition, the poor quality of the archival slides of diseased eyes (faded H&E staining and age of the slides) hampered the digitization and image processing steps prior to the application of the DL models. These slides helped determine the limits of the algorithm. There is also often a lot of variability in the quality of sections of the eyes from routine rodent toxicology studies: The small rodent globes are difficult to process and cut such that sections are made through the center of the eye and its important structures (eg, optic nerve, lens, cornea). We plan, therefore, to deploy the algorithm on a larger study of light-induced retinal atrophy in which care is taken to ensure adequate histological sections of the eyes. We will also seek to discriminate between severity grades of retinal atrophy by including diseased eyes across the spectrum of retinal atrophy in the ground truth annotations. In addition, the method we have described here provides a template which can be used to retrain, validate, and analyze results of toxicologic pathology studies. Future work will also include creating training images for the DL model that include a significant fraction of narrowed NLs which occur during retinal atrophy. Furthermore, we will address the HTX fading so that this algorithmic method can be used to compare to the manual method for more than just an example case. We anticipate using both the ONL and the INL for these measurements.
In conclusion, this study has demonstrated that DL has the potential to facilitate the evaluation of therapeutic and/or light-induced retinal atrophy in rodents efficiently. In addition, this study provides a template which can be used to train, validate, and analyze the results of toxicologic pathology DL models to other animal species used in efficacy and safety studies of therapeutics.
Supplemental Material
Supplemental Material, sj-tif-1-tpx-10.1177_0192623320980674 - Deep Learning in Toxicologic Pathology: A New Approach to Evaluate Rodent Retinal Atrophy
Supplemental Material, sj-tif-1-tpx-10.1177_0192623320980674 for Deep Learning in Toxicologic Pathology: A New Approach to Evaluate Rodent Retinal Atrophy by Maria Cristina De Vera Mudry, Jim Martin, Vanessa Schumacher and Raghavan Venugopal in Toxicologic Pathology
Supplemental Material
Supplemental Material, sj-tif-2-tpx-10.1177_0192623320980674 - Deep Learning in Toxicologic Pathology: A New Approach to Evaluate Rodent Retinal Atrophy
Supplemental Material, sj-tif-2-tpx-10.1177_0192623320980674 for Deep Learning in Toxicologic Pathology: A New Approach to Evaluate Rodent Retinal Atrophy by Maria Cristina De Vera Mudry, Jim Martin, Vanessa Schumacher and Raghavan Venugopal in Toxicologic Pathology
Supplemental Material
Supplemental Material, sj-tif-3-tpx-10.1177_0192623320980674 - Deep Learning in Toxicologic Pathology: A New Approach to Evaluate Rodent Retinal Atrophy
Supplemental Material, sj-tif-3-tpx-10.1177_0192623320980674 for Deep Learning in Toxicologic Pathology: A New Approach to Evaluate Rodent Retinal Atrophy by Maria Cristina De Vera Mudry, Jim Martin, Vanessa Schumacher and Raghavan Venugopal in Toxicologic Pathology
Supplemental Material
Supplemental Material, sj-tif-4-tpx-10.1177_0192623320980674 - Deep Learning in Toxicologic Pathology: A New Approach to Evaluate Rodent Retinal Atrophy
Supplemental Material, sj-tif-4-tpx-10.1177_0192623320980674 for Deep Learning in Toxicologic Pathology: A New Approach to Evaluate Rodent Retinal Atrophy by Maria Cristina De Vera Mudry, Jim Martin, Vanessa Schumacher and Raghavan Venugopal in Toxicologic Pathology
Footnotes
Authors’ Note
Maria Cristina De Vera Mudry and Jim Martin contributed equally to this work.
Acknowledgments
The authors would like to thank Christelle Zundel and Shanon Seger at F. Hoffmann-La Roche Ltd, Simrath Ratra of Roche Tissue Diagnostics, and Gina Chacko, formerly of Roche Tissue Diagnostics, for their contribution to the study. Medical writing assistance was provided by Meridian HealthComms Ltd, Plumley, United Kingdom, in accordance with Good Publication Practice (GPP3) guidelines, funded by F. Hoffmann-La Roche.
Declaration of Conflicting Interests
The author(s) declared the following potential conflicts of interest with respect to the research, authorship, and/or publication of this article: Maria Cristina De Vera Mudry and Vanessa Schumacher are employees of F. Hoffmann-La Roche Ltd. Jim Martin is a full-time contractor/consultant for Roche Tissue Diagnostics. Raghavan Venugopal is an employee of Roche Tissue Diagnostics.
Funding
The author(s) received no financial support for the research, authorship, and/or publication of this article.
Supplemental Material
Supplemental material for this article is available online.
References
Supplementary Material
Please find the following supplemental material available below.
For Open Access articles published under a Creative Commons License, all supplemental material carries the same license as the article it is associated with.
For non-Open Access articles published, all supplemental material carries a non-exclusive license, and permission requests for re-use of supplemental material or any part of supplemental material shall be sent directly to the copyright owner as specified in the copyright notice associated with the article.