
Abstract
Normal retina and its cell layers are essential for processing visual stimuli, and loss of its integrity has been documented in many disease processes. The numbers and the axonal processes of retinal ganglion cells are reduced substantially in glaucoma, leading to vision loss and blindness. Similarly, selective loss of photoreceptors in age-related macular degeneration and hereditary retinal dystrophies also results in the compromise of visual acuity. Development of genetically modified mice has led to increased understanding of the pathogenesis of many retinal diseases. Similarly, in this digital era, usage of modalities to quantify the retinal cell loss has grown exponentially leading to a better understanding of the suitability of animal models to study human retinal diseases. These quantification modalities provide valuable quantifiable data in studying pathogenesis and disease progression. This review will discuss the immunohistochemical markers for various retinal cells, available automated tools to quantify retinal cells, and present an example of retinal ganglion cell quantification using HALO image analysis platform. Additionally, we briefly review retinal cell types and subtypes, salient features of retina in various laboratory animal species, and a few of the main disease processes that affect retinal cell numbers in humans.
Introduction
Survival and navigation in the world rely almost exclusively on vision; fear of blindness and vision loss is ranked among the top health concerns for Americans, similar to cancer and Alzheimer disease. 1 Vision begins in the retina of the eye. Vertebrate retinas have evolved over several hundred million years to use intricately organized and interconnected distinct population of cells and relies (nominally) on 6 neuronal types to capture the environmental visual stimuli, integrate, and process it and signal to higher visual centers. 2 –4 Despite a peripheral location, the retina, which is the neural part of the eye, is considered part of central nervous system (CNS) as it develops from the diencephalon of the brain. 5 The neuronal cells present in the retina are photoreceptors (PRs; rods and cones), interneurons (bipolar cells, horizontal cells [HCs], and amacrine cells), and retinal ganglion cells (RGCs). Photoreceptors transduce light into electrical signals and form synapses with interneurons, which relay, integrate, and modulate visual signals and transmit them to RGCs. The RGCs, in turn, send axons through the optic nerve to various areas of the brain. The RGCs serve as the sole communication between the retina and brain. The retinal pigment epithelium (RPE) is one of the major non-neuronal cell population along with retinal glial cells. This forms a monolayer of pigmented cells (nonpigmented in albinos) beneath the light-sensitive PR outer segment. The relationship between RPE and PR is pivotal and RPE performs many functions that are crucial to sight. 6 Retinal ganglion cell is separated from the fenestrated endothelium of the choriocapillaris by Bruch’s membrane forming a part of blood/retina barrier. 7
In developed countries, loss of RGC in glaucoma or PR in age-related macular degeneration (AMD) is largely responsible for incurable vision loss. 8 With tremendous advancements in the application of digitization of biological data, we are ushering in an exciting era of medicine, with high expectations that retinal imaging and cell quantification will transform the understanding of retinal diseases. This review will provide an overview of retinal cells in different species, immunohistochemical markers for retinal cells, and existing modalities of retinal cell quantification in the context of understanding retinal diseases.
Retinal Cells Among Various Species
The 6 classes of neuronal cells are organized into layers to form the retina (Figure 1). The layers from the choroidal side to the vitreous side are the retinal pigment epithelium (RPE), the photoreceptor layer (PL), outer nuclear layer (ONL), outer plexiform layer (OPL), inner nuclear layer (INL), inner plexiform layer (IPL), ganglion cell layer (GCL), and the nerve fiber layer (NFL). For a fully functional retina, generation of these cells in proper quantity in the correct position at the right time while making the appropriate synaptic connections is imperative.
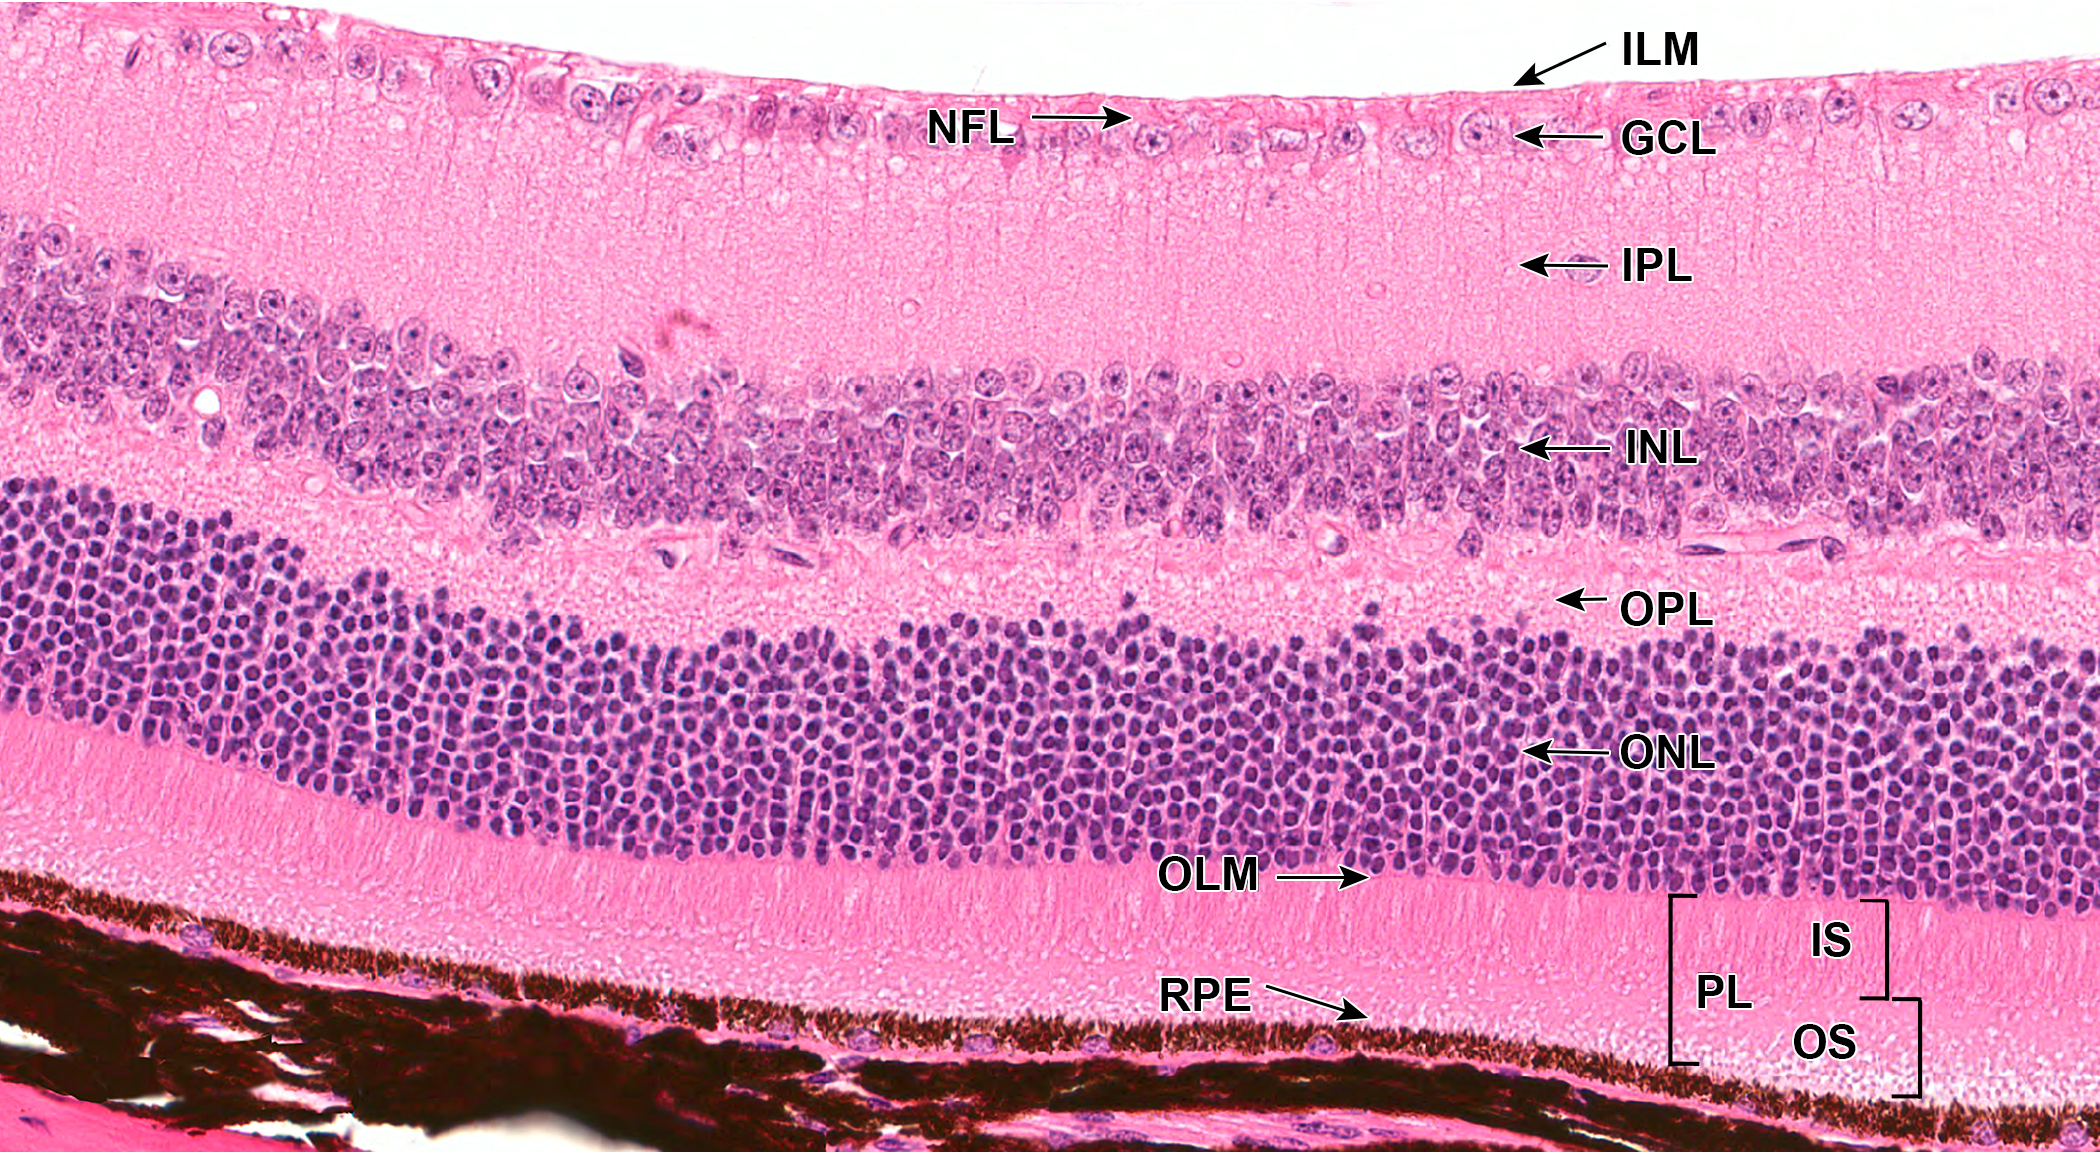
Representative photomicrograph of mouse retina showing cells arranged as layers (male, naive, wild type, RLBP1+/+ RPE65Met/Met hematoxylin and eosin). The ONL is composed of nuclei of rod and cone photoreceptors; the INL is composed of nuclei and processes of horizontal cells, bipolar cells, amacrine cells, and also Müller cells; and the GCL contain axons and nuclei of ganglion cells and displaced amacrine cells. ILM indicates inner limiting membrane; NFL, nerve fiber layer; GCL, ganglion cell layer; IPL, inner plexiform layer; INL, inner nuclear layer; OPL, outer plexiform layer; ONL, outer nuclear layer; OLM, outer limiting membrane; PL, photoreceptor layer; IS/OS, inner segment/outer segment layer; RPE, retinal pigment epithelium.
Photoreceptors
The outermost neural retina layer consists of rod and cone PRs and the nuclei of these PRs are located in the ONL. Rods are responsible for vision at low light levels (scotopic vision) and the cones are active at higher light levels (photopic vision). In primates such as the macaque, there are 3 types of cones that vary in their sensitivity to wavelength: S-cones for short wavelength (blue light), M-cones for medium wavelength (green light), and L-cones for long wavelength (red light). 9 The mouse retina comprises 2 kinds of cone PRs, 1 for short wavelength and 1 for middle wavelength light. In mouse retina, rods comprise 97% of about 6.5 million PRs. 10 In human retina, there are about 120 million rods and about 6 million cones. 11
Animal species used in the nonclinical safety studies demonstrate immense variations in the presence and density of cone PR to enable visual acuity. One such region of altered PR density and a noteworthy comparative anatomical variation in the retina can be seen at and around the macula, 12,13 a cone-dense region located just temporal to the optic disc, present in the retina of nonhuman primates. The macula comprises less than 4% of total retinal area in humans but is responsible for almost all of our useful photopic vision. 14 It generates the central, high-resolution, color vision that is possible in good light. At its center is the fovea, a cone-dominated avascular region of maximal visual acuity. Nonprimate species have an analogous area of specialization called the area centralis. Recently, the area centralis of dog retina have been shown to have a primate fovea-like area of increased cone PR, 15 while rabbits have a region called visual streak that has a high density of cones and ganglion cells. The primary laboratory rodent species of rat and mouse lack a macula (Table 1).
Comparative Subgross Anatomy and Physiology of the Retina Between Common Nonclinical Animal Species.a
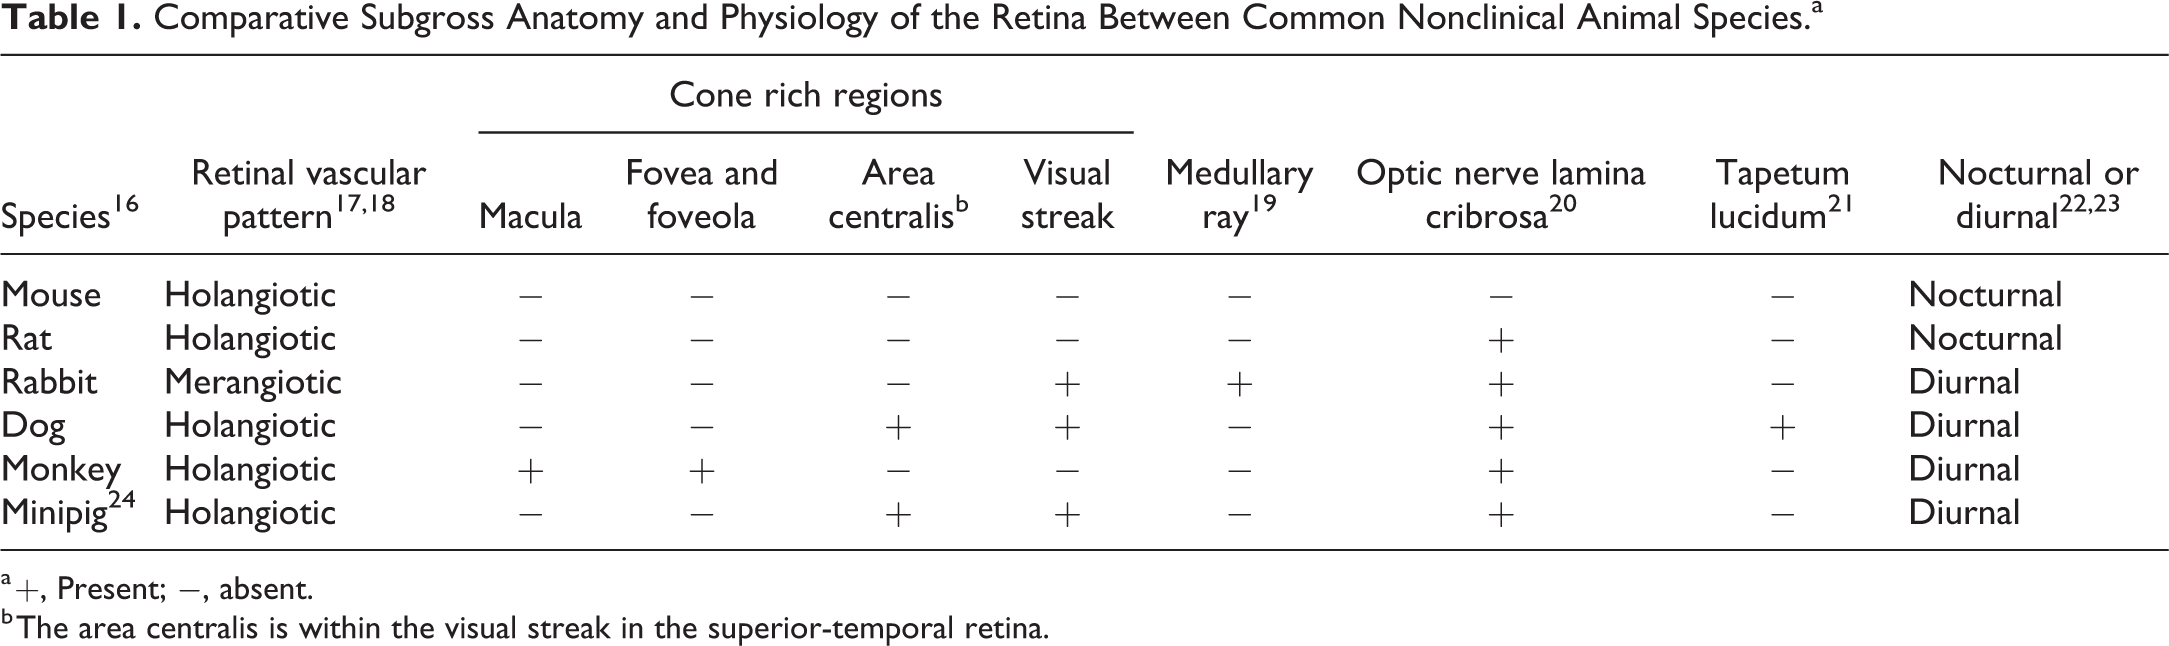
a +, Present; −, absent.
b The area centralis is within the visual streak in the superior-temporal retina.
Horizontal Cells
Horizontal cells reside in the INL of the retina along with bipolar cells and amacrine cells. A conserved divergence of HCs across vertebrate lineage is that they can be either axon-bearing (H1) or axon-less (H2) subtypes. 25 In cone-rich retinas, 2 types of axon-less HCs are present along with H1 HCs. 26 In rod-dominated retinas, there is only one type of axon-less HC. 27 Extremely rod-dominated retinas, such as the mouse and rat retina that have merely 1% to 3% cones, lack the H2 HC subtypes altogether. 28 Both types of HCs contact M and L cones nonselectively, but only H2 HCs make dense dendritic and axonal connections with S cones. 29 Readers are encouraged to review other publications for in depth physiology and synaptic circuitry of HCs. 30,31
Bipolar Cells
There are 15 morphological types of mouse bipolar cells and they are present in the INL of the retina. There are 5 types of OFF bipolar cells (1a, 2, 3a, 3b, and 4), 1 type of dendrite-less bipolar cell (1b), 8 types of ON cone bipolar cells (5a, 5b, 5c, 5d, 6, 7, 8, 9), and 2 groups of rod bipolar cells (RB1 and RB2). 32 The ON bipolar cells are inhibited by glutamate released by cone PR, and the release of glutamate by cone PR is inhibited in light, hence stimulating ON bipolar cells. On the other hand, OFF bipolar cells are stimulated by increased glutamate which is released by PR in the dark. The axons of the ON bipolar cells interact with the dendrites of ON-RGCs and OFF bipolar cells synapse with the OFF-RGCs. 33
Amacrine Cells
Amacrine cells along with horizontal and bipolar cells in the retinal INL are the interneurons that serve to relay, integrate, and modulate visual signals from PRs to ganglion cells. 34 Amacrine cells modulate the synaptic activity between bipolar and ganglion cells and represent the most diverse class of neurons in the retina. 3 Amacrine cells are classified into 2 major types: diffuse and stratified. Diffuse amacrine cells extend their processes throughout the thickness of the inner plexiform layer, whereas the stratified cells extend their processes one or a few levels in the inner plexiform layer. Diffuse amacrine cells can be subclassified into narrow or wide field and the stratified amacrine cell can be subclassified into mono, bi, or multistratified. Overall, a minimum of at least 28 different subtypes of amacrine cells can be classified based on criteria such as morphology, sublaminar location, and neurotransmitter types (eg, glycinergic, γ-aminobutyric acidergic, dopaminergic, or cholinergic). 34 Amacrine cells comprise of ∼41% of all cells in the mouse INL and have been shown to make up ∼60% of the neurons in the ganglion cell layer of the mouse retina (displaced amacrine cells). 10 The proportion of displaced amacrine cells in the GCL varies between species: rats (∼50%), 35 humans (3% in the central retina to nearly 80% in the peripheral retina), 36 macaques (5%-30%), 37 new world monkeys (∼48%-54%), 38 and hamsters (>40%). 39
Retinal Ganglion Cells
There are more than 40 distinct subtypes of RGCs that are classified morphologically and functionally. Distinct types of RGCs respond to different visual stimuli, such as increases or decreases in light intensity, color, or moving objects. All distinct RGCs share several common features, for example, their cell body is located in the ganglion cell layer, their spine-free dendrites arborize in the inner plexiform layer, and their axons travel to the brain in the optic nerve. In mice, there are 4 types of ON-OFF directionally selective ganglion cells, 3 types of ON directionally selective ganglion cells, 3 types of α ganglion cells, 5 types of intrinsically photosensitive melanopsin-containing ganglion cells, 3 types of J type ganglion cells, chromatically sensitive ganglion cells, orientation sensitive ganglion cells, suppressed by contrast ganglion cells, 2 types of beta cells, and local edge detector ganglion cell. Total number of RGC in human varies from 0.7 to 1.5 million 40 and the density varies from ∼45,000 cells/mm2 near the fovea to ∼8000 cells/mm2 in the periphery. 41 In mice, the number of ganglion cells is highly variable among different mouse strains, ranging from 32,000 to 87,000, and the mean density is around 3500 cells/mm2. 42 In the rat, the average number of ganglion cells in various strains is about 70,000 to 120,000, and the mean density is around 1700/mm2. 42,43 In macaques, the range is between 850,000 and 1,300,000, 35 and the density varies from 50,000 cells/mm2 near the fovea to ∼800 cells/mm2 in the periphery. 44 In dogs, the estimated number of ganglion cells is around 150,000. 20
Retinal Pigment Epithelium
The RPE is one of the major non-neuronal cell population along with retinal glial cells (described below). The RPE forms a monolayer of pigmented cells (nonpigmented in albinos) located beneath the light-sensitive PR outer segment and separated from the fenestrated endothelium of the choriocapillaris by Bruch’s membrane, which is a multilayered structure comprising of RPE basement membrane, inner, and outer collagenous layers, with the elastin layer between them and choriocapillaris basement membrane. 45 In humans, every RPE is in interaction with a mean of 23 PRs. The RPE and the PR depend on each other in the process of differentiation and maturation. 46 In nonhuman primates, foveal RPEs have the lowest number of PRs per RPE cell (20:1) with the ratio increasing to 40:1 in the parafoveal region, while in mouse the ratio is higher in the central retina (200-250:1) compared to peripheral retina (∼100:1). 47 Both these cell types appear in conjunction in every eye of the animal kingdom from insects, Mollusca to higher vertebrates. 2
Retinal pigment epithelium undergo terminal differentiation early during development, dividing rarely or not at all throughout life, 48 but there is evidence that some mature RPE cells continue to divide mostly in the peripheral retina. 49,50 Retinal pigment epithelium perform a variety of functions to support and protect the retina, including phagocytosis of the PR outer segments, adsorption of free radicals by pigment granules, and maintenance of ocular immune privilege by forming the outer blood–retina barrier. 51
Retinal Glial Cells
Retinal glial cells consist of astrocytes, Müller cells, and microglia. They perform many functions in the retina including phagocytosing cell debris, absorbing neurotransmitters, and maintaining the blood–retina barrier. 52
Müller cells are the main type of glia found in the vertebrate retina. They stretch radially across the thickness of the retina and their fine processes ensheath all retinal neurons. 53 Human retina contains 8 to 10 million Müller cells. They play a critical role in regulating the extracellular volume, ion and water homeostasis, maintaining the inner blood–retinal barrier, support survival of PRs, modulate immune and inflammatory responses, and become activated by virtually all pathogenic stimuli. 54 This activation of Müller cells is called Müller cell gliosis. 39 In addition to becoming reactive, Müller cells can be reprogrammed to display hallmarks of PRs, bipolar, and amacrine cells, paving a potential way to treat neurodegenerative retinopathies. 55
Retinal astrocytes along with Müller cells are termed retinal macroglia. Retinal astrocytes are located mainly in the nerve fiber layer and ganglion cell layer in most mammals, that is, humans, rats, and mice. 56 In rabbits, astrocytes are confined to the medullary ray, which is the only vascularized area in the rabbit retina. 57 Morphology of retinal astrocytes differs between species. In humans, there are elongated and star-shaped astrocytes, whereas in mice and rats, only star-shaped astrocytes are present. 58 Additionally, the morphology of retinal astrocytes changes from symmetrically stellate in the peripheral retina to extremely elongated in the optic nerve head. 59 As in other parts of the CNS, retinal astrocytes react to multiple types of insults by reactive astrogliosis, characterized by hypertrophy, hyperplasia, increase in number and length of astroglia processes, migration, and upregulation of glial fibrillary acidic protein. Many retinal pathologies, like AMD, diabetic retinopathy (DR), retinitis pigmentosa (RP), glaucoma, 58 laser-induced ocular hypertension, show reactive astrogliosis.
Retinal microglia are normally located in the nerve fiber layer/ganglion cell layer, in both inner and outer plexiform layers 60 and PR layer. 61 They are the most abundant immune cell present in the retina. They are thought to closely interact with Müller cells. 62 Retinal microglia play a crucial role in the phagocytosis of debris and apoptotic cells while modulating vasculogenesis, synapse maintenance, and responding to inflammation. 60 Depletion of retinal microglia has been shown to lead to synaptic degeneration and atrophy within the outer plexiform layer and reduced visual function. 63 It has been hypothesized that age-related changes in the retinal microglia and its accumulation in the subretinal space might foster an inflammatory environment conducive for the neovascular alterations observed in wet AMD. 64 For a detailed review on the role of retinal microglia in retinal physiology and pathology, refer to Khalid Rashid et al 65 and O’Koren et al. 66
Immunohistochemical/Immunofluorescent Markers of Retinal Cells
Immunohistochemical methods allow enhanced identification of wide range of cellular targets and provide glimpses of the variety and distribution of neuronal and non-neuronal cells in the vertebrate retina. They are useful for qualitative and quantitative assessment of retinal cells for basic science research as well as toxicological risk assessment. To date, many antibodies have been used to identify retinal cells. A complete review of antibodies that have been used to identify retinal cells is beyond the scope of this manuscript, but we have attempted to consolidate the common antigens that have been utilized to visualize retinal cells (Table 2).
Immunohistochemical Markers for Retinal Cells.
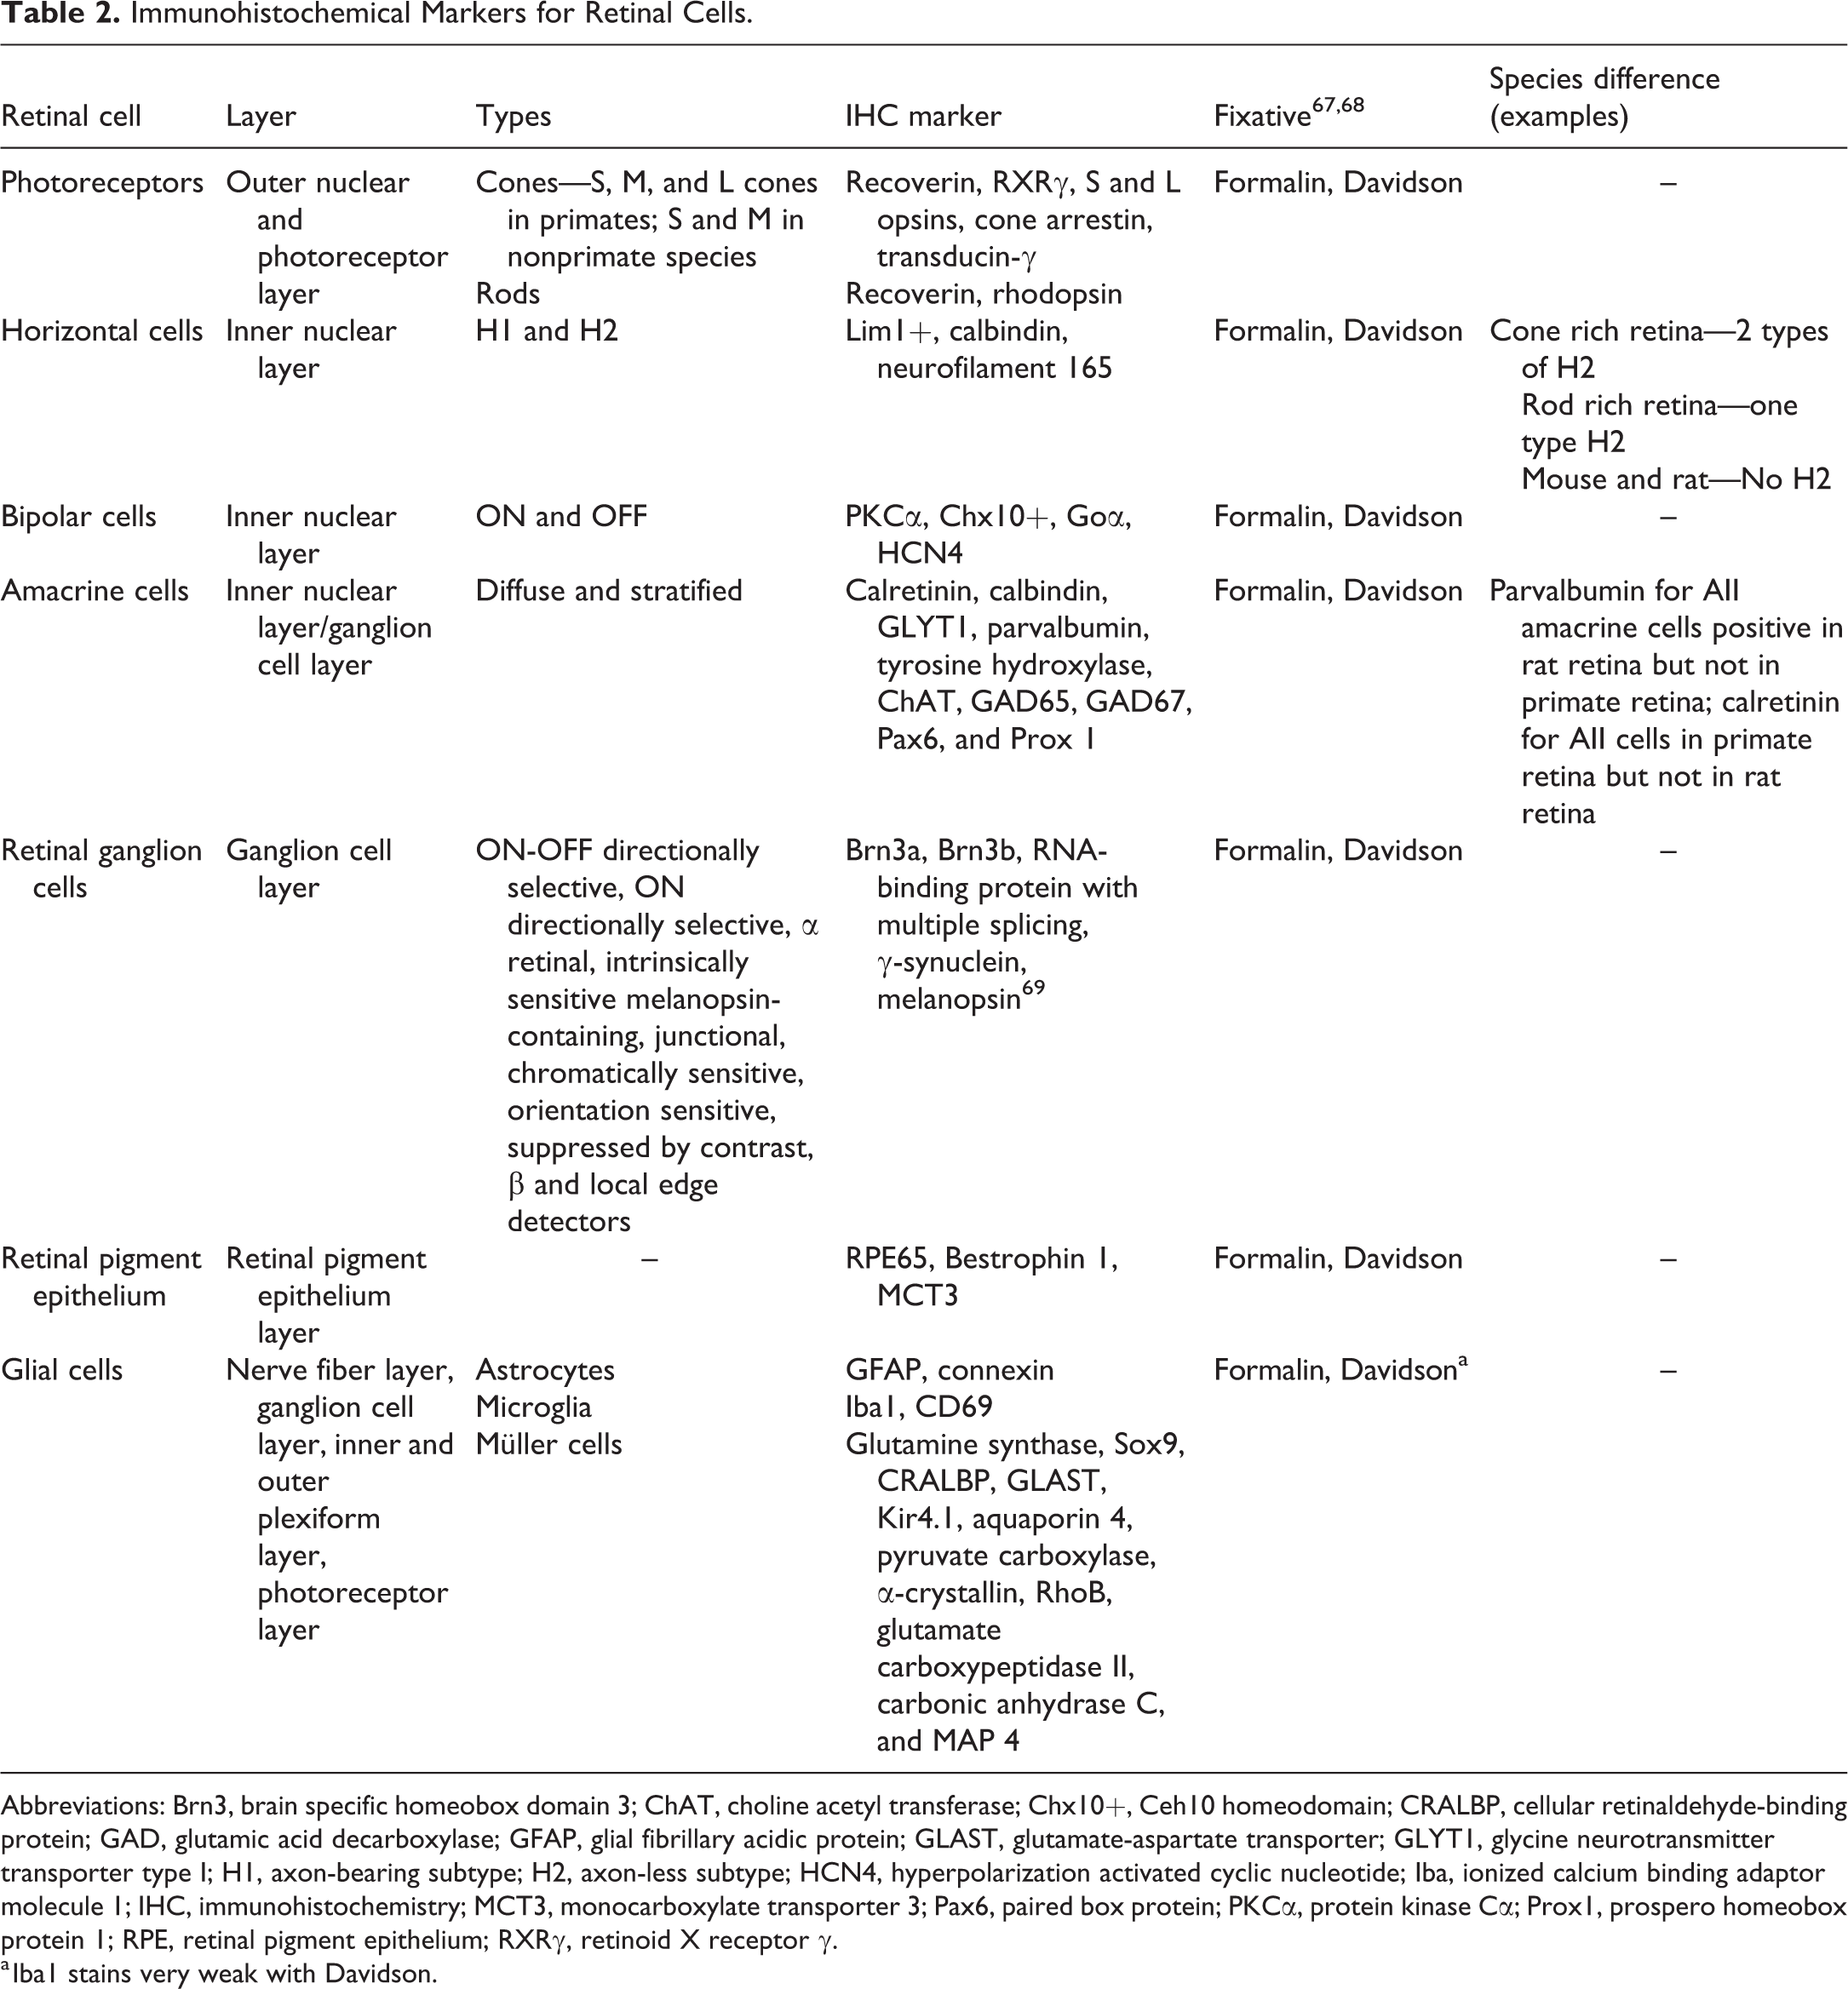
Abbreviations: Brn3, brain specific homeobox domain 3; ChAT, choline acetyl transferase; Chx10+, Ceh10 homeodomain; CRALBP, cellular retinaldehyde-binding protein; GAD, glutamic acid decarboxylase; GFAP, glial fibrillary acidic protein; GLAST, glutamate-aspartate transporter; GLYT1, glycine neurotransmitter transporter type I; H1, axon-bearing subtype; H2, axon-less subtype; HCN4, hyperpolarization activated cyclic nucleotide; Iba, ionized calcium binding adaptor molecule 1; IHC, immunohistochemistry; MCT3, monocarboxylate transporter 3; Pax6, paired box protein; PKCα, protein kinase Cα; Prox1, prospero homeobox protein 1; RPE, retinal pigment epithelium; RXRγ, retinoid X receptor γ.
a Iba1 stains very weak with Davidson.
The brain-specific homeobox domain 3 (Brn-3) family of proteins, including Brn3a (Figure 2A) and Brn3b, localizes exclusively on RGC nuclei. RNA-binding protein with multiple splicing and γ-synuclein can be utilized for quantitative assessment of RGC death in the models of experimental glaucoma and time course studies involving optic nerve damage 34,70 –72 and melanopsin (Opn4) can be used to visualize 6 types of intrinsically photosensitive RGCs. 69 Bipolar cells can be identified by the stereotypical bipolar cell marker, protein kinase Cα (PKCα; Figure 2B), in all mammals 67,73 along with Ceh10 homeodomain (Chx10+). 34 Hyperpolarization activated cyclic nucleotide gated potassium channel (Goα and HCN4) label ON-type bipolar cell and OFF-type bipolar cells, respectively. 74,75 Multiple markers have been exploited to understand and analyze the distribution and function of amacrine cells; these include calretinin (Figure 2C), Pax6 (paired box protein), glycine neurotransmitter transporter type 1 (GLYT1), tyrosine hydroxylase (Figure 2D), choline acetyl transferase (ChAT; Figure 2E), glutamic acid decarboxylase 65 (GAD65), GAD67, and calbindin. 34 In addition to these, prospero homeobox protein 1 (Prox1) has been used to detect AII amacrine cells in adult mouse retina. 74 AII amacrine are glycinergic cells that are primarily located in the INL. It is involved in distributing the scotopic signals from RB cells to ON and OFF cone pathways. 76,77 As amacrine cells are a very diverse neuronal population, species differences exist in the expression of these markers. For example, parvalbumin is a marker for AII amacrine cells in rat retina but not in the primate retina; and conversely calretinin is a marker for AII amacrine cells in the primate retina but not in the rat retina. 73 Horizontal cells can be labeled by antibodies for LIM homeobox 1 (Lim 1+), calbindin (Figure 2F), and neurofilament 165. 34,78,79 Generally, neurofilaments label only the axon terminals of the HCs. 73 All PRs are positive for recoverin while retinoid X receptor gamma (RXRγ) and cone arrestin stain cone PRs. 34,75,79 Additionally, S-opsin and LM-opsin can be used to label and quantify displaced cones in GCL and INL, and these 2 markers are also expressed in the cones of ONL. 79
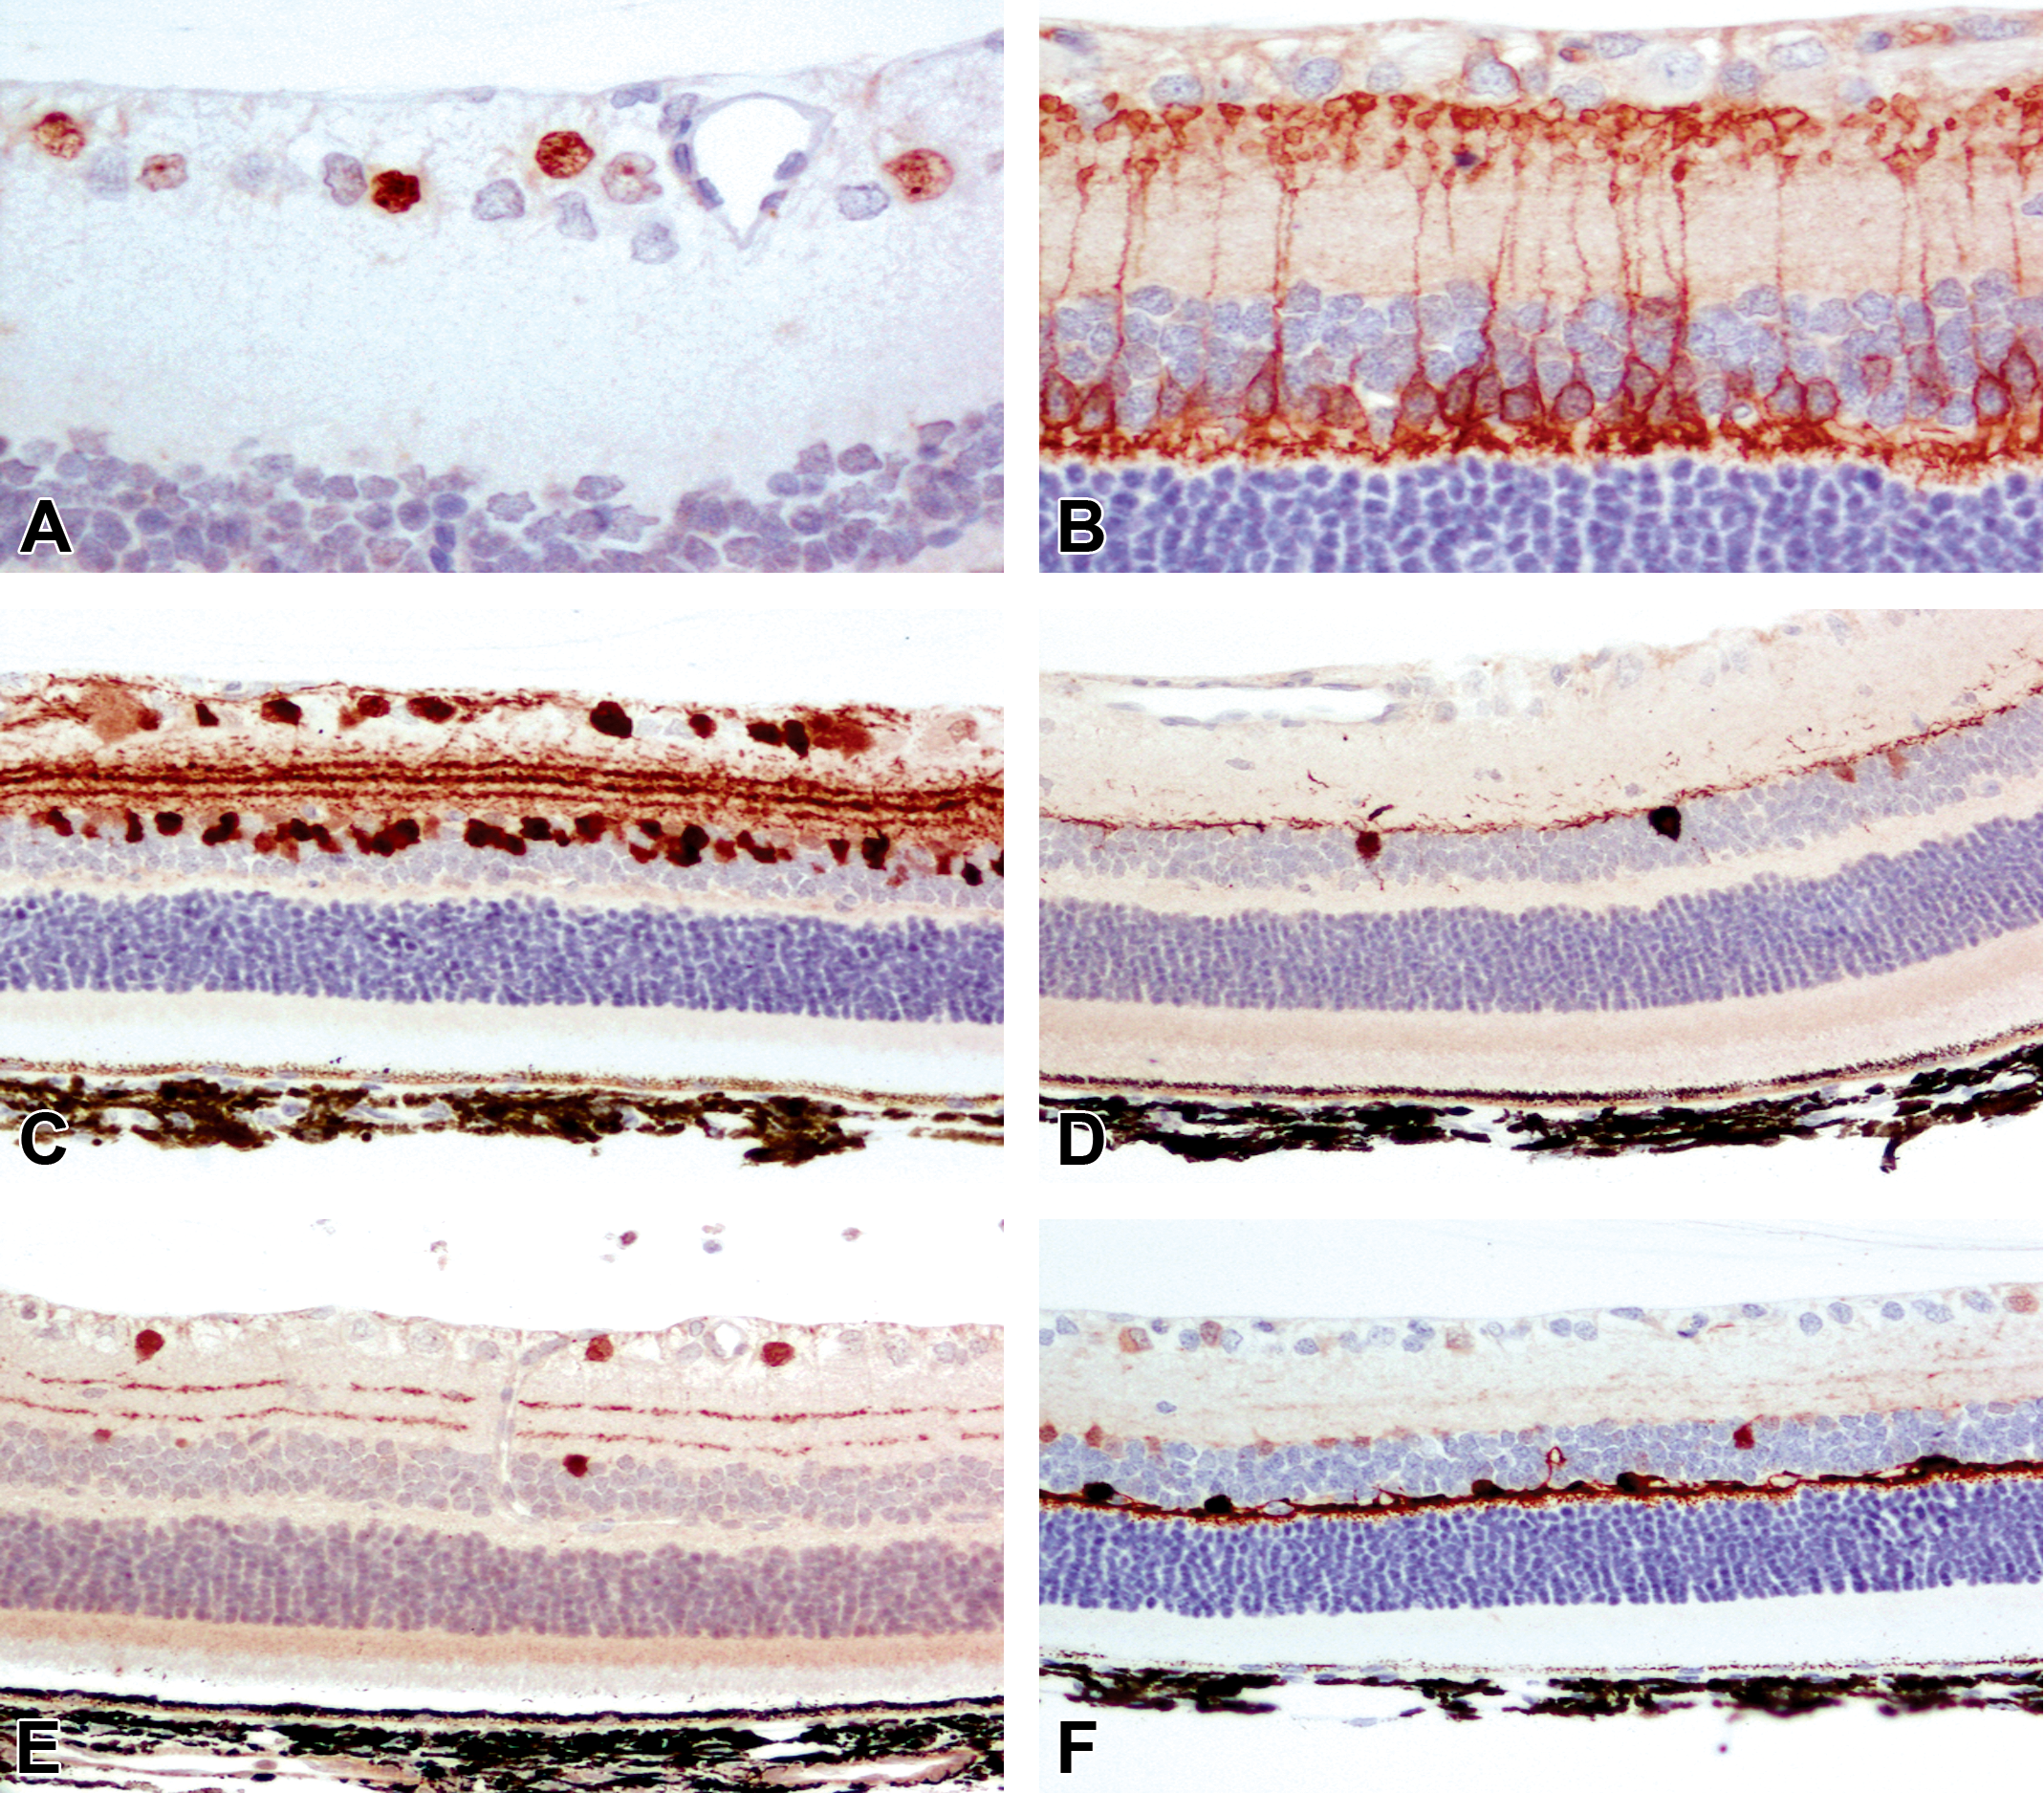
Representative images of retinal neuronal cell markers from adult dark Agouti rats. A, Brn3 demonstrating the nuclei of ganglion cells in the ganglion cell layer. B, Labeling of bipolar cells and their processes terminating in the inner and outer plexiform layers by PKCα. C, Labeling of amacrine and ganglion cells by calretinin. D, Labeling of putative dopaminergic amacrine cells by tyrosine hydroxylase. E, Labeling of putative cholinergic amacrine cells by choline acetyl transferase. F, Labeling of horizontal cells and their processes by calbindin. Reproduced with permission from Chidlow et al. 67 Brn3 indicates brain-specific homeobox domain 3; PKCα, protein kinase Cα.
Retinal pigmented cell can be identified using bestrophin 1 (BEST1), 80 RPE65 (Figure 3A), and monocarboxylate transporter 3 (MCT-3, Figure 3B). 67 Selective immunohistochemical markers can be used to highlight other non-neuronal cells like astrocytes, Müller cells, and microglia. Müller cells can be immunostained by vimentin, glutamine synthase (Figure 3C) and Sox9, 34 cellular retinaldehyde-binding protein (CRALBP), glutamate-aspartate transporter (GLAST), Kir4.1 subtype of inwardly rectifying potassium channels, aquaporin-4, pyruvate carboxylase, α-crystallin, RAS homolog family member B (RhoB), glutamate carboxypeptidase II, carbonic anhydrase C, and microtubule-associated protein 4. 52 Glial fibrillary acidic protein (Figure 3D) and connexin 43 can be used to label astrocytes, 52 while ionized calcium binding adaptor molecule 1 (Iba1; Figure 3E) and CD69 are used to label microglia. Care should be taken when interpreting the results of quantification, as some markers are expressed by 2 different neuronal cells of the retina. For example, both displaced amacrine cells and RGC are positive for islet 1 and β III tubulin, and amacrine cells are less likely to die in cases of experimental glaucoma and optic nerve damage, which will lead to overestimation of RGCs in these instances. 81 In contrast, Thy1 (CD90), a surface glycoprotein, is expressed on RGCs and is downregulated to a much greater extent than the RGC number loss. So, usage of Thy1 for RGC quantification may overestimate the RGC loss in cases of experimental glaucoma. 82 The readers are encouraged to read the study of Haverkamp and Wassle 73 for a complete list of immunohistochemical markers and their cross-reactivity between retinal cells.
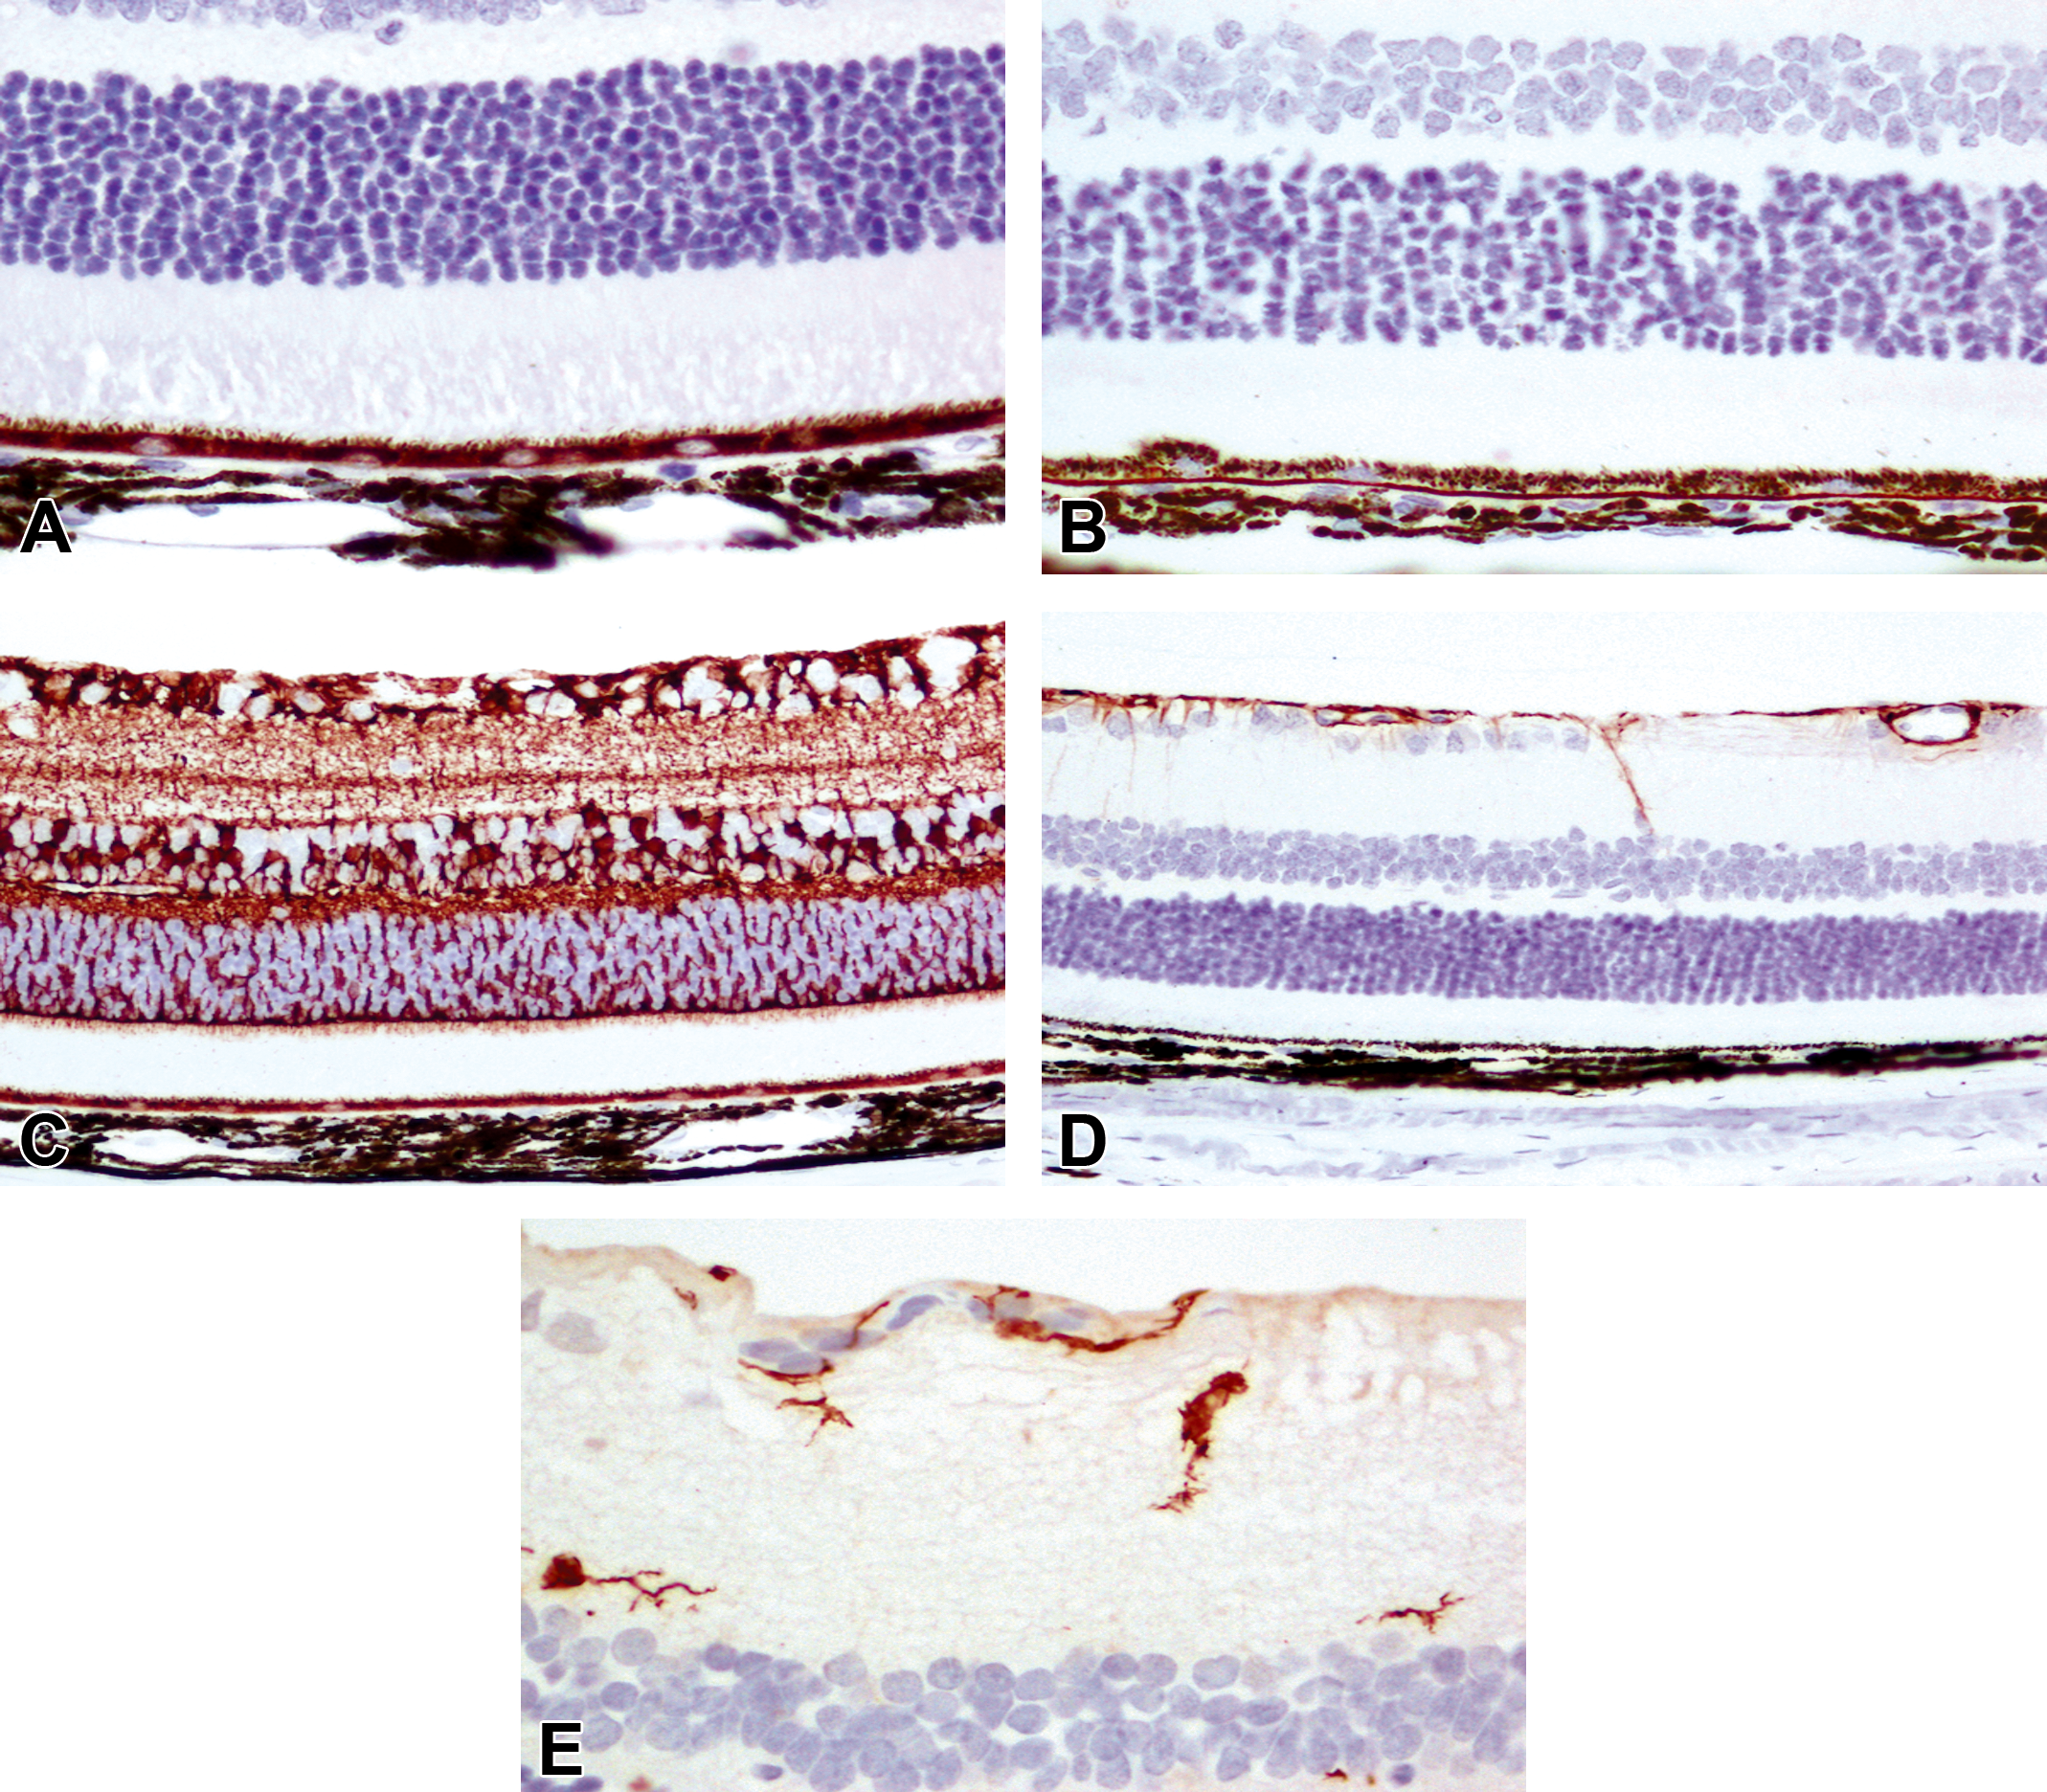
Representative images of retinal non-neuronal cell markers from adult dark Agouti rats. A and B, Labeling of RPE (including apical processes) by RPE 65 (A) and MCT-3 (B). C, Labeling of Müller cells by glutamine synthase. D, Labeling of astrocytes by GFAP. E, Labeling of microglia by Iba-1. Reproduced with permission from Chidlow et al. 67 GFAP indicates glial fibrillary acidic protein; MCT, monocarboxylate transporter 3; RPE, retinal pigment epithelium.
In-life labeling and subsequent quantification of RGCs can be accomplished by retrograde tracing of RGCs, optic nerve stump labeling, and intact optic nerve labeling. Retrograde labeling can be used to unambiguously label the RGCs. One of the earliest methods for retrograde labeling of RGC exploited the retrograde axonal transport of fluorogold, an excellent marker for RGCs, where the dye injected into the superior colliculus (SC) is taken up by 90% of RGCs. 83 Cholera toxin subunit B can be conjugated to fluorophore such as Alexa 488 or Alexa 594 to label RGCs reliably and specifically. 84 Optic nerve stump labeling can be utilized when the SC labeling pathway is disrupted either in optic nerve transection or crush animal models. 85 In this model, a piece of foam soaked in fluorogold is placed at the end of transected optic nerve and left there. Animals can be euthanized at various time points for retinal whole mount cell counting. In case of intact optic nerve, labeling is carried out by applying the fluorogold soaked foam around the circumference of the optic nerve. As with IHC markers, retrograde labeling comes with its own pitfalls, such as the lack of persistence for extended periods of time and their uptake by microglia and macrophages after injury-induced death of RGCs, thereby reducing the specificity of the label to RGCs.
Despite the widespread studies of retinal biology, meaningful data can be obtained only by use of validated antibodies and diligent method optimization. The readers are encouraged to review the study of Chidlow et al, 67 and Stradleigh and Ishida 68 for a comprehensive understanding of the effects of processing and fixation on retinal biology and visualization.
Modalities for Quantification of Cells
Quantification of retinal cells can be accomplished after visualizing individual cells by immunohistochemistry (IHC) or immunofluorescence using the markers discussed above. Numerous modalities have been pursued to quantify retinal cells, and quantification of RGCs has been the most studied.
Earlier methods for quantification of RGCs include manual counting of methylene blue stained RGC density on whole mount retina, 86 optic nerve axonal counts, 87 retrograde filling of optic tract, 88 automated flat mount counts, 89 and fluorescent whole mount counting. 90 Apart from quantification of ganglion cells, microglial cells present in the PR layer, outer plexiform layer, inner plexiform layer, ganglion cell layer, and nerve fiber layer can be quantified either by noninvasive widefield autofluorescence imaging 91 or using automation on whole retina mounts stained with microglial marker, Iba1. 61
The advantage of retina flat mount quantification is the granting of a global view of all the retinal cells. This allows for an aggregate counting of cells, yielding cell densities based on retinal area. It also enables the researcher to observe any local area of pathology that histological sections fail to provide. But the results obtained should be interpreted with caution as the ganglion cell density has considerable variation within the retina and is susceptible to significant variation due to swelling or shrinkage during tissue preparation. Imaging the flat mount of the eye or retina usually requires tile scanning to obtain a high resolution to cover the large field of view. In addition, Z-stacks are also required because the thickness of retinal cell layers is often larger than the focal plane, and flat mounts are not completely flat because of the spherical shape of the eye. Additionally, this method can be time-consuming and rigorous and is prone to subjective bias during selection of retinal segments to quantify.
On the other hand, histological eye sections are much more accessible and relatively easier to quantify. They provide a snapshot of the pathological condition in the eye and having many sections allows for multiple stains and histological procedures. However, to obtain an awareness of the state of the eye, all the sections must be thoroughly examined. In order to compare between sections, the orientation or alignment of the eyes should be the same but may be difficult to acquire. With the advent of fast and reliable slide scanners, it is now possible to obtain the scan of whole slides containing the sections of the eye stained with immunohistochemical markers. The digital slides can be subjected to image analysis to automatically quantify or estimate cells of the retina. There are many commercially available and open source image analysis platforms to accomplish the task of retinal cell quantification. HALOTM92 by Indica labs, Visiopharm, 93 Patholytix by Deciphex, 94 Definiens, 95 Aiforia, Metamorph, 96 StereoInvestigator, 97 and IPlab 98 are major commercially available software and Image J, CellProfiler and Qupath 92 are some of the open source image analysis software. There are also novel programs developed by individual laboratories to aid in the rapid automated quantification of retinal cells. 99
One of the most efficient, repeatable, and accurate counting methods that is without systemic or statistical bias is stereology. 100 Stereology provides 3-dimensional quantification of the tissue or structure of interest through rigid sectioning and sampling methods based on statistical principles and stochastic geometric theory. Common stereology end points apart from number include volume, surface area, and length estimates. The digital files obtained for stereology can be assessed using software platforms developed by Visiopharm or Horsholm. Caveats of stereology include requirement of the entire tissue or region of interest for sampling, specialized computer software for analysis, and specialized equipment in certain circumstances. 101
The quantification platforms mentioned above require euthanasia of the experimental animals followed by excision of the eye and preparation of the retina. Over the last few years, many imaging agents have emerged from research laboratories allowing highly specific fluorescence, luminescence, and radioisotope-based imaging of disease processes at the molecular level within living animals. Mazzoni et al 102 showed that injection of fluorophore coupled probes intravitreally can be used to assess the increase in fluorescence due to retinal cell apoptosis using fluorescence imagers. Similarly, fluorophore bound with annexin V, after intravenous administration, has been shown to be useful in assessing apoptotic retinal cells in humans using a confocal scanning laser ophthalmoscope. 103 These in vivo molecular imaging techniques provide rapid analysis of the changes in the retina without sacrificing the animal thereby reducing cost and time since data can be obtained from the same live animal longitudinally. However, the in vivo imaging techniques provide information on the overall increase or decrease of fluorescence as an indicator of disease process and cannot be used to ascertain the actual alterations in the cell numbers.
The authors have used HALO™ extensively for retinal cell quantification, usually on fluorescence stained slides. We present below the preparation of retina for quantification of RGCs and PRs and subsequent image analysis using HALO™. HALO™ is an image analysis platform for quantitative tissue analysis in digital pathology developed by Indica Labs. For an excellent review on retinal whole mount technique across taxa of animals, differentiation of cell types and breadth, and utility of retinal wholemount technique, please refer to Ullmann et al. 104
Preparation of the Retina for Quantification
The rodent eyes are post-fixed in 4% paraformaldehyde/formalin after whole body perfusion [fixation by transcardial infusion of phosphate-buffered saline (PBS) followed by 4% paraformaldehyde/formalin]. Optimal results can be obtained from rodent eyes post-fixed for at least 3 to 4 hours at room temperature, if cardiac perfusion was not performed. The eyes are washed in PBS a few times before dissection. The retina is dissected out for RGC or PR staining, and the posterior eye cup is dissected for RPE staining. For sections, eyes or desired tissue are placed in serial dilutions from 15% to 30% sucrose for cryoprotection then frozen in optimal cutting temperature compound for cryosectioning. Whole tissues are incubated for 1 hour at room temperature for blocking and permeabilization in blocking buffer (10% normal serum, 0.1%-1% bovine serum albumin, 0.1%-0.5% Triton X-100 in PBS). Following blocking and aspirating the blocking buffer, the tissues are incubated overnight at 4 °C in primary antibody (Anti-Brn3a for RGC) diluted 1:500 in blocking buffer. The following day, unless the primary antibody was conjugated with a fluorophore, the tissues are washed with PBS and incubated with secondary antibody diluted 1:500 in blocking buffer for 2 hours at room temperature in a low-light environment. The tissues are washed with PBS and mounted, vitreous side up on to glass slides, covered with antifading solution, and applied coverslip. Optionally, the tissue can additionally be stained with 4’,6-diamidino-2-phenylindole solution for nuclei visualization. Similar procedure can be followed for retinal tissues harvested from other animals used for toxicological studies like rabbits, dogs, and minipigs.
Quantification
After retinal tissue has been fluorescently labeled, the slides can be scanned, and the images are stored in a central server. The image file can be uploaded to the HALO™ software to quantify the RGCs. The algorithms available in HALO™ platform can be modified and applied on the scanned images to allow quantification of any labeled retinal cell. In the case presented here, the authors used CytoNuclear FL algorithm to identify and quantify individual fluorescently stained RGCs. Examples of RGC IHC and quantification in a normal mouse retina and in an injured mouse retina are shown in Figures 4, 5, and 6.
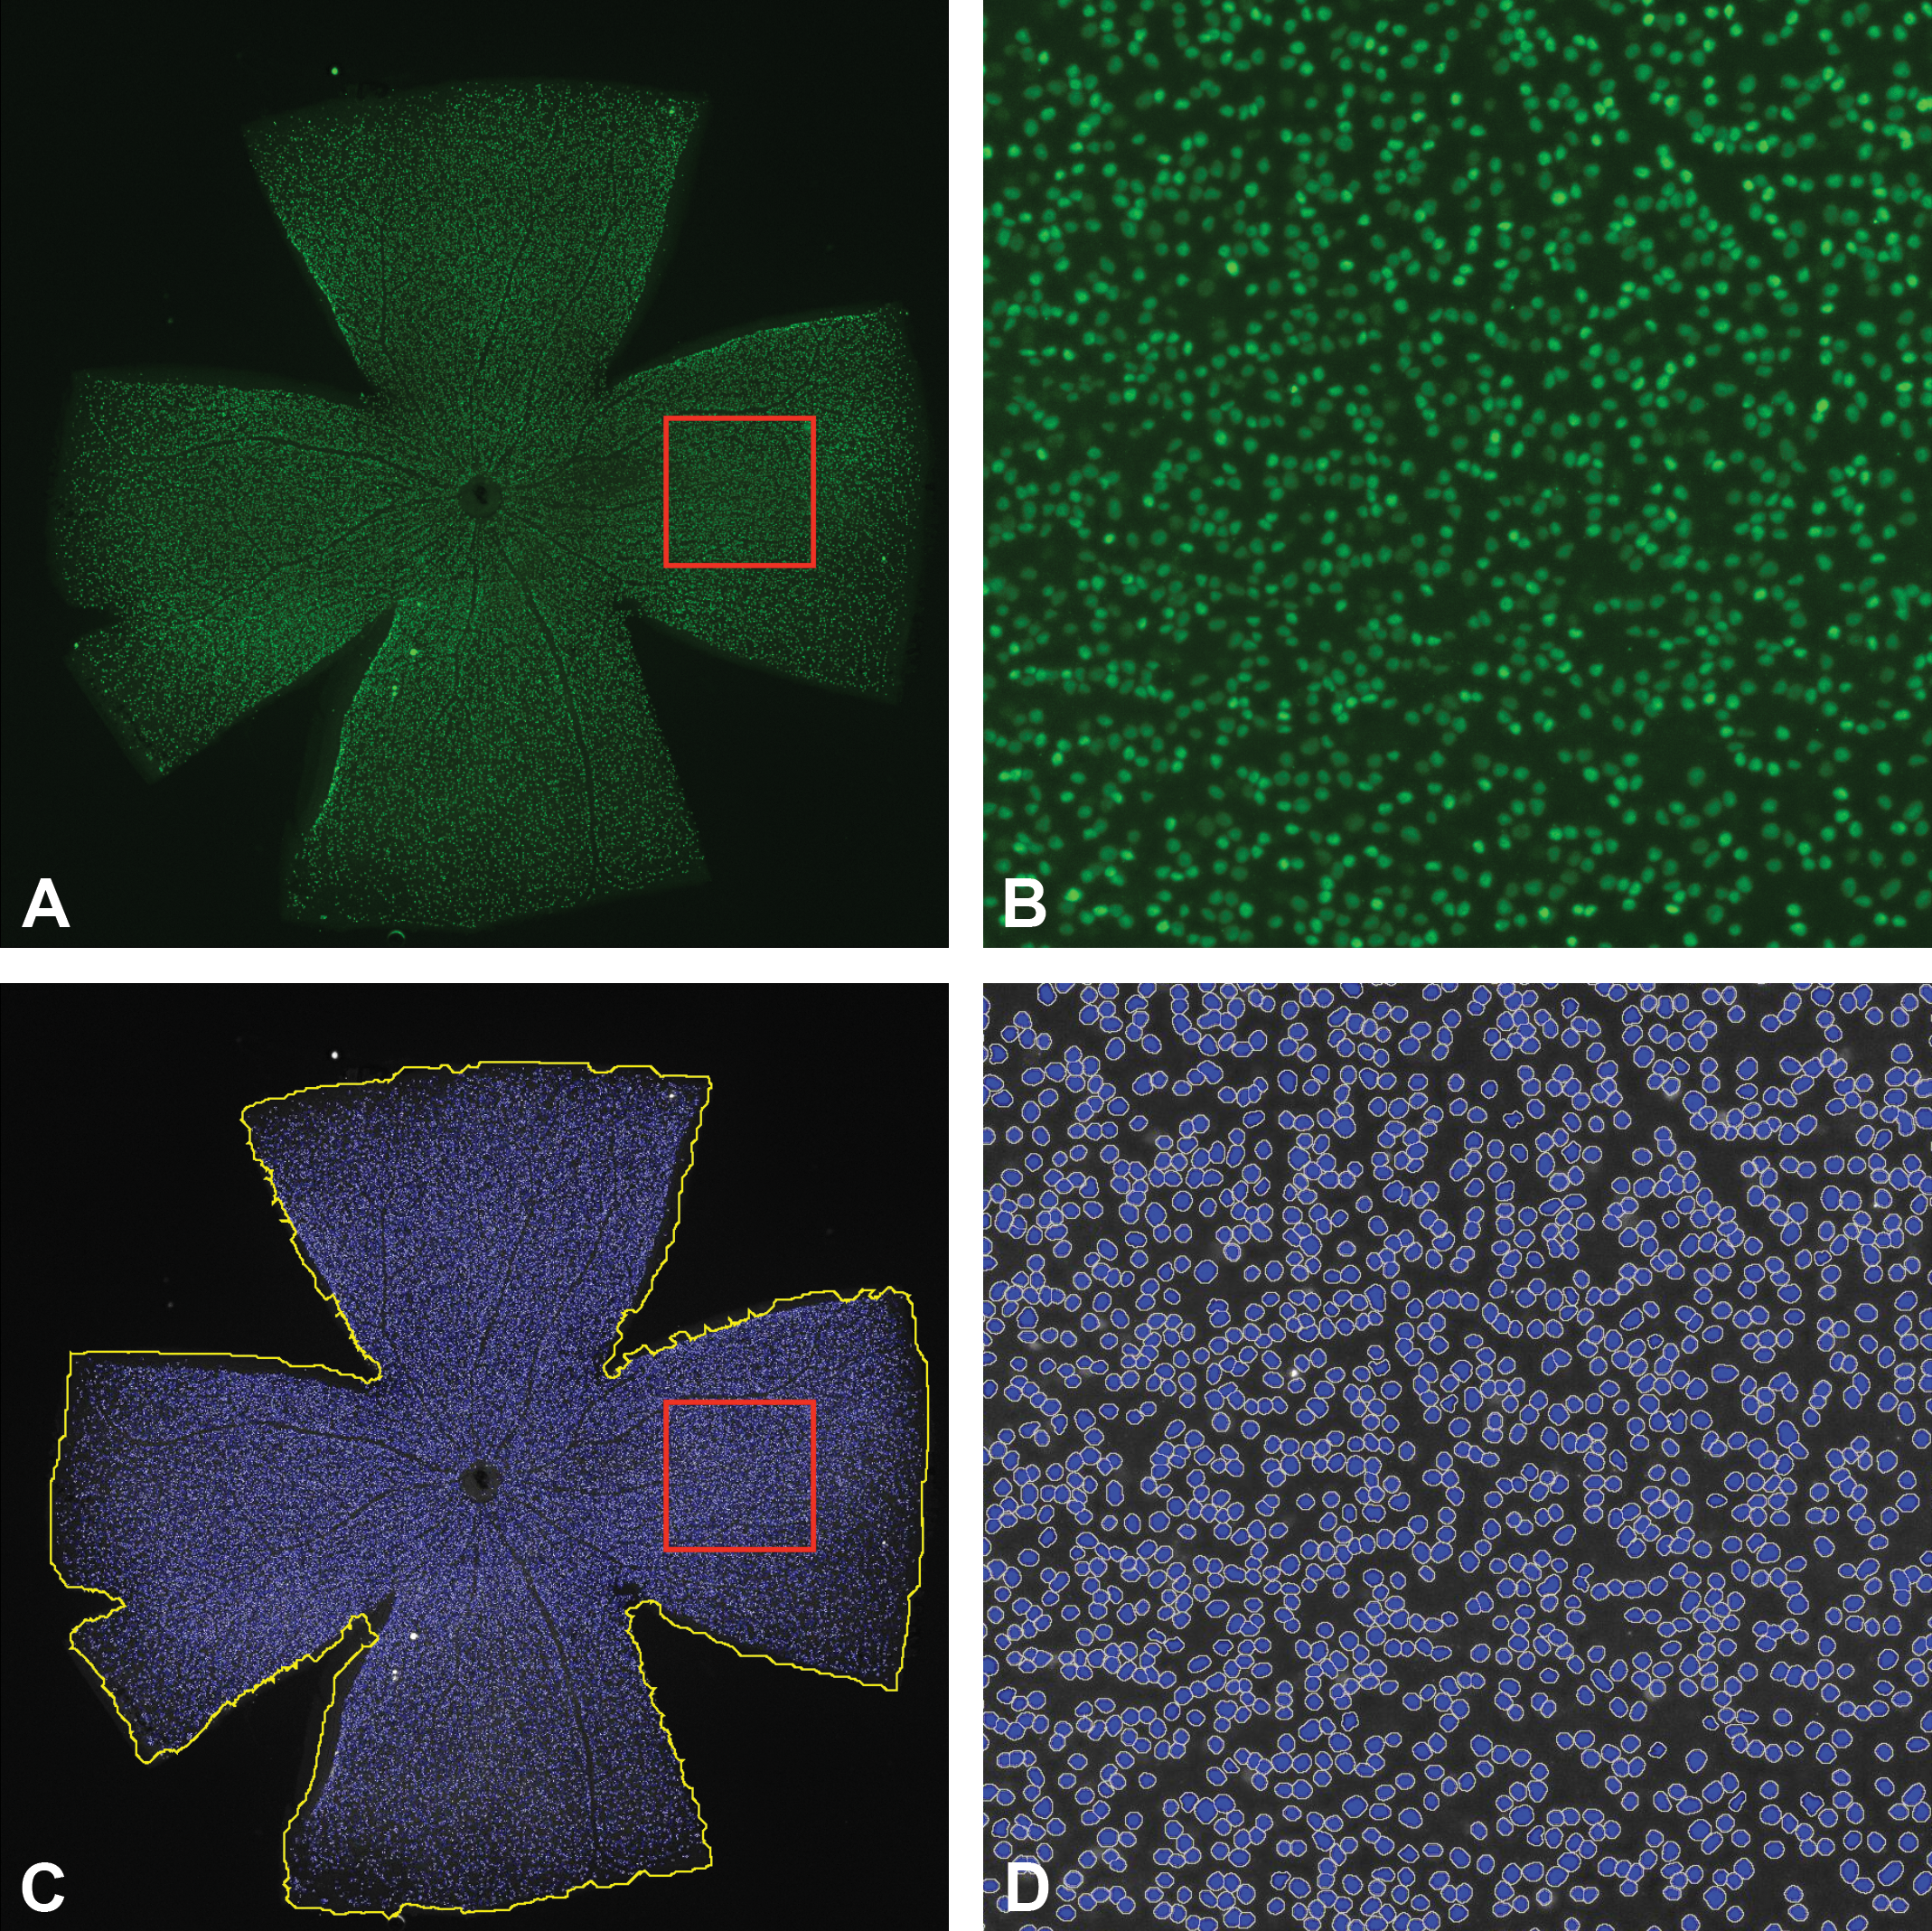
A, Immunofluorescence staining for Brn3a in a whole mount retina (C57BL/6J naive mouse, 3 months old). Brn3a labels retinal ganglion cell nuclei. The red box represents the magnified region shown in image B. The image was constructed into an extended depth of focus image by doing a tile scan with multiple Z-stacks with a Nikon Eclipse Ti microscope using a 10× objective. B, Higher magnification of the area outline in image A. Each green spot represents a Brn3a positive retinal ganglion cell. C, Image of Brn3a positive cells in the whole mount retina. The image was converted into grayscale for cell count analysis. The yellow line represents the annotated outline of the retina. The red box represents the magnified region shown in image D. The blue spots represent the ganglion cells identified by HALO™ software. D, A 10× image Brn3a positive cells in the whole mount retina. The blue spots represent the ganglion cells identified by HALO™ software. Brn indicates brain specific homeobox domain.
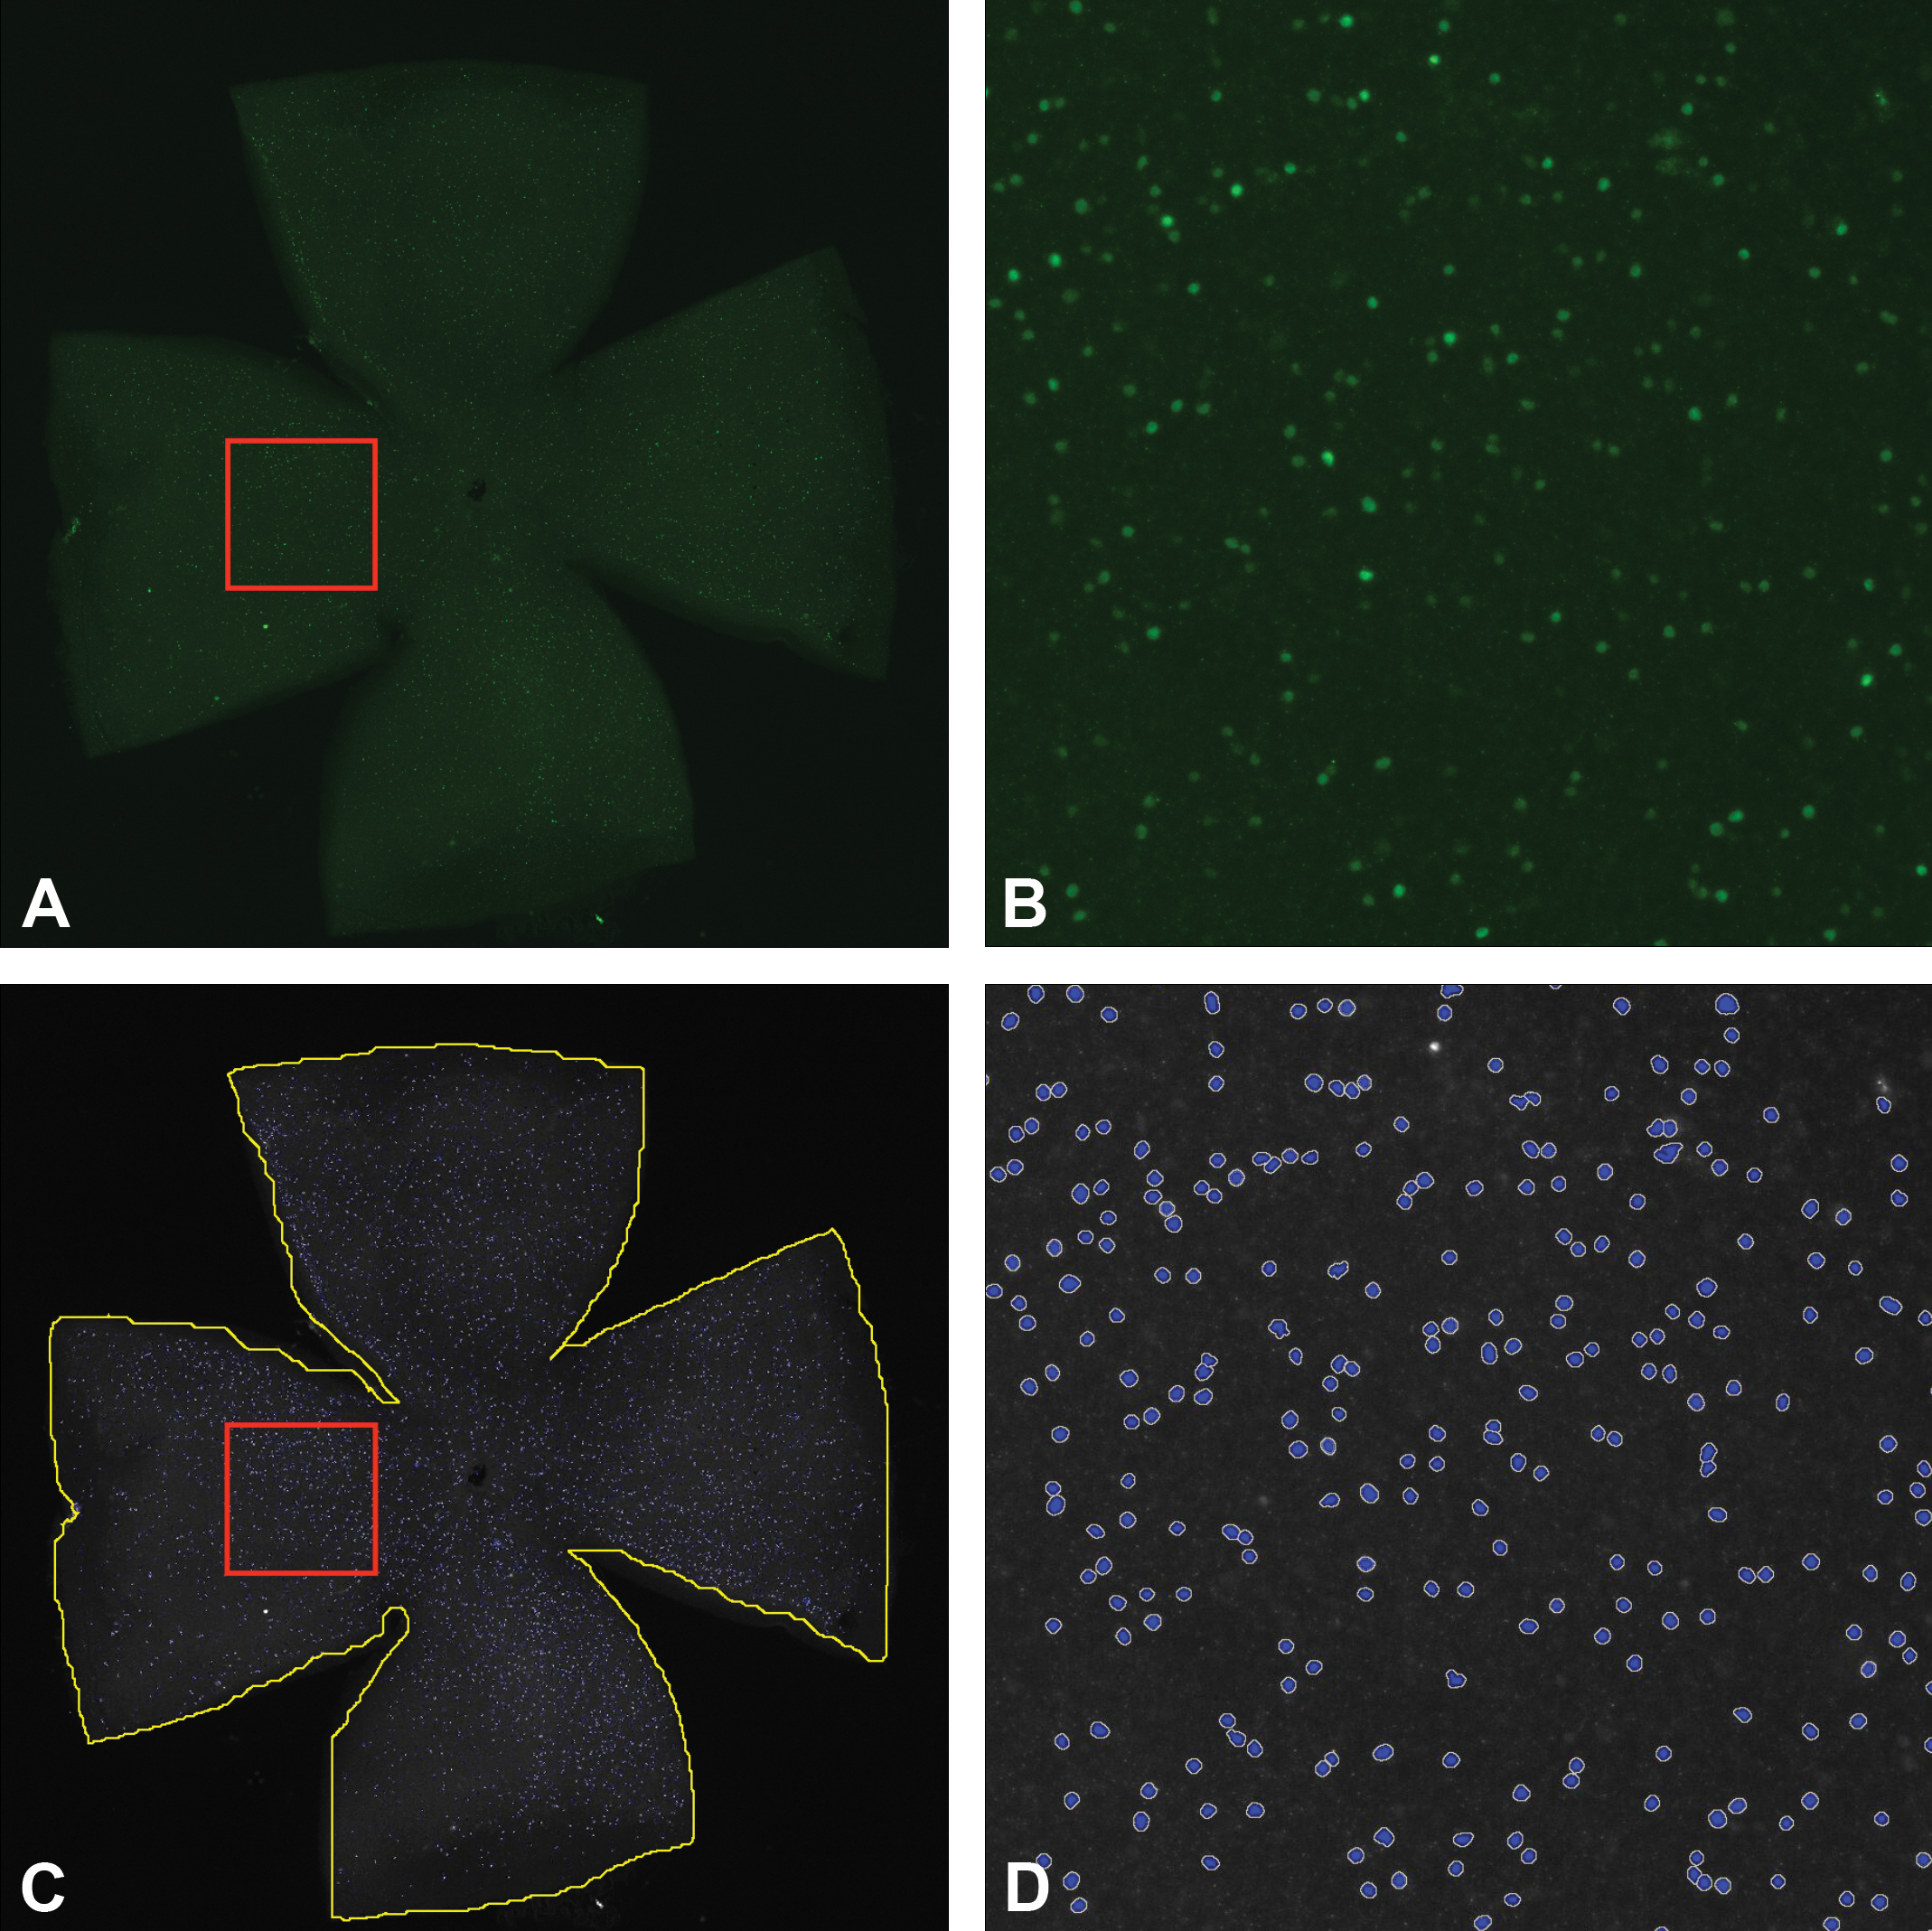
A, Immunofluorescence staining for Brn3a in a whole mount retina (C57BL/6J mouse—3 months old), 2 weeks after optic nerve transection. The red box represents the magnified region shown in image B. The image was constructed into an extended depth of focus image by doing a tile scan with multiple Z-stacks with a Nikon Eclipse Ti microscope using a 10× objective. B, Higher magnification of the area outline in image A, 2 weeks after optic nerve transection. Each green spot represents a Brn3a positive retinal ganglion cell. C, Image of Brn3a positive cells in the whole mount retina 2 weeks after optic nerve transection. The image was converted into grayscale for cell count analysis. The yellow line represents the annotated outline of the retina. The red box represents the magnified region shown in image shown in image D. The blue spots represent the ganglion cells identified by HALO™ software. D, A 10× image Brn3a positive cells in the whole mount retina 2 weeks after optic nerve transection. The blue spots represent the ganglion cells identified by HALO™ software showing decreased number of ganglion cells compared to naive mouse retina shown in D and Figure 6. Brn3a indicates brain specific homeobox domain.
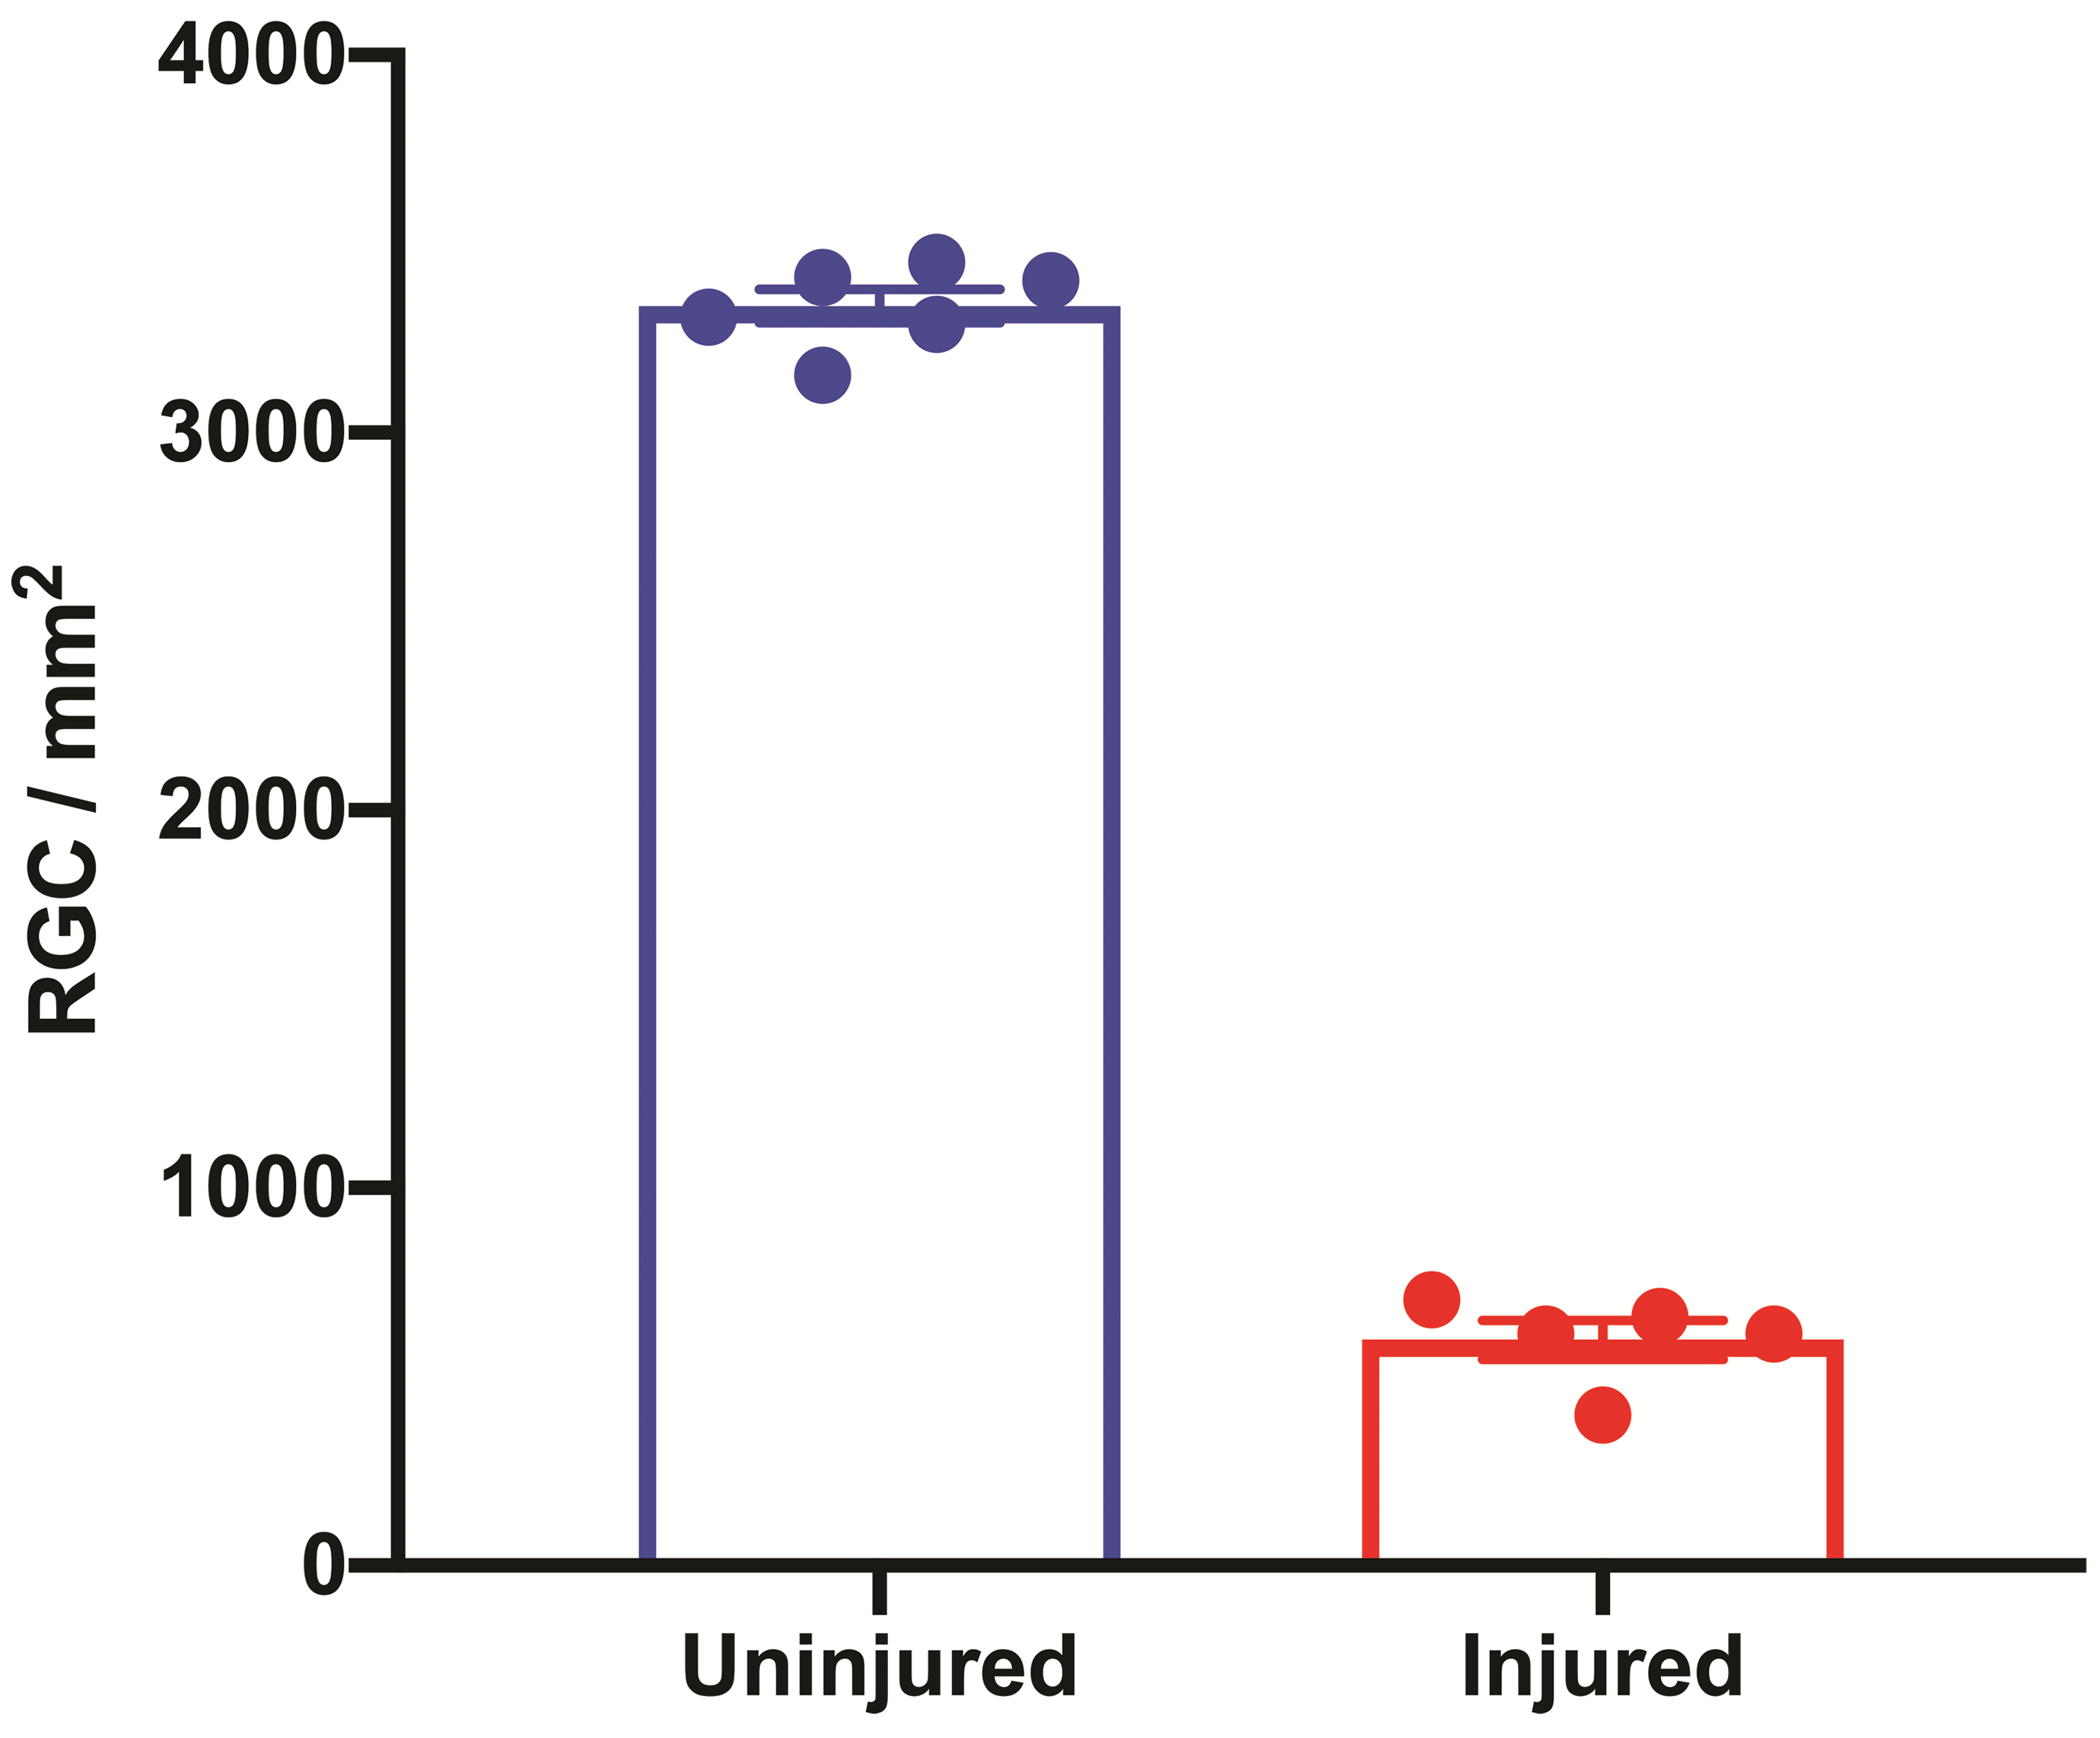
Graphical representation of the retinal ganglion cell density acquired using HALO™ image analysis platform. Uninjured—naive mice with intact optic nerve (n = 6); injured—mice with transected optic nerve (n = 5).
Diseases Affecting the Retinal Cell Numbers
Diseases affecting the retinal cell numbers include various types of PR degeneration, DR, and RGC disease.
Photoreceptor Degeneration
Two of the main retinal diseases that result in loss of PRs are retinitis pigmentosa (RP) and age-related macular degeneration (AMD).
Retinitis Pigmentosa (RP)
Retinitis pigmentosa is a heterogeneous family of inherited retinal diseases associated with over 250 different gene mutations. 105 The early phenotype of RP is difficulty seeing at night and loss of peripheral vision caused by apoptosis of rod PRs. The primary loss of rod PRs is followed by cone dysfunction and eventually complete vision loss. As the rods progressively die, the central visual field is also eventually lost. In the past, fluorescein angiography was the predominant method employed in the clinical diagnosis of RP, but newer, noninvasive modalities like adaptive optics scanning laser ophthalmoscopy enable high-resolution evaluation of the retina to detect PR damage early in the disease. 106 There are numerous mouse mutant models to study PR degeneration. Chang et al have provided a detailed review of those models. 107
Macular Degeneration (MD)
Macular degeneration (MD) is one of the important causes of blindness in the developed world. 108 It is projected that 288 million people may have some form of AMD by 2040. 109 Macular degeneration affects both rod and cone PRs but is limited to the macula. Macular degeneration can be early onset or late onset. Early onset maculopathies are hereditary and are generally monogenic, whereas AMD is a complex multifactorial disease with multiple genetic and environmental risk factors. Age-related macular degeneration can progress to a “dry,” non-neovascular form leading to geographic atrophy of the RPE, choriocapillaris, and PRs, or to a more rapid “wet” exudative form. This is also referred as choroidal neovascularization, this is the most visually threatening form, characterized by ingrowth of choroidal vasculature into the macula accompanied by increased vascular permeability. 109,110 The fundamental cause of vision loss in AMD is progressive damage of PRs, which can be triggered by RPE dysfunction and atrophy. 111 Models of AMD have been created in mice, rats, rabbits, pigs, and nonhuman primates. A comprehensive overview of the models for AMD is reviewed by Pennesi et al, 110 and Zeiss. 13
One widely used model utilizes systemic delivery of sodium iodate (SI, NaIO3) to provide similar morphology and loss of cells reflected in diseased retina. Sodium iodate is an oxidizing agent that induces toxic damage to the RPE, then subsequently the PRs, however the exact mechanism of toxicity remains to be fully characterized. Dosing can range from 20 to 50 mg/kg in rodents, depending on route of administration and strain. Morphological changes can be seen 3 days later. 112,113 After progression of damage, there are different end points that can be measured using optical coherence tomography (OCT), electroretinography, and optokinetic tracking. Histology and immunofluorescence of the PRs and RPE can be carried out with peanut agglutinin and phalloidin to visualize the area of damage and allow quantification of cones.
Diabetic Retinopathy (DR)
Diabetic retinopathy is a leading cause of vision loss with over 7 million affected people in the United States and the number of individuals who develop this retinal complication is expected to increase to 14 million Americans by 2050. 114 Although DR has been described historically as a microvascular disease, findings in the last 15 years have shown unequivocally that DR affects retinal PRs, amacrine cells, and RGCs. 115 A spontaneous model of type I diabetes in Ins2A-kita diabetic mice has been reported to show cone PR loss after just 3 months of diabetes. The db/db mouse, a model for type II diabetes, showed thinning of inner and outer segments of PR layers, with defects in RPE over 8 to 24 weeks of diabetes. A complete review of animal models of DR is covered by Olivares et al. 116
Retinal Ganglion Cell Disease
Glaucoma and anterior ischemic optic neuropathy (AION) are 2 of the main diseases of RGCs, 115 and knowledge of these diseases has greatly benefitted from the advancements in retinal cell quantification modalities. In these diseases, the PRs may be healthy but visual information is not transmitted to the midbrain due to loss of RGCs.
Glaucoma
Glaucoma is the third leading cause of blindness in the United States 109 and one of the leading causes of blindness worldwide. By the year 2040, it is projected there will be approximately 112 million affected individuals worldwide. 117 The most common type of glaucoma is primary open-angle glaucoma, defined by a normal, open anterior chamber angle but a high intraocular pressure (IOP) with no underlying disease. The ocular hypertension is caused by an improper outflow of aqueous humor.
Animal models of glaucoma include complete optic nerve transection, optic nerve crush, inherited models such as DBA/2J, 118 laser photocoagulation, microbead occlusion, and episcleral vein occlusion. In complete optic nerve transection model, RGCs undergo apoptosis rapidly and 2 weeks posttransection injury, almost 90% of RGCs are lost. 119,120 Laser photocoagulation of the trabecular meshwork can induce increase in the IOP. In rhesus monkey, normal IOP ranging from 10 to 15 mm Hg can be increased to greater than 50 mm Hg, sustained over months. 121,122 Microbead occlusion models inject microbeads in the anterior chamber to block outflow. Elevation of IOP in mice and rats can be induced over 25 mm Hg for a few weeks. 123,124 After 30 days, both RGC and axon loss can be observed. The episcleral veins are an integral part of the aqueous outflow pathway and drain fluid from Schlemm canal. Episcleral vein occlusion models include cauterizing or ligating the veins to prevent proper circulation and increase IOP. In rats, cauterizing 4 episcleral veins can cause IOP to increase up to 60 mm Hg over 1 week. 125
Anterior Ischemic Optic Neuropathy
There are 2 forms of AION. Arteritic AION is an acute, often painful optic neuropathy that occurs predominantly in patients older than 55 years and affects women 3 times more often than men. 126 Arteritic AION is caused by inflammation and subsequent thrombosis of short posterior ciliary arteries resulting in infarction of the optic nerve head. 127 The more common form of AION is non-arteritic AION (NAION), affecting 6000 people per year 128 in the United States alone. In addition, there is ∼15% risk that the fellow eye will be affected within 5 years after the original insult. 129 The pathogenesis of NAION is significant hypoperfusion of the posterior ciliary artery leading to ischemia of the optic nerve head 130 and resulting in axonal and ganglion cell loss. 131 A rodent model of NAION has been developed employing focal laser application to cause capillary damage and leakage with reproduction of most features of the human NAION like optic nerve edema, loss of ganglion cells, and atrophy of optic nerve. 132 A similar method of embolism has also been utilized to develop a primate model of NAION. 133
Conclusions
Advancements in the understanding of ocular diseases have resulted in the recognition that distinct cells of the retina are affected or lost in diverse disease processes. Identification of retinal cells and application of cell-specific imaging are of utmost importance in unraveling disease progression and the discovery of a therapeutic intervention. Several well-characterized markers are now available to detect RPE, PRs, HCs, bipolar cells, amacrine cells, RGCs, and Müller cells. They have been utilized extensively not only for imaging and identifying these cells but also as an indispensable tool to quantify the retinal cells using various automated digital image analysis platforms. Although in vivo retinal imaging techniques have grown rapidly and variations of fundus imaging and OCT have been the mainstay for clinical care and management of patients with retinal and systemic diseases, 108 digital image analysis of digitized tissue slides can extract more information on the cell area, cell number, and also other attributes of a tissue, 134 providing valuable information on the retinal disease progression and pathogenesis. There are several potential pitfalls to using digital image analysis for retinal cell quantification, including capital investment for slide scanners, digital image analysis platform, sizeable servers to store the images, a dedicated IT support team, and the acceptance of quantification algorithms by the wider scientific audience. Despite these shortcomings, the authors strongly believe that digital image analysis to quantify retinal cells in fluorescent labeled retinal flat mounts and/or immunohistochemically labeled histological sections has witnessed brisk innovations in the recent past and is expected to have a rapid progression in the future as well. Widespread implementation of this technology will result in accurately quantified data on retinal cell changes.
Footnotes
Authors’ Note
The analyses, conclusions, and opinions expressed in this article are solely those of the authors. All authors participated in the discussions involved with formulation and organization of this article. All procedures used to prepare macroscopic and microscopic images of animal specimens for this article were performed in accordance with regulations and established guidelines for humane treatment of research animals and were reviewed and approved in advance by an Institutional Animal Care and Use Committee.
Declaration of Conflicting Interests
The author(s) declared no potential, real, or perceived conflicts of interest with respect to the research, authorship, and/or publication of this article.
Funding
The author(s) received no financial support for the research, authorship, and/or publication of this article.