
Abstract
In order to automate the counting of ovarian follicles required in multigeneration reproductive studies performed in the rat according to Organization for Economic Co-operation and Development guidelines 443 and 416, the application of deep neural networks was tested. The manual evaluation of the differential ovarian follicle count is a tedious and time-consuming task that requires highly trained personnel. In this regard, deep learning outputs provide overlay pictures for a more detailed documentation, together with an increased reproducibility of the counts. To facilitate the planned good laboratory practice (GLP) validation a workflow was set up using MLFlow to make all steps from generating of scans, training of the neural network, uploading of study images to the neural network, generation and storage of the results in a compliant manner controllable and reproducible. PyTorch was used as main framework to build the Faster region-based convolutional neural network for the training. We compared the performances of different depths of ResNet models with specific regard to the sensitivity, specificity, accuracy of the models. In this paper, we describe all steps from data labeling, training of networks, and the performance metrics chosen to evaluate different network architectures. We also make recommendation on steps, which should be taken into consideration when GLP validation is aimed for.
Keywords
Introduction
For the registration and marketing of new chemicals, regulatory toxicology studies are performed according to the Organization for Economic Co-operation and Development guidelines 443 and 416 to assess potential toxic effects on reproduction. The quantification of primary and growing ovarian follicles on serial sections of the ovaries of the offspring (F1) generation is required in both. This is a highly time-consuming task which has so far been performed at the microscope by highly trained personnel. At BASF SE, we have tried to facilitate and automate this assay by immunostaining with proliferating cell nuclear antigen (PCNA) 1 but found that very early primordial follicles were not stained by PCNA and therefore missed. We also tried staining with Cyp1B1, 2,3 but after questioning the author, they admitted that this staining was not consistent. The last approach was staining with mouse vasa homologue 4 which worked well initially, but the antibody is specific for human testicular tumors as well and was later optimized for that application as the staining performance of this antibody declined in the last couple of years for our ovarian task. The staining was supposed to facilitate detection of the follicles for classical image analysis solutions. However, as we have an internally defined criterion involving layers of granulosa cells in our differential ovarian follicle count (DOFC) standard operating procedure (SOP), this approach failed. The classical solutions could detect the oocyte but were not able to correctly identify the number of granulosa cell layers around the oocyte. By automating this analysis on hematoxylin and eosin stained slides, we aim to eliminate error-prone immunohistochemistry, improve turnover time, enable documentation of results by saving the computer-generated overlays of the evaluation and reduce observer bias.
In recent years, it has been proven that deep learning techniques in the field of digital pathology in both human 5 and veterinary 6 medicine have the potential to solve tasks which could not be automated with classical methods of image analysis. These techniques are increasingly being used in many different contexts to help the routine work, 7 but their applications in GLP settings are still lagging.
Among the neural network structures suitable for both object detection and classification, the Faster region-based convolutional neural network (Faster R-CNN) is a well-established architecture and after initial trials with other architectures like “You Only Look Once” and RetinaNet, Faster R-CNN was chosen for this study. 8 The Faster R-CNN architecture is available as a standard solution within Torchvision PyTorch and was therefore deemed to be more suitable in a production setting. The Faster R-CNN architecture belongs to the so called “two stage detectors” family, where a region proposal network (RPN) is coupled with Fast R-CNN. The RPN is responsible for finding the location of the objects in the image, while the Fast R-CNN allows the classification of those objects. The Fast R-CNN is composed of a backbone of a CNN, a region of interest pooling layer and fully connected layers followed by 2 branches for classification and bounding box regression. 8,9
This paper describes the work in progress to establish a workflow for automated analysis of the DOFC using deep learning and validate this method according to GLP principles.
Materials and Methods
Images
Whole slide images (WSI) were generated by scanning hematoxylin and eosin–stained serial sections of the ovaries of control groups of 2 generation studies performed in rats under GLP at the test facility BASF SE (in total, 7589 DOFC slides were scanned). Of total, 725 WSI were used corresponding to serial sections of 34 animals. As there were 2 ovarian sections per slide, this resulted in 1450 images of ovaries. Serial sections were taken with a spacing of 50 µm throughout the whole ovaries, from these sections, every third section was taken for analysis.
Image Acquisitions and Labeling
Whole slide images were taken with the Hamamatsu NanoZoomer 2.0 with an objective of 20× magnification resulting in a final 200× magnification with a resolution of 0.46 μm/pixel. The native format of the scanner is .ndpi, which is a pyramidal compressed format that cannot easily be read by other programs, for example, for labeling. Therefore, a script using Bio-Formats 10 (https://imagej.net/Bio-Formats) running on Fiji 11 (Version 1.52c, https://imagej.nih.gov/ij/) was created in order to convert the images to .tiff files with the highest resolution available. After conversion, images were labeled on Fiji. The label output was a text file with class name and object coordinates to be converted as COCO annotations (a term coined by Microsoft: “common objects in context”). Each single object (in total, ca 13,682 structures) was labeled by one member of a team comprised of 2 pathologists and 2 technicians who routinely perform evaluation of the DOFC, afterward each label was reviewed by 2 members of this team (1 pathologist and 1 technician) to increase the reliability of the ground truth. The number of labeled target structures were 4958 for primordial follicle 1, 2281 for primordial follicle 2, and 805 for growing follicle. Per ovarian section, between 0 and 30 primordial follicles and up to 10 growing follicles can be found. This varies greatly from section to section.
The annotated classes/structures were exported using a modified version of Alp’s Labeling Tool (an ImageJ plugin available from https://alpslabel.wordpress.com/). The coordinates of each labeled structure per image file were exported as text file (*.txt). These coordinates were then converted to XTML files to be used to train the algorithm. Target structures were labeled using Fiji is just ImageJ (Fiji) and in-house developed scripts.
Our prediction script that applies the trained model to novel data creates the prediction output in the same text format that Alp’s Labeling Tool is using for manually created data. This opens the possibility to perform predictive labeling, by generating new labels, that could then be reviewed and if needed corrected within the labeling tool. In this study, this possibility was not used though, as the prediction tool was developed after the complete set of training data was labeled.
The classification criteria for the labeling of primordial and growing follicles were based on Pedersen 12 and adapted for the rat in internal SOPs of the test facility BASF SE. The target classes were defined as follows: primordial follicle 1: a visible oocyte surrounded by flat pregranulosa cells; primordial follicle 2: a visible oocyte surrounded by 1 layer of round granulosa cells; growing follicle: a visible oocyte surrounded by granulosa cells in 2 to 5 layers uninterrupted by a clear antrum (the slight rim around the oocyte is considered a normal structure as are slight separations of the granulosa cells, 5 layers were chosen as an internal convention for classification) Figure 1. Further classes were labeled as well (which are not counted during the “real” evaluation of this assay), which proved to be the most common structures which a human observer may confuse with the target structures. These were the 2 classes of primordial follicles and growing follicle without visible oocyte in the center, a follicle surrounded by more than 5 layers of granulosa cells, small vessels, and glands. These “nontarget” structures commonly cause problems for pathologists and technicians attempting to perform DOFC and must be taken into account during their training. Therefore, these additional structures were initially included in the development of the algorithm to find out whether it would improve the accuracy of detection of the target structures.
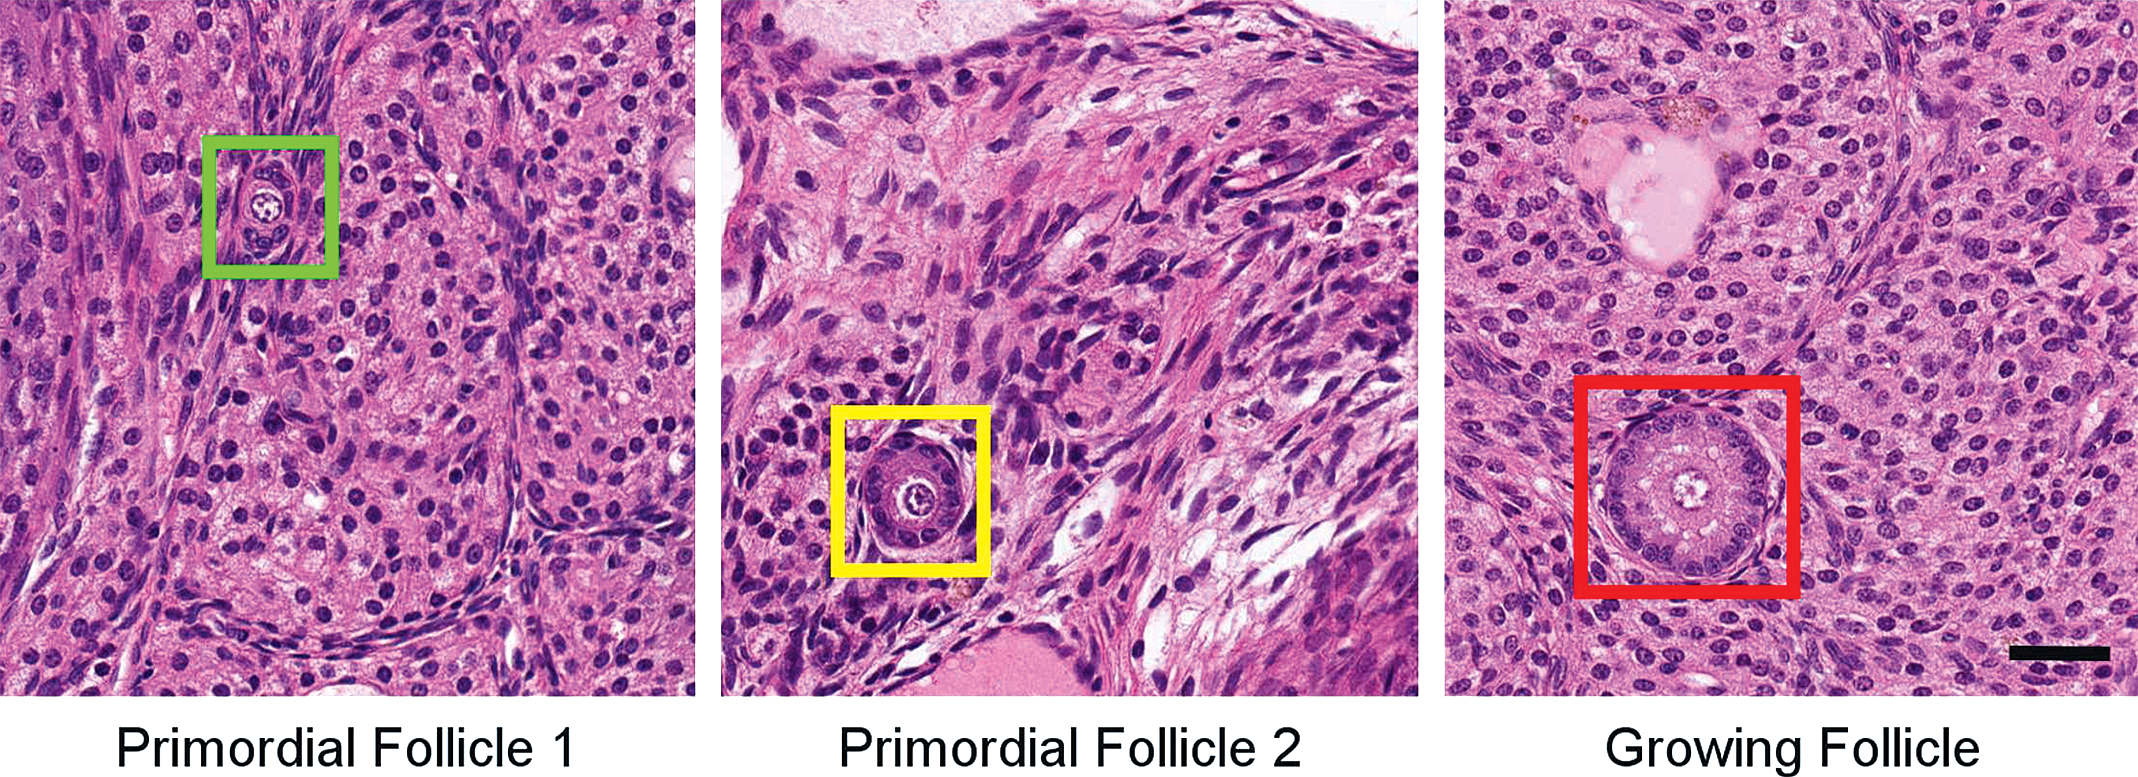
Example pictures of labeled structures. Images taken at 20× original magnification. Scale bar: 25 μm.
Deep Learning/Machine Learning Lifecycle Management
MLflow (https://www.mlflow.org/) is an open source platform for Machine Learning lifecycle management. It is composed of 4 components: Tracking, Projects, Models, Model Registry. In this project, we used the Tracking component to track the parameters used for the model training, including input data, model tuning parameters, and the accuracy metrics from the validation data set as well. Also, the connection to the exact code version is established and tracked by the connection of MLflow with our git-based source code repository. In addition, we also used the projects component to format the data processing code as well as the model training code in a reusable and reproducible way.
Splitting Training and Validation Data Sets
Training and validation sets were created out of the available labeled data. The training data were used to train the algorithm, and the validation set showed the performance of the algorithm during training. The test set will be comprised of data the computer has not seen before from the available scanned slides and will give an estimation of the performance on “real world” data.
The raw image from the scanner has a height and width over 10,000 pixels. Due to the big shape of the image and graphics processing unit (GPU) compute and memory limits, the raw images must be tiled, and corresponding object coordinate must be adjusted. The labeled images were split into training and validation sets with a corresponding ratio of 80 and 20 percent. The test set from the remaining scanned images will be used at a later stage when GLP validation will be performed. The tiling process uses a sliding window 13 with an overlap of 256 pixels, which serves as an additional data augmentation. Tiles without labels and objects were ignored. The scanned images of the single ovaries were too big to be fed into the neural network without downscaling. This led to the total amount of about 17,000 tiles used in total for training and the validation phases.
Training
The training was done using the Torchvision library (a PyTorch-based library for computer vision), with their Faster R-CNN architecture. Different backbones can be utilized within the detection network, namely: VGG-19 with batch normalization, 14 ResNet-18, 15 ResNet-34, 15 and ResNet-50. 15
The training was done using 3 classes: growing follicle, primordial follicle 1, and primordial follicle 2. The same sets of backbones were also trained using 2 classes, that is, combining primordial follicle 1 and primordial follicle 2 in a single class called primordial follicle. An accuracy of >90% was aimed at for all classes.
In order to get the best possible performance from the algorithm from the images provided, data augmentation techniques were used. Particularly, beside the overlap of the tiles used, also the function “ColorJitter” of the torchvision library was used to improve the robustness of the algorithm while training. This function randomly changed the brightness, contrast, and saturation of an image, thus allowing the recognition of the different structures even in case of slight modifications of the tissue staining to make it more robust against possible later variations in hematoxylin and eosin staining.
As it was unclear, whether only the target structures should be labeled, or also other nontarget structures with similar appearance, the labeling was performed with a larger set of classes, and a comparative training was performed, to access, whether labeling nontarget structures improves accuracy on the target structure. Similarly, also different amounts of training data and the resulting validation performance were compared. The results of these studies are outlined in the Results section.
Hardware for Training
The amount of training data is about 500 GB. To facilitate multiple trainings in quick succession, and to allow the project partners to work on a shared server and storage environment, the BASF supercomputer “Quriosity” was used to store and process the files. For processing, usually 1 GPU node was used, but for the comparative studies, up to 8 GPU compute nodes were used in parallel. The validity of the training data, for example, the complete upload and download, and copying of data were ensured by comparing MD5 checksums of the files and of the directory listings before starting the training script.
Evaluation
As Faster R-CNN from the RPN may detect the same object multiple times, with slight offsets, overlapping objects were filtered out by non-maximum suppression 16 with a threshold of 0.5.
The evaluation of the performances was done on the validation data set. The parameters evaluated were accuracy and recall from the confusion matrix and mean Average Precision (mAP). 17 These values were the performances of the model on the validation data set after training. Besides these numeric results, a visualization of the prediction in form of an overlay of the detected bounding boxes and class names is created for visual inspection.
Guided Backpropagation and Grad-Cam
To gain insight into the inner workings of the deep learning models, when classifying the detected objects, a pure ResNet-50 classification network was trained with the same image set as the object recognition with 3 classes. In a preprocessing, the labeled object regions were cut out of the image. These extracted rectangular image regions were used as classification training data set. This model was then used for Guided Backpropagation 18 and Grad-Cam 19 to show which structures can be recognized by a CNN on a DOFC data set.
Results
Initial training runs were done to find out if training on all 9 labeled classes or only on the 3 target classes (growing follicle, primordial follicle 1, and primordial follicle 2) gave the most accurate training results for the target classes. In addition, it was analyzed if more shallow or deeper networks were performing better and how the amount of training data influences the validation accuracy.
The following diagram in Figure 2 shows the per-class average precision (y-axis) for the 3 target classes after 50 epochs training a Retina-Net object detection model with a ResNet-18 backbone. It is clear that including nontarget classes in the training (left 3 bars) is not beneficial.
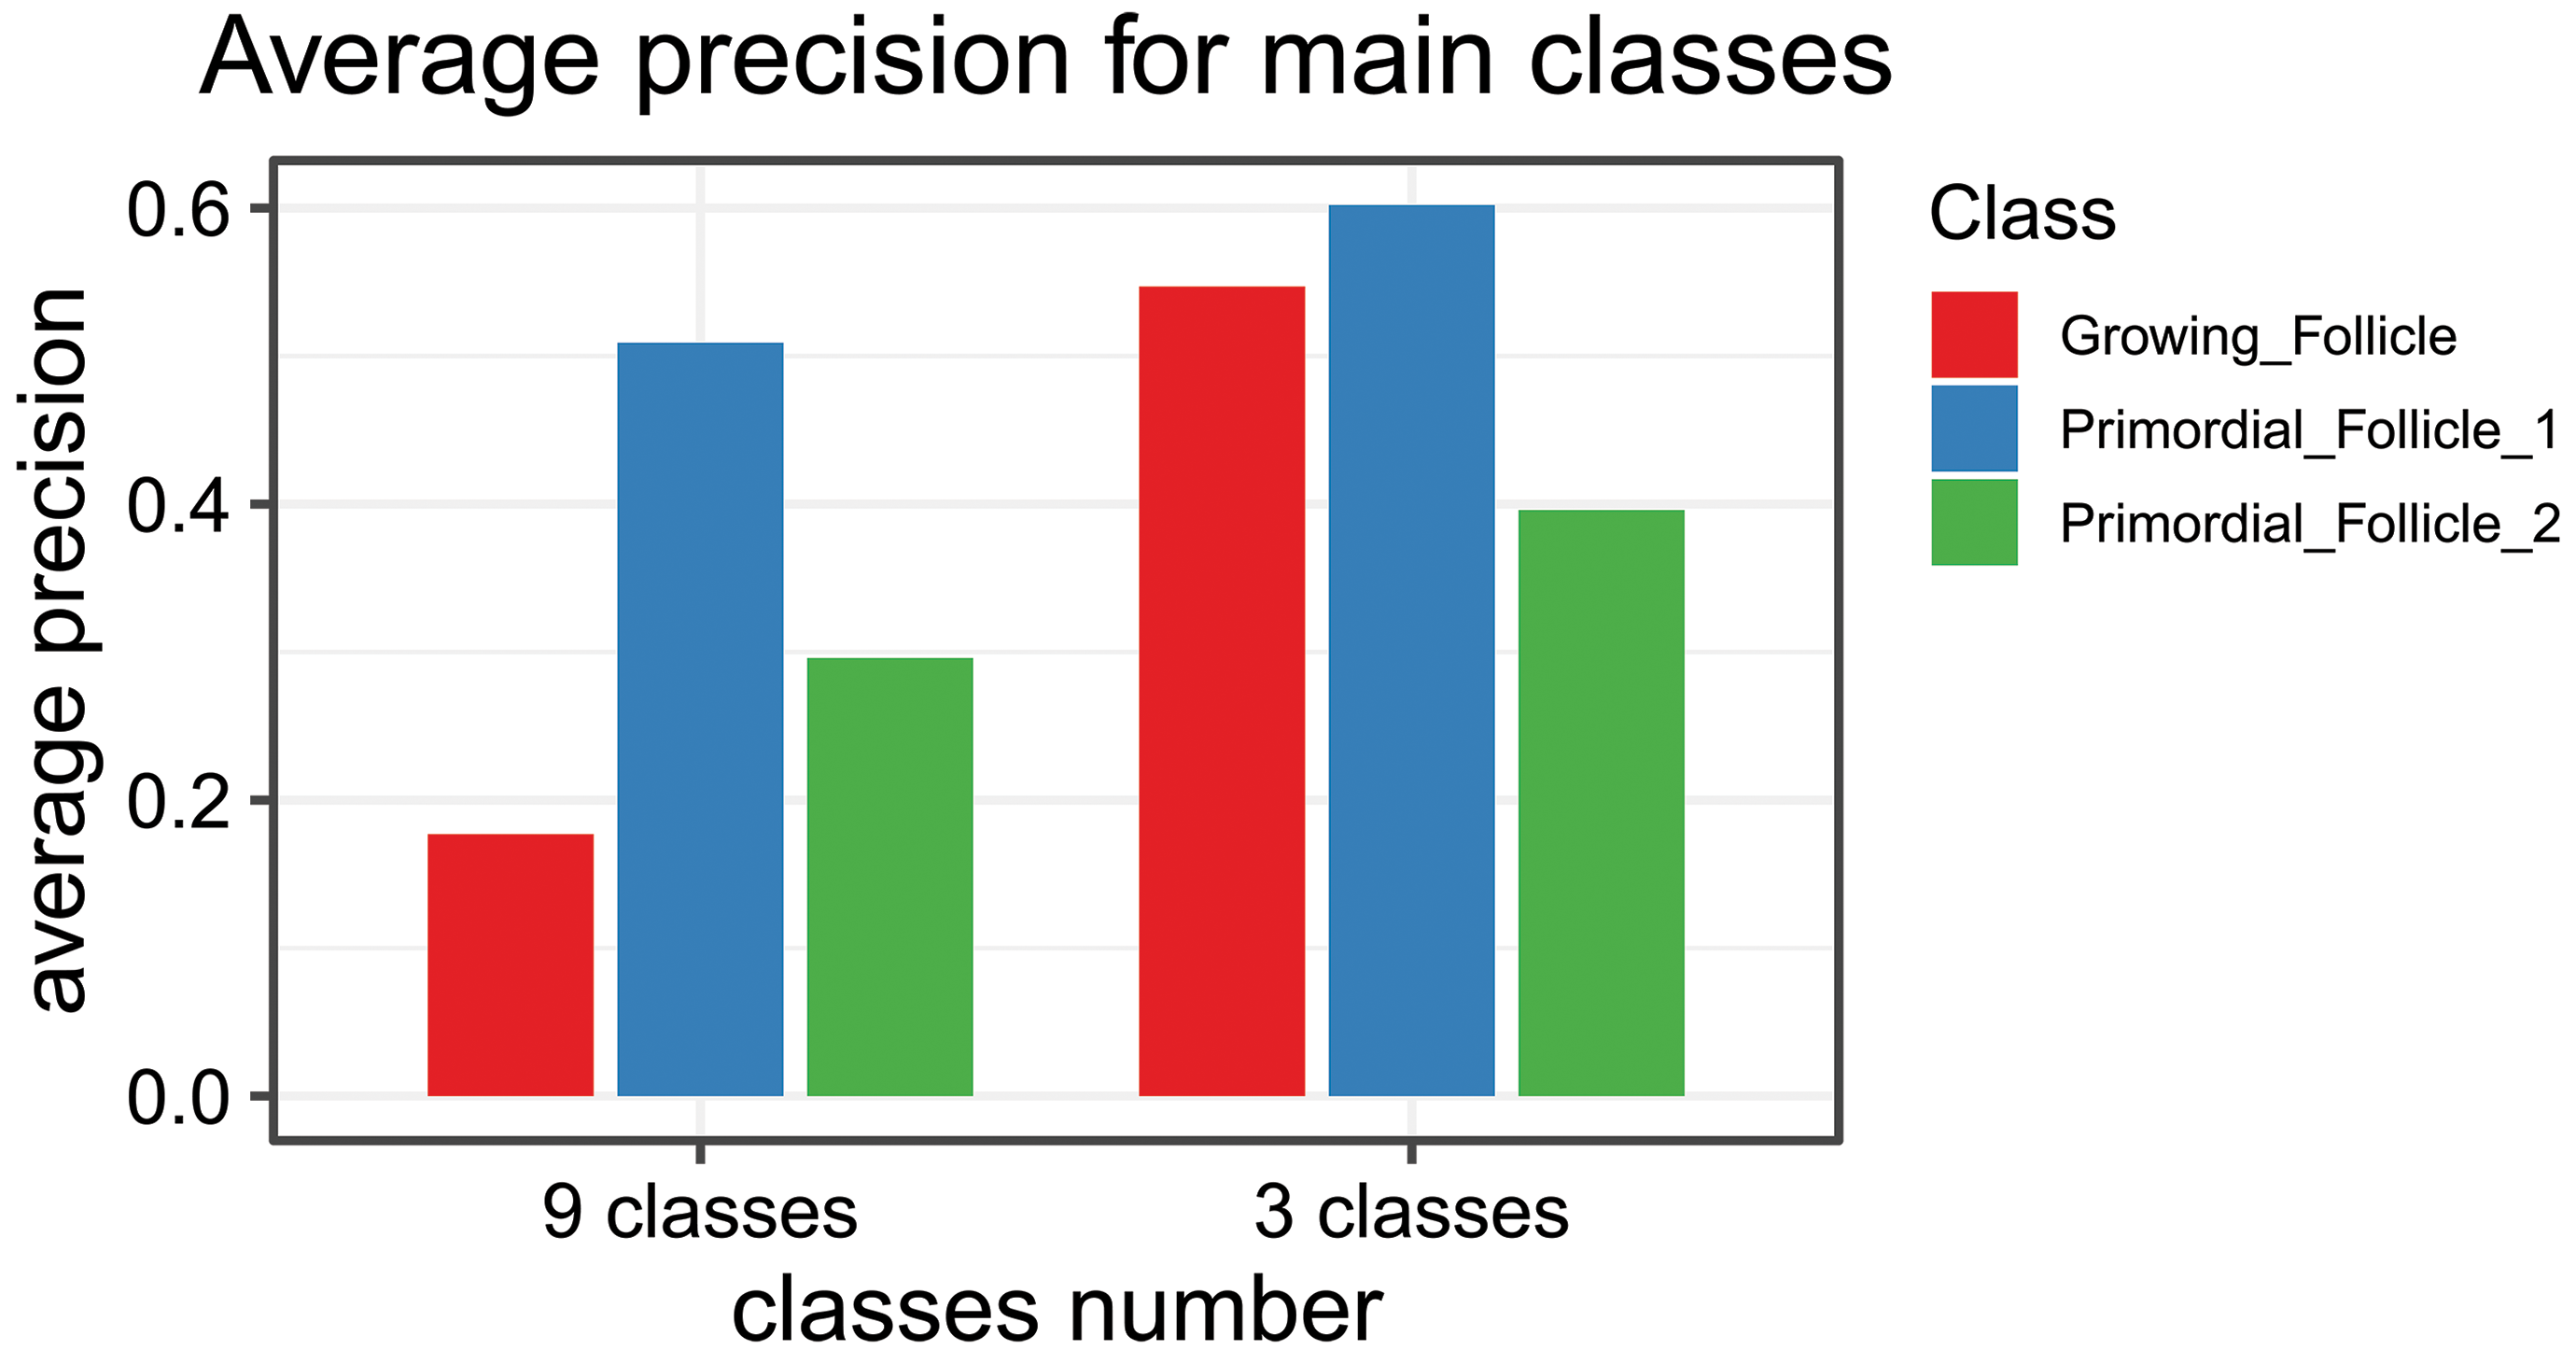
Graph of the average precision per-class (y-axis) for the 3 target classes after 50 epochs training a Retina-Net object detection model with an ResNet-18 backbone. The network was trained with 9 classes that included confounding factors for human evaluators or with 3 classes that are the classes needed for the assessment.
In a second comparison of performance (Figure 3), the validation loss (y-axis) while training for 50 epochs (x-axis) has been analyzed. For the 4 compared backbones (ResNet-18 to ResNet-152), we found that with larger model complexity (more ResNet-blocks are chained after each other in the model) the loss decreases. The difference between ResNet-101 and ResNet-152 is quite small. Depending on compute capabilities, training batch size, size of image tiles, using the larger model classes is sometimes not possible. The ResNet-152 training was performed on a workstation with an Nvidia Quadro M6000 GPU with 24 GB GPU memory; therefore, batch size and tile size could be kept as for the smaller models in this comparison.
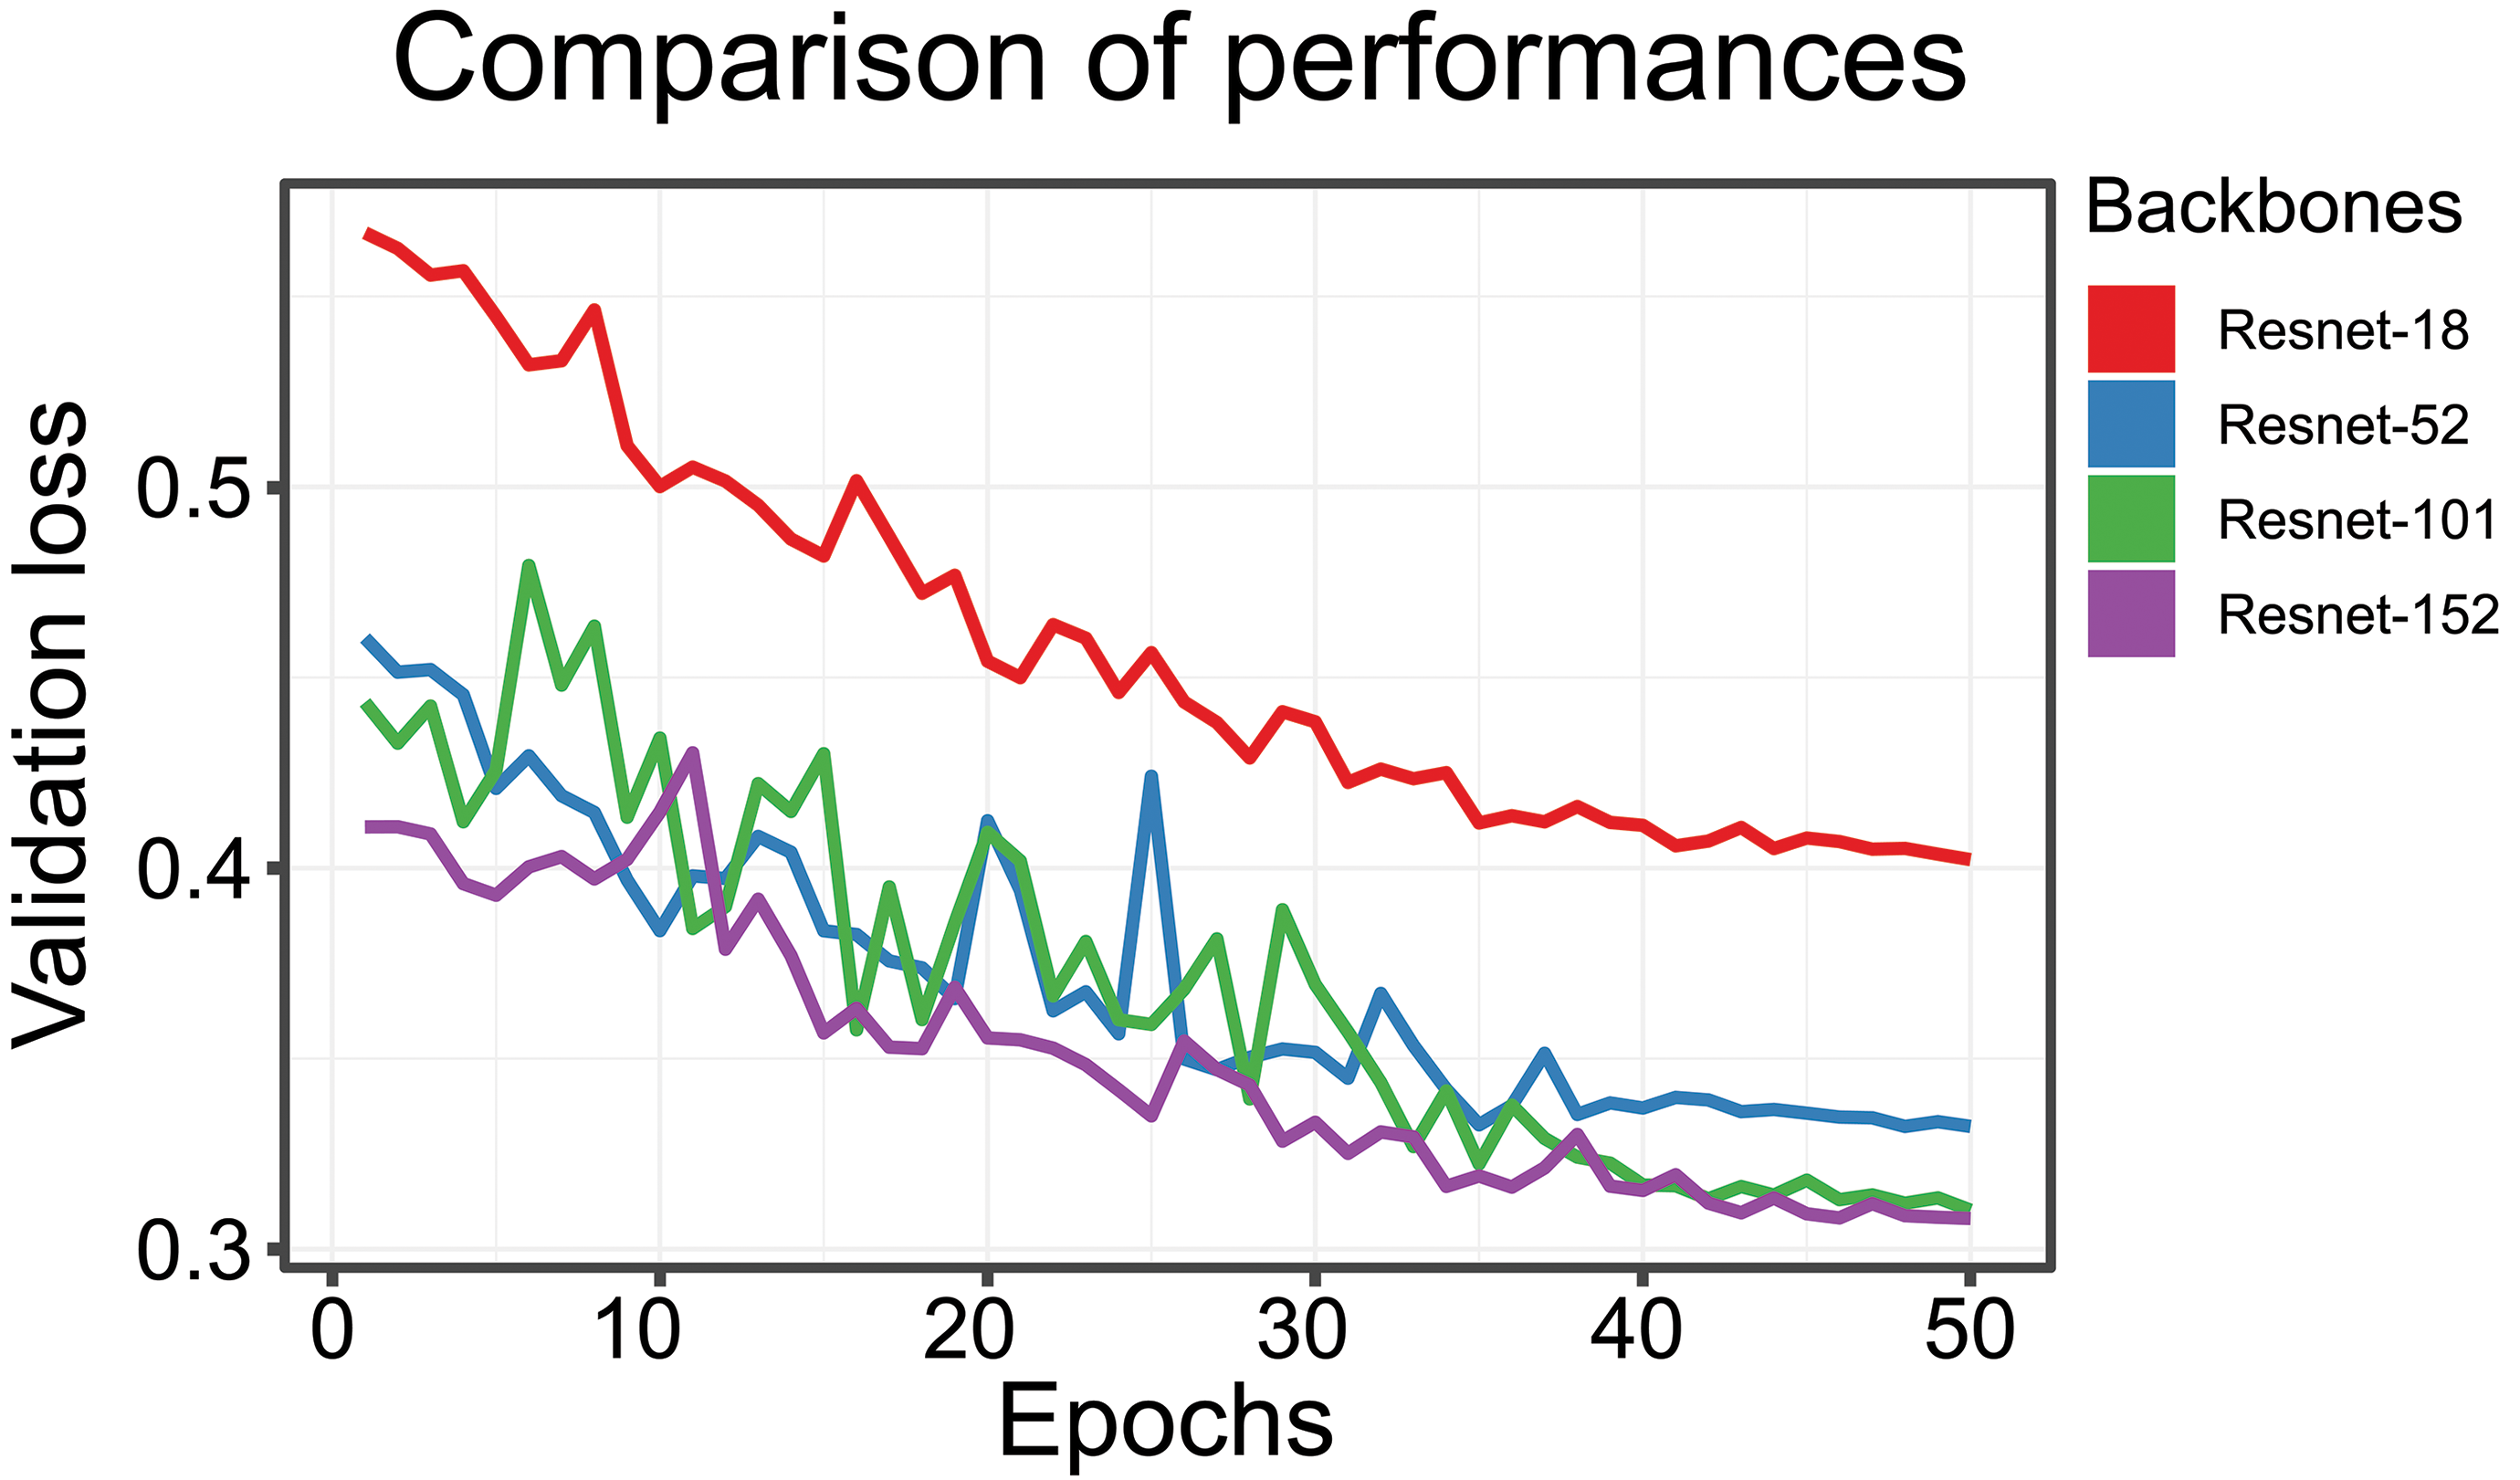
Validation loss (y-axis) and number of epochs (x-axis). Four different backbones were analyzed: ResNet-18, ResNet-52, ResNet-101, and ResNet-152. The smaller the loss, the better the performance of the network.
In final evaluation of the approaches, it was checked how the performance (y-axis, validation loss, less is better) improves, when more training data are available (Figure 4). The diagram indicates that with smaller subsets (10%, 25%, 50%, and 75%) of the training data, the validation loss increases. It becomes also apparent that smaller model types are not benefiting as much as larger model classes from larger training data set sizes. For ResNet-18, we found that after 50% of the training data no clear trend of further improvement can be observed. While the ResNet-101 model backbone still is benefiting of increased training data set sizes.
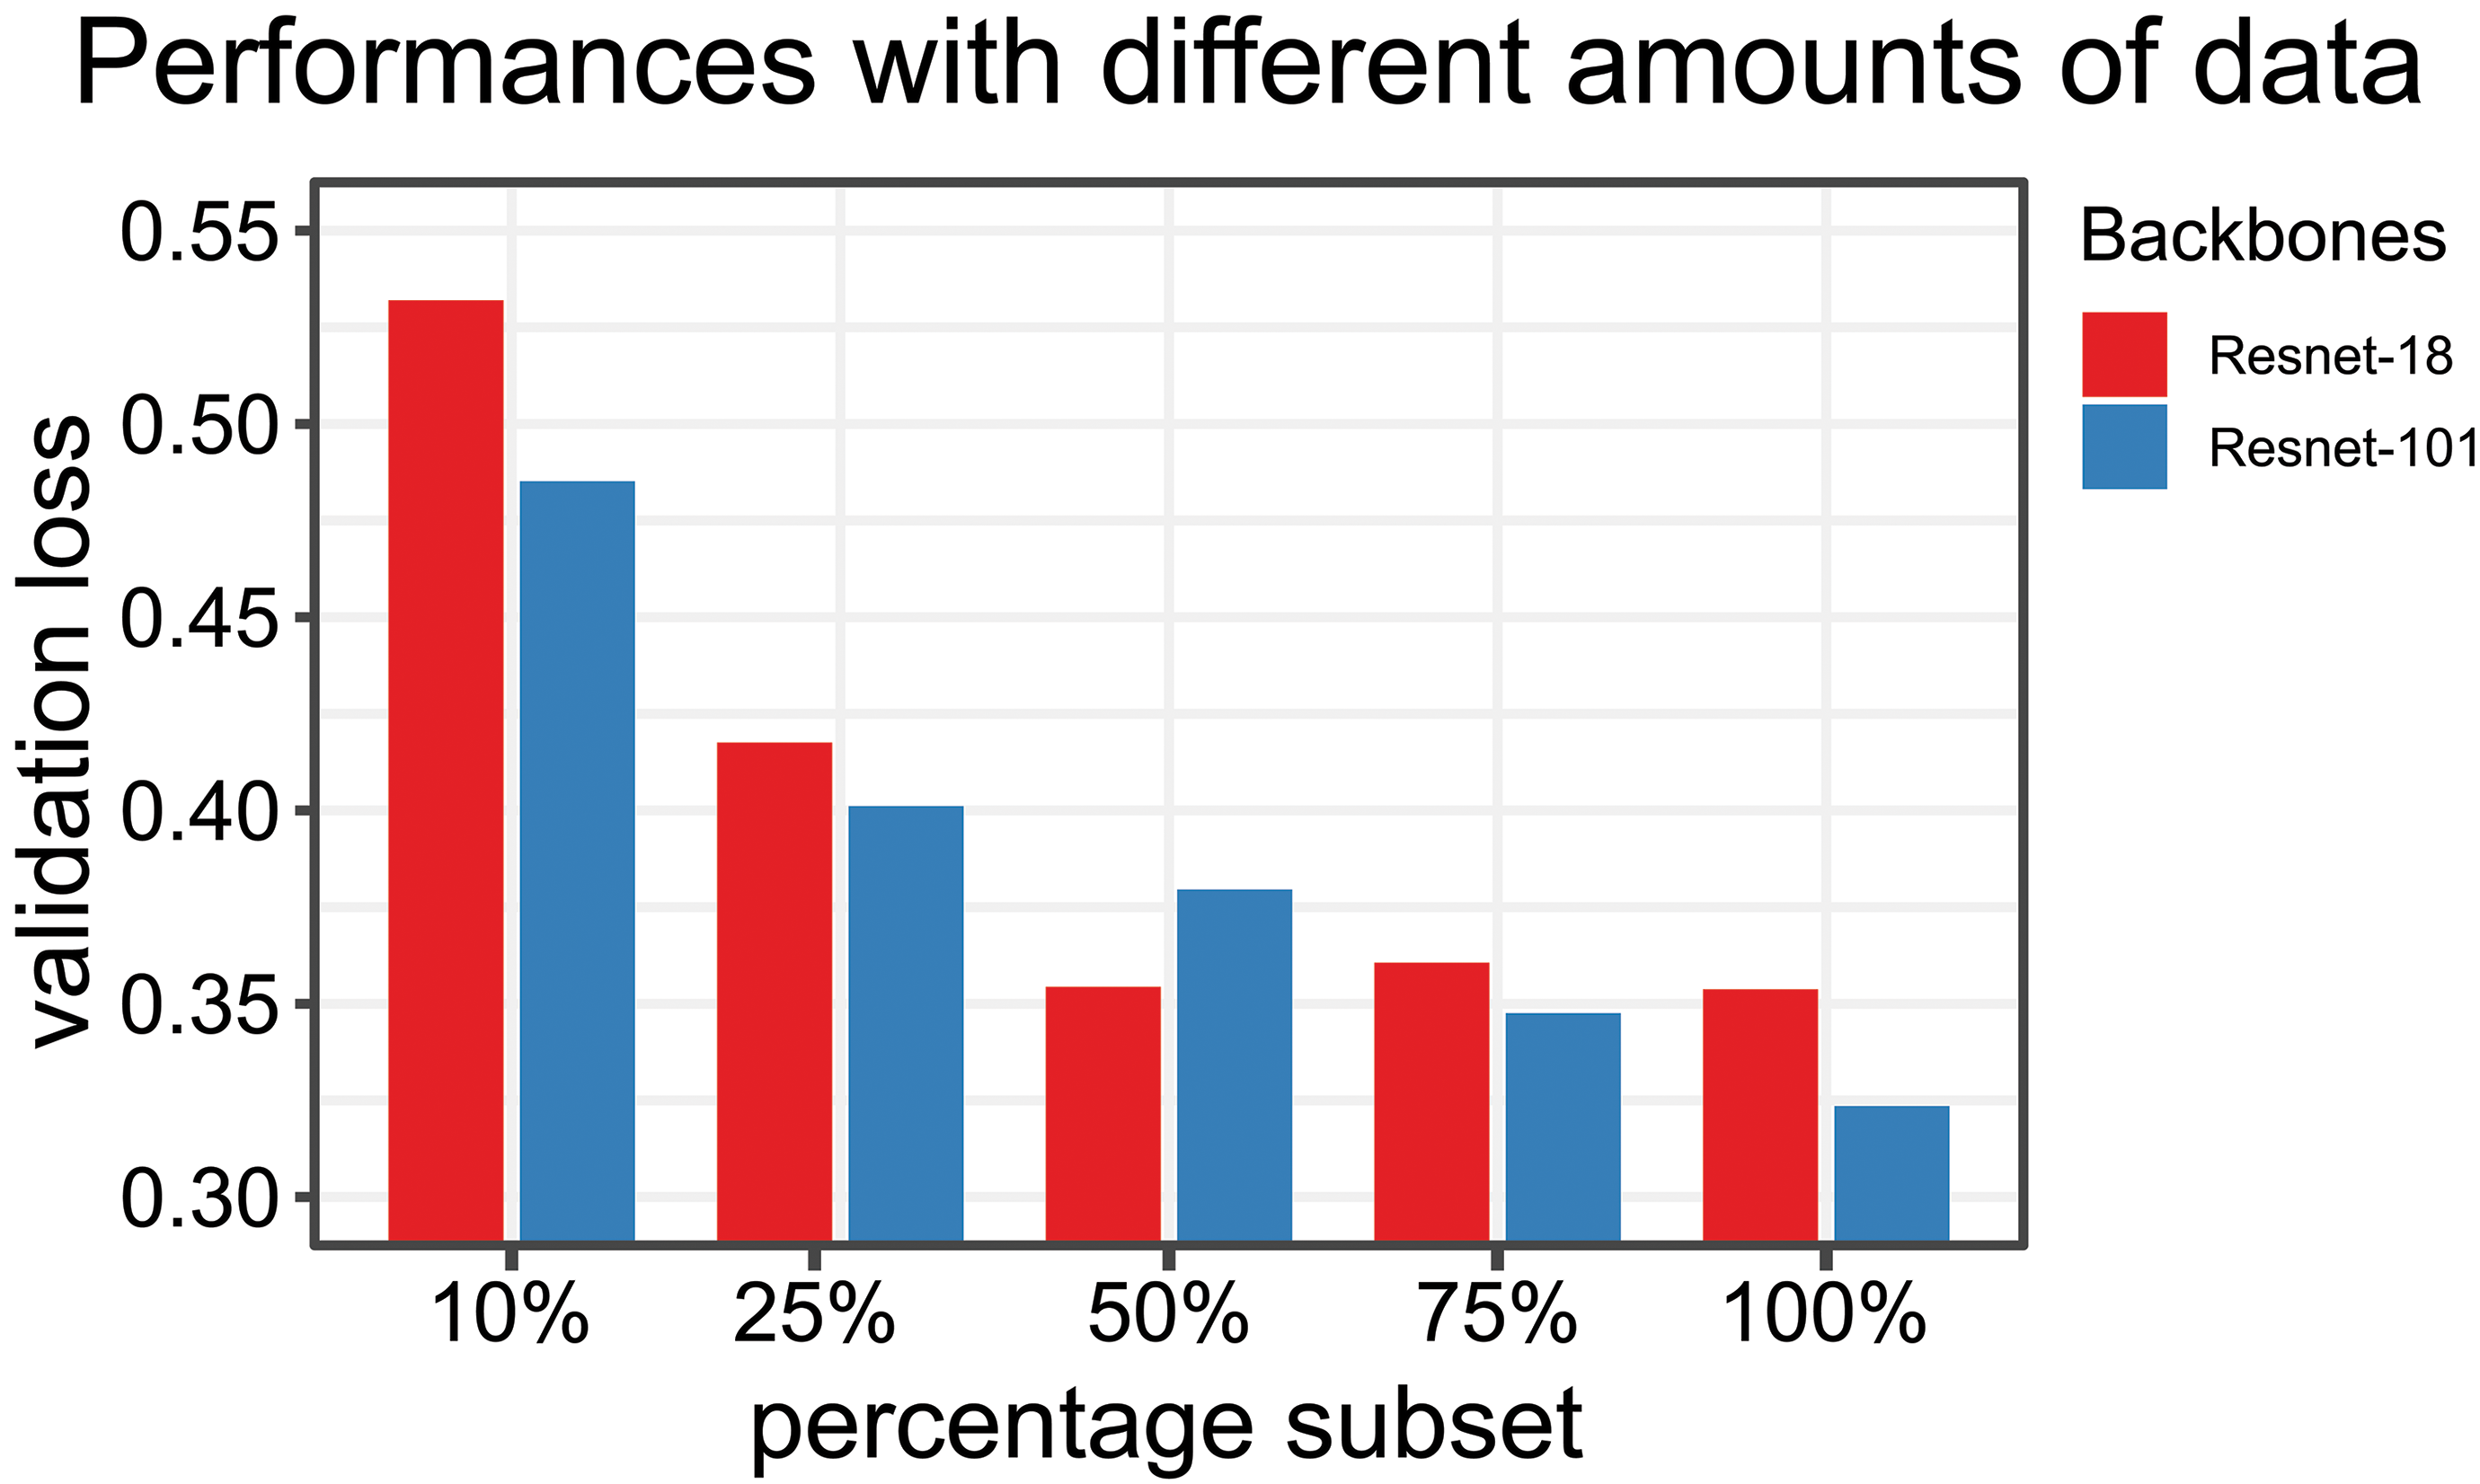
Performance of network (y-axis: validation loss) and amount of training data. Smaller subsets were used (10%, 25%, 50%, and 75%). Two different backbones were used for the comparison: ResNet-18, ResNet-101. Larger models benefit more of a larger amount of data.
Training Faster R-CNN
After the initial studies with custom-coded Retina-Net, we opted to utilize the official Torchvision Faster R-CNN model for our model training, aimed for production usage. Main reason is that the Torchvision model is part of the official PyTorch distribution and thus maintained and documented long term.
Regarding the backbones, the models trained against 2 classes only were the ones with the best performances. One explanation is an increased number of examples of the given class but not the only reason as shown above. Despite the class unbalance, the recognition of the Growing Follicles is satisfactory when ResNet-50 is taken as backbone since the mAP as is above 90% either with 3 or 2 classes (Table 1, Table 2, Figure 5).
Mean Average Precision of the Most Important Classes When the Faster-RCNN Was Trained on Different Backbones With 3 Classes.
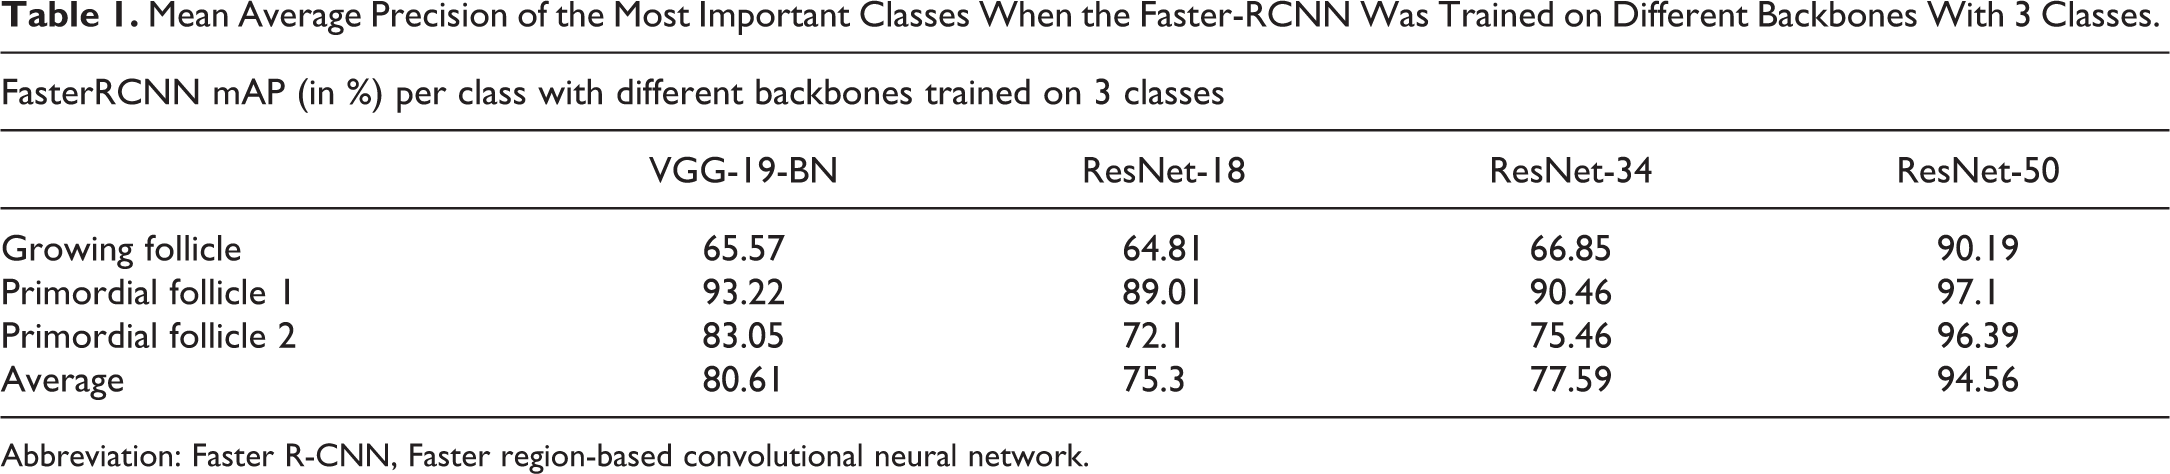
Abbreviation: Faster R-CNN, Faster region-based convolutional neural network.
Mean Average Precision of the Most Important Classes When the Faster R-CNN Was Trained on Different Backbones With 2 classes.
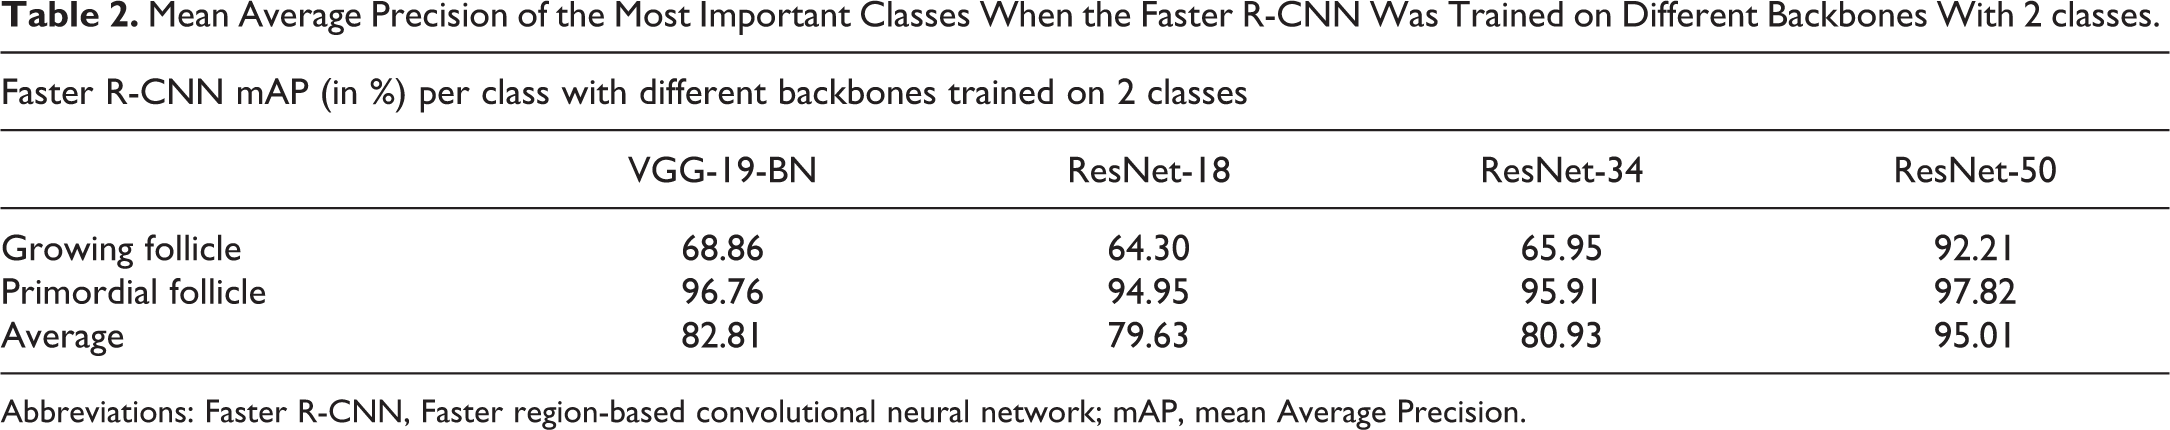
Abbreviations: Faster R-CNN, Faster region-based convolutional neural network; mAP, mean Average Precision.
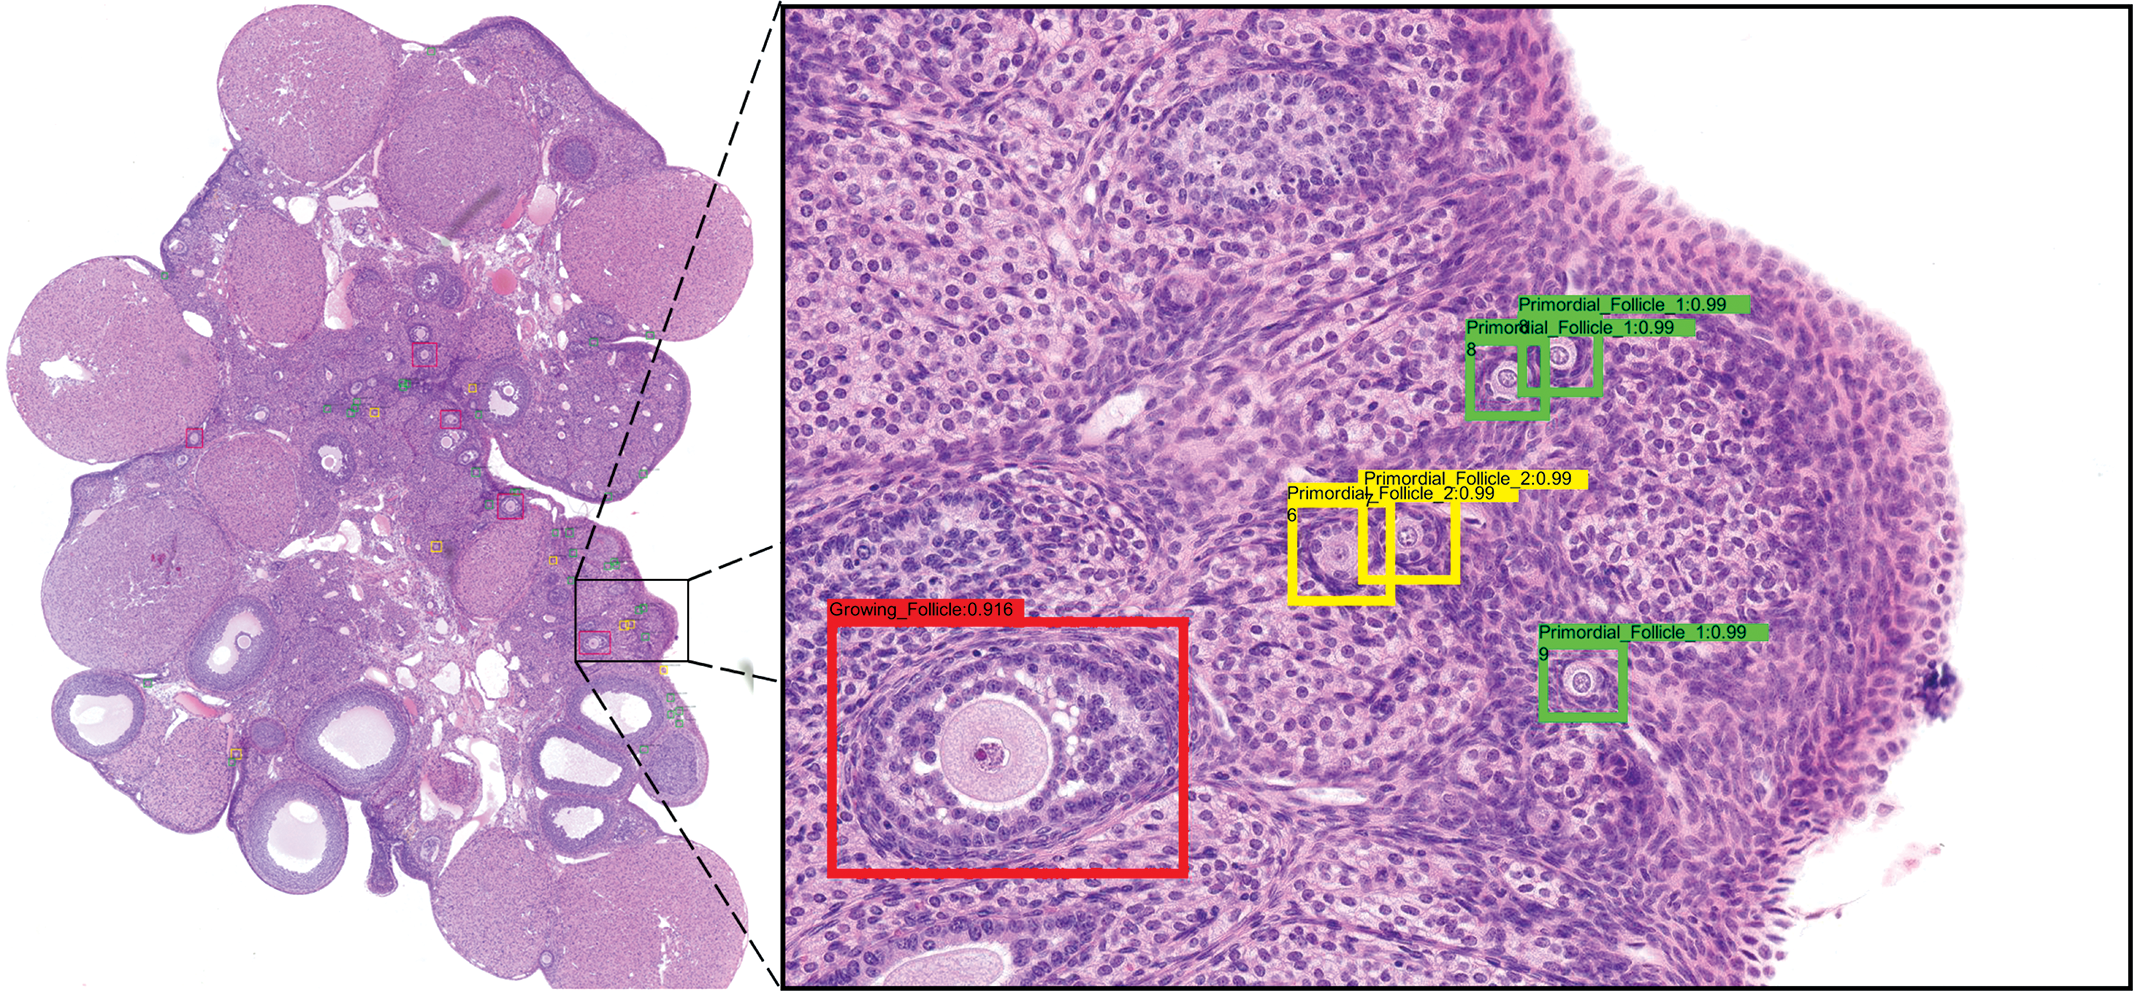
Visualization of the predictions from Faster R-CNN on an ovary section. Left: overview image, original image magnification: 5×. Right: zoom of a specific area to show the recognized structures. Original image magnification: 20×. Faster R-CNN indicates Faster region-based convolutional neural network.
Guided-Backpropagation and Grad-Cam (Gradient-Weighted Class Activation Mapping)
Object recognition architectures provide as part of their output coordinates as well as the labels of the recognized structures. This means they can already give a rough idea of which structures might be recognized by the neuronal network but do not give any detail.
In this study, we tried to visualize which areas of the images could be recognized by the backbone of the neuronal network (Figure 6). Guided-Backpropagation and Grad-Cam showed that the unique features of each class are well understood by the algorithm.
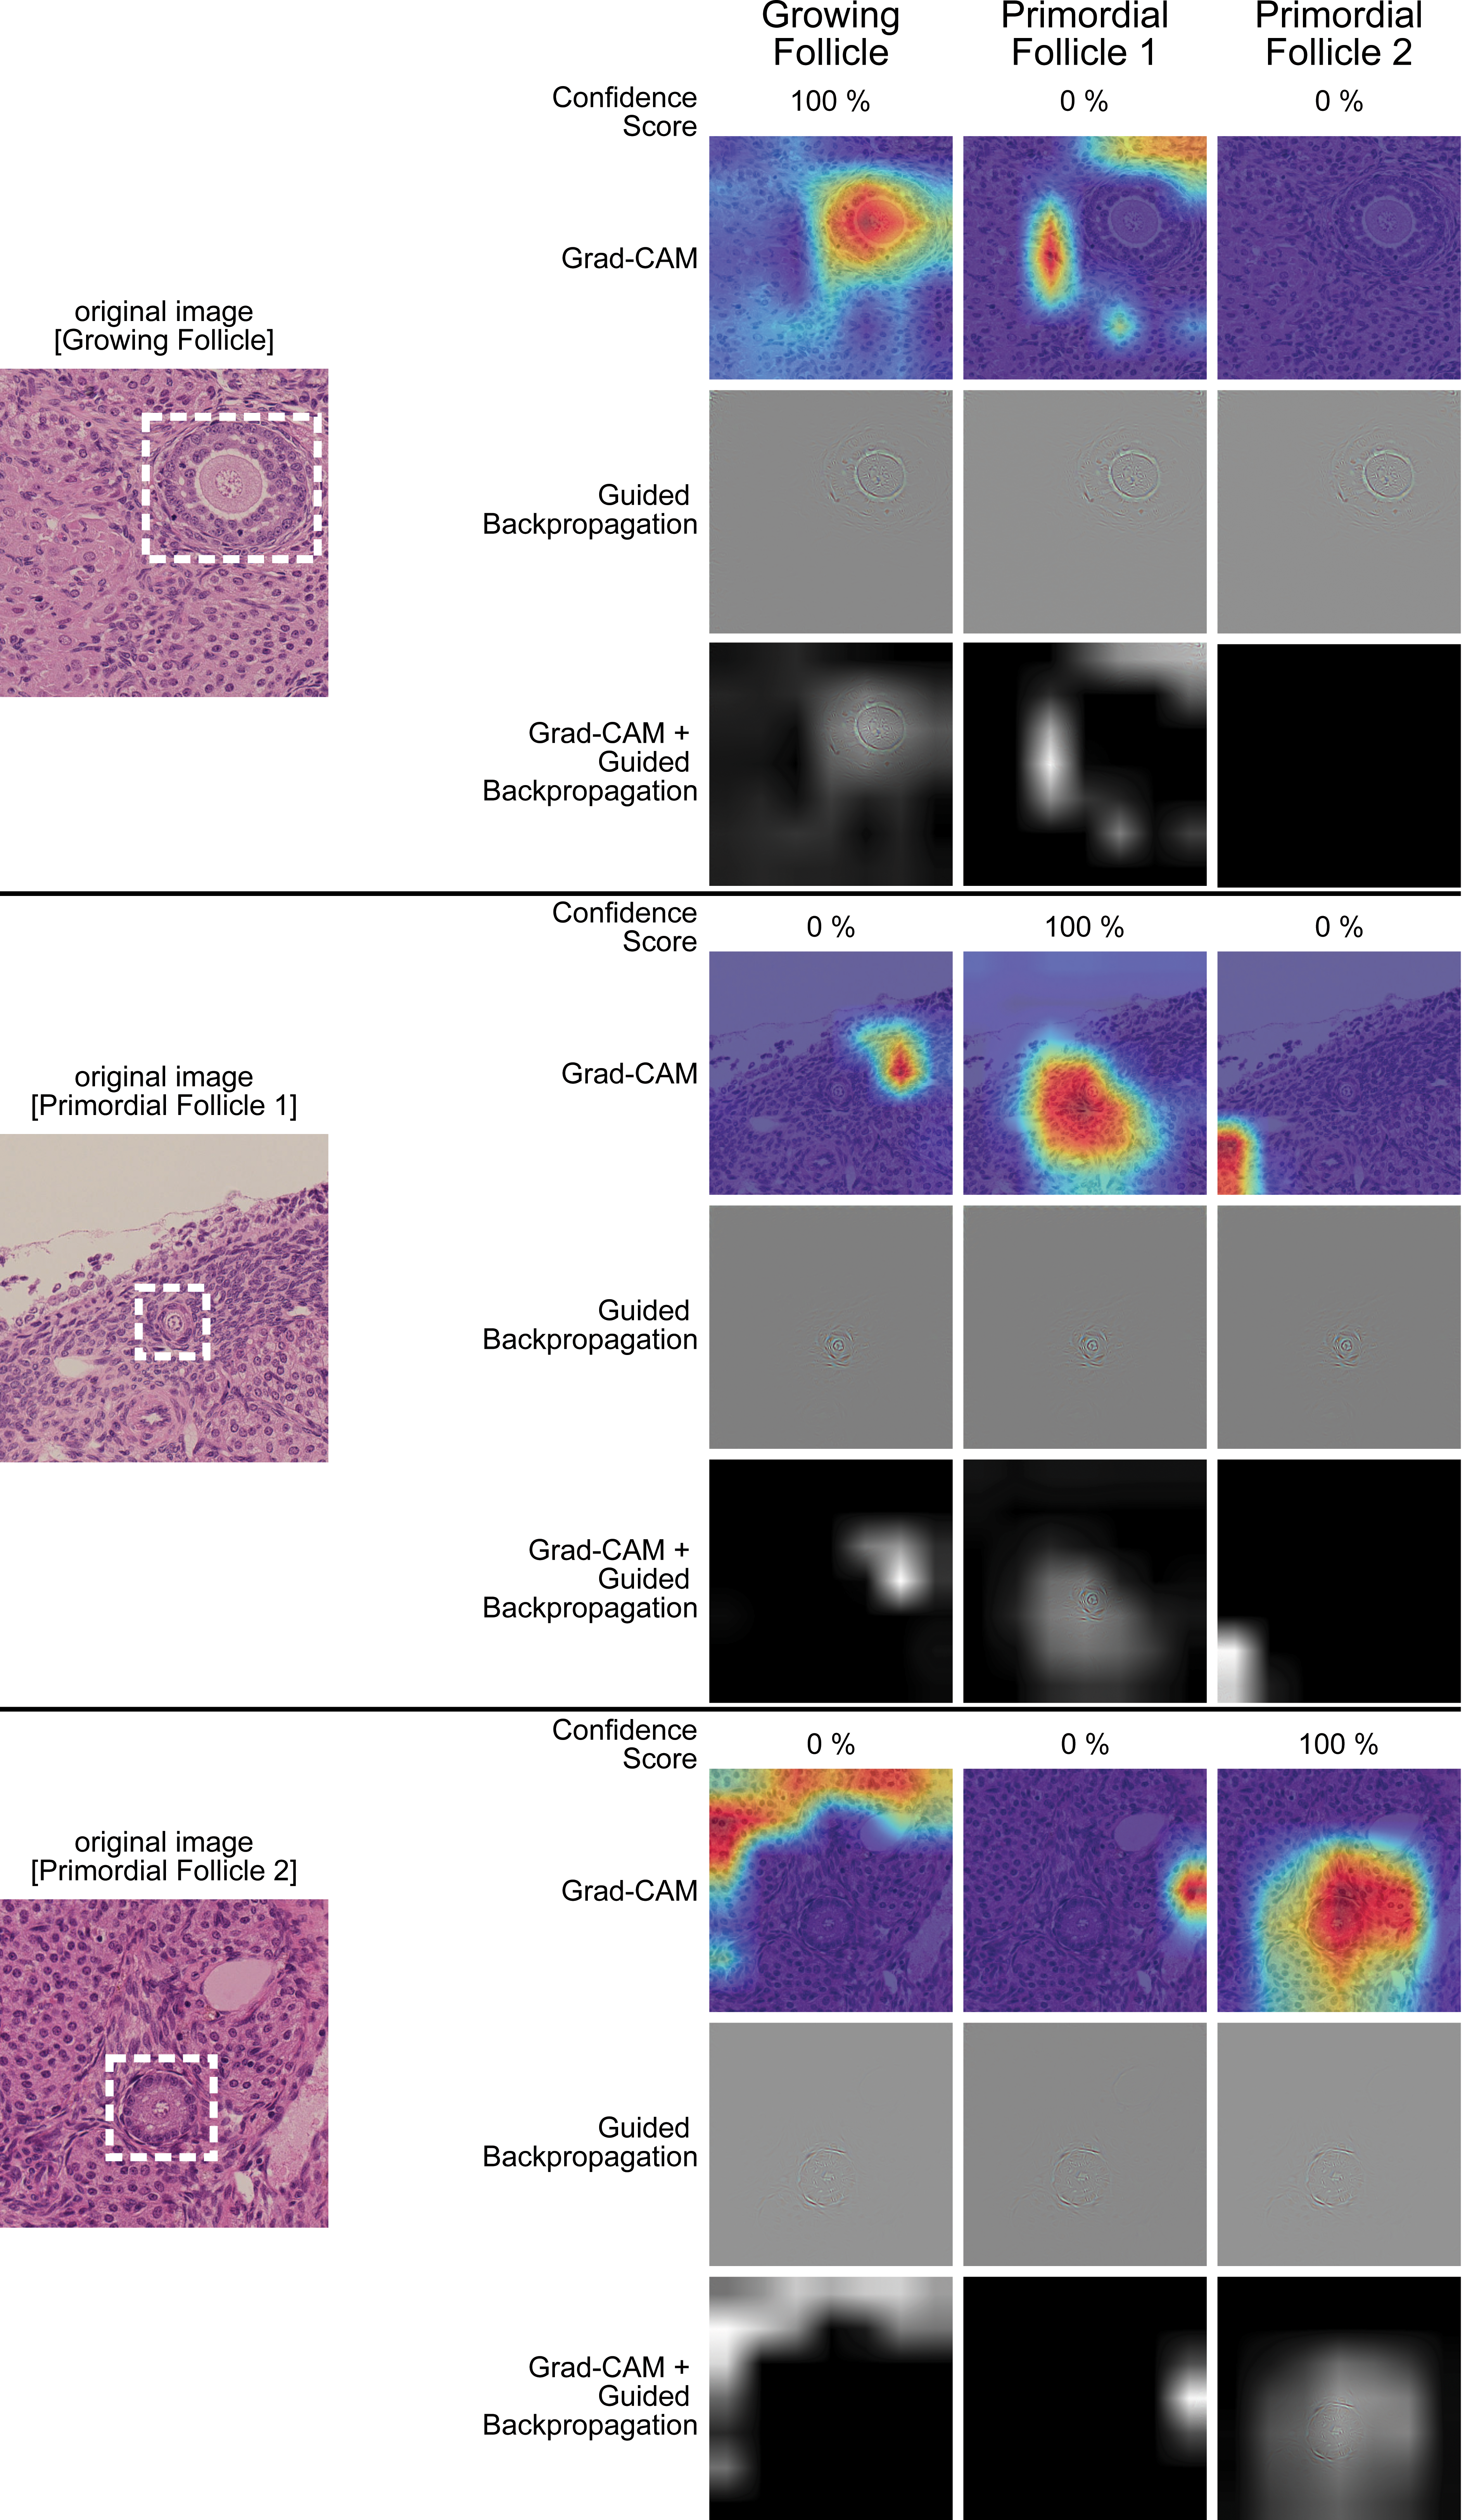
Guided-Backpropagation and Grad-Cam of 3 example images of 3 different classes. The colors indicate the areas were most activated for the recognition.
Discussion
The work described in this paper shows that a promising machine learning workflow has been established, which can be validated under GLP as all steps of the process are reproducible and transparent.
The pathologist was the project leader for the development described in this paper. This involved acquisition of knowledge regarding computer science and deep learning algorithms on the part of the pathologist which made constructive discussions with the algorithm development team possible.
In our experience, one of the most critical steps in this process is the generation of ground truth, which was improved by the simultaneous review of 2 experts, even if this was a very time-consuming step.
The labeling process has been improved with the custom predictive labeling tool, which was, however, used more for a parallel project run in conjunction with this study. The labeling benefitted greatly from the reviewing process: During review, labeling criteria were refined to be consistent across team members (eg, finding internal rules for when a true antral follicle is formed or when the granulosa cell layer is still to be considered uninterrupted). A rather unexpected difference between human and computer evaluation was the initial inclusion of extra “differential diagnosis” labels, which improves the training of a human observer but actually decreases the accuracy of the computer algorithm. Reassuringly, the attempts to show that the model learns the right features of the target classes were successful in a surrogate model using Grad-CAM and guided backpropagation. With the employed 2-step detection model, the direct implementation of these 2 methods is not possible due to the branching architecture of Faster R-CNN. However, active discussions at BASF SE are taking place for the implementation of other candidate methods which can be used in 2-stage detection models.
Concerning accuracy of detection, we believe that the computer already outperforms the human observers, a direct comparison will be performed in our activities leading up to GLP validation.
Further work remains to draft a final validation plan and host the system on a GPU of BASF SE’s proprietary AppStore, where evaluations will be performed, while image generation and archiving of results will be at the department of Toxicology and Ecotoxicology. Supplier audits and service level agreements are drafted or in place with participating departments within BASF SE.
Footnotes
Authors’ Note
Eleonora Carboni and Heike Marxfeld contributed equally to the work.
Declaration of Conflicting Interests
The author(s) declared the following potential conflicts of interest with respect to the research, authorship, and/or publication of this article. All authors were employees of BASF SE during the period of making and writing of the present manuscript and BASF SE sponsored the research.
Funding
The author(s) received no financial support for the research, authorship, and/or publication of this article.