
Abstract
Human exposure to pentabromodiphenyl ether (PBDE) mixture (DE-71) and its PBDE-47 congener can occur both in utero and during lactation. Here, we tested the hypothesis that PBDE-induced neonatal hepatic transcriptomic alterations in Wistar Han rat pups can inform on potential toxicity and carcinogenicity after longer term PBDE exposures. Wistar Han rat dams were exposed to either DE-71 or PBDE-47 daily from gestation day (GD 6) through postnatal day 4 (PND 4). Total plasma thyroxine (T4) was decreased in PND 4 pups. In liver, transcripts for CYPs and conjugation enzymes, Nrf2, and ABC transporters were upregulated. In general, the hepatic transcriptomic alterations after exposure to DE-71 or PBDE-47 were similar and provided early indicators of oxidative stress and metabolic alterations, key characteristics of toxicity processes. The transcriptional benchmark dose lower confidence limits of the most sensitive biological processes were lower for PBDE-47 than for the PBDE mixture. Neonatal rat liver transcriptomic data provide early indicators on molecular pathway alterations that may lead to toxicity and/or carcinogenicity if the exposures continue for longer durations. These early toxicogenomic indicators may be used to help prioritize chemicals for a more complete toxicity and cancer risk evaluation.
Keywords
Introduction
Developing strategies to improve public health includes using methods to identify the potential of environmental exposures to cause toxic and/or carcinogenic effects in a more efficient and relevant manner. This includes understanding toxic effects in vulnerable populations, including the very young whose defense systems are not yet fully developed. The current study provides information on how postnatal day (PND) 4 rat pup toxic end points can be used to predict longer term toxicity and/or carcinogenicity potential.
The pentabromodiphenyl ether (PBDE) chemicals, previously used as flame retardants, were selected for study because exposure to these chemicals is still a recurring problem. 1 –3 The PBDEs are fat-soluble chemicals with a long half-life in the body, and transfer can occur from mother-to-fetus, and to the neonate from breast milk. 4 Exposure to PBDEs can result in a variety of toxicities including disruption of thyroid homeostasis and developmental toxicity. 5,6 While the use of the PBDEs has been phased out, they are still present in e-waste sites and exposures to PBDEs continue. 7 –9 The PBDE mixture (DE-71) used in the current study caused hepatocellular tumors in rats and mice of both sexes, 10 but the PBDE-47 congener, one of the most prevalent congeners in human tissues, 11 has not been tested for carcinogenic activity in model systems. Thus, a comparative evaluation of the toxicity of the PBDE mixture (DE-71) and the PBDE-47 congener in the rat would allow for the identification of similarities and differences between biological effects of the mixture and the congener. Both the PBDE mixture and PBDE-47 were not mutagenic in the presence or absence of metabolic activation. 10
Exposure to hazardous chemicals early in life can have a profound effect on the development of disease later in life. 12,13 Liver is one of the first organs to be exposed to xenobiotics and is a main organ system for metabolism and excretion of xenobiotics. 14,15 In this study, we provide data to show how liver transcriptomics data can be used to identify early disease biomarkers at PND 4, a time point where exposure to the pup was primarily maternal-to-fetus exposure.
Materials and Methods
Chemicals
Pentabromodiphenyl ether-47 (2,2’,4,4’-tetrabromodiphenyl ether; CAS# 5436-43-1) was obtained from Cerillant Corp (Round Rock, TX; Lot ER081208-02). The identity was confirmed by mass spectrometry and nuclear magnetic resonance spectroscopy. The purity for PBDE-47 was 99.6% by gas chromatography (GC) analysis using flame ionization detection. There were no quantifiable polybrominated dibenzodioxins or furans present in the PBDE-47 sample.
A PBDE-mixture (DE-71, technical pentabromodiphenyl; CAS# 32534-81-9) was obtained from Great Lakes Corporation (West Lafayette, IN; Lot 2550OA30A). The identity and purity were determined as described previously. 10 The DE-71 composition was: PBDE-99 (41.7%), PBDE-47 (35.7%), PBDE-100 (10.4%), PBDE-154 (3.6%), PBDE-153 (3.3%), and PBDE-85 (2%); low levels of polybrominated dibenzodioxins and furans were also identified (approximately 7 × 10⁻⁶% by weight). A high dose of 50 mg/kg was selected for the PBDE-47 and PBDE mixture (DE-71) study to make doses comparable to those used in the DE-71 carcinogenicity study where treatment-related hepatocellular tumors occurred in male and female Wistar Han rats without an effect on survival throughout most of the 2-year study at 50 mg/kg. 10 The lower doses were added for benchmark dose analysis of treatment-related transcriptomic changes.
Animals
Timed-mated, female Wistar Han rats (Crl: WI (Han)) were obtained from Charles River Laboratories (Raleigh, North Carolina) at 11 to 12 weeks of age at gestation day 2 (GD 2). There were 8 dams per dose group. Up to one male and one female pup were randomly selected from each litter for plasma level, thyroid hormone level determinations, and liver transcriptomics (5 males only/dose group). All pups available from the litters were examined for liver histopathologic lesions.
Tap water and National Institutes of Health (NIH) 07 diet (Ziegler Brothers, Inc, Gardners, Pennsylvania) were available ad libitum. The care of animals on this study was according to NIH procedures as described in the U.S. Public Health Service Policy on Humane Care and Use of Laboratory Animals (available online at: https://olaw.nih.gov). The study protocols were approved by the institutional animal care and use committee.
Experimental Design
Pentabromodiphenyl ether-47 and PBDE mixture (DE-71) dose formulations were prepared at 0 (vehicle control), 0.02, 3, and 10 mg/mL in corn oil to provide oral gavage doses of 0, 0.1, 15, and 50 mg/kg/d when dams were dosed with a dosing volume of 5 mL/kg/d from GD 6 through PND 4, 7 days per week. Controls received corn oil vehicle.
Blood was collected from dams (cardiocentesis) for serum thyroid hormone level determination, and plasma from pups for PBDE plasma level and thyroid hormone level determinations. Postnatal day 4 pups were euthanized and trunk blood was collected from individual pups. Serum and plasma were isolated and frozen at 80 C until analyzed for PBDE levels and/or thyroid hormones. Immediately after blood collection, the liver was weighed and a section of the liver (∼500 mg) was taken from the left lobe, placed in a cryotube, flash frozen and stored at −80 C for toxicogenomic analysis. A 5 mm section of liver immediately adjacent was collected and fixed in 10% neutral-buffered formalin (NBF) for histopathology.
Liver Histopathology
At necropsy, sections of liver were removed and fixed in 10% NBF for microscopic evaluation. Additional samples were collected, cubed, and frozen at −80 C. After fixation in NBF, tissues were trimmed, processed, embedded in paraffin, sectioned at a thickness of 5 µm, stained with hematoxylin and eosin (H&E) and examined microscopically by a board-certified veterinary pathologist with experience in toxicologic pathology.
Quantitation of PBDE-47, 99, and 153 Plasma Levels
Plasma levels of PBDE-47, 99, or 153 were determined after PBDE mixture (DE-71) exposure (0, 0.1, 15, or 50 mg/kg) and PBDE-47 determined after PBDE-47 exposure (0, 0.1, 15, and 50 mg/kg) in PND 4 pups using analytical methods previously described. 10 Briefly, 100 μL aliquot of plasma was extracted with toluene (100 μL PCB 118 in toluene was used as internal standard) and the supernatant was analyzed by GC coupled to an electron capture detector.
Thyroid Hormone Analyses
At PND 4, serum samples from dams and plasma samples from pups were analyzed for total thyroxine (T4) by radioimmunoassay. Samples were processed according to the manufacturers’ protocols (MP Biomedicals LLC, Costa Mesa, California) and analyzed using an Apex Automatic gamma counter (ICN Micromedic Systems, Inc, Huntsville, Alabama). All samples were run in duplicate.
RNA Collection
RNA was extracted from frozen liver samples (approximately 3-4 mm cubes) from the PND 4 left lateral hepatic lobe, using the Invitrogen PureLink Mini kit (Invitrogen cat# 12183-018A, Carlsbad, California) according to the manufacturer’s protocol. RNA concentration and quality were measured on a Bioanalyzer (Agilent Technologies, Santa Clara, California). Samples were aliquoted and stored at −80°C until they were analyzed for gene expression studies.
Microarray Analysis
Postnatal day 4 liver gene expression analysis was conducted using Affymetrix Rat Genome 230 2.0 GeneChip arrays (Affymetrix, Santa Clara, California). One hundred nanograms of total RNA was amplified as directed in the Affymetrix 3’ IVT Plus kit protocol. Of all, 15 μg of amplified biotin-aRNAs were fragmented and 12.5 μg were hybridized to each array for 16 hours at 45°C in a rotating hybridization oven using the Affymetrix Eukaryotic Target Hybridization Controls and protocol. Array slides were stained with streptavidin/phycoerythrin utilizing a double-antibody staining procedure and then washed for antibody amplification according to the GeneChip Hybridization, Wash and Stain Kit and user manual. Arrays were scanned in an Affymetrix Scanner 3000 and data were obtained using the GeneChip Command Console and Expression Console Software (AGCC; version 3.2 and Expression Console; version 1.2).
Microarray Data Normalization
Probe intensity data from all Rat Genome 230 version 2 Affymetrix GeneChip arrays consisting of 31,099 probe sets were read into the R software environment (http://www.R-project.org) directly from .CEL files using the R/affy package. 16 Probe-level data quality was assessed using image reconstruction, box plots of raw signal intensities, and histograms of raw signal intensities. Normalization was carried out using the robust multiarray average (RMA) method using all probe intensity data sets together. 17 Briefly, the RMA method adjusts the background of perfect match (PM) probes, applies a quantile normalization of the corrected PM values, and calculates final expression measures using the Tukey median polish algorithm. Robust multiarray average scatterplots were used as an additional quality control measure.
Statistical Assessment of Differential Gene Expression
Statistical contrasts were used to find pairwise gene expression differences between the control group and each dose group using the R/Maanova package.
18
For each chemical, the model

Overrepresented gene sets were determined from the gene list obtained above by testing for association with gene pathway relationships (www.ingenuity.com). Enrichment of pathway members among differentially expressed probe sets were assessed using the one-tailed Fisher exact test for 2 × 2 contingency tables.
Benchmark Dose Analysis
Postnatal day 4 liver transcriptomic data were used to calculate the benchmark dose (BMD), and a statistically lower confidence bound BMD (BMDL) 22 using BMDExpress version 2.0 (https://github.com/auerbachs/BMDExpress-2.0/releases). We adopted the default settings for BMDExpress 2.0 except that we used an analysis of variance (ANOVA) P value < .05 and |fold-change| ≥1.5 for defining differentially expressed transcripts. Biological Process Gene Ontology terms were used for gene set definitions. BMDExpress verison 2.0 is an updated version of BMDExpress. 23,24 Reference doses for the altered GO Biological Process Category pathways (http://geneontology.org/page/go-enrichment-analysis) were based on liver microarray data from exposed animals. All BMD calculations were performed within the BMDExpress framework. First, a classical one-way ANOVA was used to filter the probe list to find transcripts that were differentially expressed across dose groups with a P value <.05 and |fold-change| ≥1.5. Next, BMD statistics were calculated for each probe set. When more than one probe set mapped to the same Entrez ID, the BMD values were averaged across probe sets to obtain a single value for each Entrez ID and the GO analyses were performed on a gene-specific basis. The program returned a range of summary exposure levels (mg/kg/d) representing the central tendencies and variability of BMD (chemical exposure level [mg/kg/d] estimated to result in a 10% extra risk of disease) and BMDL (95% lower bound on BMD) values.
Analysis of Body and Organ Weights and Thyroid Hormone Levels
Thyroid hormone (T4) data, which typically have skewed distributions, were analyzed using the nonparametric multiple comparison methods of Shirley 25 and Dunn. 26 Jonckheere's test (Jonckheere, 1954) was used to assess the significance of dose–response trends and to determine whether a trend-sensitive test (Williams’ or Shirley’s test) was more appropriate for pairwise comparisons than a test that does not assume a monotonic dose–response (Dunnett’s or Dunn’s test). Trend-sensitive tests were used when Jonckheere's test was significant at P < .01.
Prior to analysis, extreme values identified by the outlier test of Dixon and Massey 27 were examined. Implausible values, extreme values from animals that were suspected of being sick due to causes other than treatment, and values that the laboratory indicated as being inadequate due to measurement problems were eliminated from the analysis.
Analysis of Pregnancy Outcomes
Trends in fertility indices across dose groups were tested using Cochran-Armitage trend tests. Pairwise comparisons of each dosed group with the control group were conducted using Fisher’s exact test. Litter size across dose groups was compared to the control group using the nonparametric multiple comparison methods of Shirley’s (1977) and Dunn’s (1964). Jonckheere’s test 28 was used to assess the significance of dose–response trends and to determine whether the trend-sensitive test (Shirley's test) was more appropriate for pairwise comparisons than the test that does not assume a monotonic dose–response (Dunn's test). Shirley’s test was used when Jonckheere’s test was significant at P < .01.
Results
Pregnancy Outcome
There were no treatment-related PBDE-47 or PBDE-mixture effects on fertility, litter size, or male or female pup body weights. 29
Pentabromodiphenyl Ether-47, 99, and 153 Plasma Levels
After PBDE-mixture exposure, pup plasma levels of PBDE-47, -99, and -153 were measured, and after PBDE-47 exposure, pup PBDE-47 plasma levels were measured. Pentabromodiphenyl ether congener levels increased with increasing dose of the chemical in pups of each sex (Table 1 and Figure 1). The amount of PBDE-47 and PBDE-99 in the PBDE mixture administered to the dam was ∼10 to 12 times the amount of PBDE-153, while in pup plasma the amount of PBDE-47 and PBDE-99 was ∼2 times the amount of PBDE-153. Thus, after PBDE mixture exposure, PBDE-153 was present in pup plasma at a higher level than predicted based on the level in the administered dose.
Concentration of PBDE Congeners in Plasma of PND 4 Pups Exposed to PBDE-47 or PBDE Mixture (DE-71).
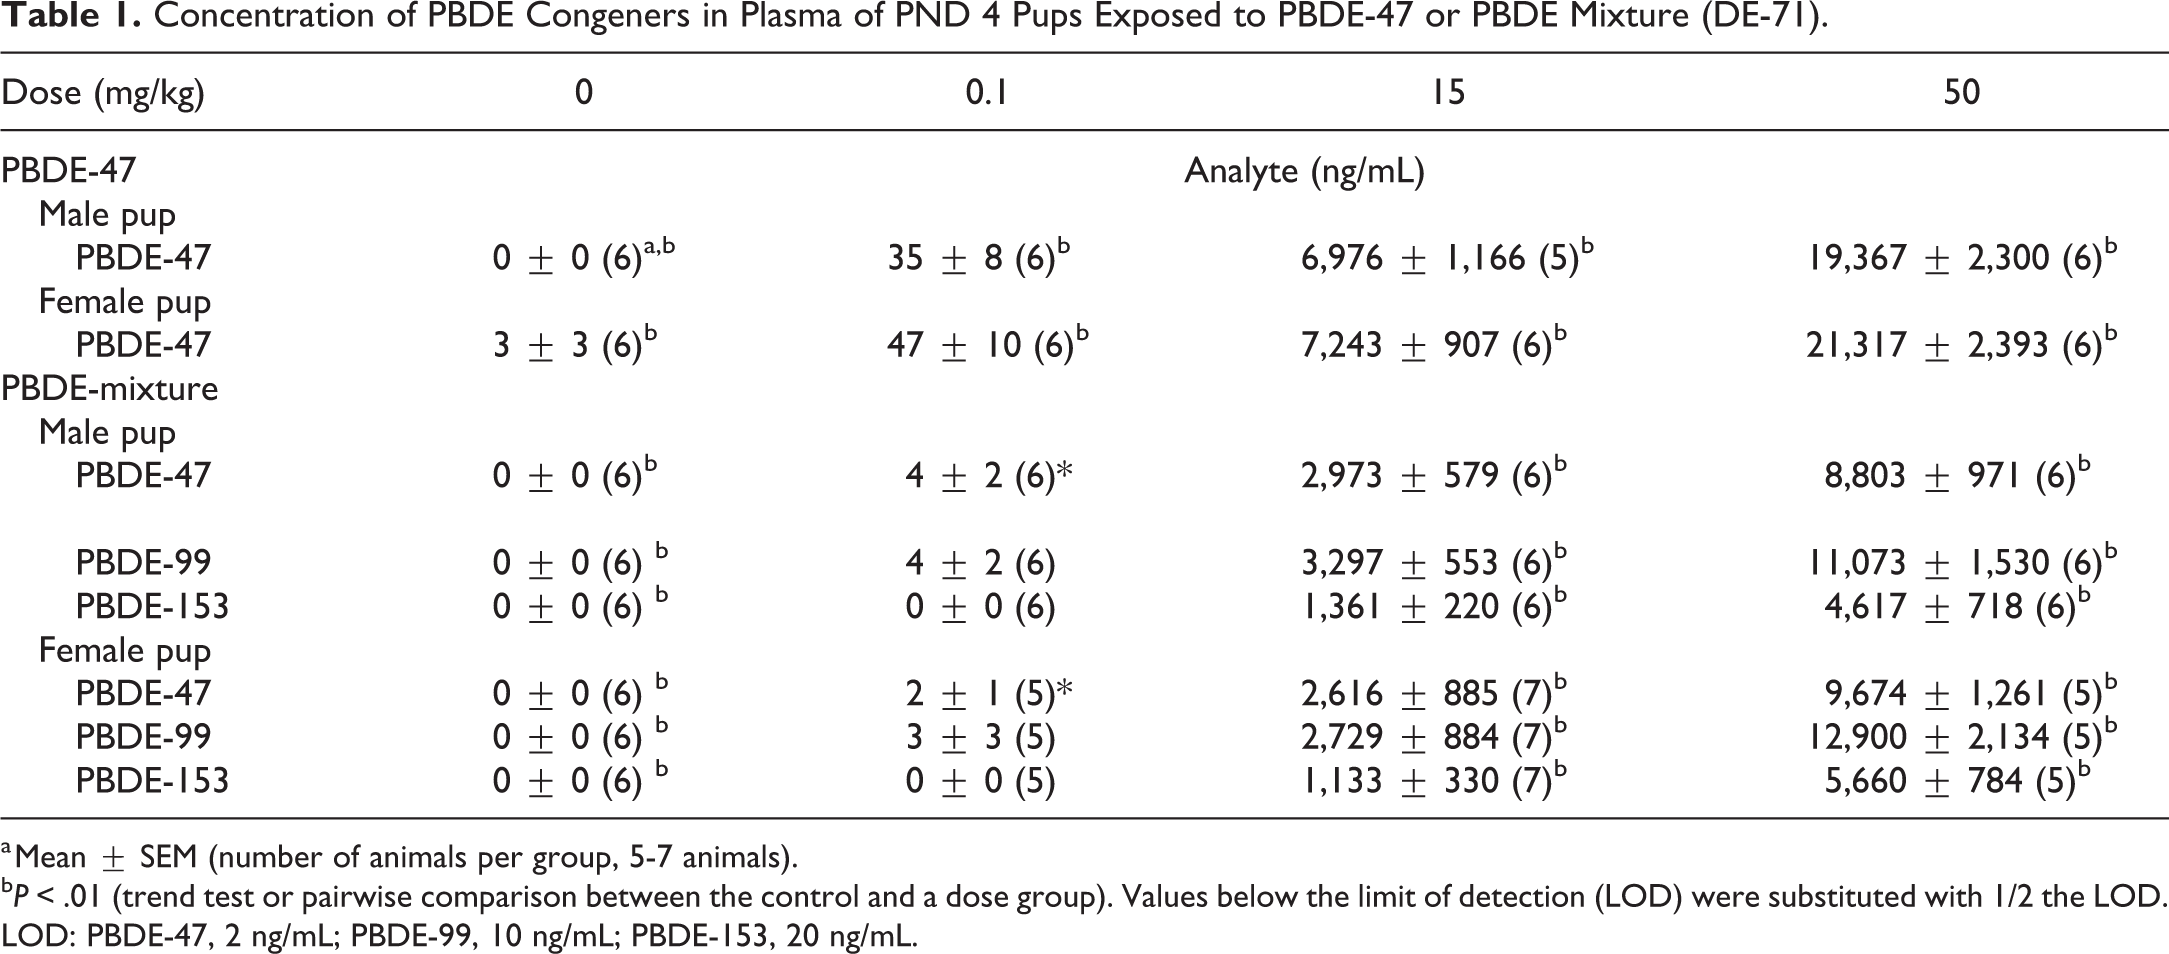
a Mean ± SEM (number of animals per group, 5-7 animals).
bP < .01 (trend test or pairwise comparison between the control and a dose group). Values below the limit of detection (LOD) were substituted with 1/2 the LOD. LOD: PBDE-47, 2 ng/mL; PBDE-99, 10 ng/mL; PBDE-153, 20 ng/mL.
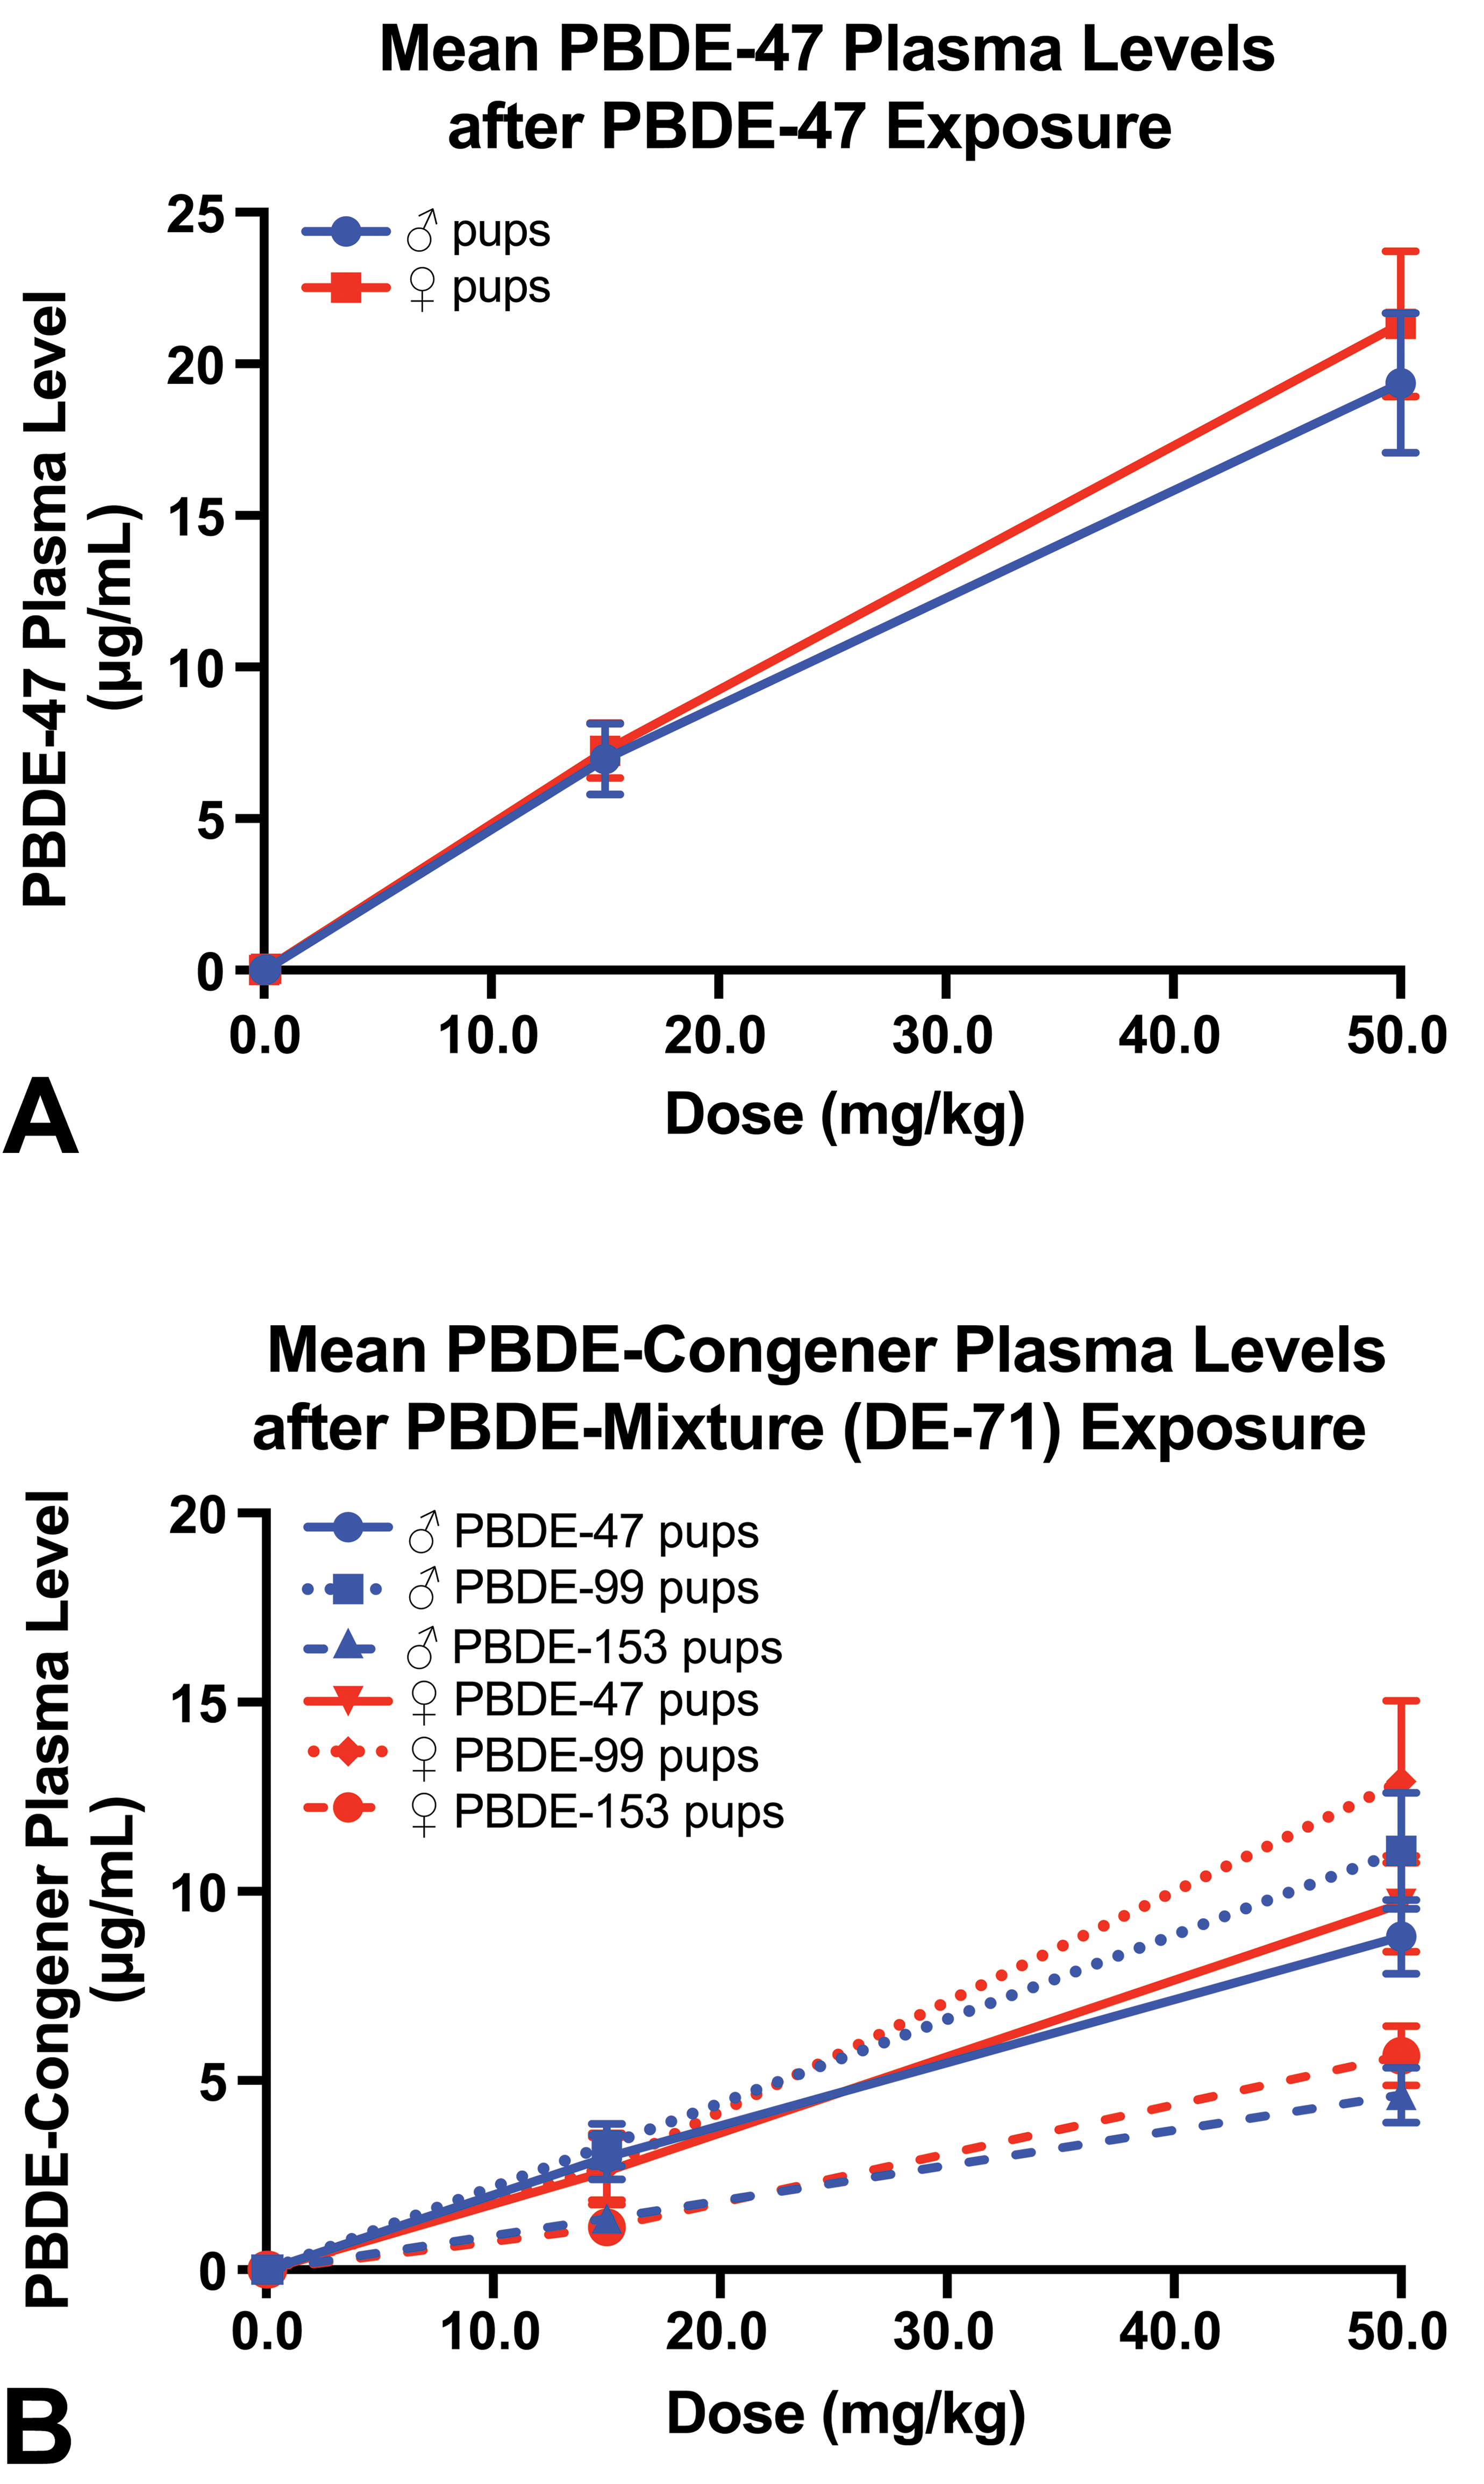
PBDE levels in plasma in PND 4 rat pups. PND 4 indicates postnatal day 4.
The plasma levels of PBDE-47 after exposure to either PBDE-47 or PBDE mixture (containing 36% PBDE-47) were approximately equivalent based on the amount of PBDE-47 given to the animal (for the 50, 15, or 0.1 mg/kg dose of PBDE-mixture, the PBDE-47 dose was approximately 17.85, 2.67, or 0.0357 mg/kg, respectively).
Liver Histopathology
Cytoplasmic vacuolization was diagnosed in male and female pups at 15 and 50 mg/kg after PBDE mixture (DE-71) exposure (Table 2). Affected hepatocytes contained primarily irregularly shaped vacuoles separated by strands of cytoplasm, but there were also fewer discrete round vacuoles consistent with lipid. Vacuolization caused enlargement of many of the hepatocytes. Grading was done using a 4 grade system, with 1 being minimal, 2 mild, 3 moderate, and 4 severe. The severity grade was based upon the number of hepatocytes with the change, and the amount of cytoplasmic vacuolization within the affected hepatocytes, with none of the animals in this study having more than a mild degree of vacuolization. Severity grading was subjective, but in general, animals with minimal vacuolization had approximately 25% or fewer of the hepatocytes affected, while animals with mild vacuolization had 50% or fewer, but more than 25% of the hepatocytes affected. No treatment-related liver lesions were seen after PBDE-47 administration.
Hepatic Lesions at PND 4 After PBDE Mixture (DE-71) Exposure.
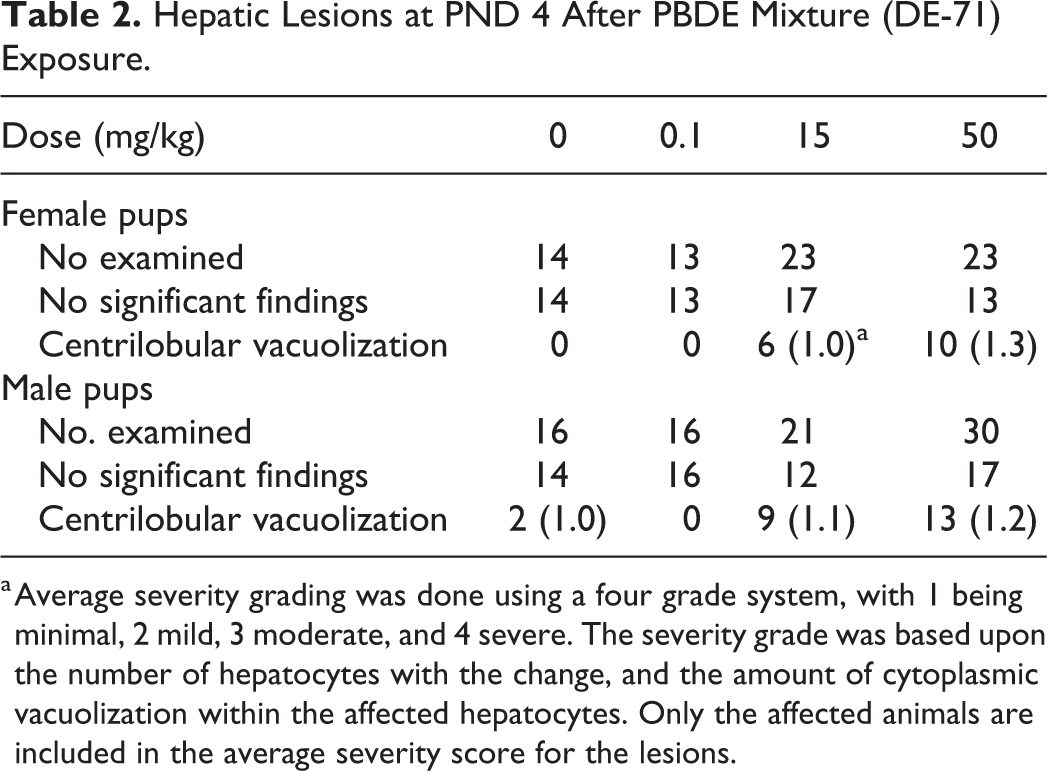
a Average severity grading was done using a four grade system, with 1 being minimal, 2 mild, 3 moderate, and 4 severe. The severity grade was based upon the number of hepatocytes with the change, and the amount of cytoplasmic vacuolization within the affected hepatocytes. Only the affected animals are included in the average severity score for the lesions.
Thyroid Hormone Levels
Total T4 levels were significantly decreased in dams treated with 15 and 50 mg/kg PBDE mixture, and in dams treated with 50 mg/kg PBDE-47 (Table 3). At PND 4, T4 was not detected or was below level of detection in male pups for the 15 or 50 mg/kg exposure to PBDE-47 or male or female pups with 50 mg/kg exposure to PBDE mixture (Table 3).
Total Thyroxine (T4) Levelsa in Dams or PND 4 Pups Exposed to PBDE-47 or PBDE Mixture (DE-71).
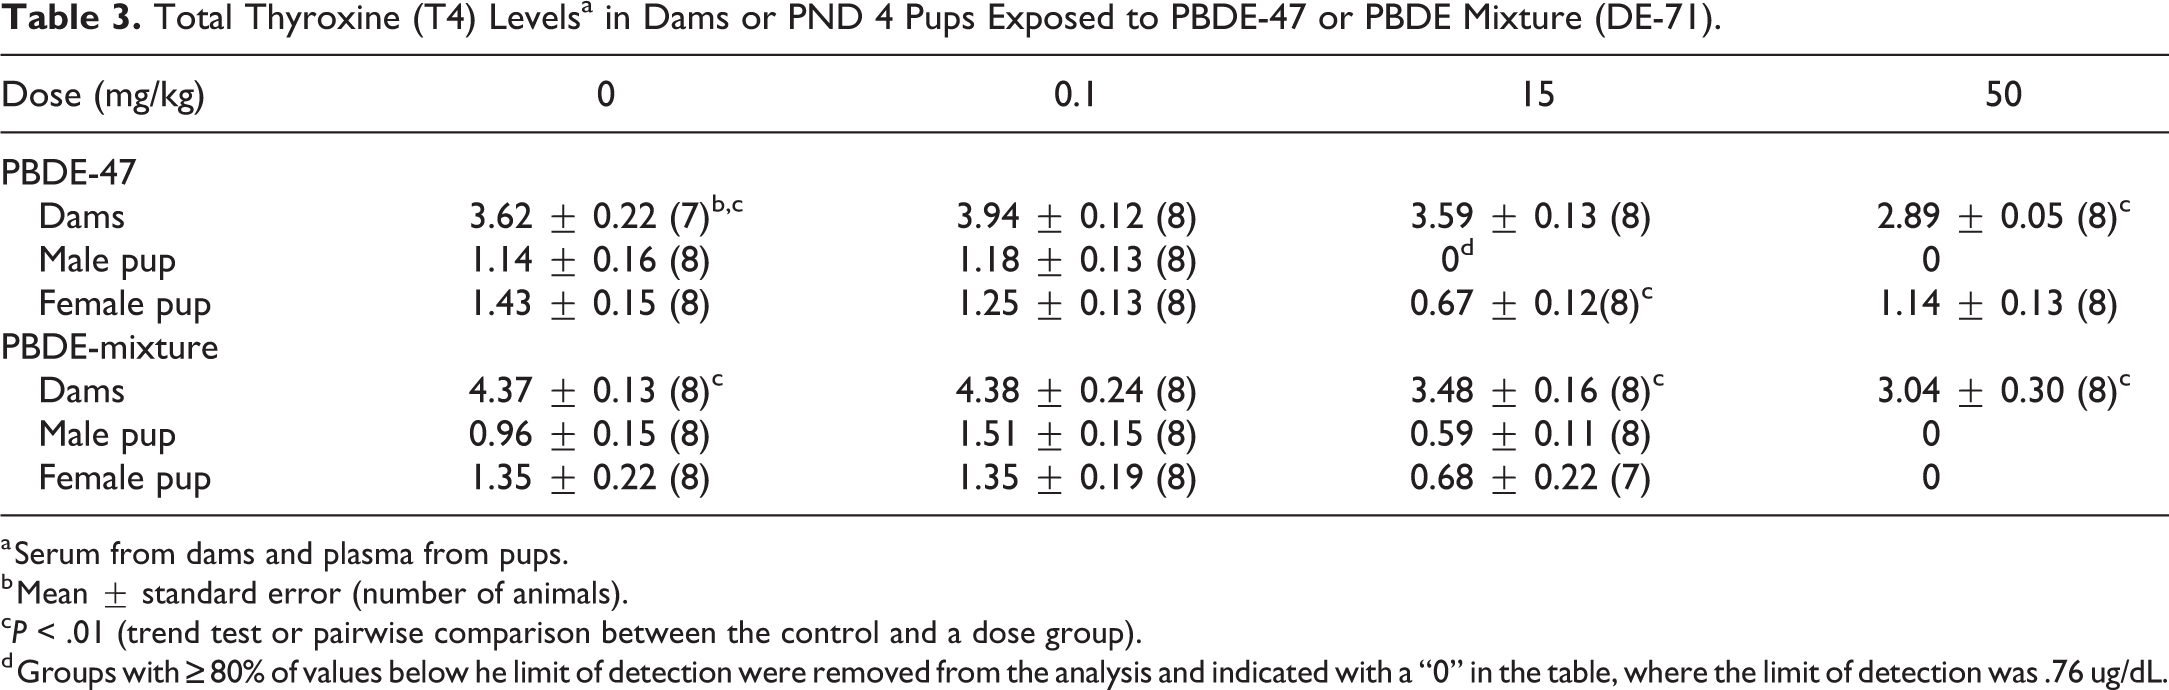
a Serum from dams and plasma from pups.
b Mean ± standard error (number of animals).
cP < .01 (trend test or pairwise comparison between the control and a dose group).
d Groups with ≥80% of values below he limit of detection were removed from the analysis and indicated with a “0” in the table, where the limit of detection was .76 ug/dL.
Microarray Analysis
There were 139 and 161 significantly changed levels of liver transcripts compared to controls (FDR < 0.05) at 50 mg/kg PBDE-47 or PBDE mixture, respectively (Table 4; Supplemental Material 1 and 2). In addition, there were 40 and 13 significantly changed levels of liver transcripts compared to controls (FDR < 0.05) at 15 mg/kg of PBDE-47 or PBDE mixture exposure, respectively. The majority of these changed transcripts were upregulated. Canonical pathways changes after PBDE exposures included those of liver metabolic functions and Nrf2 antioxidant systems (Tables 5 and 6). In addition, various glucuronosyl transferases were upregulated in the 15 mg/kg or 50 mg/kg groups. Membrane transport transcripts were upregulated after exposure to PBDE-47 or PBDE mixture, including ATP binding cassette members and solute carrier transcripts (Table 6).
Number of Hepatic Transcripts Up- or Downregulated after PBDE-47 or PBDE Mixture (DE-71) Exposure at PND 4 in Male Pups.a
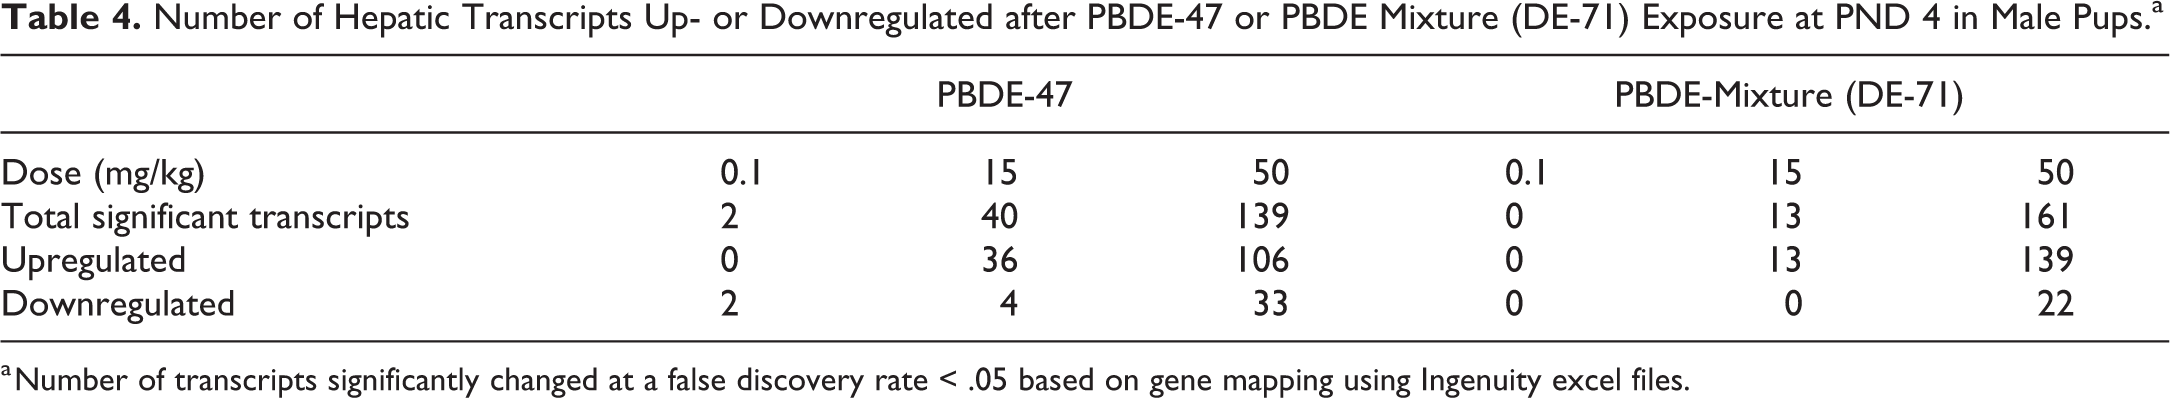
a Number of transcripts significantly changed at a false discovery rate < .05 based on gene mapping using Ingenuity excel files.
Top Ingenuity Pathways for PBDE-47 or PBDE Mixture (DE-71) at 50 mg/kg at PND 4.a
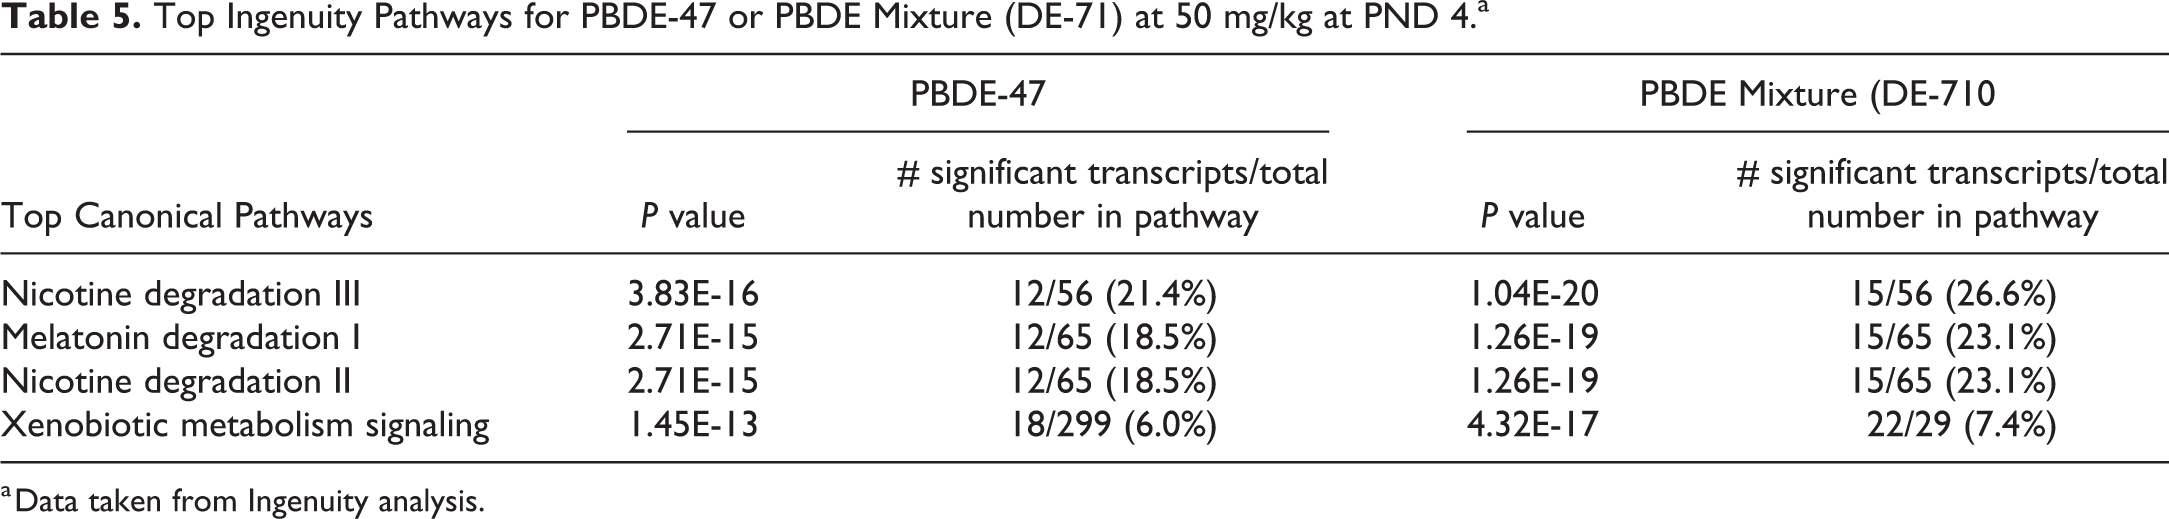
a Data taken from Ingenuity analysis.
Selected PND 4 Hepatic Transcripts Following PBDE-47 or PBDE Mixture (DE-71) Exposure in PND 4 Male Pups.a
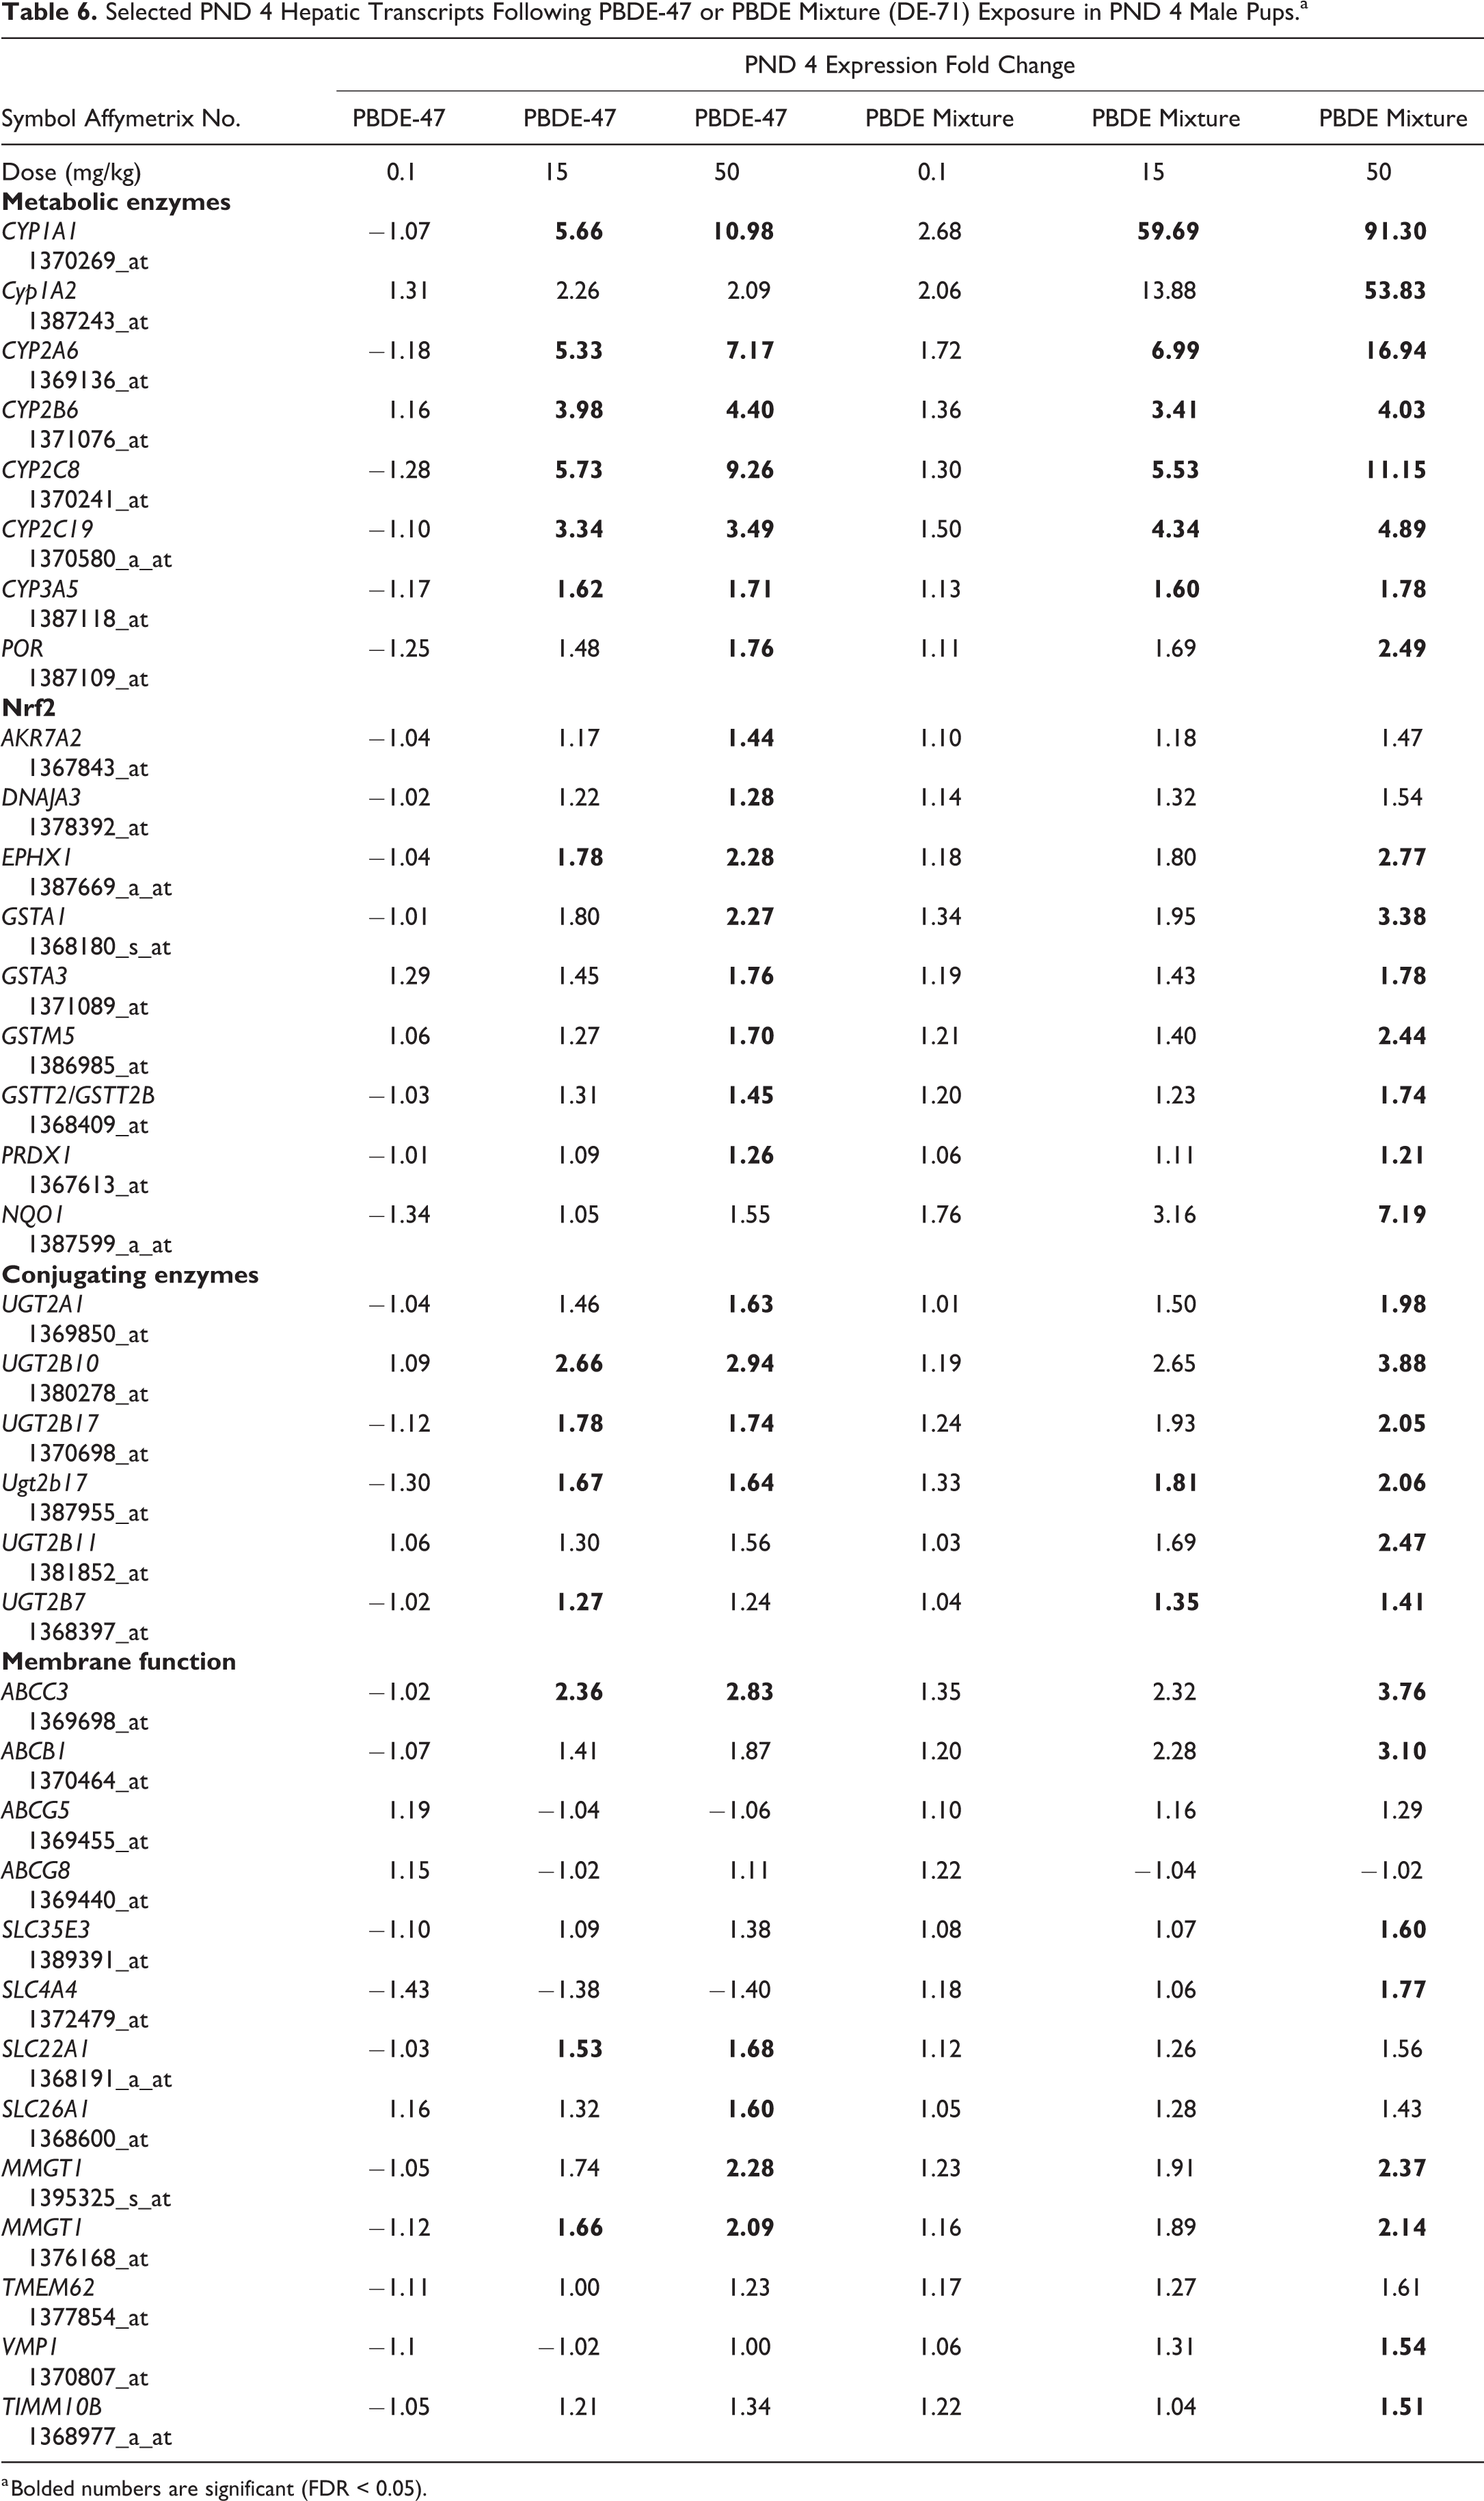
a Bolded numbers are significant (FDR < 0.05).
Benchmark Dose Analysis
Benchmark dose analysis of the liver transcript data was performed for PBDE-47 (Supplemental Material 3) and PBDE mixture (DE-71; Supplemental Material 4) using GO Biological Process categories. Selected BMDL levels are reported in Table 7, which show GO categories with ≥5 genes (and ≥5% of the genes in the category) that pass the selection criteria in BMDExpress 2.0 (P value ≥ 0.05 and FC > 1.5). The lowest BMDLs for PBDE-47 exposure were 0.04 mg/kg and for PBDE mixture exposure somewhat higher (in the range of 3-4 mg/kg). The lower BMDL levels with PBDE-47 may have been due in part to the finding that there were more significant liver transcripts at 15 mg/kg than there were with the PBDE mixture.
Selected Mean BMDL Levels for PBDE-47 or PBDE Mixture Based on GO Categories Using Hepatic Transcriptomic Data in PND 4 Male Pups.a
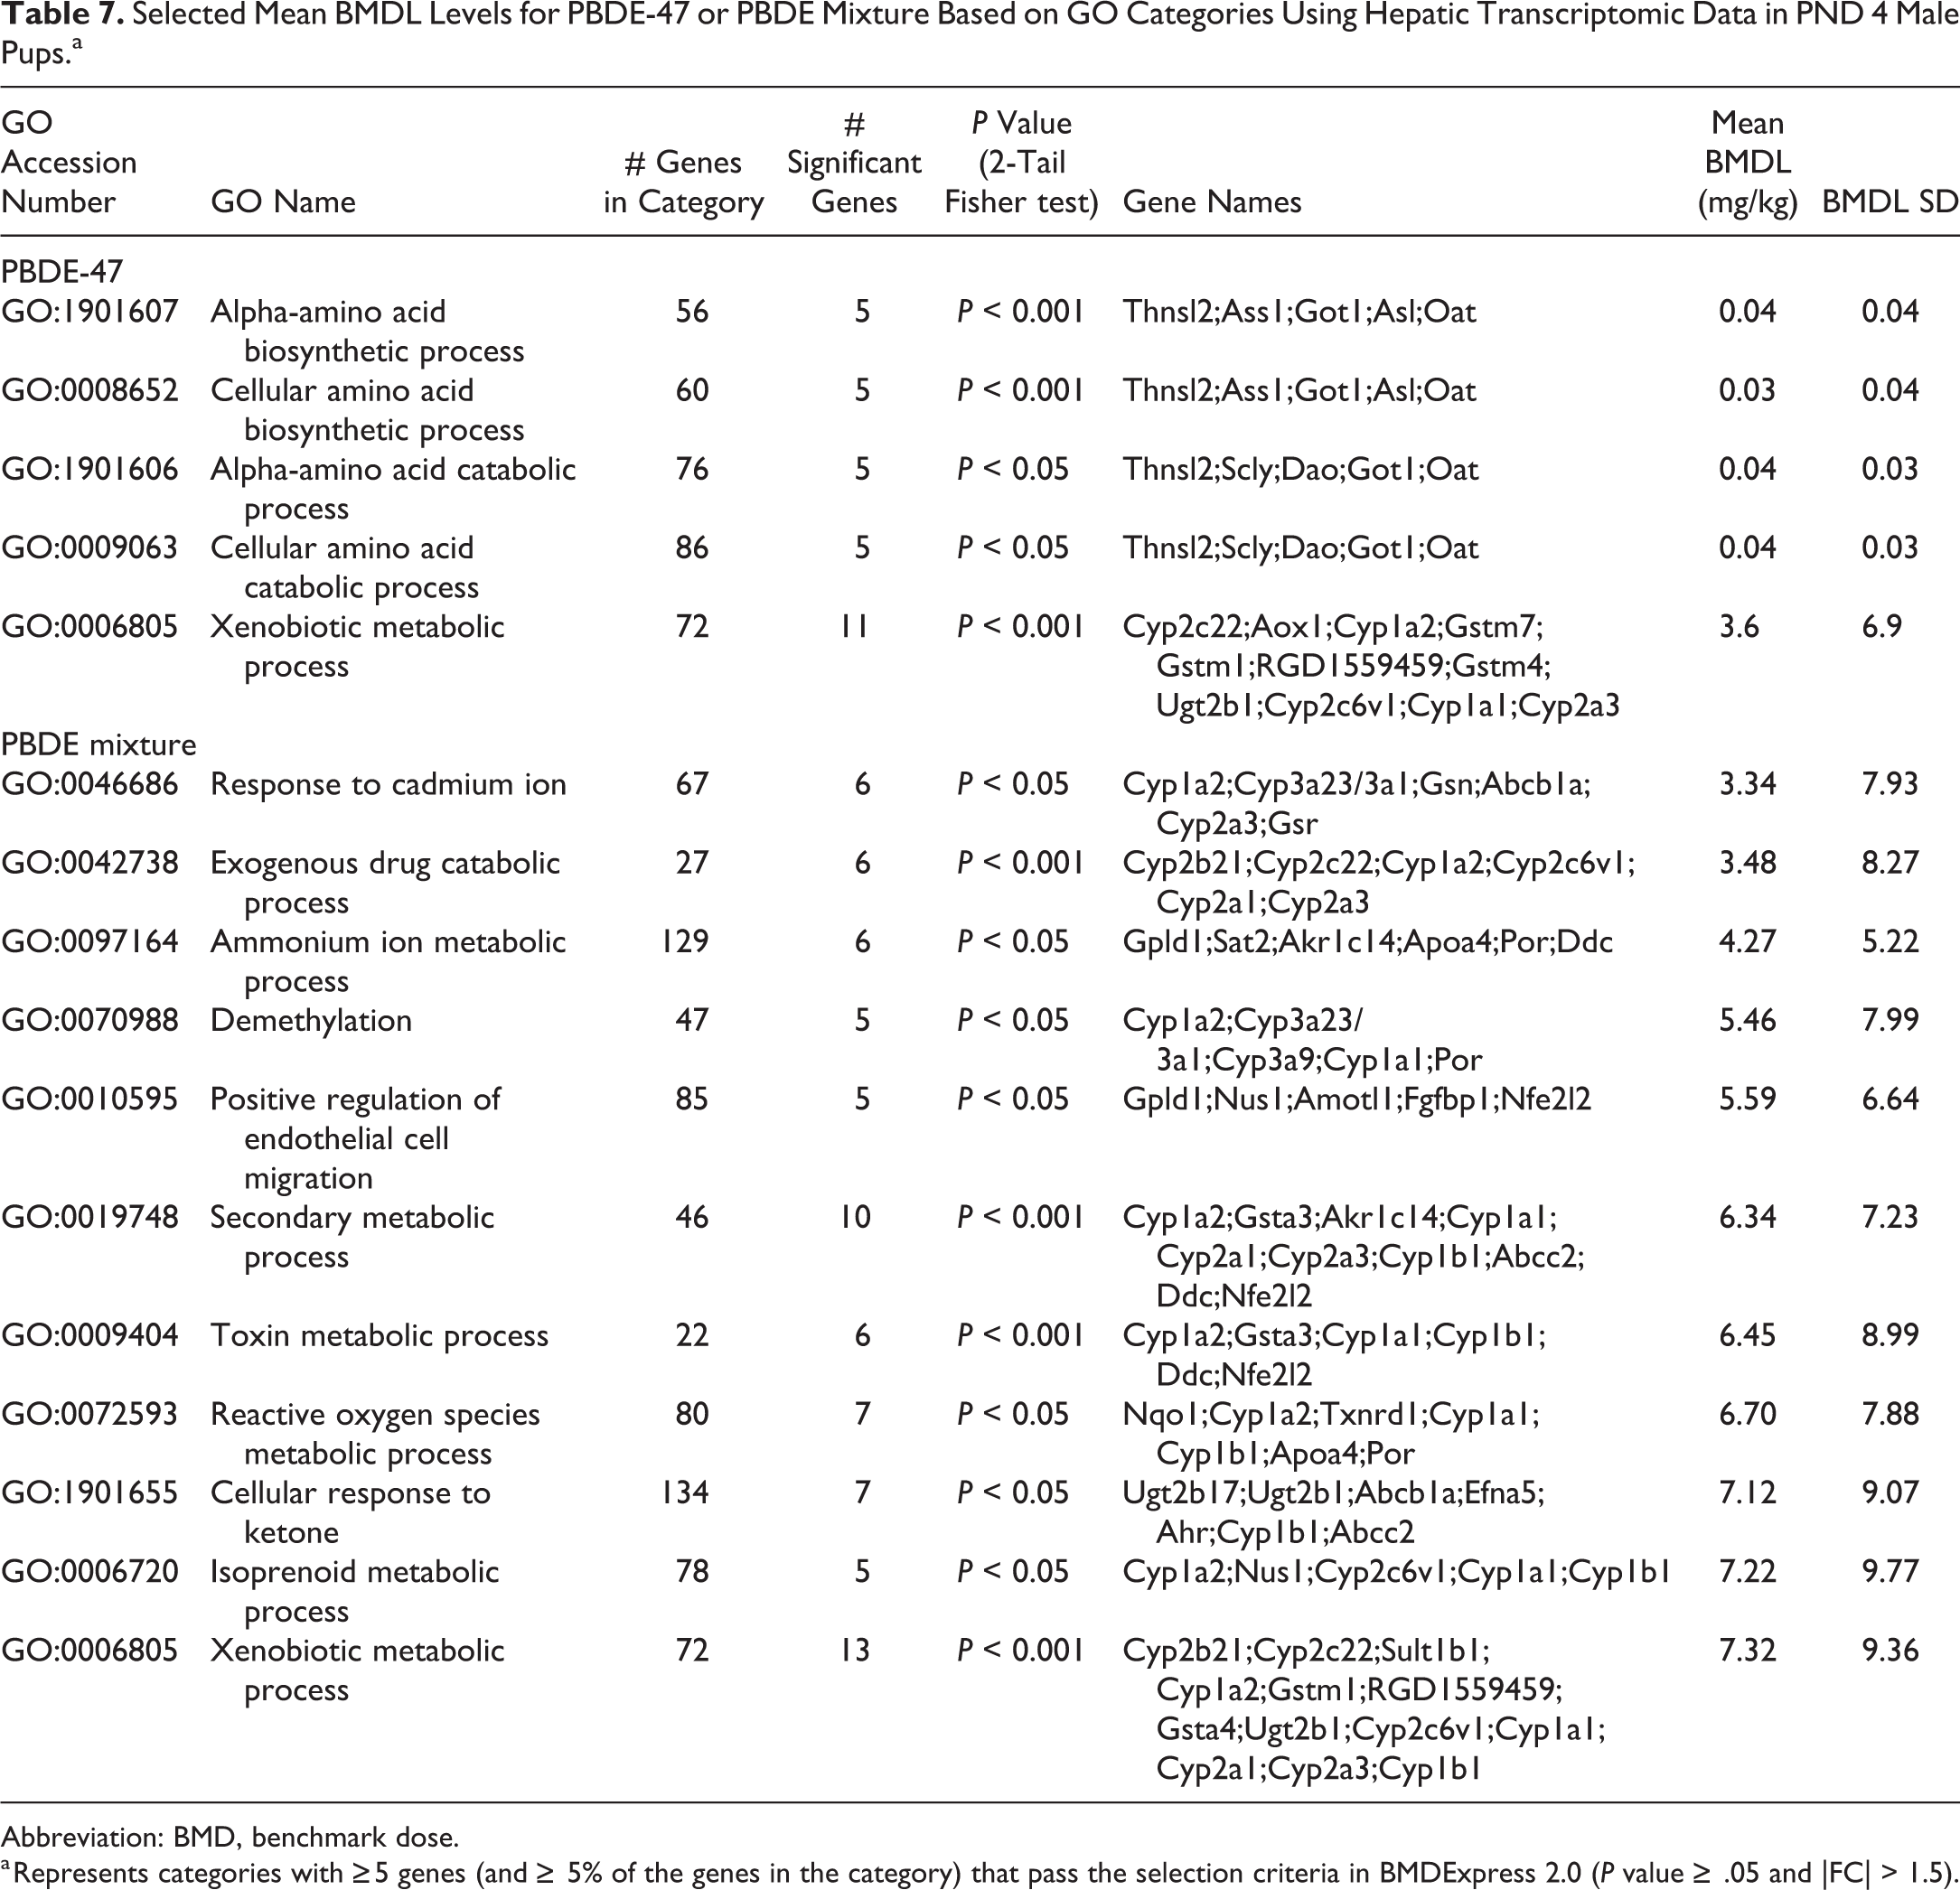
Abbreviation: BMD, benchmark dose.
a Represents categories with ≥5 genes (and ≥ 5% of the genes in the category) that pass the selection criteria in BMDExpress 2.0 (P value ≥ .05 and |FC| > 1.5).
Discussion
We hypothesized that certain health risks from environmental exposures can be identified in neonates after in utero exposures, including decreased thyroid hormone levels, and adding neonatal time points to toxicity studies is key to evaluating risks to humans (Figure 2). Pentabromodiphenyl ethers are structurally similar to thyroxine (T4) and can interfere with thyroid homeostasis and lower T4 levels. 30 Low thyroid hormone levels have been associated with liver disease 31 –33 and progression of liver lesions to liver cancer. 34 –37 With long-term PBDE mixture exposure, hepatic cancers occur in rodent model systems. 10 Here, we report that PBDE-47 or PBDE mixture (DE-71) exposure to the rat dam leads to decreased thyroxine (T4) levels and hepatic transcript change in PND 4 rat pups. Pups do not have a fully functional thyroid system and rely on the dam for supplying sufficient quantities of this hormone. 38
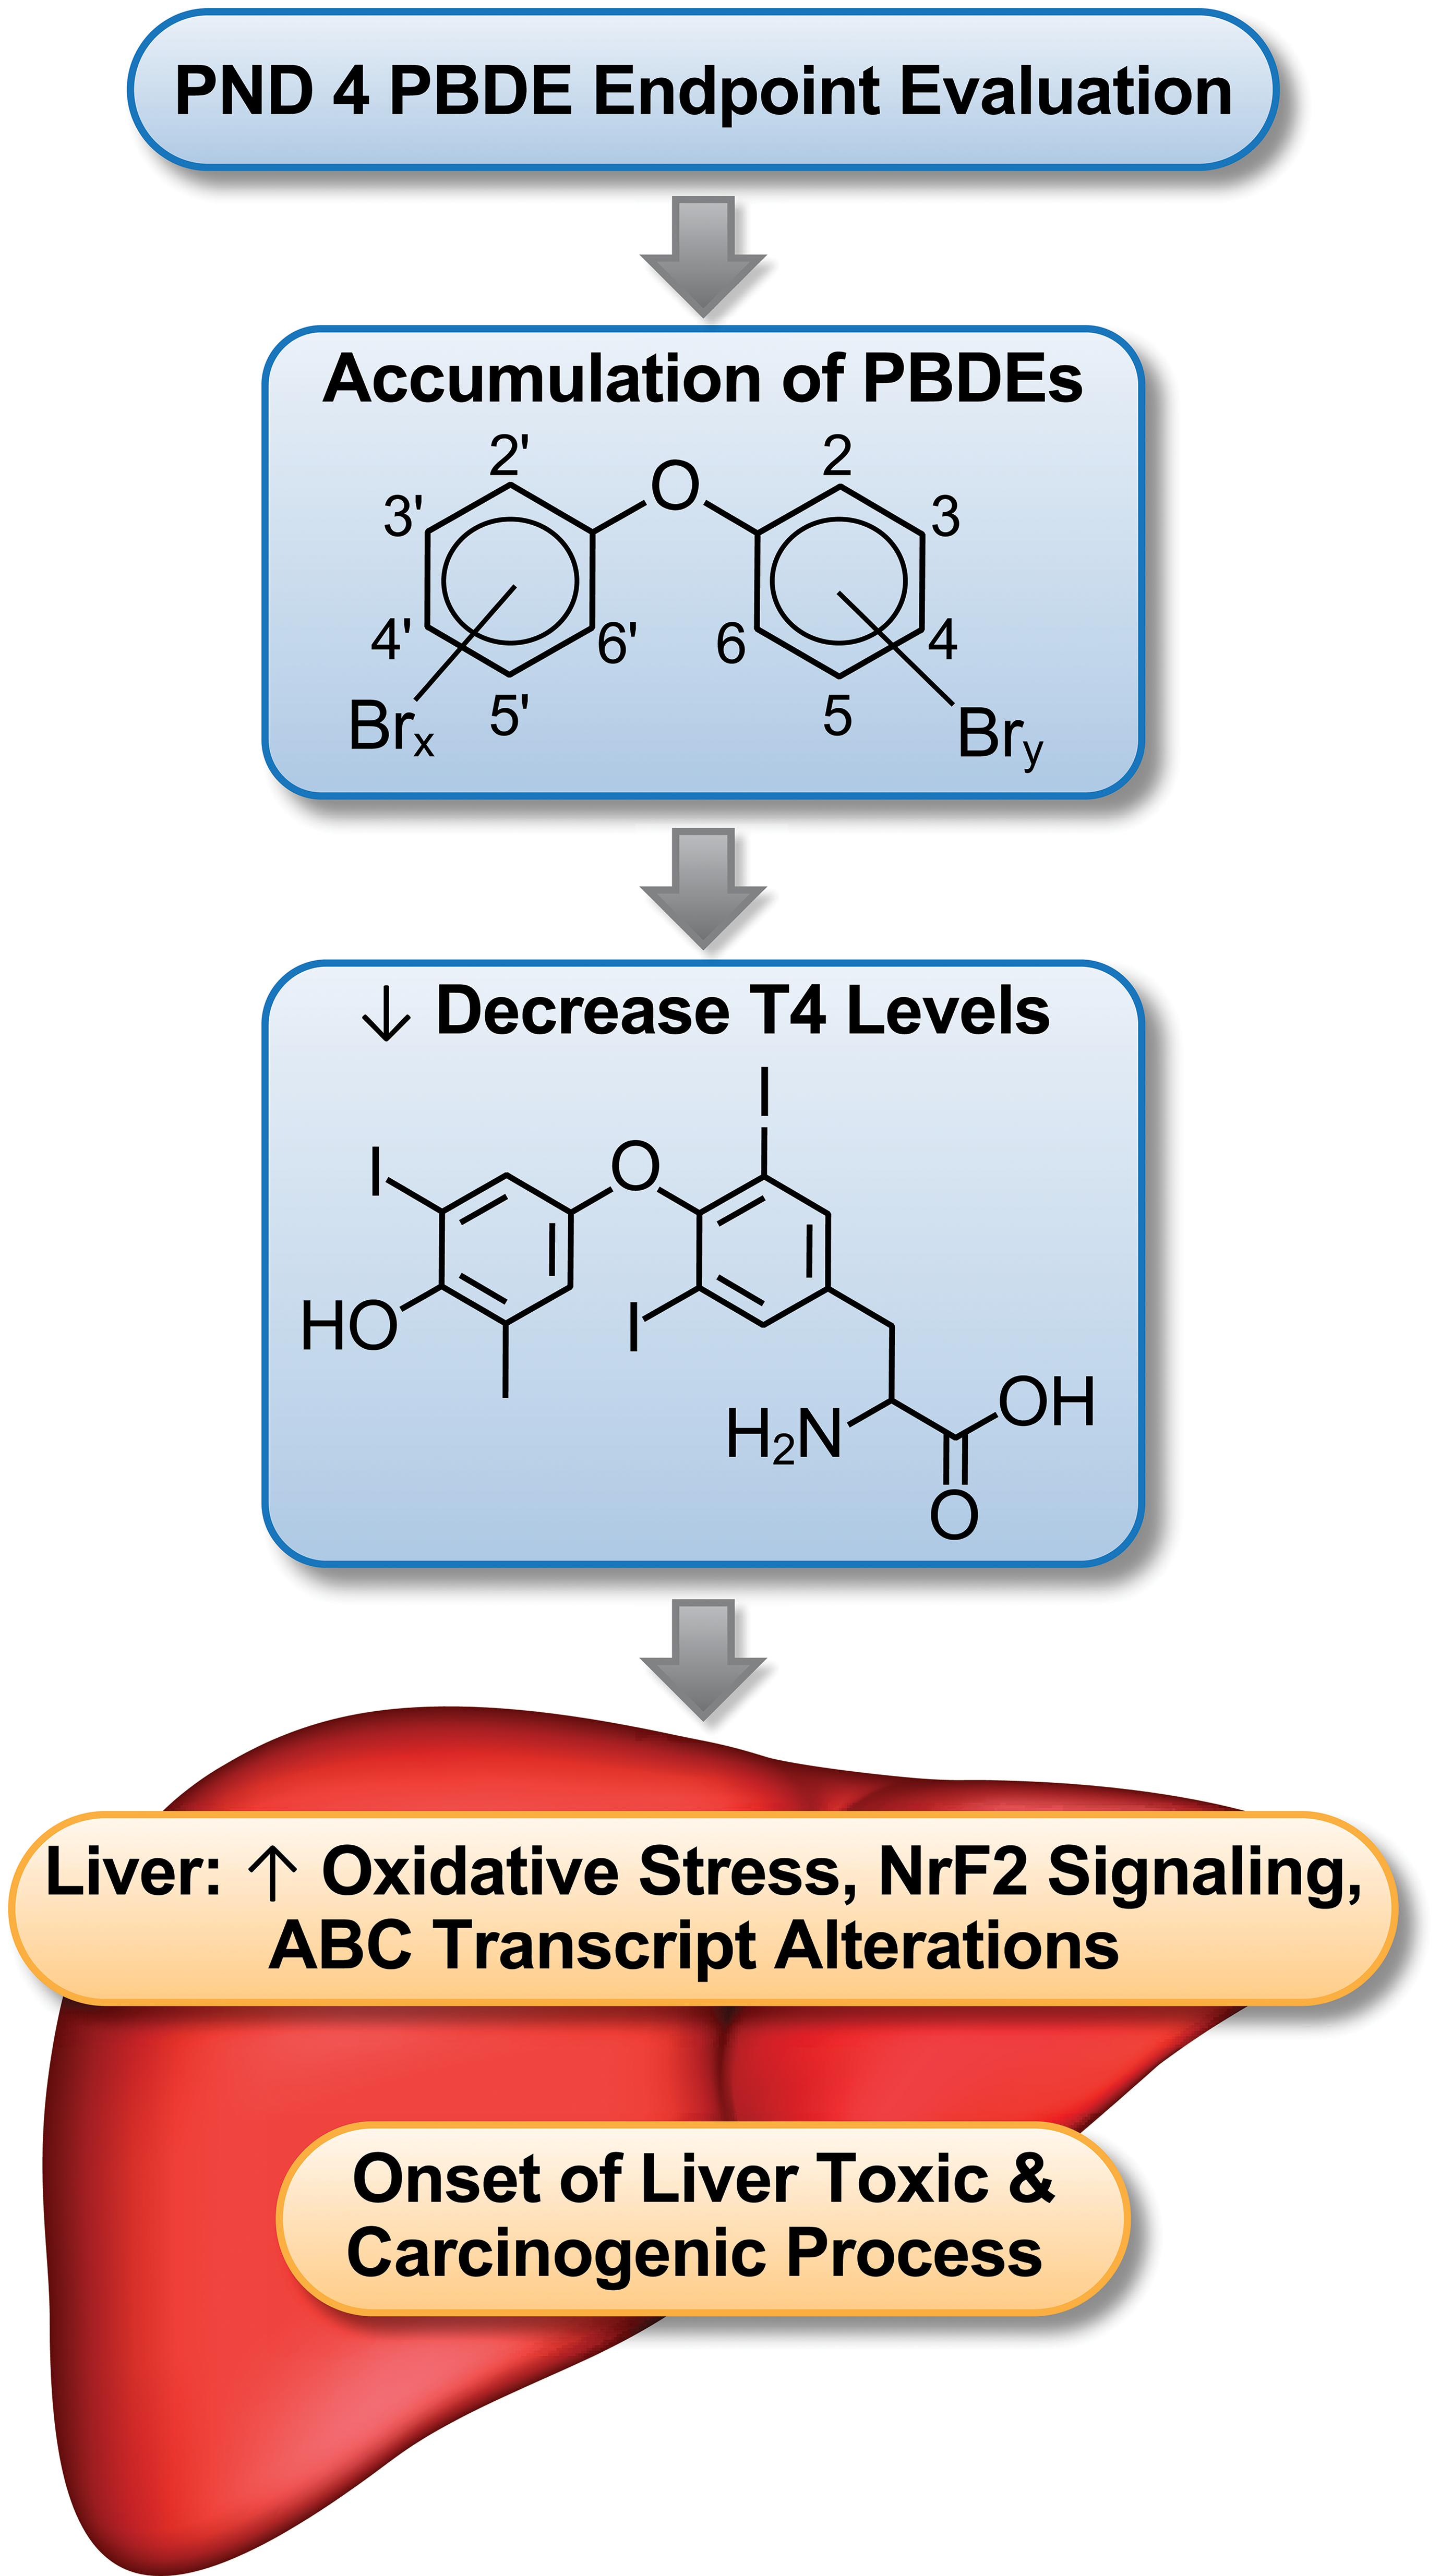
Summary of PBDE-induced toxicity.
Along with decrease in T4 levels there was upregulation of glucuronosyltransferase (UGT) transcripts, enzymes that facilitate the glucuronidation and excretion of thyroid hormones. 39,40 The changes in liver transcriptomic patterns also included increase in metabolic cytochrome p450 transcripts and Nrf2 antioxidant pathway transcripts. Many of these hepatic transcript expression changes were similar to those seen at PND 22 29 after both PBDE-47 and PBDE mixture exposure, and at 13 weeks after PBDE mixture exposure. 41
The hepatic transcript changes were indicative of key characteristics of carcinogens, 42 including increases in metabolic enzyme systems which can metabolize PBDEs to oxygenated metabolites capable of toxicity and free radical formation. 43 –45 The cytochrome P450 transcript changes included those usually expressed in the liver (eg, Cyp2C8, Cyp2C9, Cyp1A2), as well those less abundant in the liver (eg, Cyp2A6, Cyp2B6, Cyp2C19, Cyp3A5). 36,37 Activation of the CAR receptor is associated with upregulation of Cyp2Bs and UGTs. 46 Cyp1a can be induced by both AhR independent and dependent events. 47 There are continuing investigations as to how CAR activation in rodent studies can translate to humans. 48,49
Hydroxylated PBDE metabolites have been shown to cause oxidative stress in various test systems. 50 –52 In addition, PBDEs may be converted to quinone metabolites capable of forming DNA adducts. 53 In this study, the early disease biomarkers of oxidative stress included upregulation of the Nrf2 antioxidant pathway transcripts, 54 an adaptive pathway to combat oxidative stress. 55 Oxidative stress can contribute to liver disease development, 56 and may be one factor in PBDE-induced liver toxicity. 10 Pentabromodiphenyl ether and its metabolites are excreted as glucuronide conjugates, 57 –62 and at PND 4, this glucuronide enzyme activity may not be fully developed. 63 –65
Upregulation of membrane transport transcripts included changes in transcript levels for the ABCC3 and ABCB1 genes (also known as MRP3 and MDR1, respectively) after both PBDE-47 and PBDE mixture exposures. These ABC transporters are members of a family of efflux pumps which transport chemicals and drugs across the hepatocyte membrane, and provide some protection from xenobiotic exposure. 66 Lipid binding to these membrane transporters can affect the conformation of the pump to an abnormal open or closed state leading to disruption of homeostasis. 67,68 Other investigators have also found that brominated chemicals can affect the expression level of membrane transcripts. 69,70
Other treatment-related hepatic transcript changes included upregulation of selected SLC transporters, including upregulation of SLC35E3 (a sugar transporter 71 ), SLC4A4 (a sodium bicarbonate transporter 72 ), SLC22A1 (an organic cation transporter 73 ), and/or SLC26A1 (an anion transporter 74 ). Changes in membrane protein transcripts provide evidence that PBDE exposures alter critical membrane transport systems that govern cellular content and function.
Downregulation of the lipid efflux pump transcripts ABCG5 and ABCG8 was observed at PND 22 29 but not at PND 4. At PND 4, there was little evidence for liver lipid accumulation after PBDE exposure, and pups do not have much fat at this time point in development. 75,76 Thus, at PND 4, the need for lipid efflux pumps is probably not required to maintain homeostasis. Low thyroid hormone levels can lead to accumulation of lipids in the liver, 31 –33 but apparently at PND 4 this is less evident than at PND 22. 29
Minimal hepatic centrilobular vacuolization occurred only with the PBDE mixture suggesting that components in the mixture (other than PBDE-47) may be responsible for this lesion. There are reports in the literature that PBDE-99, present in the mixture, may have some transient effects not found with PBDE-47, 77 –79 and this may account for the hepatic lesions with the PBDE mixture exposure. However, after longer term PBDE-47 exposure hepatic toxic lesions occur in rats. 29
Postnatal day 4 hepatic transcript patterns were used to determine the benchmark dose for PBDE-47 and PBDE mixture. Examination of the results indicated that the PBDE-47 congener had a lower benchmark dose than found with the PBDE mixture. This may be related to the finding that there were more significant hepatic transcript changes after PBDE-47 exposure than after PBDE mixture exposure at the lower exposure levels.
Thyroid hormone levels after PBDE exposure can serve as a translational bridge for PBDE effects, because decreases in T4 levels have been reported in both animals and humans after PBDE exposures. 80,81 Although not studied here, decreases in T4 levels can also lead to development toxicity including decreased neuron formation and maturation. 82,83
A goal of 21st century toxicology studies is to “refine, reduce, and replace” the use of animals in toxicology and risk assessment studies 84 Here, we used fewer animals than in traditional rodent toxicology studies, and showed that PND 4 rat liver transcriptomic patterns provide early indicators of toxicity and/or processes involved in pathways to cancer. 42 These early disease biomarkers may be used to prioritize chemicals for a more complete cancer and risk evaluation. Because PBDE-47 PND 4 hepatic transcript patterns were similar to those after PBDE mixture exposure, we would predict that this PBDE congener would also be a liver carcinogen with longer term exposure.
Supplemental Material
Supplement1 - Hepatic Transcriptomic Patterns in the Neonatal Rat After Pentabromodiphenyl Ether Exposure
Supplement1 for Hepatic Transcriptomic Patterns in the Neonatal Rat After Pentabromodiphenyl Ether Exposure by June K. Dunnick, Keith R. Shockley, Daniel L. Morgan, Gregory S. Travlos, Kevin Gerrish, Thai-Vu T. Ton, Ralph Wilson, Sukhdev S. Brar, Amy E. Brix, Suramya Waidyanatha, Esra Mutlu and Arun Kumar R. Pandiri in Toxicologic Pathology
Supplemental Material
Supplement2 - Hepatic Transcriptomic Patterns in the Neonatal Rat After Pentabromodiphenyl Ether Exposure
Supplement2 for Hepatic Transcriptomic Patterns in the Neonatal Rat After Pentabromodiphenyl Ether Exposure by June K. Dunnick, Keith R. Shockley, Daniel L. Morgan, Gregory S. Travlos, Kevin Gerrish, Thai-Vu T. Ton, Ralph Wilson, Sukhdev S. Brar, Amy E. Brix, Suramya Waidyanatha, Esra Mutlu and Arun Kumar R. Pandiri in Toxicologic Pathology
Supplemental Material
Supplement_3 - Hepatic Transcriptomic Patterns in the Neonatal Rat After Pentabromodiphenyl Ether Exposure
Supplement_3 for Hepatic Transcriptomic Patterns in the Neonatal Rat After Pentabromodiphenyl Ether Exposure by June K. Dunnick, Keith R. Shockley, Daniel L. Morgan, Gregory S. Travlos, Kevin Gerrish, Thai-Vu T. Ton, Ralph Wilson, Sukhdev S. Brar, Amy E. Brix, Suramya Waidyanatha, Esra Mutlu and Arun Kumar R. Pandiri in Toxicologic Pathology
Supplemental Material
Supplement_4 - Hepatic Transcriptomic Patterns in the Neonatal Rat After Pentabromodiphenyl Ether Exposure
Supplement_4 for Hepatic Transcriptomic Patterns in the Neonatal Rat After Pentabromodiphenyl Ether Exposure by June K. Dunnick, Keith R. Shockley, Daniel L. Morgan, Gregory S. Travlos, Kevin Gerrish, Thai-Vu T. Ton, Ralph Wilson, Sukhdev S. Brar, Amy E. Brix, Suramya Waidyanatha, Esra Mutlu and Arun Kumar R. Pandiri in Toxicologic Pathology
Footnotes
Acknowledgments
The authors thank Dr R. Cannon, NCI at NIEHS, and Dr A. Merrick, NIEHS, for their review of the manuscript. All persons gave their informed consent prior to their inclusion in the study. This article does not contain clinical studies or patient data. The findings and conclusions in this presentation have not been formally distributed by the National Toxicology Program and should not be construed to represent any NTP determination or policy.
Declaration of Conflicting Interests
The author (s) declared no potential, real, or perceived conflicts of interest with respect to the research, authorship, and/or publication of this article.
Funding
The author(s) disclosed receipt of the following financial support for the research, authorship, and/or publication of this article: This work was supported by the Intramural Research Program of the NIH, National Institute of Environmental Health Sciences, Intramural Research project ZIA ES103316-04, and performed for the National Toxicology Program, National Institute of Environmental Health Sciences, National Institutes of Health, U.S. Department of Health and Human Services. The in-life phase of the study was conducted under Contract ES-75561 with Alion Science and Technology, Inc. Pentabromodiphenyl ether tissue level measurements under Contract HHSN273201000016C. Statistical support was provided under Contract HHSN273201600011C.
Supplemental Material
Supplemental material for this article is available online.
References
Supplementary Material
Please find the following supplemental material available below.
For Open Access articles published under a Creative Commons License, all supplemental material carries the same license as the article it is associated with.
For non-Open Access articles published, all supplemental material carries a non-exclusive license, and permission requests for re-use of supplemental material or any part of supplemental material shall be sent directly to the copyright owner as specified in the copyright notice associated with the article.