
Abstract
Experimental autoimmune neuritis (EAN) is an animal model for Guillain–Barré syndrome (GBS), which results in neurological symptoms and histopathological changes in peripheral nerves. In this model, the correlation between the progression of the disease and the histopathological changes is not clear. To further examine histopathological changes in peripheral nerves in EAN rats, sciatic nerves were sampled at onset (day 10), peak (day 16), and recovery (days 22 and 25) of neurological symptoms in P2(57-81)-peptide-administered rats. Axon and myelin degeneration was observed by light microscopy at onset, degeneration became severe at peak, and persisted at recovery. Densities of myelinated nerve fibers and myelin areas decreased from day 10 to a minimum on day 22. Slight axon and myelin degeneration, such as accumulation of vesicles in axons and focal myelin splitting and folding, was observed by transmission electron microscopy at onset; severe degeneration, such as axonal loss, myelin ovoid, and demyelination, increased at peak; and regenerative changes, such as remyelination and enlargement of Schwann cell cytoplasm, occurred at recovery. These results suggest that EAN rats have histopathological similarities to some types of GBS patients and that EAN rats are a useful model to understand the pathogenesis of GBS.
Keywords
Guillain–Barré syndrome (GBS) is an acute self-limited polyneuropathy and has several forms (Burns 2008; Kuwabara 2004). Autoimmunity to peripheral nerves underlies the pathogenesis of GBS (Ilyas et al. 1988; Komagamine and Yuki 2006). GBS patients have a monophasic (nonrelapsing) pattern of neurological symptoms such as muscle weakness and paralysis (Burns 2008; Doorn, Ruts, and Jacobs 2008; Osler and Sidell 1960). By histopathology, demyelination and axonal degeneration are observed in peripheral nerves during the peak phase of neurological symptoms (Asbury, Arnason, and Adams 1969; Haymaker and Kernohan 1949).
Experimental autoimmune neuritis (EAN) in rats is the most popular animal model for GBS (Soliven 2014). EAN rats are induced by immunization with peripheral nerve homogenate or by peripheral myelin proteins (e.g., P0, P2, and PMP22), and their neurological symptoms are similar to those in GBS patients (Moalem-Taylor et al. 2007; Soliven 2014). EAN rats typically have a monophasic pattern of a limp tail, muscle weakness, and leg paralysis (Moalem-Taylor et al. 2007). Moreover, axon and myelin degeneration is observed in the peripheral nerves of EAN rats at the peak phase of the neurological symptoms (Yuan et al. 2015). There are no reports of peripheral nerve histopathology before and after the peak of clinical symptoms in P2-induced EAN rats, and some other types of EAN rats have functional loss before changes in structural nerves (Hadden et al. 2002). Furthermore, there are no reports of time-dependent histopathological changes in peripheral nerves in EAN rats, which makes it difficult to determine when axon and myelin degeneration occurs and recovers in peripheral nerves in EAN rats. Therefore, we examined changes in peripheral nerves and the correlation between histopathological changes and neurological symptoms during disease progression in EAN rats.
Materials and Methods
Animal Experiments
Male Lewis rats (6 or 7 weeks old) were purchased from Charles River Laboratories, Japan Inc. (Yokohama, Japan), housed in plastic cages with softwood chip bedding under controlled conditions (12-hr light/dark cycle, 40–70% humidity at 21–25°C), and fed a standard diet (CRF-1, Oriental Yeast Co. Ltd., Tokyo, Japan) and tap water ad libitum. The animal experiments were reviewed by the head of the test facility and performed in accordance with the Guideline for the Animal Experiments, Research & Development Division, Toray Industries, Inc., Kanagawa, Japan.
Experimental Design
Two treatment groups were used as follows: EAN rats were immunized with self-antigen, P2(57-81) (immunogenic P2 peptide of peripheral myelin, amino acids 57-81) emulsified with complete Freund’s adjuvant (CFA) on day 0. Normal rats at the same age that were not treated were used as a control.
Every day, except for days 6 and 25, EAN rats were weighed, and clinical signs were observed and scored based on a modified protocol from Moalem-Taylor et al. (2007) as follows: 0, no overt signs; 1, limp tail or hind limb weakness but not both; 2, limp tail and hind limb weakness; 3, partial hind limb paralysis; 4, complete hind limb paralysis; 5, moribund state or death. “Limp tail” represents a state when an observer’s finger is placed on a rat tail and does not result in the tail winding around the finger. “Hind limb weakness” represents a state when a footpad is forced to face upward, and it remains in that state more than 3 sec. “Partial hind limb paralysis” represents a state when a footpad is always facing upward. “Complete hind limb paralysis” represents a state when both footpads are always facing upward. EAN rats were allocated to four groups with the SAS system (version 9.3, SAS Institute Japan Ltd., Tokyo, Japan) and were sacrificed on day 10 (symptoms onset), day 16 (symptoms peak), and days 22 and 25 (recovery period; N = 4 rats per day). Normal rats were sacrificed at 8 weeks old (N = 3 rats).
Induction and Clinical Evaluation of EAN
Peripheral myelin protein P2(57-81) synthesized by Toray Research Center, Inc. (Kanagawa, Japan) was dissolved in saline (2 mg/ml) and then emulsified with the same volume of CFA (Difco Laboratories Inc., Detroit, MI) containing Mycobacterium tuberculosis H37Ra (Becton Dickinson, Franklin Lakes, NJ) to a final concentration of 2 mg/ml. On day 0, rats were immunized by intradermal inoculation with 200 μl of the emulsion into the root of the tail under isoflurane anesthesia.
Histopathology
Rats were killed under sodium pentobarbital anesthesia and perfused intracardially with 4% paraformaldehyde (PFA) and 1% glutaraldehyde (GA) in phosphate-buffered saline (PBS; pH 7.2–7.3). Left sciatic nerves (proximal, from lumber spine to caput femoris) were collected and fixed in 2% PFA and 2% GA in 0.1 M cacodylate-buffered solution (CBS; pH 7.4) and 2% osmium tetroxide in 0.1 M CBS. After dehydration in graded ethanol solutions, the samples were embedded in epoxy resin (Quetol-812; Nisshin EM Co., Tokyo, Japan). Semithin sections were sliced at 1.5 μm using an Ultracut UCT (Leica Microsystems Inc., Vienna, Australia), stained with 0.5% toluidine blue in PBS, and observed using a light microscope. Ultrathin sections were sliced at 70 nm using an Ultracut UCT, stained with 2% uranyl acetate solution and lead stain solution (Sigma-Aldrich, Tokyo, Japan), and observed using a transmission electron microscope (TEM; JEM-1400Plus; JEOL Ltd., Tokyo, Japan) at 80 kV. For image analysis, three digital images (2,048 × 2,048 pixels) per animal were randomly taken with a charge Coupled device (CCD) camera (VELETA; Olympus Soft Imaging Solutions GmbH, Münster, Germany) by Tokai Electron Microscopy, Inc. (Aichi, Japan).
Right sciatic nerves (proximal, from lumber spine to caput femoris; distal, from caput femoris to knee joint) and left and right spinal nerves of dorsal roots were postfixed in 10% neutral-buffered formalin, embedded in paraffin, and sectioned at 2 µm. Inflammatory cell infiltration was evaluated by hematoxylin and eosin (H&E) staining (−: not marked, +: slight, ++: moderate, +++: marked). Myelin was stained with Luxol fast blue (LFB) and contrast-stained with H&E (LFB-H&E). Axons were immunostained with antineurofilament protein (NFP) antibody. In brief, cross- and transverse sections were incubated with 3% H2O2 in methanol for 5 min at room temperature (RT) and then were incubated with nonspecific staining blocking reagent (Dako North America, Inc., Carpinteria, CA) for 30 min at RT. The sections were incubated with antimouse NFP monoclonal antibody (Dako North America, Inc.) diluted in antibody diluent, background reducing (Dako North America, Inc.) for 60 min at RT. Antibody binding to tissue sections was visualized with N-Histofine Simple Stain Rat MAX-PO (MULTI; Nichirei Bioscience Inc., Tokyo, Japan) and N-Histofine DAB Substrate Kit (Nichirei Bioscience Inc.). Hematoxylin was used as a counterstain. Myelin and axonal degeneration was evaluated in the degenerated area: −: not marked, −/+: very slight (a few spots), +: slight (<10%), ++: moderate (10–40%), +++: marked (40–80%), ++++: severe (>80%).
TEM Image Analysis
Three TEM images per animal were transferred to gray scale images using Adobe® Photoshop® CS2 (version 9.0; Adobe Systems Inc., San Jose, CA). Images were converted to red-colored images and saved as JPEG format files. The JPEG files were used for image analysis by Tissue Studio™ (version 4.3; Definiens AG, München, Germany). In the image analysis of myelinated nerve fibers, each individual myelinated nerve fiber was recognized by Tissue Studio. Myelinated nerve fiber densities were calculated by the number of myelinated nerve fibers per analyzed area (0.0464 mm2/animal). Myelinated nerve fiber diameters were the means of the length and the width of each individual myelinated nerve fiber. In image analysis of myelin areas, red-colored myelin was recognized by Tissue Studio. The following attributes were counted using three TEM images per animal (0.0464 mm2/animal), and the attributes were in reference to Norman (2009) and Oka (2010): accumulation of vesicles in axons (involves accumulation of mitochondria and/or membranous dense bodies in axon), axonal swelling, axonal loss (represents axonal loss with a normal myelin sheath structure), mild focal splitting (represents myelin that is focally splitting, but the thickness and density of the myelin sheath is even), focal splitting (represents myelin that is focally splitting, and the thickness and density of the myelin sheath is uneven), focal folding (infoldings and/or outfoldings of myelin), intramyelinic edema, naked axons (demyelination), tomacula (represents hypertrophied myelin sheath), myelin ovoid (represents axonal loss with a degenerated myelin sheath), thin myelin (remyelination), and enlargement of Schwann cell cytoplasm (represents an area of Schwann cell cytoplasm that is obviously larger than that of the axon).
Statistical Analysis
Differences between multiple groups were examined using Dunnett’s multiple comparison test or Steel’s test with the SAS statistical analysis program. The level of significance was set at 5%.
Results
Clinical Score
Clinical scores were examined every day except for days 6 and 25 in EAN rats (Figure 1, Table 1, and Online Supplemental Table 1) because from our background study data, no changes occurred on days 6 and 25 (data not shown). Clinical scores for neurological symptoms increased from days 8 to 10, reached a maximum on days 13 to 16, and recovered by day 24.
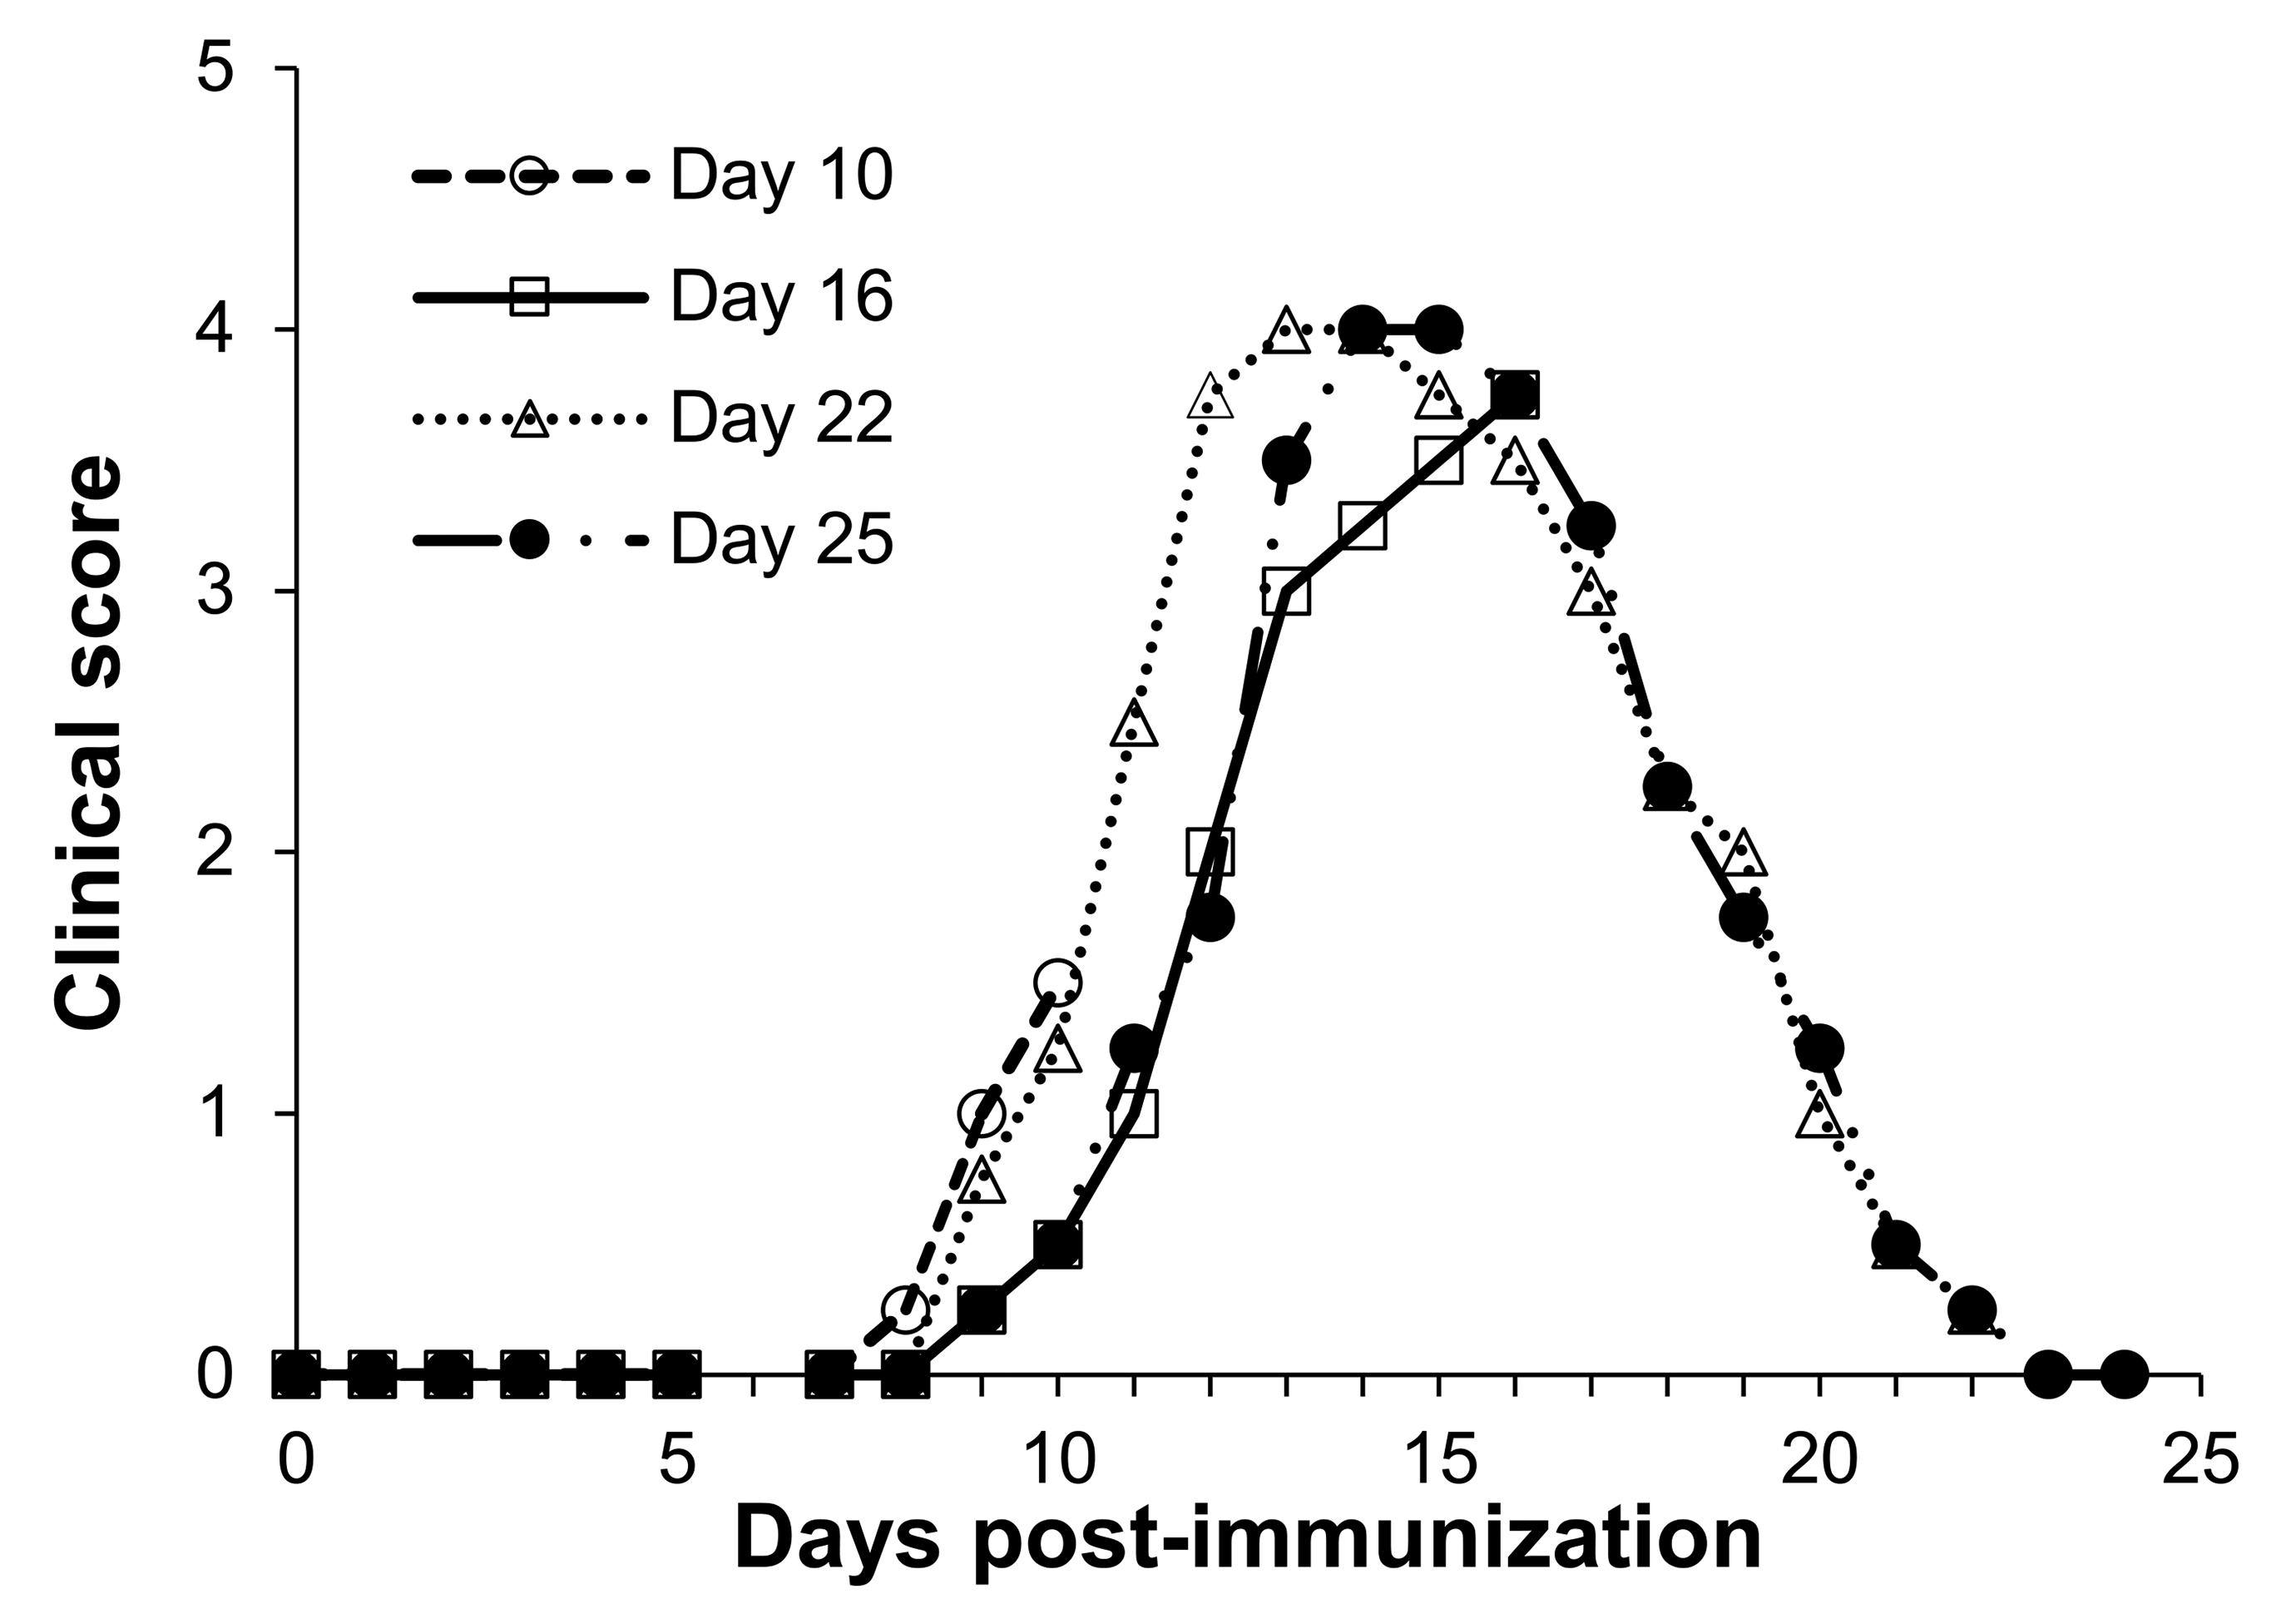
Time course of clinical scores in experimental autoimmune neuritis rats. Each point is mean (n = 4).
Time Course of Clinical Scores in EAN Rats.
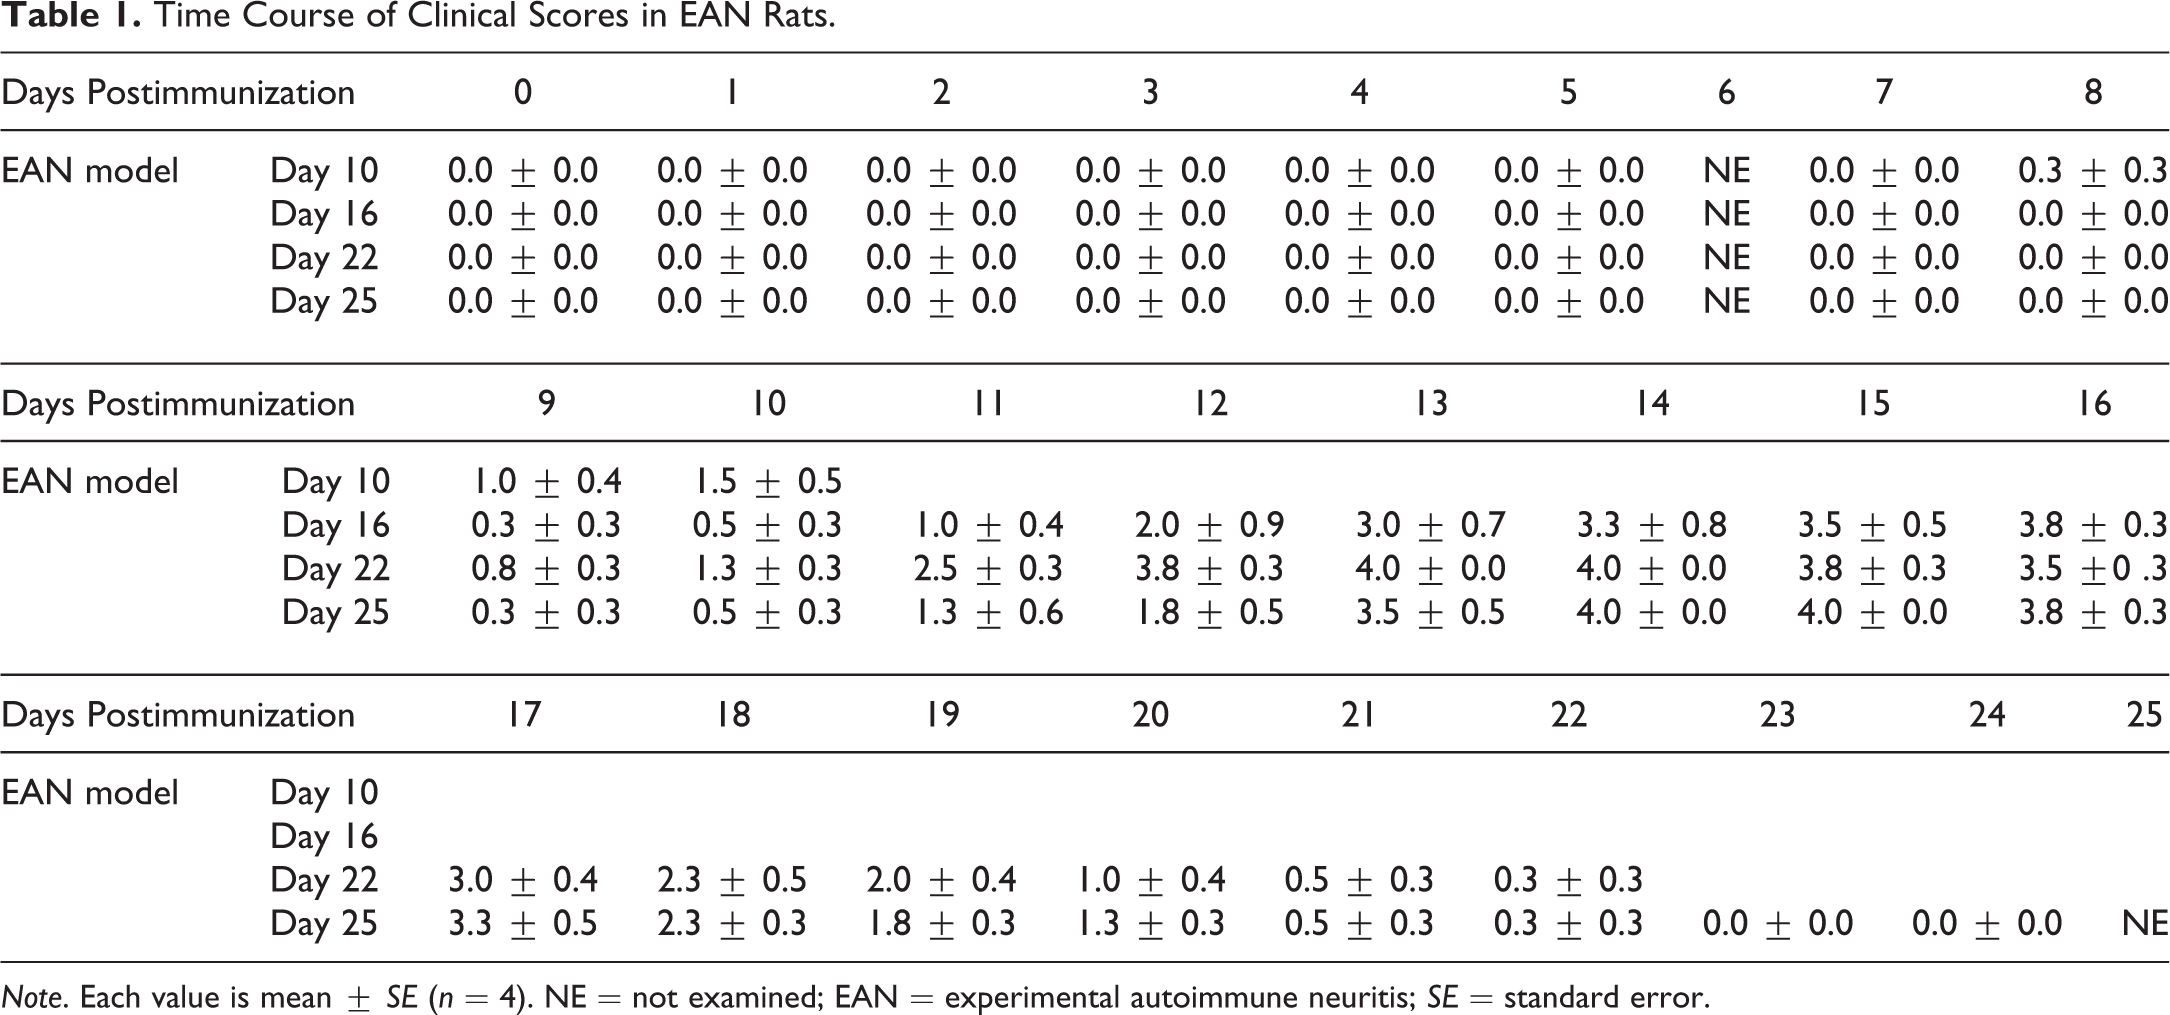
Note. Each value is mean ± SE (n = 4). NE = not examined; EAN = experimental autoimmune neuritis; SE = standard error.
Light Microscopy
No significant changes were observed in sciatic nerves in normal rats (Figure 2, Table 2, and Online Supplemental Table 1). In proximal sciatic nerves of EAN rats, very slight to moderate myelin degeneration, moderate axonal degeneration, slight to moderate infiltration of neutrophils and mononuclear cells, a slight increase in fibroblasts and/or Schwann cells, and hemorrhage around blood capillaries were observed on day 10. The inflammatory lesions were focal to diffuse and mainly observed around the vessels. Degeneration was focally observed in the inflammatory area. A small increase in axon and myelin degeneration and a decrease in the density of axons and myelin were observed on day 10. On day 16, moderate to severe myelin degeneration, moderate to very severe axonal degeneration, slight infiltration of neutrophils, severe infiltration of mononuclear cells, slight to moderate increase in fibroblasts and/or Schwann cells, and hemorrhage around blood capillaries were observed. The inflammatory lesions were diffuse, and the lesions were more severe around the vessels. The degenerative lesions were multifocal to diffuse and were accompanied by mononuclear infiltration but not always related to the severity of the infiltration. Axon and myelin degeneration and a decrease in the density of axons and myelin became more severe on day 16 compared to that on day 10. On day 22, severe myelin degeneration, severe axonal degeneration, severe infiltration of mononuclear cells, a moderate increase in fibroblasts and/or Schwann cells, and hemorrhage around blood capillaries were observed. The inflammatory lesions were diffuse and were not always localized around vessels. Degeneration was diffuse and not always related to the severity of the infiltration. Axon and myelin degeneration and a decrease in the density of axons and myelin became more severe on day 22 compared to that on day 10. On day 25, moderate to severe myelin degeneration, moderate to severe axonal degeneration, moderate to severe infiltration of mononuclear cells, a slight to moderate increase in fibroblasts and/or Schwann cells, and hemorrhage around blood capillaries were observed. The distribution of inflammatory lesions and degenerative lesions was diffuse. Axon and myelin degeneration and a decrease in the density of axons and myelin became more severe on day 25 compared to that on day 10. In the semithin toluidine blue staining sections, the same changes were observed by H&E, LFB-H&E, and NFP staining. These histopathological changes were observed in sciatic nerves at a proximal site from the caput femoris. The same changes were also observed in sciatic nerves at a distal site from the caput femoris and in spinal nerves of dorsal roots. The changes of distal sciatic nerves were more severe compared to that of proximal nerves especially on days 22 and 25, and the changes of spinal nerves of dorsal roots were less severe compared to that of proximal nerves (Table 2). We observed dorsal root ganglions by chance in a few samples on days 16, 22, and 25, but there were no detectable changes in H&E-stained sections (data not shown).
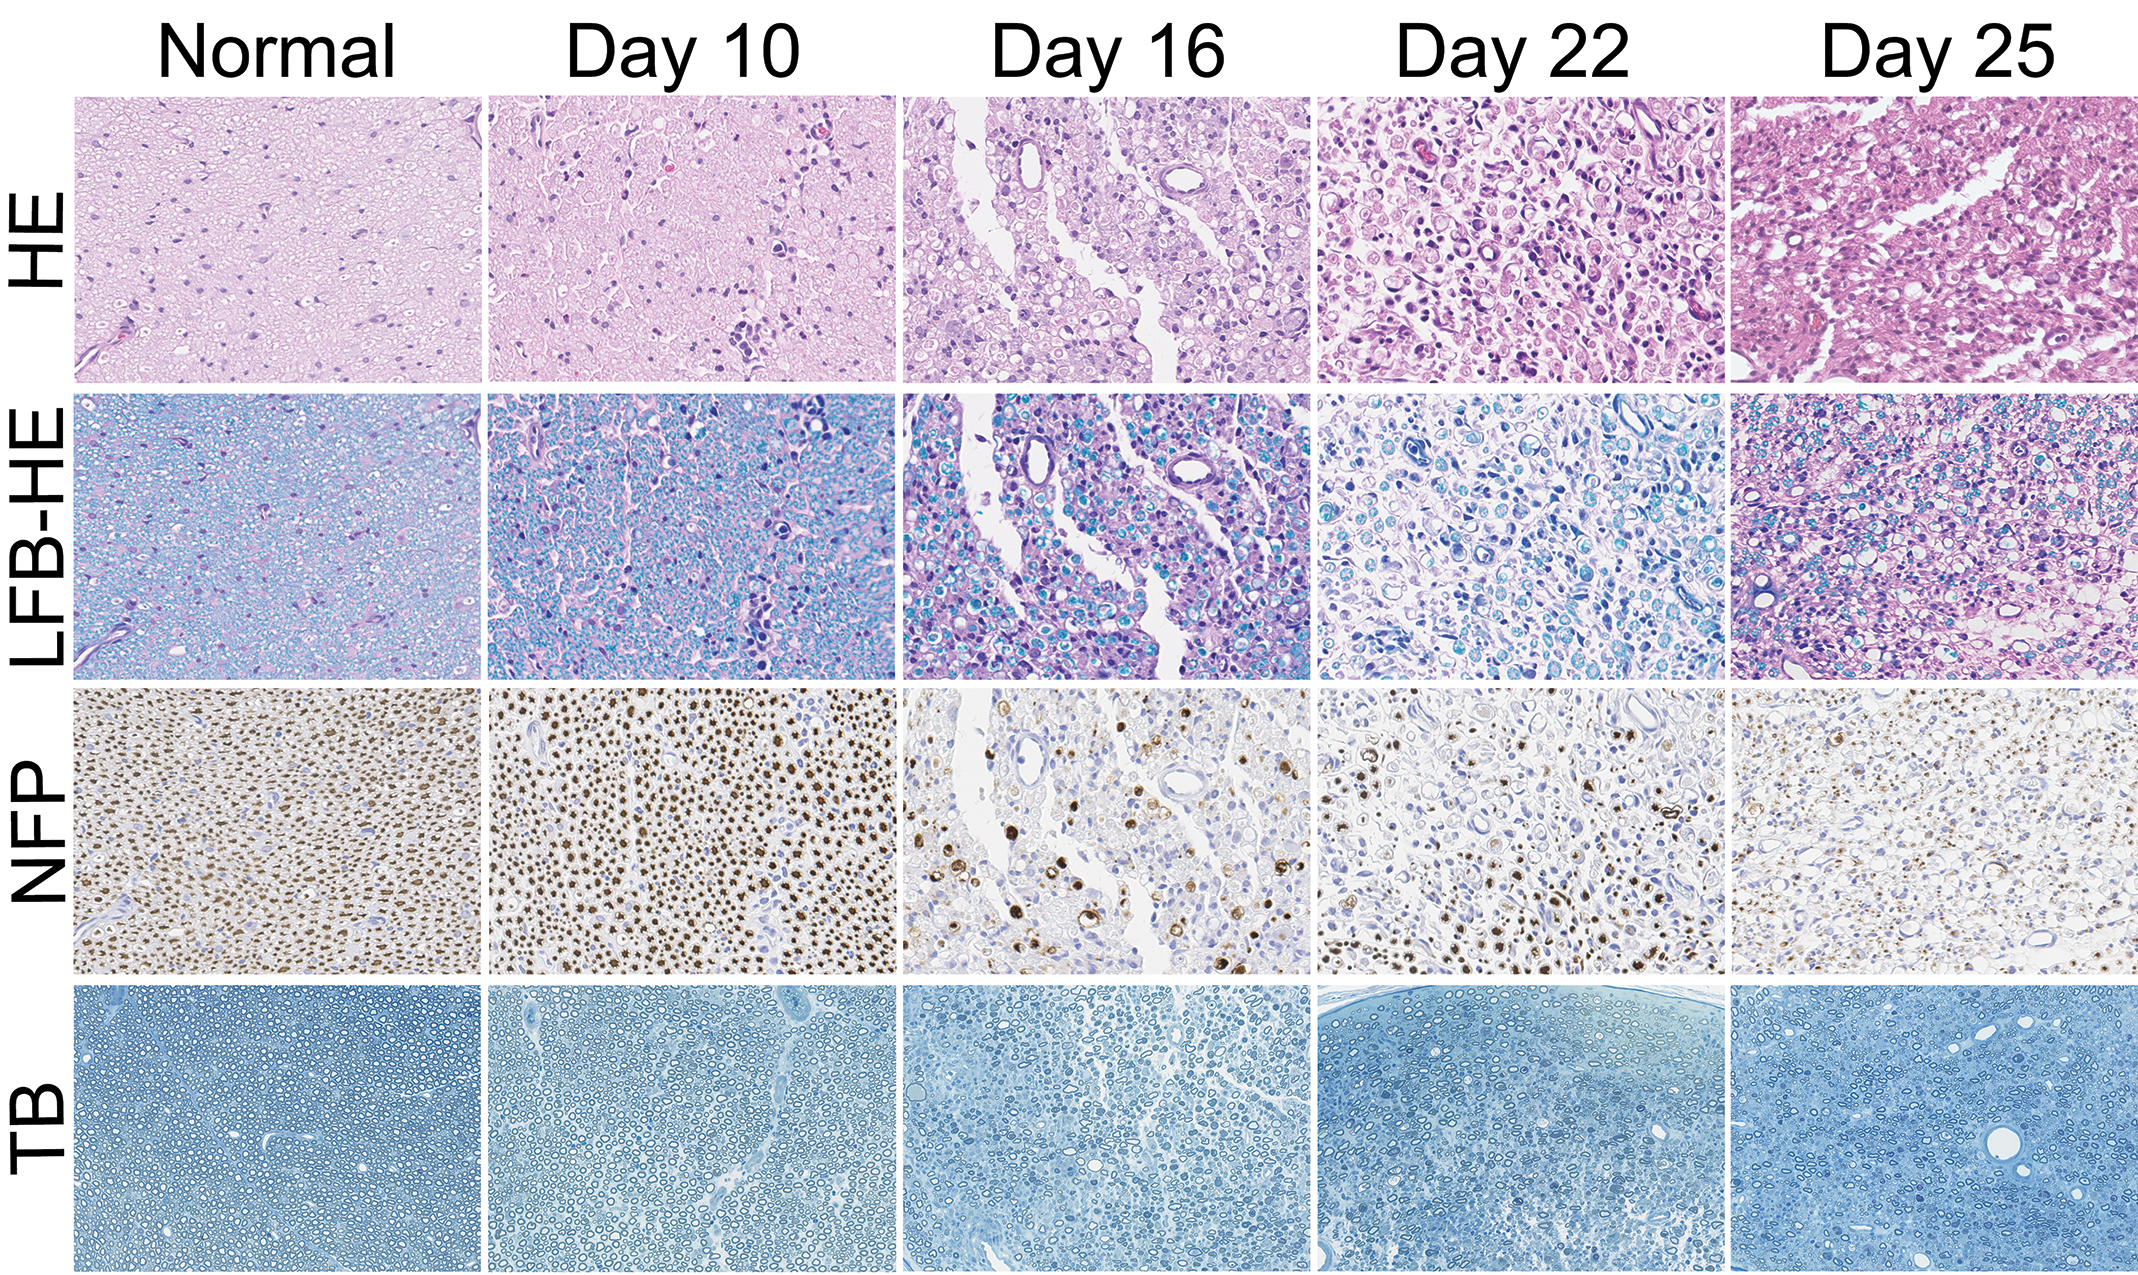
Time course of histopathological changes of sciatic nerves in normal and experimental autoimmune neuritis (EAN) rats. Axon and myelin degeneration appeared on day 10, increased in frequency and degree on day 16, and persisted on days 22 and 25 in EAN rats. HE = hematoxylin and eosin; LFB-HE = Luxol fast blue and contrast-stained with HE; NFP = immunohistochemical staining for neurofilament protein (axon marker); TB = toluidine blue.
Time Course of Histopathological Changes in Peripheral Nerves in Normal and EAN Rats.
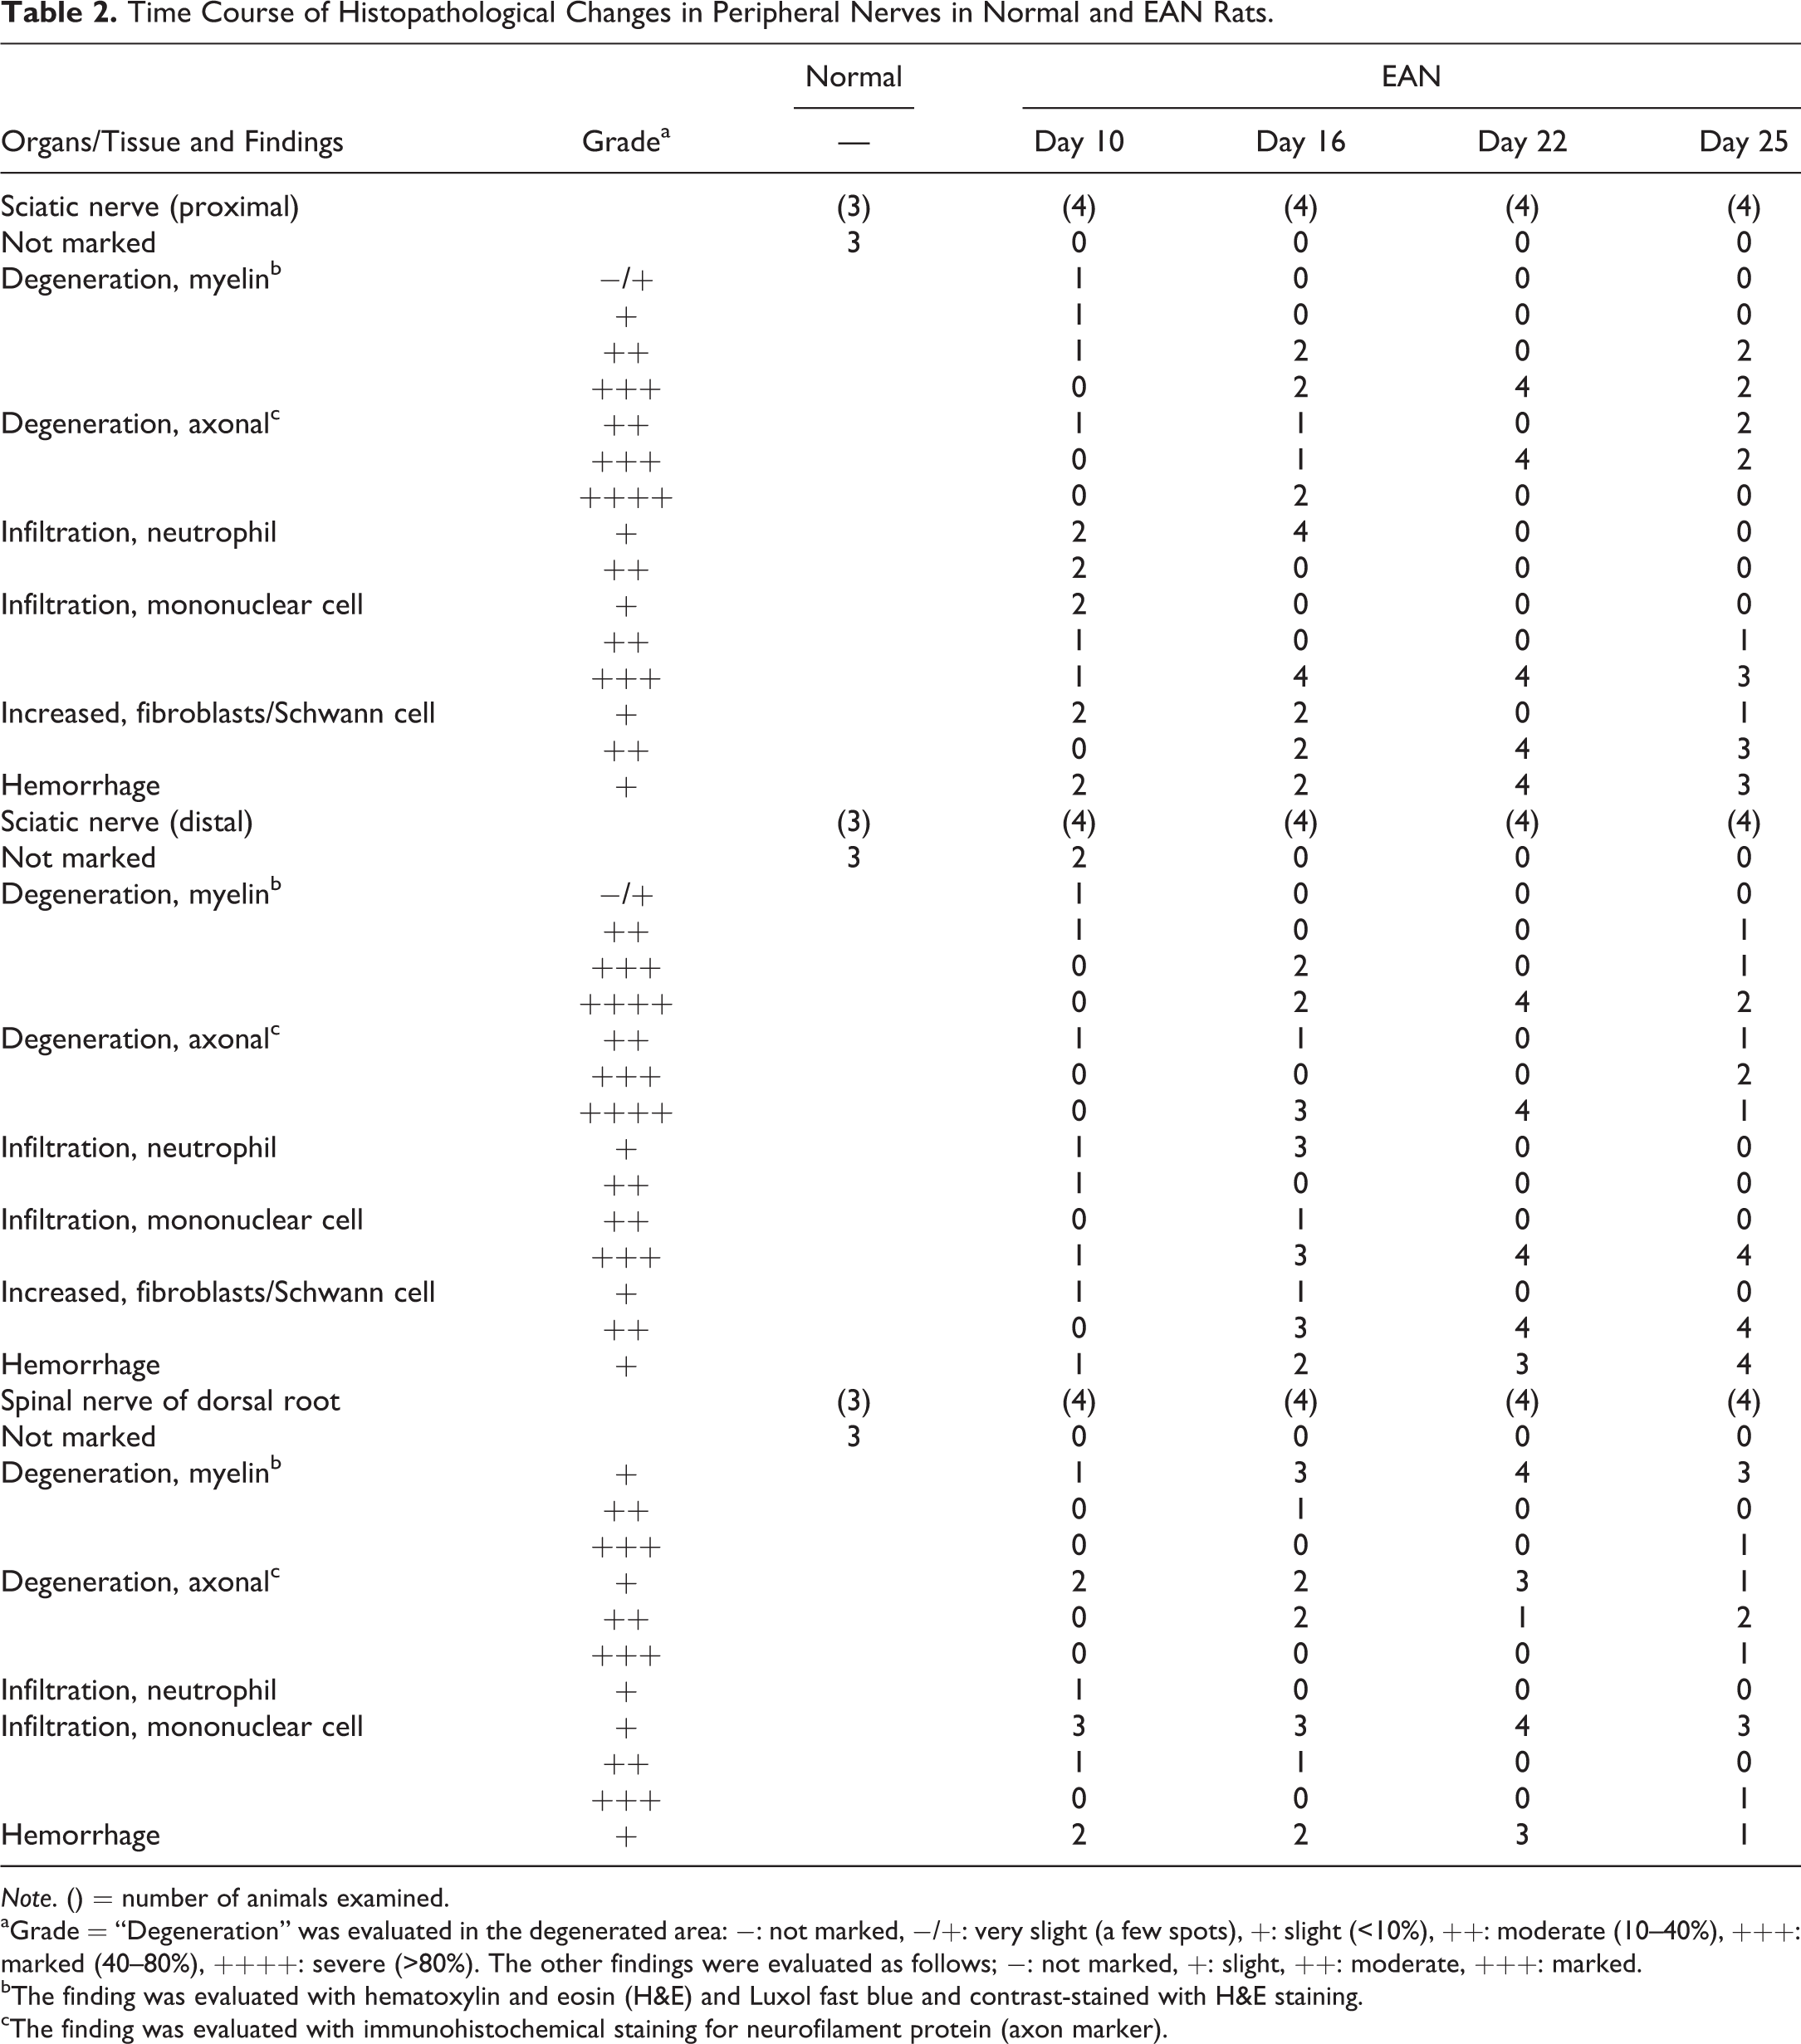
Note. () = number of animals examined.
aGrade = “Degeneration” was evaluated in the degenerated area: −: not marked, −/+: very slight (a few spots), +: slight (<10%), ++: moderate (10–40%), +++: marked (40–80%), ++++: severe (>80%). The other findings were evaluated as follows; −: not marked, +: slight, ++: moderate, +++: marked.
bThe finding was evaluated with hematoxylin and eosin (H&E) and Luxol fast blue and contrast-stained with H&E staining.
cThe finding was evaluated with immunohistochemical staining for neurofilament protein (axon marker).
TEM Image Analysis
No significant changes were observed in sciatic nerves in normal rats by TEM (Figure 3). On day 10, a small increase in axon and myelin degeneration and a decrease in the density of axons and myelin were also observed in peripheral nerves. On days 16 to 25, these changes became more severe compared to those on day 10.
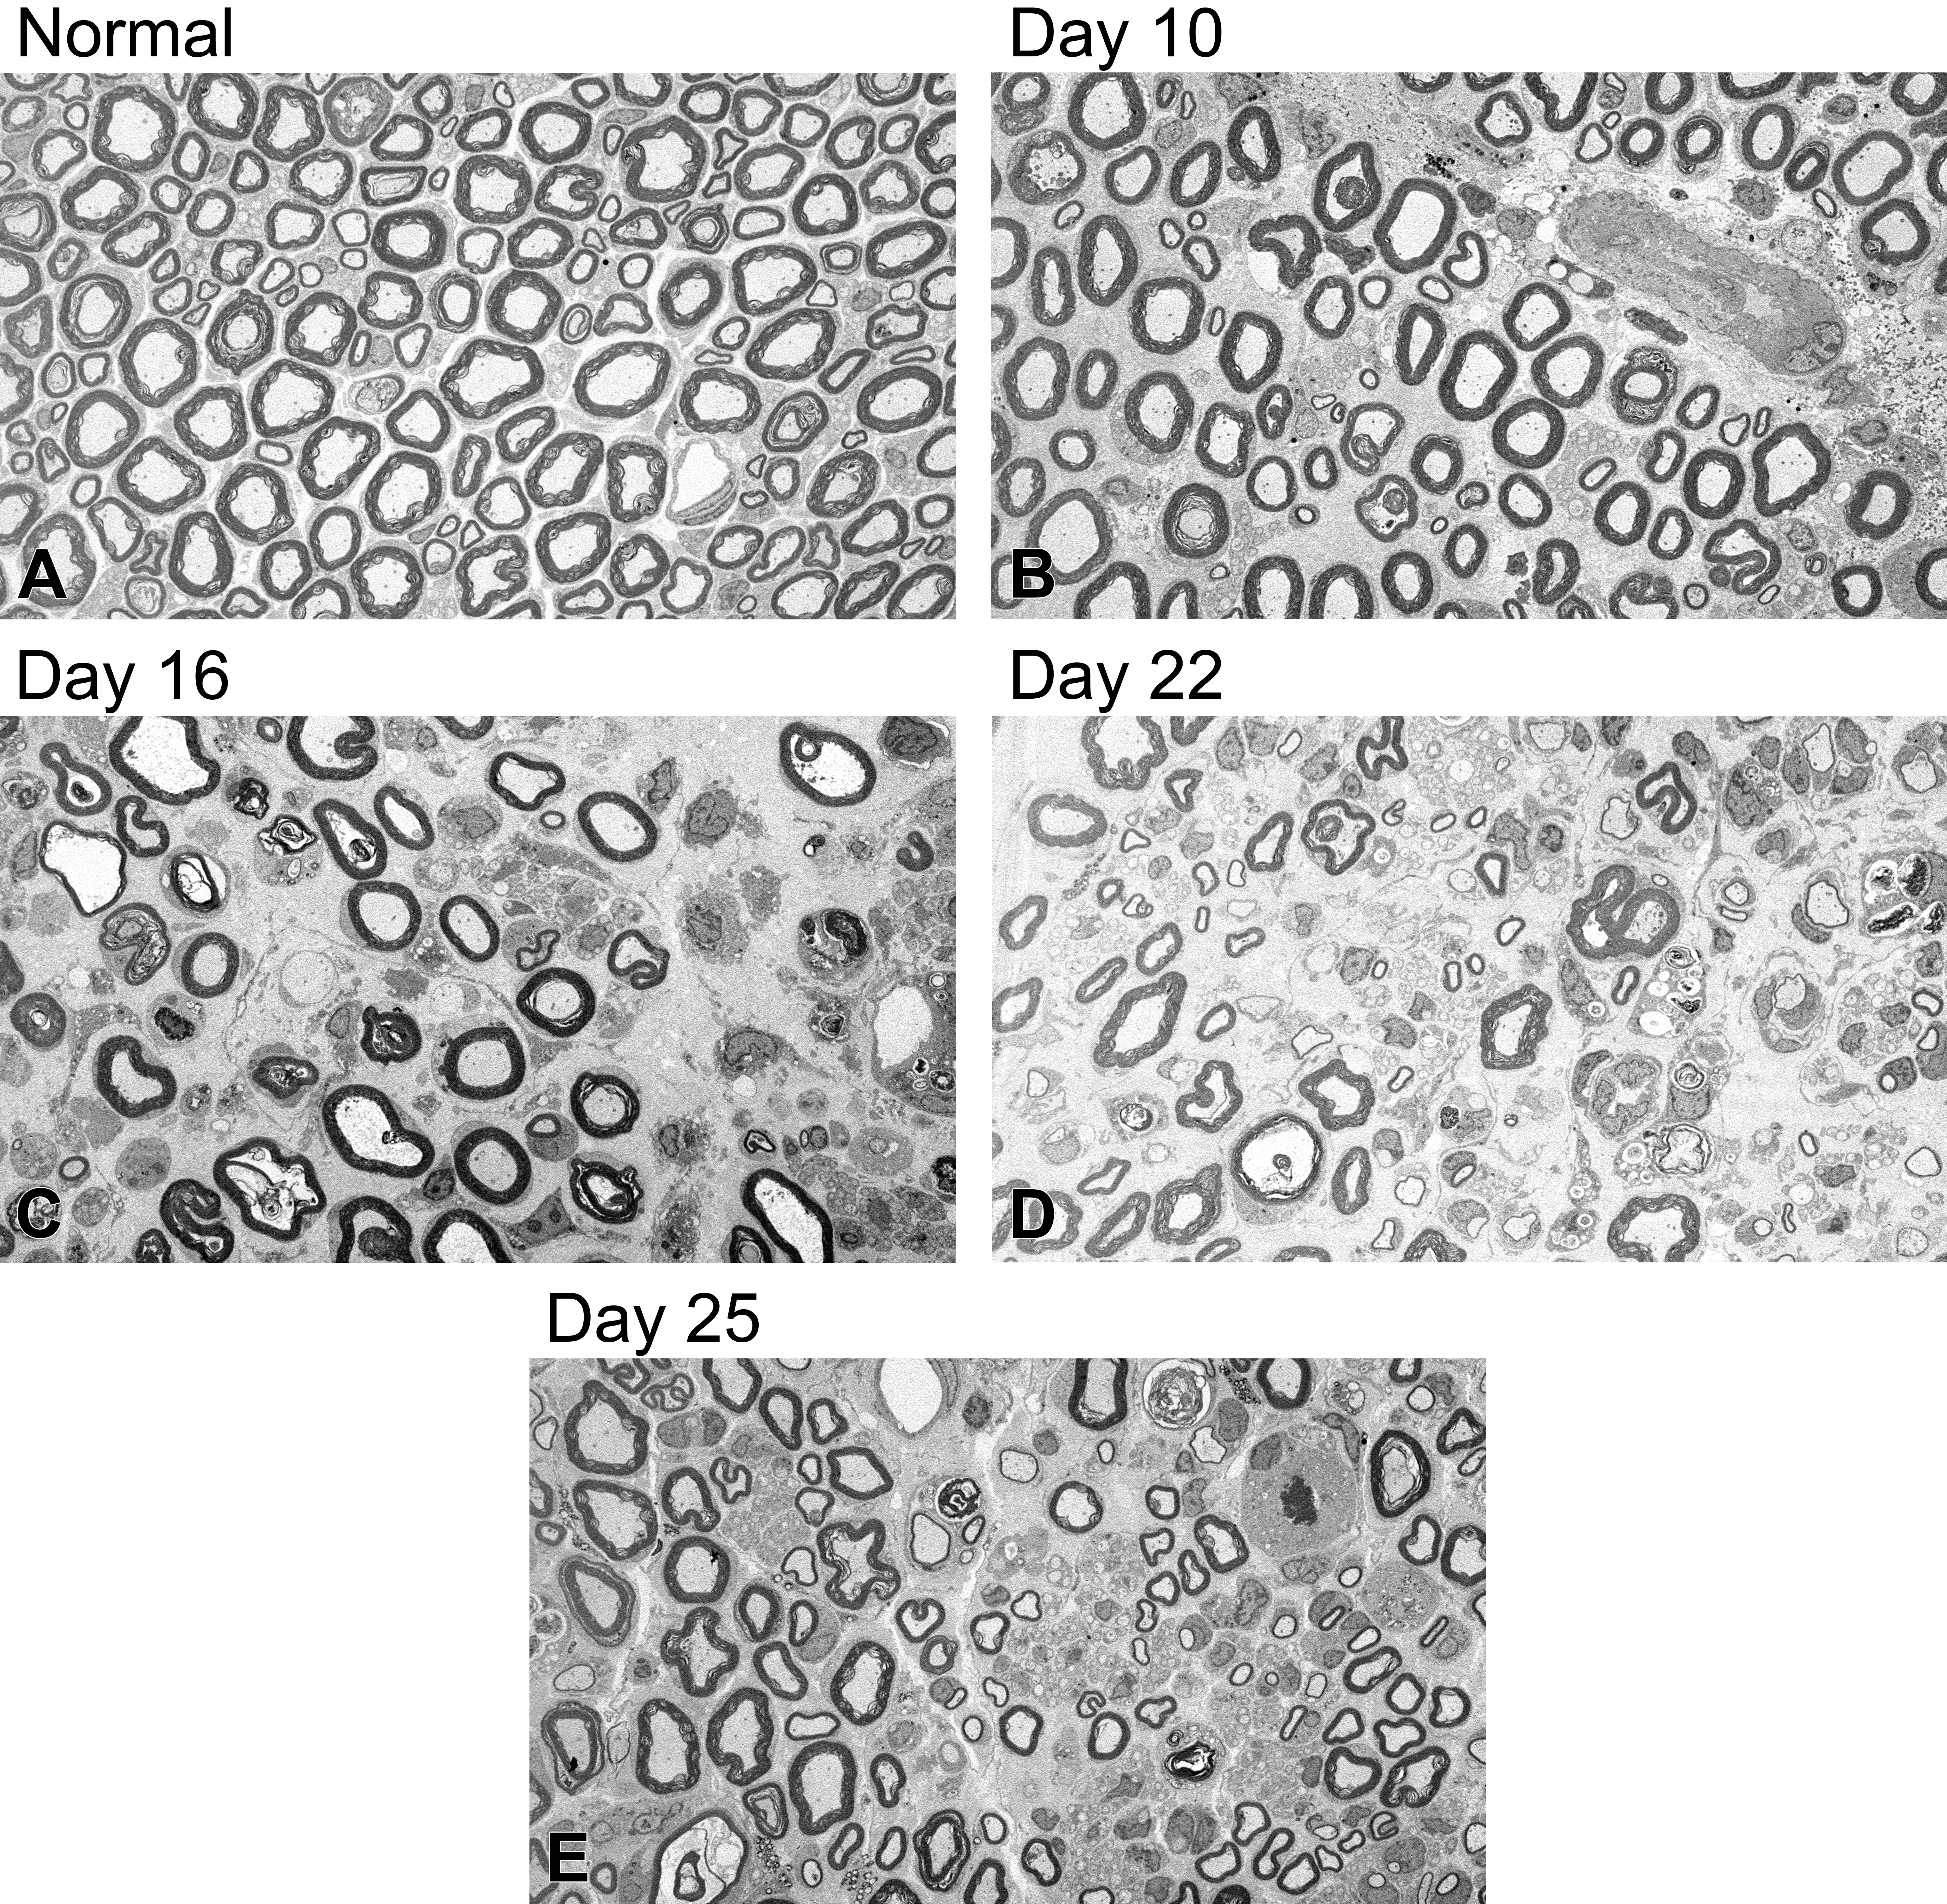
Ultrastructure of sciatic nerves in normal and experimental autoimmune neuritis (EAN) rats. Slight axon and myelin degeneration and decreased myelinated nerve fibers appeared on day 10, worsened on day 16, and persisted on days 22 and 25 in EAN rats. Regenerative changes in axon and myelin appeared on days 22 and 25 in EAN rats.
The densities of myelinated nerve fibers and myelin areas are shown in Figure 4 and Online Supplemental Table 1. Myelinated nerve fiber diameters are shown in Figure 5 and Online Supplemental Table 1. The density of myelinated nerve fibers was 13620 ± 616/mm2 in normal rats. From day 10, the densities decreased significantly in EAN rats compared to those in normal rats, became severe on days 16 to 25, and reached a minimum on day 22. The myelin area was 34.1 ± 1.9% in normal rats. In EAN rats, myelin area decreased significantly on day 10 compared to that in normal rats, became smaller on days 16 to 25, and reached a minimum on day 22. In normal rats, as Inagaki et al. (1977) described, the diameters of myelinated nerve fibers had two peaks (<5 μm: small fibers, ≥5 μm: large fibers). In EAN rats, the distribution of diameters on day 10 was similar to that in normal rats. On day 16, the number of small fibers increased and the number of large fibers decreased. On day 25, the ratio of small and large fibers was similar to that on day 16. The diameters had one peak (3.5–4.0 μm) on days 16, 22, and 25.
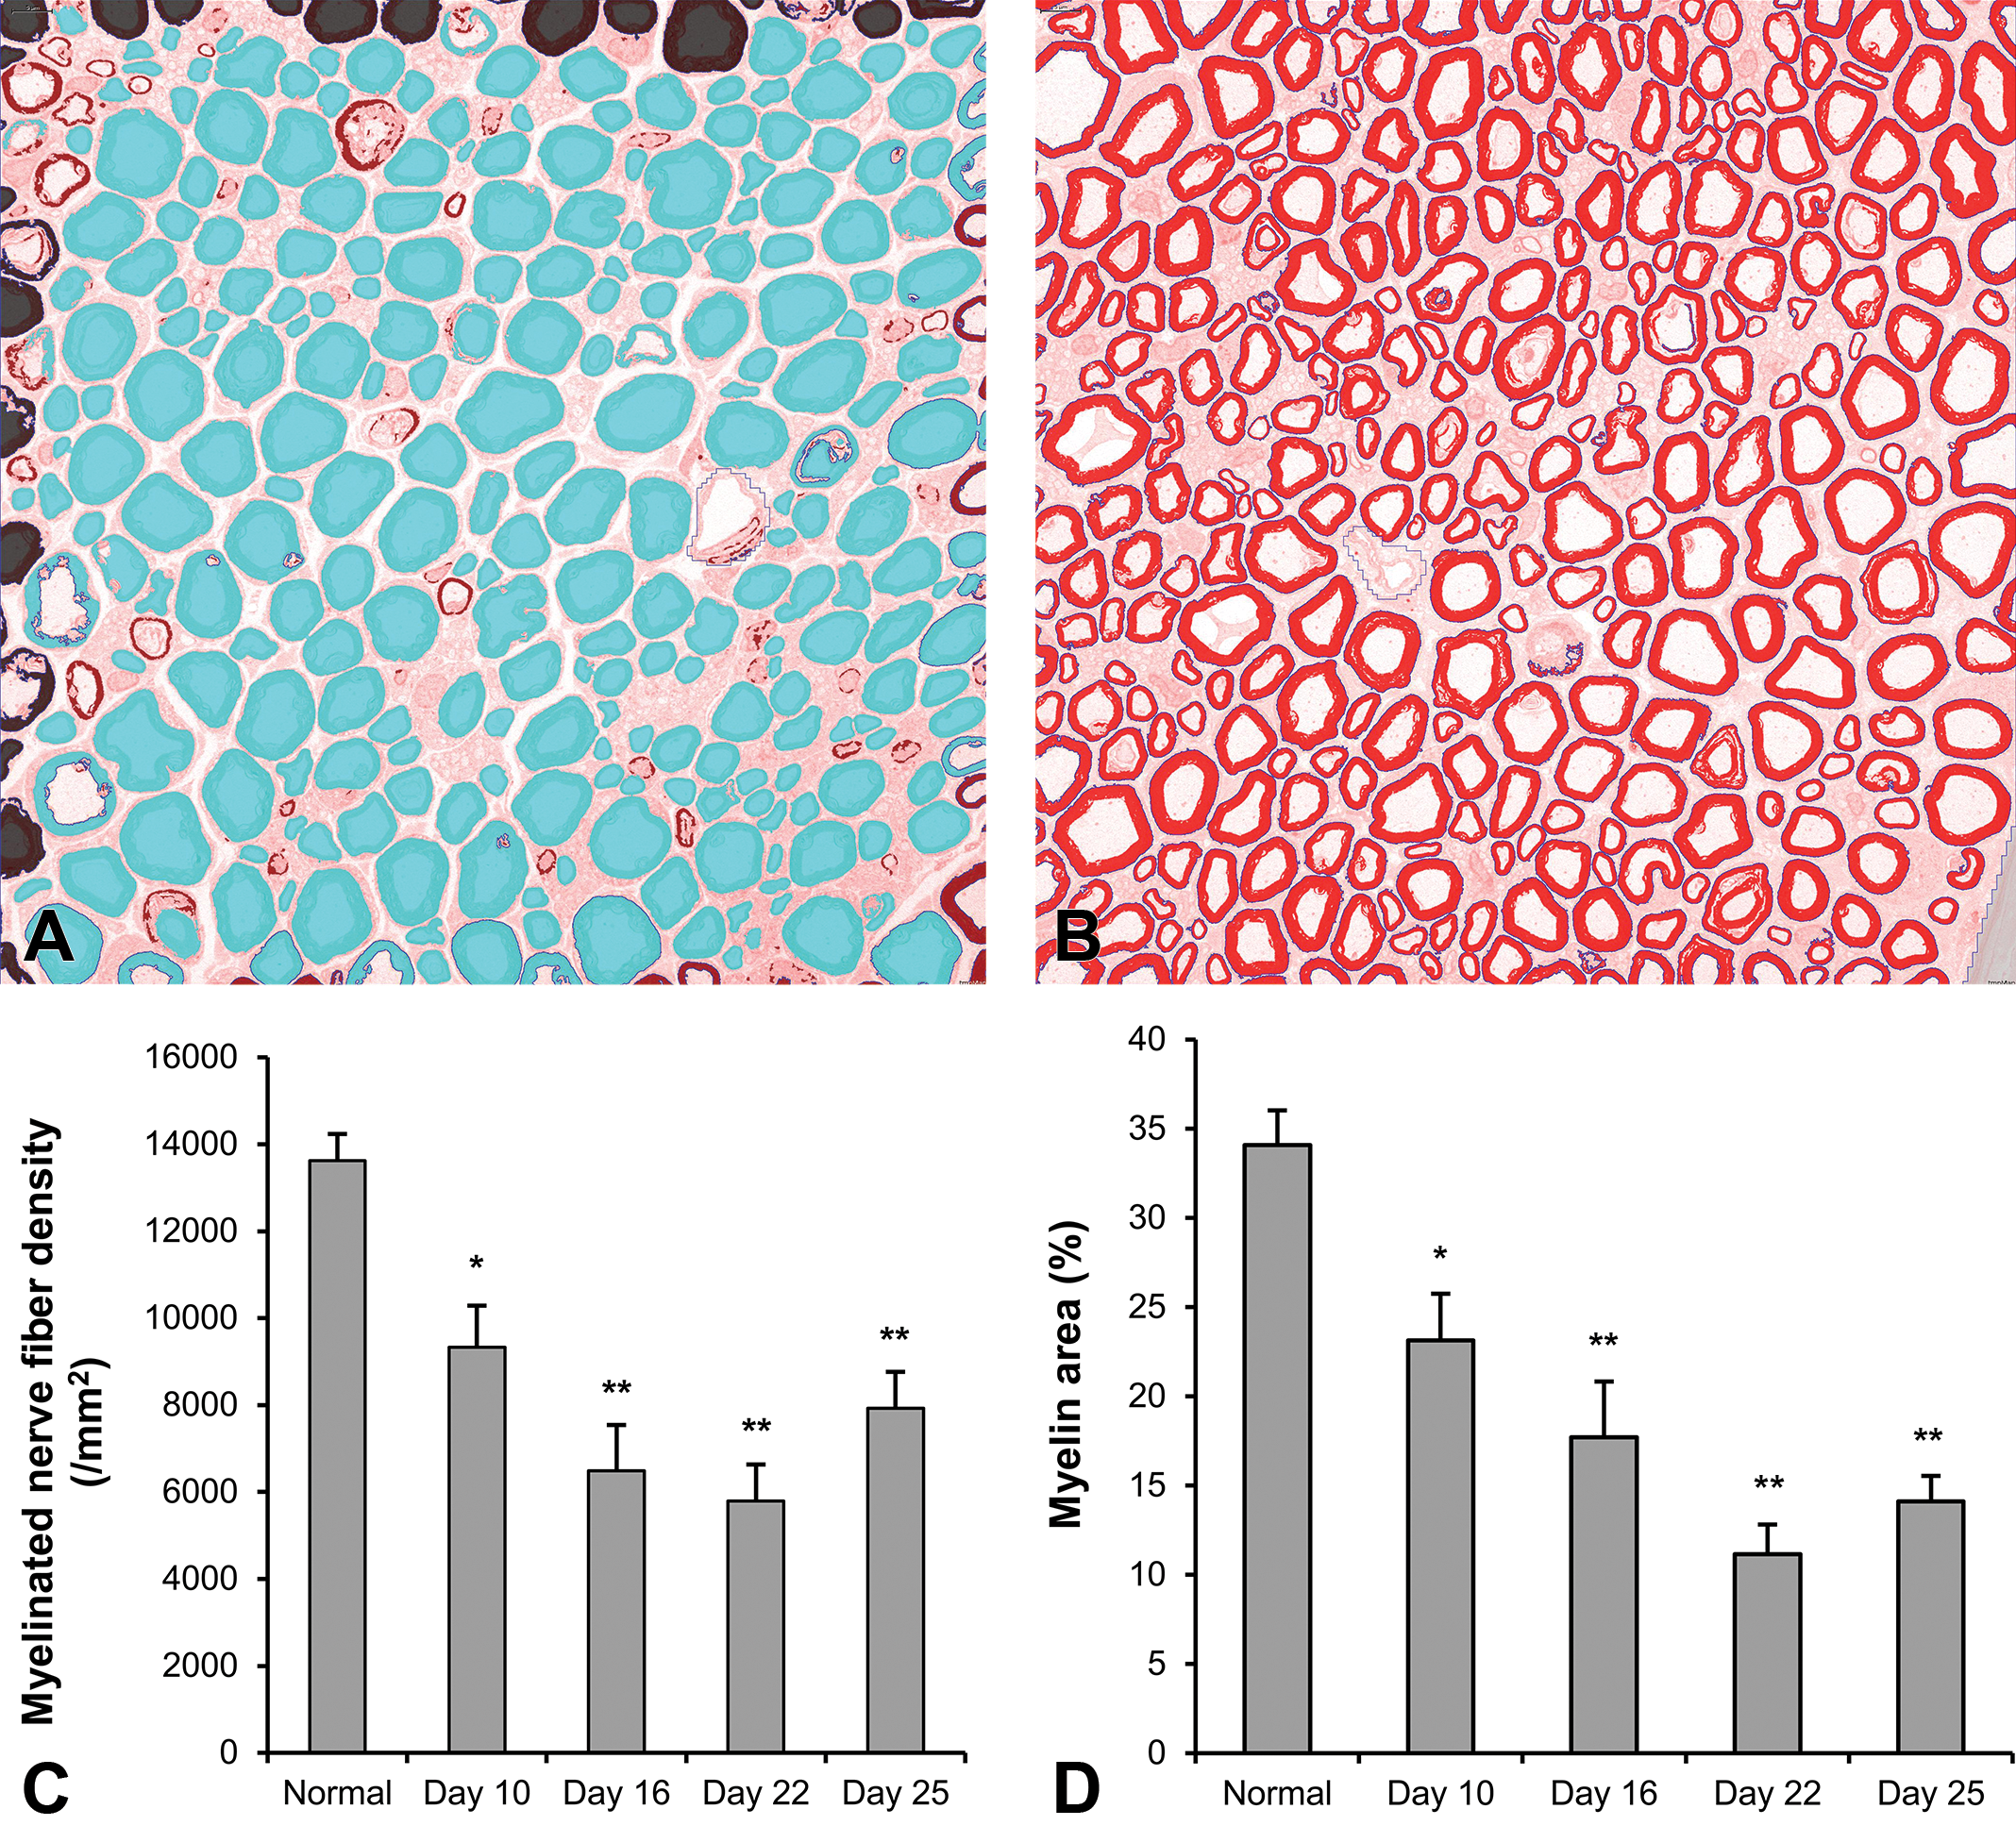
Myelinated nerve fiber densities and myelin areas of sciatic nerves in normal and experimental autoimmune neuritis (EAN) rats. An analyzed image of the myelinated nerve fibers (A) and myelin areas (B). Blue and red areas indicate the myelinated nerve fibers and myelin, respectively. The myelinated nerve fiber densities (C) and myelin areas (D) decreased on days 10 to 25. Each value is mean ± SE (n = 3–4). Significantly different from normal rats; *p < .05, **p < .01. SE = standard error.
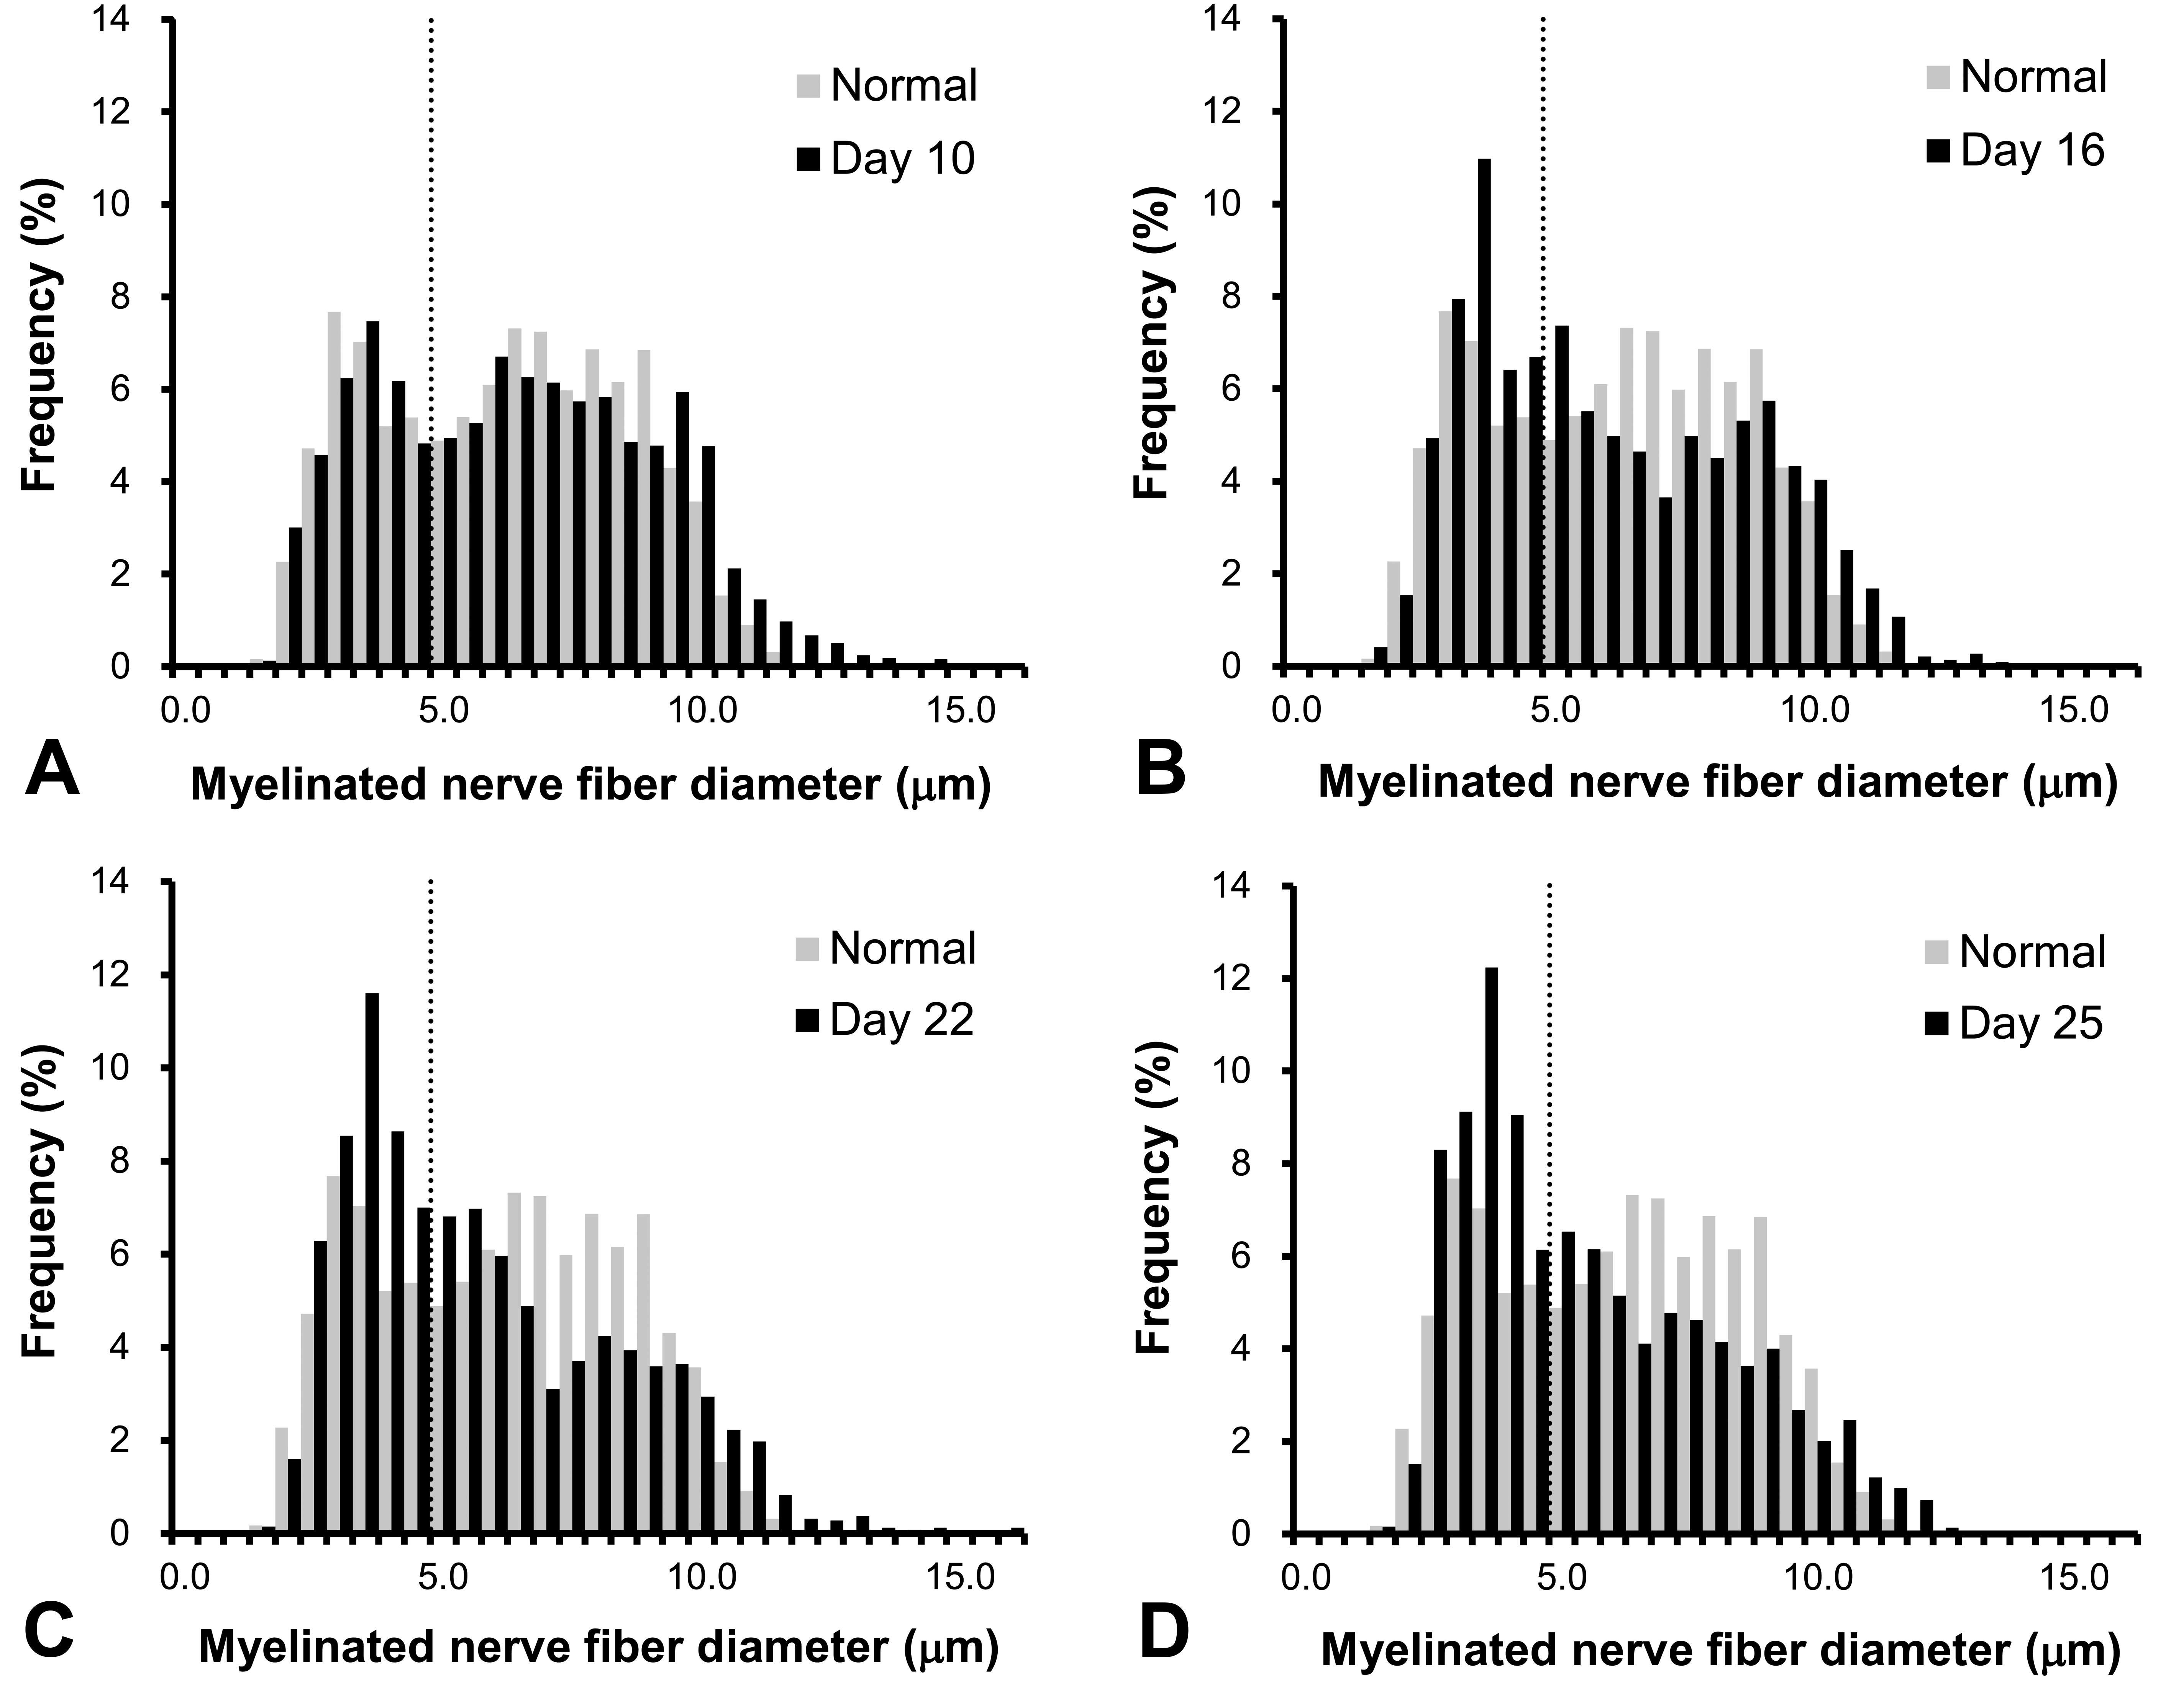
The diameters of myelinated nerve fibers of sciatic nerves in normal and experimental autoimmune neuritis (EAN) rats. The large diameter fibers (>5.0 μm) decreased on days 16 to 25 in EAN rats. Dotted lines represent the 5.0 μm diameter. Each value is mean (n = 3–4).
In EAN rats, several findings were observed by ultrastructural microscopy (Figure 6 and Online Supplemental Table 1) that were unchanged in normal rats. In EAN rats, “accumulation of vesicles in axons,” which involves accumulation of mitochondria and membranous dense bodies, was evident on day 10. “Focal splitting of myelin” represents myelin that is focally splitting, and the thickness and density of myelin sheath is uneven. “Focal folding of myelin” represents infoldings and/or outfoldings of myelin. These types of mild myelin degeneration also increased on day 10. Furthermore, a small number of “intramyelinic edema,” “tomacula,” “axonal loss,” “myelin ovoid,” “demyelination,” and “axonal swelling” were observed on day 10. On day 16 “axonal loss,” “myelin ovoid,” and “demyelination” became evident. These changes were detected on day 10, peaked on day 16, and decreased or persisted on days 22 and 25. On days 22 and 25, “thin myelin” and “enlargement of Schwann cell cytoplasm” increased in a time-dependent manner.
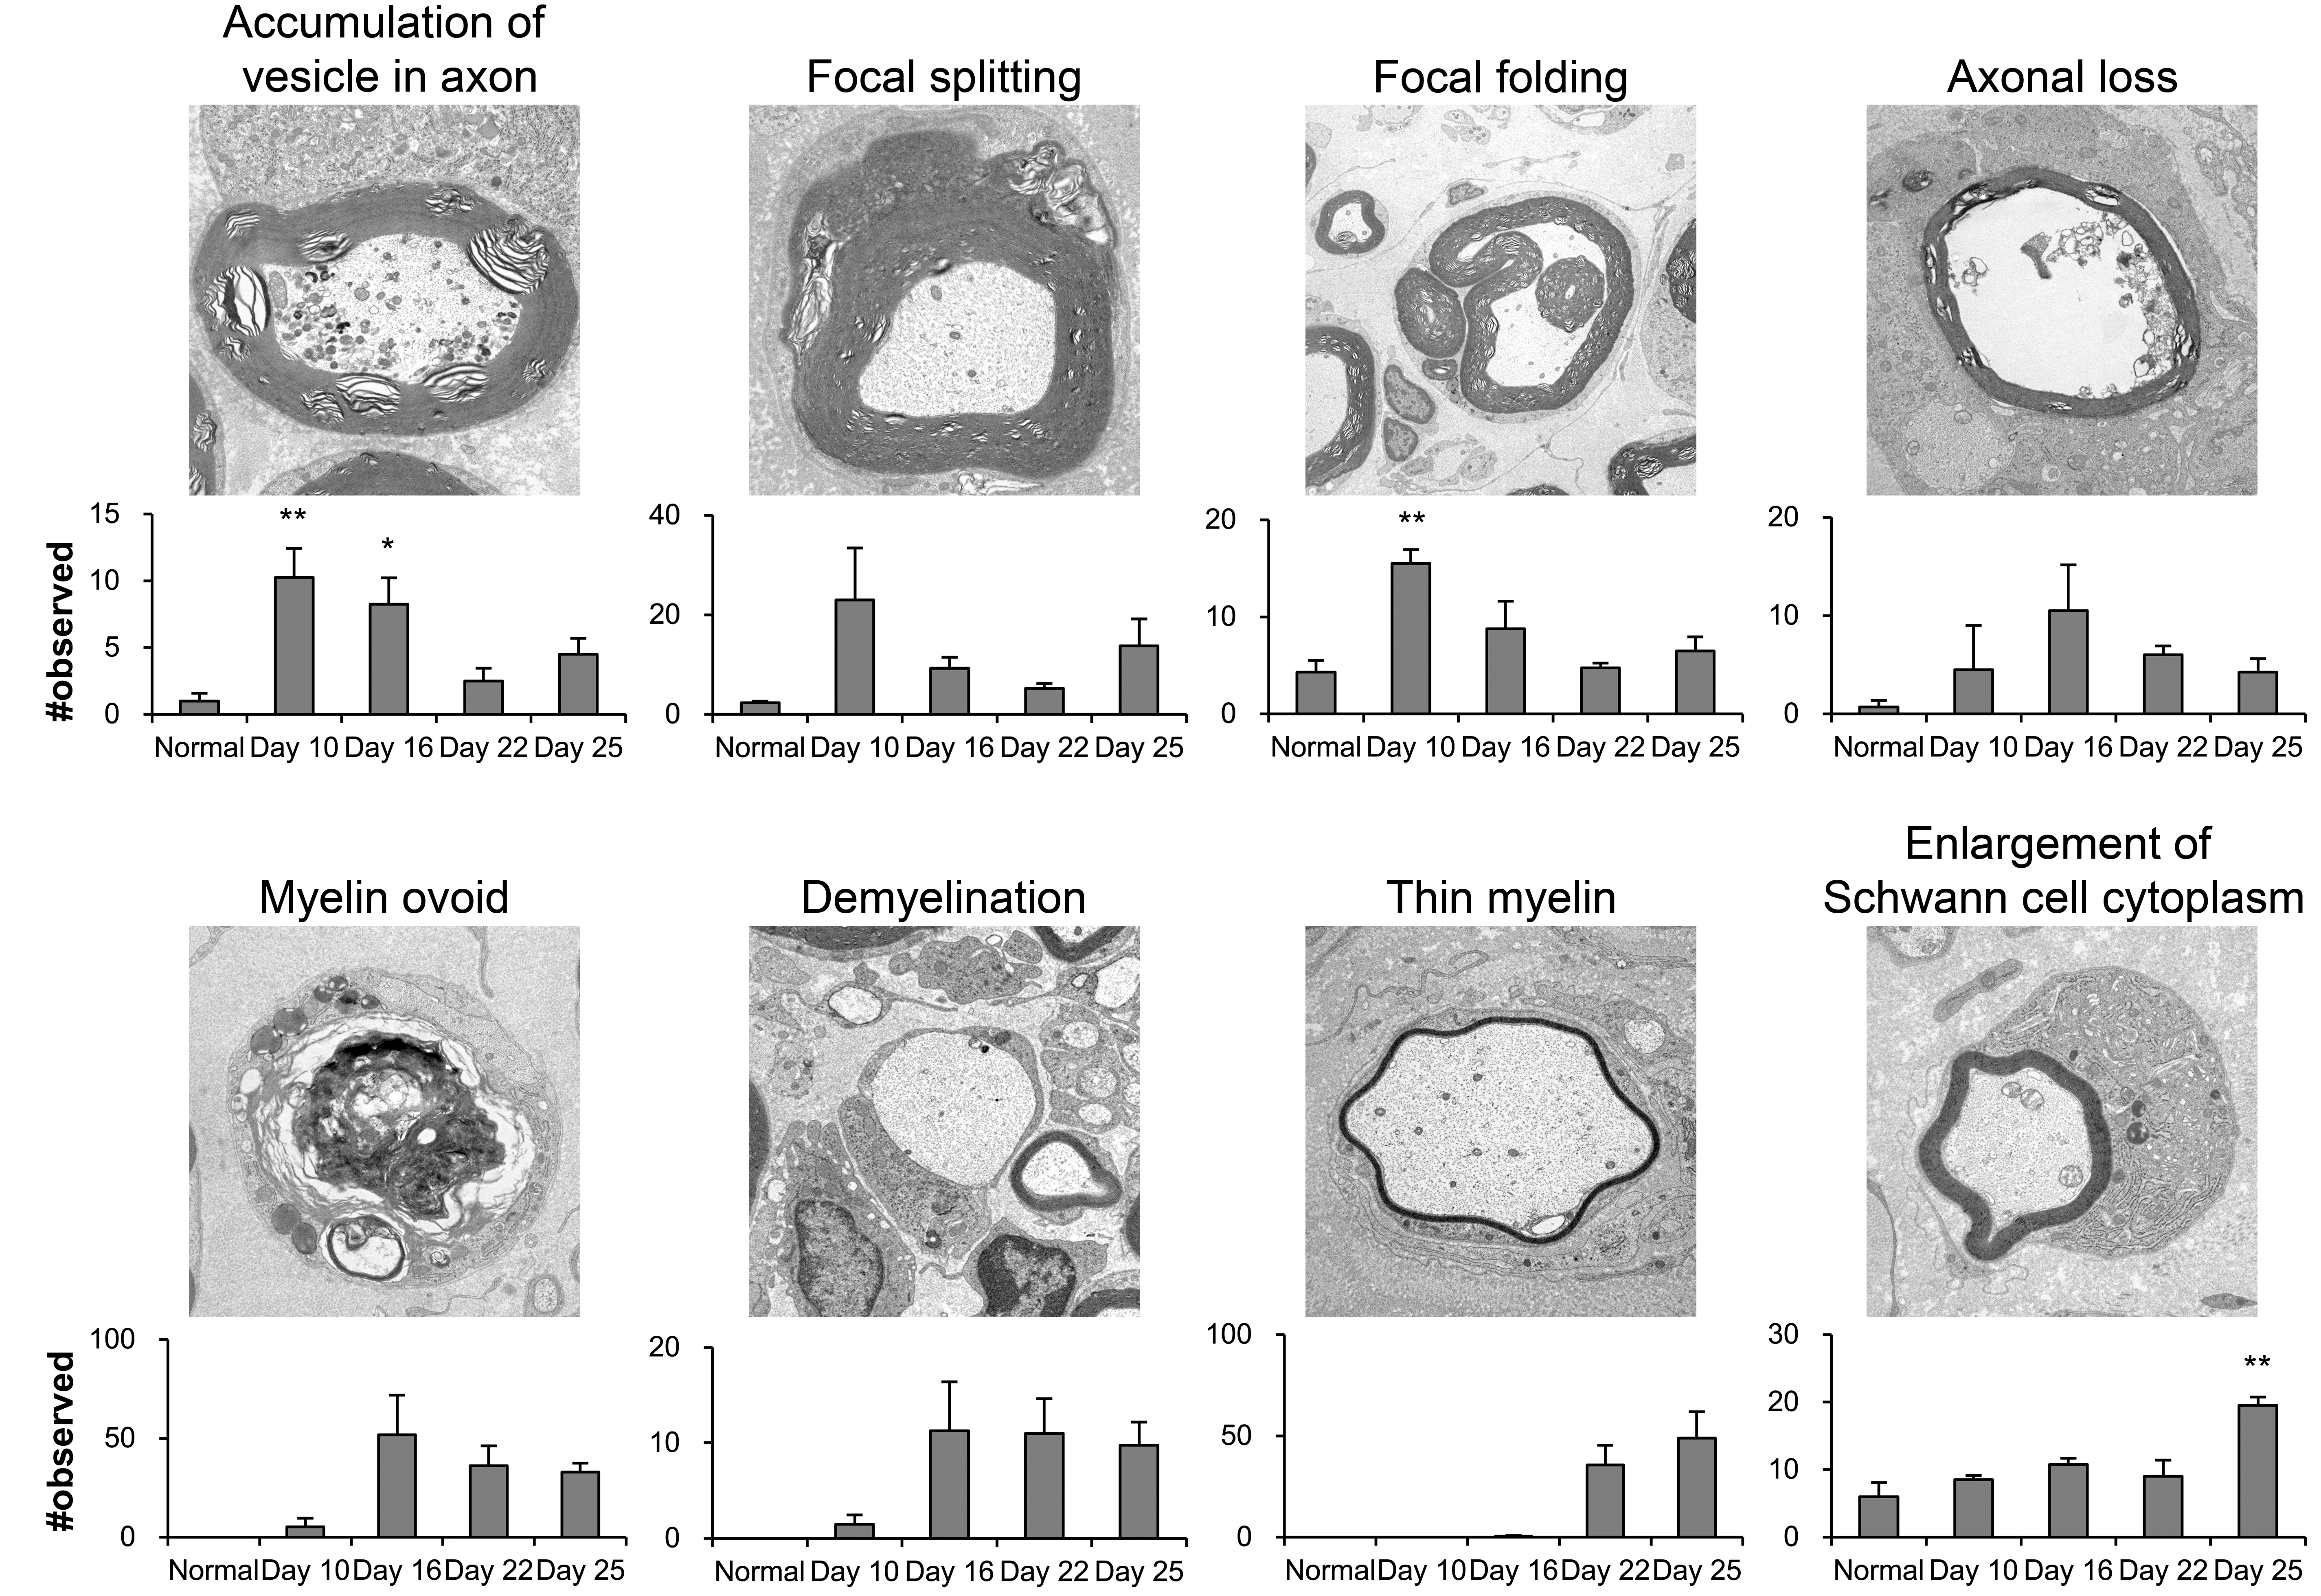
Ultrastructural findings of sciatic nerves in normal and experimental autoimmune neuritis (EAN) rats. Slight axon and myelin degeneration (accumulation of vesicles in axons, focal myelin splitting/folding) increased on day 10, severe degeneration (axonal loss, myelin ovoid, demyelination) increased on day 16, and regenerative changes (thin myelin, enlargement of Schwann cell cytoplasm) increased on days 22 and 25 in EAN rats. Each value is mean ± SE (n = 3–4). Significantly different from normal rats; *p < .05, **p < .01. SE = standard error.
Discussion
The EAN rat model, which is the most popular animal model for GBS, is induced by immunization with peripheral myelin homogenates or with peripheral myelin proteins such as the P2(57-81) peptide, P2(53-78) peptide, P0(180-199) peptide, and SP26 peptide (Brun et al. 2015; Kajii et al. 2014; Moalem-Taylor et al. 2007; Soliven 2014; Zhang et al. 2009). Regardless of inducer, EAN rats typically have a monophasic pattern of hind limb paralysis except in a few cases (Jung et al. 2004; Soliven 2014). However, there are no reports of time-dependent histopathological changes in peripheral nerves in EAN rats, which makes it difficult to determine when axon and myelin degeneration occurs and recovers in peripheral nerves in EAN rats. To the best of our knowledge, this is the first study that examined changes in peripheral nerves and the correlation between histopathological changes and neurological symptoms during disease progression in EAN rats.
In this study, clinical scores that were indicators of neurological symptoms increased on days 8 to 10, reached a maximum on days 13 to 16, and recovered on day 24 in EAN rats. Day 10 was considered the onset of the neurological symptoms (onset), day 16 was the peak of the neurological symptoms (peak), and days 22 and 25 were the recovery from the neurological symptoms (recovery).
By light microscopy, both axon and myelin degeneration appeared at onset of clinical signs in sciatic nerves in EAN rats. These changes became severe at peak and persisted to recovery. At onset, a slight degeneration of axons and myelin was observed in the neutrophil infiltration area in peripheral nerves in EAN rats by light microscopy, which is different from that of other types of EAN rats (Hadden et al. 2002). At the peak of symptoms, severe degeneration of axons and myelin was observed in the mononuclear cell infiltration area with an increase in fibroblasts and/or Schwann cells. At recovery, similar but higher levels of changes compared to those at peak were observed. We found correlations between the maximum clinical scores and the severity of the histopathological findings such as degeneration of axons and myelin and inflammation in EAN rats at onset, peak, and recovery of the symptoms. Consistent with previous studies of other types of EAN rats (Hadden et al. 2002; Yuan et al. 2015), we found axon and myelin degeneration in nerve roots, but these changes in nerve roots were less severe compared to those in sciatic nerves. In this study, more than 80% of axons and myelin were degenerated at the peak in distal sciatic nerves of EAN rats, which suggests that widespread Wallerian degeneration occurred. However, we could not determine where the degeneration started because the severity of the lesions was not different in any segments on day 10, though degeneration was a little more severe in distal nerve segments than in other regions on day 16.
To quantitatively evaluate changes in axonal and myelin degeneration over time, we calculated myelinated nerve fiber densities and myelin area using TEM images. There are few reports quantitatively measuring densities of myelinated nerve fibers in EAN rats (Brun et al. 2015; Kajii et al. 2014). The number of myelinated fibers was slightly increased immediately after recovery by light microscopy in P0(180-199) peptide-induced EAN male rats (Brun et al. 2015). In this study, degeneration of axons and myelin persisted until recovery, but regenerative changes started to appear by an increase in the number of Schwann cells and/or fibroblasts by light microscopy. By TEM analysis, we found that the densities of myelinated nerve fibers and myelin areas reached a minimum during recovery (days 22–25) mainly because of a decreased ratio of large- to small-diameter fibers. The loss of large myelinated nerve fibers reached its peak during the recovery. After degeneration of axon and myelin, nerve fibers were regenerated in the following steps: several regenerative axons became surrounded by basal lamina and formed a Schwann tube (Büngner band) and then one of the regenerative axons expanded markedly and became a regenerative nerve fiber by regeneration of the myelin sheath (Grinsell and Keating 2014; Mitsumori, Shibutani, and Maekawa 2017). Thin myelin and the increase in small fibers may become large fibers and act as normal axons and myelin after a longer period of time. Therefore, peripheral nerves need to be observed after day 22 to examine the full recovery of myelinated nerve fibers.
Furthermore, we examined changes in axon and myelin degeneration using TEM images. Ultrastructural data revealed that severe axon and myelin degeneration reached a maximum at peak and decreased at recovery. Regenerative changes significantly increased at recovery, which suggests that axon and myelin regeneration started at recovery. Worsening of clinical scores from onset to peak of EAN rats was related to the severity of axon and myelin degeneration. The recovery of clinical scores during the peak to the recovery phase of EAN rats was related to the increase in the regenerative changes. Yuan et al. (2015) found a separation of myelin lamellae and disappearance of axons at the peak of neurological symptoms in P0(180-199) peptide-induced EAN female rats. We found that “focal splitting and folding of myelin sheath,” which is similar to myelin lamellae separation by Yuan et al. (2015) and an indicator of mild myelin degeneration (Horn et al. 2012), increased at onset and decreased thereafter, which suggests that this attribute may be an early marker for myelin degeneration. We also found an early marker for axonal degeneration by examining the “accumulation of vesicles in axons,” which suggests axonal transport disorder (Coleman 2005). Furthermore, we found an early marker to detect regenerative changes in axon and myelin by measuring “thin myelin” or remyelination and “enlargement of Schwann cell cytoplasm” with an increase in the amount of rough endoplasmic reticulum, which suggests enhanced protein synthesis.
GBS has some subtypes but is composed of mainly two distinct clinicopathological entities as follows: demyelinating GBS (acute inflammatory demyelinating polyradiculoneuropathy), which consists of sparsely distributed demyelinative foci throughout the peripheral nervous system, and axonal GBS (acute motor or motor and sensory axonal neuropathy), which primarily consists of axonal degeneration in the peripheral nervous system (Burns 2008; Kuwabara 2004; Nakano and Kanda 2015).
Because EAN rats were induced by autoimmune stimuli by peripheral myelin protein P2, the rats were expected to have a similar pattern of demyelination to GBS. We found that EAN rats had many similarities with demyelination in human GBS. The critical cause of demyelinating GBS is the autoimmune attack by macrophages on the basement membrane of the Schwann cells wrapping myelinated nerve fibers, which results in vesicular myelin degeneration (Nakano and Kanda 2015). We found similar changes in myelination, such as focal splitting, in EAN rats at symptom onset. In demyelinating GBS, Schwann cell proliferation indicates recovery (Nakano and Kanda 2015). Furthermore, in this study, increases in Schwann cells and/or fibroblasts were observed at recovery. The enlargement of Schwann cell cytoplasm and increase in rough endoplasmic reticulum at recovery suggest an increase in protein synthesis during recovery from degeneration. EAN rats had some similarities with axonal-type human GBS. In axonal GBS, an antibody-mediated attack, such as immunoglobulins on axolemma at the node of Ranvier, causes an axonopathy or secondary Wallerian degeneration (Nakano and Kanda 2015). EAN rats had axonal loss and myelin ovoid, which suggests Wallerian degeneration. Moreover, the accumulation of vesicles in axons, which indicates an axonal transport disorder and mild axonal degeneration (Coleman 2005), was observed at onset. These findings suggest that not only the target of immune cells (myelin) but also axons adjacent to myelin were altered in EAN rats. Moreover, the decrease in myelinated nerve fibers from peak to recovery was mainly caused by a decrease in large myelinated nerve fibers, which is consistent with the degenerative pattern in GBS patients (Nakano and Kanda 2015).
On the other hand, axonal-type human GBS results in extensive axonal degeneration with little evidence of demyelination. EAN rats had edema in peripheral nerves at onset, which is consistent with the demyelinating type of GBS because patients have edema in peripheral nerves at the onset of neurological symptoms (Haymaker and Kernohan 1949) but is not consistent with the axonal degeneration type of GBS because patients rarely have edema (Feasby et al. 1986). It was unclear why EAN rats had both axon and myelin degeneration and which type of degeneration occurred first, but we think myelin degeneration occurred first because EAN rats reflect histopathological changes in largely the demyelinating type of GBS and partly the axonal type. A more thorough time-course study focusing on the onset of symptoms is needed but may not be practical because models induced by autoimmunity tend to be unstable. More mild inflammatory models would be useful to explore animal models for the demyelinating type of GBS. For axonal-type GBS models, rabbits stimulated by a bovine brain ganglioside mixture or isolated GM1 may be more useful because they have prominent axonal degeneration without demyelination (Kuwabara and Yuki 2013).
Axon and myelin degeneration in peripheral nerves in EAN rats occurred at the onset of neurological symptoms, became severe with loss of large diameter fibers at peak, and remained severe but had some regenerative changes at recovery. We found correlations between neurological symptoms and histopathological changes in peripheral nerves, which suggested a largely demyelinating type and partly an axonal type of GBS. The histopathological similarities to some types of GBS patients (mainly the demyelinating type and the partly axonal type) suggest that EAN rats are a good model for researching the mechanism of degeneration and for developing treatments for GBS patients.
Supplemental Material
Supplemental Material, DS1_TPX_10.1177_0192623319838993 - Time Course of Axon and Myelin Degeneration in Peripheral Nerves in Experimental Autoimmune Neuritis Rats
Supplemental Material, DS1_TPX_10.1177_0192623319838993 for Time Course of Axon and Myelin Degeneration in Peripheral Nerves in Experimental Autoimmune Neuritis Rats by Emi Tomikawa, Mayu Mutsuga, Kojiro Hara, Chihiro Kaneko, Yuko Togashi and Yohei Miyamoto in Toxicologic Pathology
Footnotes
Author Contributions
Authors contributed to conception or design (ET, MM, KH, CK, YT), data acquisition, analysis, or interpretation (ET, MM, KH, CK, YT, YM), drafting the manuscript (ET), and critically revising the manuscript (ET, MM, KH, CK, YT, YM). All authors gave final approval and agreed to be accountable for all aspects of work in ensuring that questions relating to the accuracy or integrity of any part of the work are appropriately investigated and resolved.
Declaration of Conflicting Interests
The author(s) declared no potential, real, or perceived conflicts of interest with respect to the research, authorship, and/or publication of this article.
Funding
The author(s) received no financial support for the research, authorship, and/or publication of this article.
Supplemental Material
Supplemental material for this article is available online.
References
Supplementary Material
Please find the following supplemental material available below.
For Open Access articles published under a Creative Commons License, all supplemental material carries the same license as the article it is associated with.
For non-Open Access articles published, all supplemental material carries a non-exclusive license, and permission requests for re-use of supplemental material or any part of supplemental material shall be sent directly to the copyright owner as specified in the copyright notice associated with the article.