
Abstract
The prevalence of liver and skin tumors in brown bullhead (Ameiurus nebulosus) from the Anacostia River (Washington, DC) and nearby areas was determined in 2014, 2015, and 2016. The objectives were to (1) compare tumor prevalence across space and time; (2) analyze the 1992–2016 Chesapeake Bay Tumor Database to identify reference locations and test age, length, weight, and sex as covariates; and (3) explore whether changes in bullhead exposure to contaminants can explain the observed trends. With logistic regression, we reported large statistically significant decreases in liver tumor probabilities in bullheads from the Anacostia CSX Bridge (ANAC) area between 1996 and 2001 (merged: female, 77.8%; male, 48.6%), 2009 to 2011 (female, 42.5%; male, 16.6%), and 2014 to 2016 (female, 18.0%; male, 5.7%). Skin tumors decreased by a factor of six in both females and males. Polycyclic aromatic compounds (PAC) initiate liver neoplasms and polychlorinated biphenyls (PCBs) and DDT compounds are promoters. The causes of skin tumors in bullhead are uncertain. Biomarker and tissue data show decreases in PAC-DNA adducts and PCB and DDT contamination in ANAC bullheads. It is likely that the decreased liver tumor prevalence is associated with decreased exposure to these contaminants.
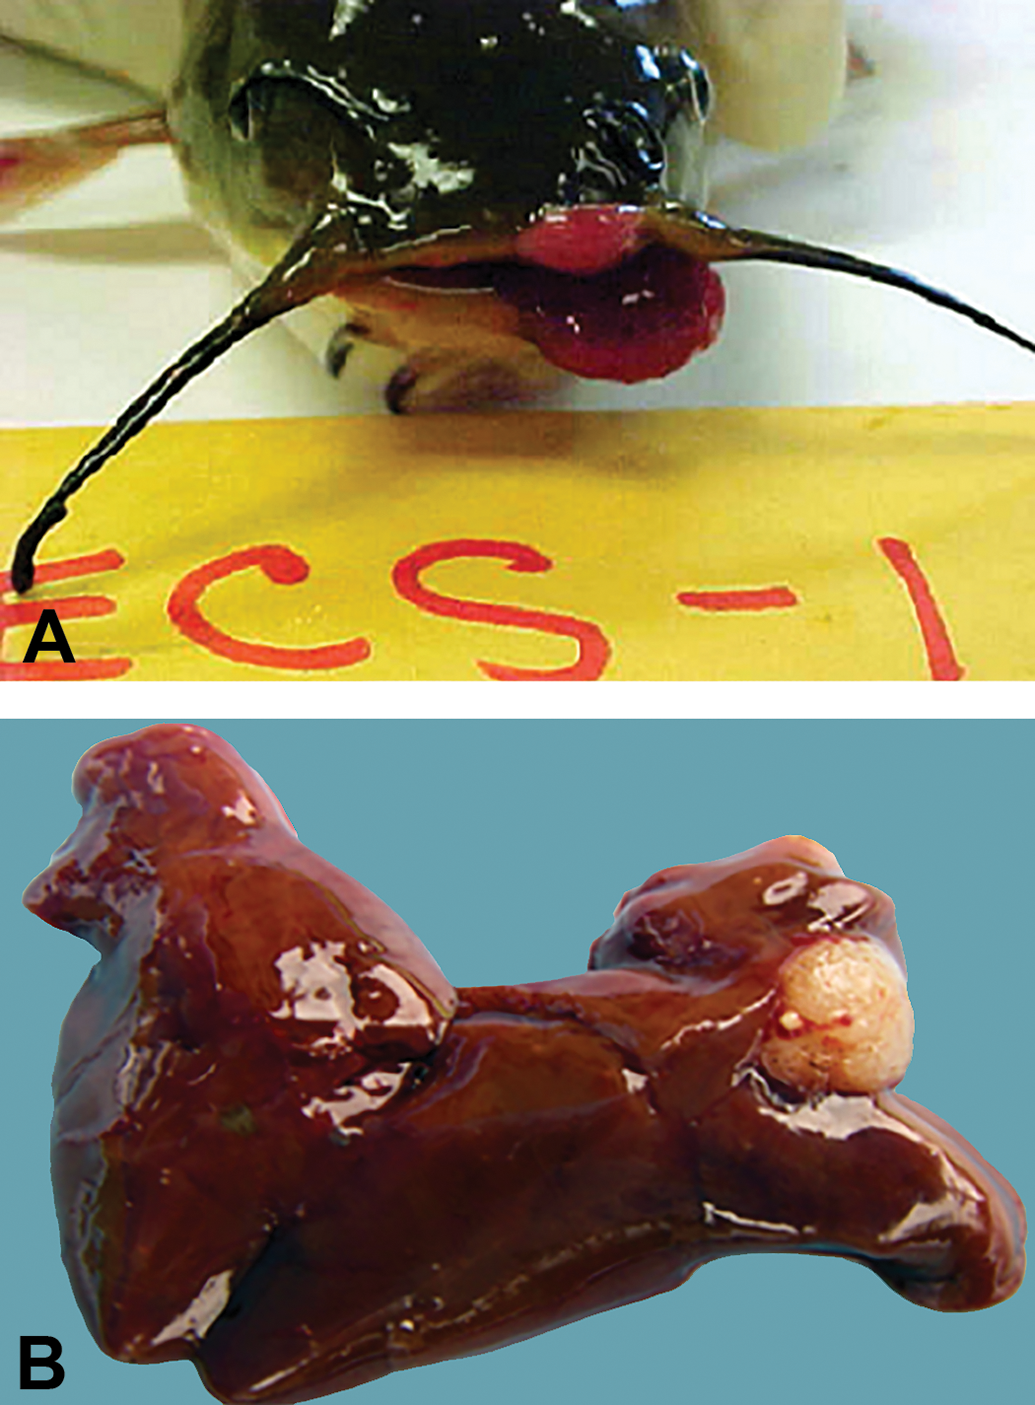
Over the past four decades, scientists have conducted tumor prevalence surveys with bottom-dwelling fish from freshwater, estuarine, and marine habitats. Many surveys compared prevalence in areas with contaminated sediments with that in areas viewed as “clean” or “reference” (e.g., Baumann 1992; Baumann, Smith, and Metcalfe 1996; Pinkney et al. 2001, 2011; Pinkney, Harshbarger, and Rutter 2009, 2014; Vogelbein and Unger 2006; Myers et al. 2008). The brown bullhead (Ameiurus nebulosus) has been widely used in the Laurentian Great Lakes of North America and its tributaries because of its propensity to develop liver and skin neoplasms (Figure 1; Baumann 1992; Blazer et al. 2009a, 2009b; Rafferty et al. 2009). In 1987, tumor prevalence in bottom-dwelling fish was one of the 14 Beneficial Use Impairment in the Great Lakes Water Quality Agreement used to designate Areas of Concern requiring cleanup and monitoring (Rafferty et al. 2009). In the Chesapeake and Delaware Bay watersheds, brown bullhead resides in fresh waters and tidal tributaries with salinities up to about 8 parts per thousand (Jenkins and Burkhead 1993). Tumor surveys have been conducted in these watersheds since the 1990s (e.g., Pinkney et al. 2001, 2004a; Pinkney, Harshbarger, and Rutter 2009, 2014; Steyermark et al. 1999).
Brown bullhead photos:
There is strong evidence that exposure to polynuclear aromatic hydrocarbons (PAHs) results in liver tumors in wild fish (e.g., Baumann and Harshbarger 1998; Myers et al. 2008; Vogelbein and Unger 2006). Laboratory exposures demonstrated a cause and effect relationship between PAHs and liver tumors or preneoplastic lesions in several fish species (reviewed by Hawkins, Walker, and Overstreet 2005), although no such studies have been conducted with brown bullhead. Baumann and Harshbarger (1998) reported that liver tumor prevalence in bullheads from the Black River, Ohio, increased and decreased consistent with changes in sediment PAH concentrations resulting from the shutdown of a coal coking plant and subsequent remedial dredging. Pinkney et al. (2004a) reported an association between sediment PAHs and bullhead liver tumors in the Anacostia River (Figure 2), using polycyclic aromatic compound (PAC)-DNA adducts as a biomarker of response (Reichert et al. 1998). Anacostia bullheads collected from areas with sediments contaminated with 15 to 31 mg/kg (ppm) total PAHs had 50% to 68% liver tumor prevalence. Liver chromatograms were indicative of high concentrations of PAC-DNA adducts. Tumor prevalence, sediment contamination, and PAC-DNA adduct concentrations were highly elevated in the Anacostia compared with Tuckahoe Creek (TUCK), within an agricultural watershed on Maryland’s Eastern Shore (Pinkney et al. 2004a; Figure 2).
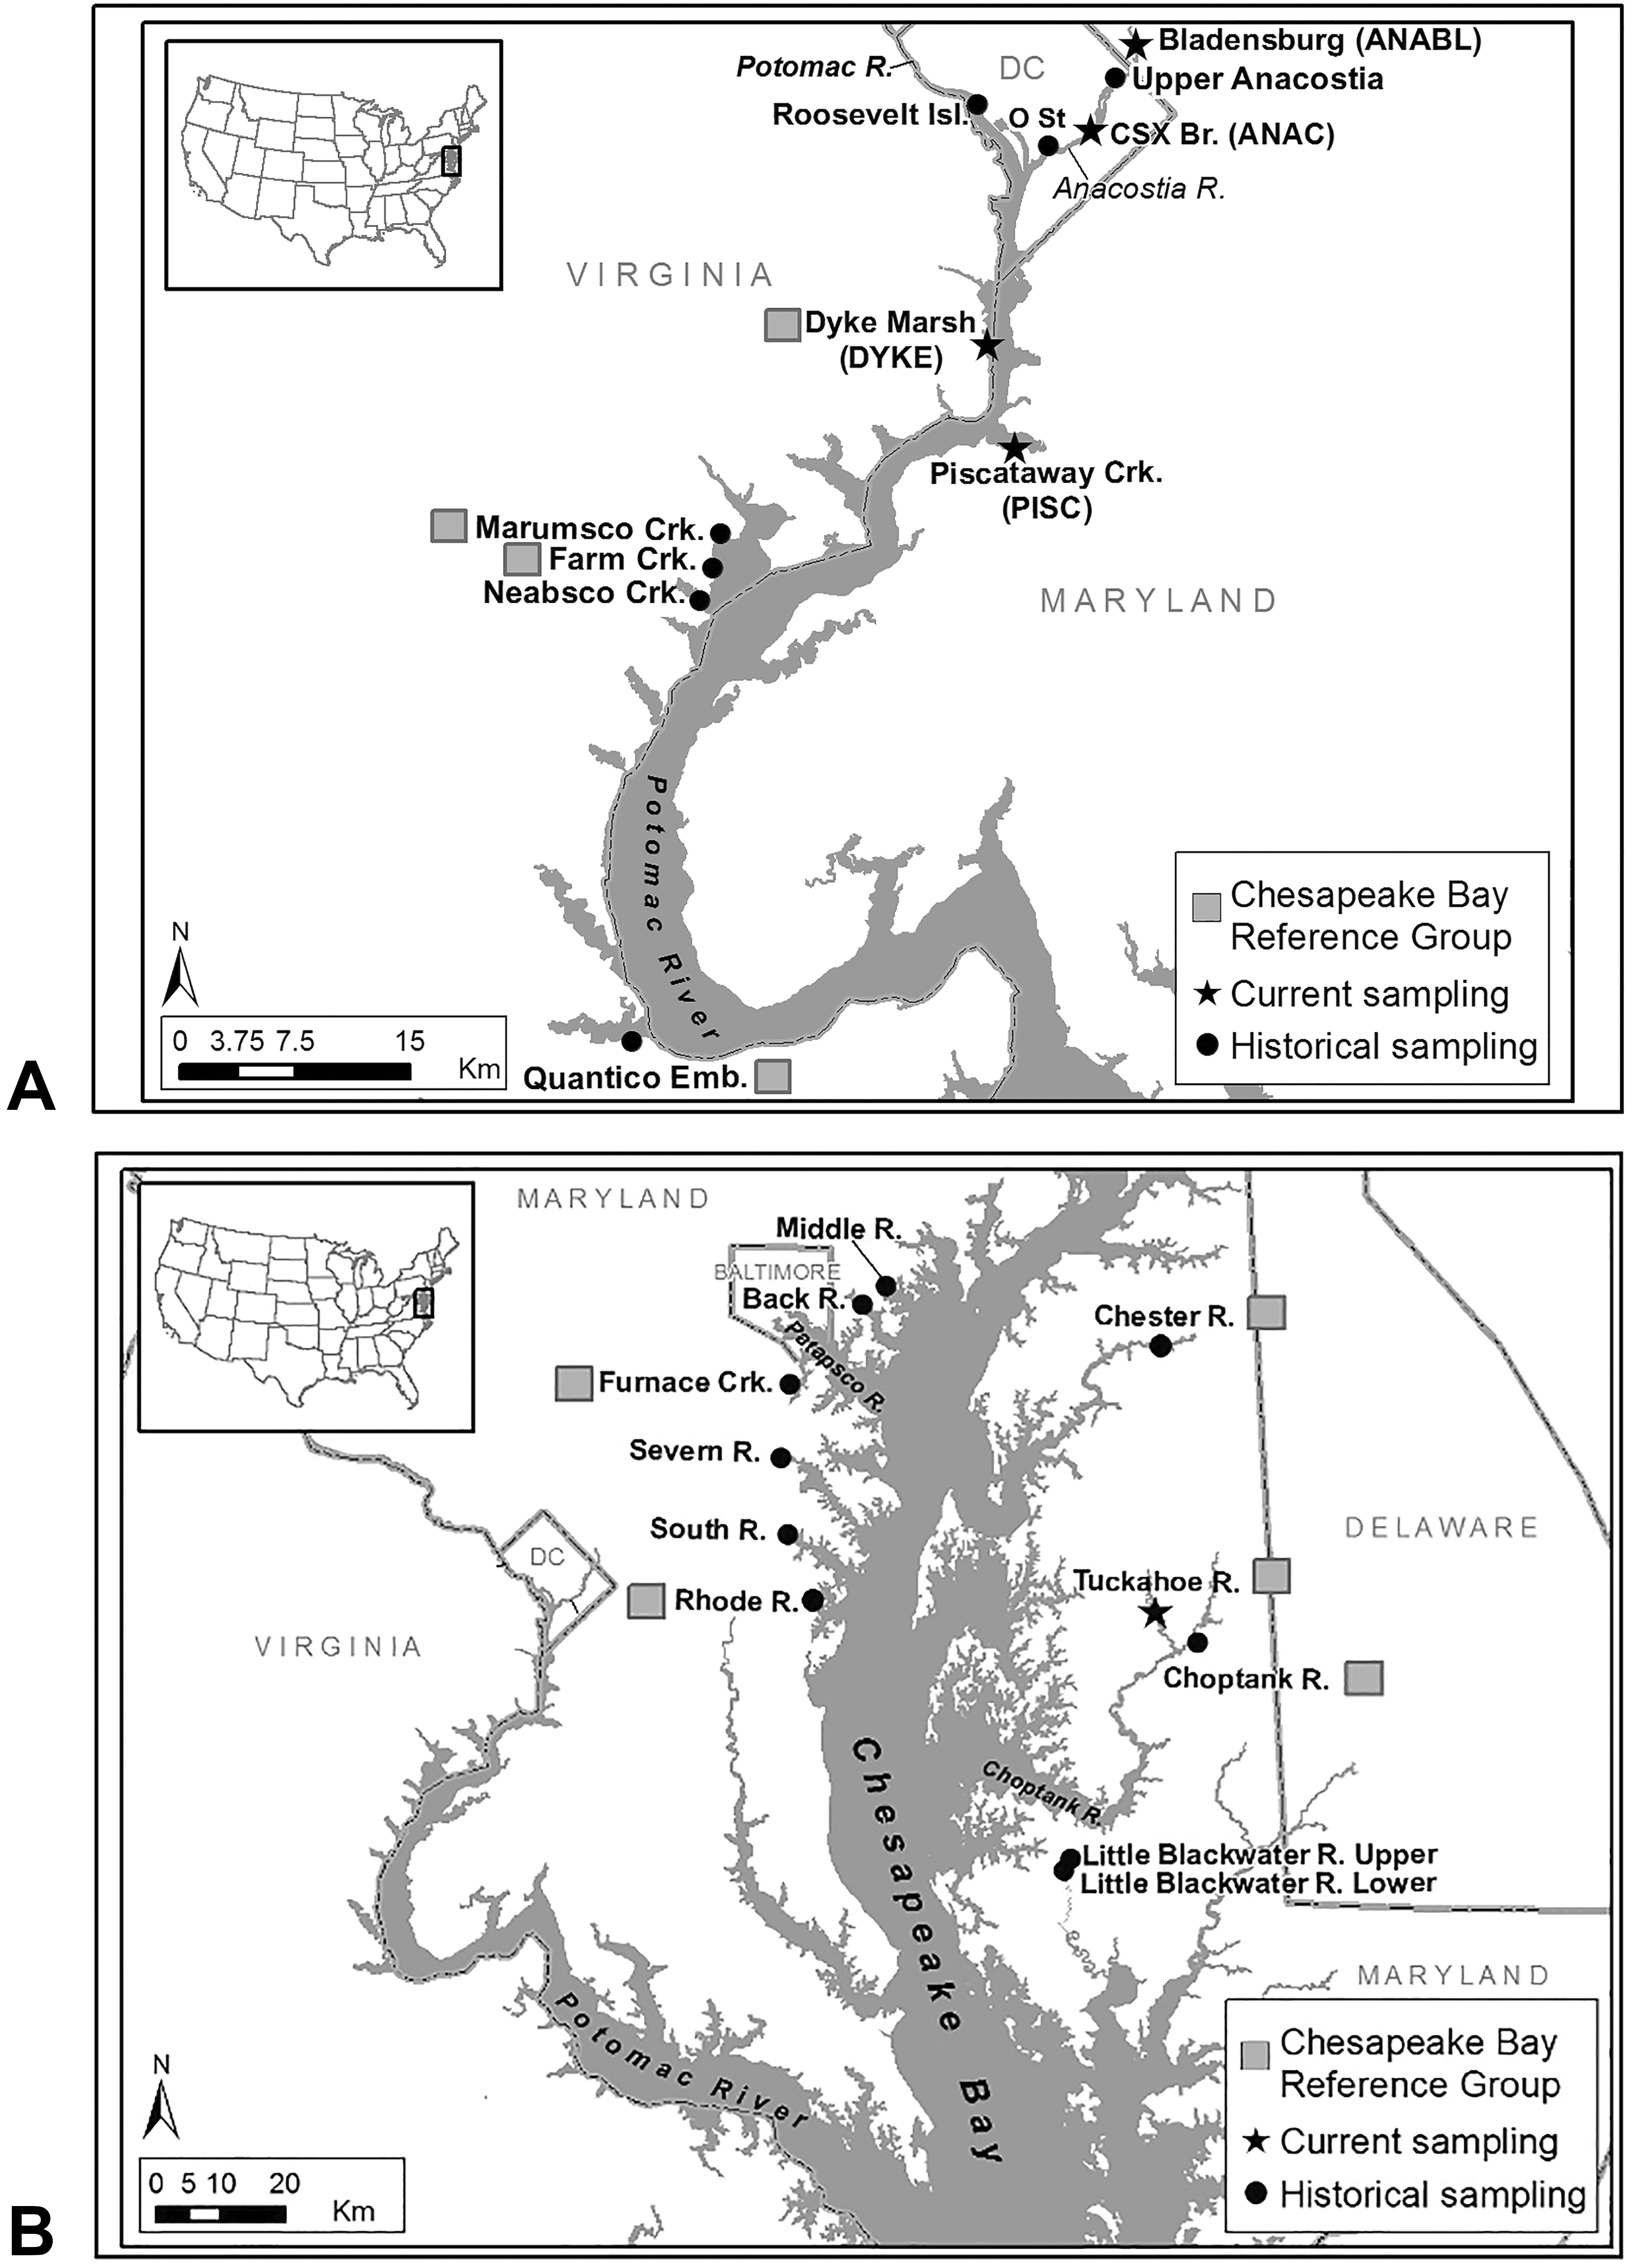
Brown bullhead (Ameiurus nebulosus) tumor survey locations (1992–2016). (A) Potomac and Anacostia Rivers; (B) other rivers in the Chesapeake Bay watershed.
Visible, raised pink, and red lesions on the mouth and operculum, some with grotesque appearance (Figure 1), occur in brown bullhead and attract the attention of fishermen and scientists. Upon microscopic analysis, these lesions are usually confirmed as skin tumors. In a laboratory study, Black et al. (1985) induced skin tumors in brown bullhead by repeatedly painting the skin with sediment extracts containing high PAH concentrations. Baumann, Smith, and Metcalfe (1996) reported that higher oral and cutaneous tumor prevalence occurred in PAH-contaminated Great Lakes tributaries compared with reference sites. Poulet, Wolfe, and Spitsbergen (1994), however, in a survey of skin tumors in 94 brown bullheads from 17 locations in New York State stated that the distribution of tumors in both “polluted” and “nonpolluted” waters did not suggest a strict correlation with exposure to chemical carcinogens. Pinkney et al. (2011) did not find associations between bullhead skin tumor prevalence and exposure to PAHs or alkylating agents based on analyses of liver DNA adducts. Bunton (2000) concluded that other (unknown) factors may be involved in the development of bullhead skin tumors. These may include oncogenic viruses that induce skin tumors (Getchell, Casey, and Bowser 1998), although several studies failed to detect such viruses in brown bullhead (Poulet, Casey, and Spitsbergen 1993; Poulet and Spitsbergen 1996).
Since 1992, the U.S. Fish and Wildlife Service (Service), Chesapeake Bay Field Office (CBFO), has conducted brown bullhead tumor surveys in tributaries in the Maryland portion of the Chesapeake Bay watershed (Pinkney et al. 1995, 2001, 2004a, 2004b, 2011; Pinkney, Harshbarger, and Rutter 2009, 2014; Figure 2) and maintained the Chesapeake Bay Bullhead Tumor Database (Tumor Database, Pinkney 2018). A major attribute of this species is its site fidelity, with a linear home range of about 2 km in the tidal fresh Anacostia River (Sakaris, Jesien, and Pinkney 2005). Pinkney, Harshbarger, and Rutter (2009) evaluated this database (1992–2006) and concluded that liver tumor prevalence met the U.S. Environmental Protection Agency (2006) criteria for an environmental indicator of biological response to PAH contamination. Skin tumor prevalence did not meet the criteria for an environmental indicator because linkages with contaminants were uncertain. Pinkney, Harshbarger, and Rutter (2009) recommended conducting surveys on a regular basis to monitor habitats and track responses to cleanup efforts.
As part of that effort, Pinkney, Harshbarger, and Rutter (2014) surveyed locations in the tidal Potomac watershed including the Anacostia River in 2009, 2010, and 2011. Using logistic regression, they identified length and sex as covariates for liver and skin tumors. They reported a statistically significant decrease in liver tumor probabilities for 280 mm Anacostia (CSX Bridge area) bullheads between the 1996 and 2001 surveys (merged collections: female, 77.8%; male, 48.6%) and the merged 2009 to 2011 surveys (female, 42.5%; male, 16.6%). However, liver tumor prevalences in bullheads from the Anacostia, Potomac River (Washington, DC), and Piscataway Creek (PISC, Fort Washington, MD; ∼17 km downriver from the mouth of the Anacostia) in 2009 to 2011 were still significantly higher than those for pooled data from locations termed the Chesapeake Bay Reference Group (CBRG), based on the Tumor Database. The CBRG is a group of locations with low prevalence of skin and liver tumors determined statistically (Pinkney, Harshbarger, and Rutter 2014), based on Rutter (2010).
Here, we report and interpret the results of tumor surveys conducted in 2014, 2015, and 2016. The objectives are to (1) compare tumor prevalence in bullheads from the Anacostia River and nearby areas across space and time; (2) analyze the 1992–2016 Tumor Database to identify reference locations and test age, length, weight, and sex as possible covariates; and (3) explore whether changes in bullhead exposure to contaminants may help explain the observed trends.
Method
Survey Locations and Collection Procedures
For each collection, the goal was to obtain ∼50 individuals
The primary areas of interest within the tidal Potomac watershed were the Anacostia River near the CSX Railroad Bridge (ANAC, Washington, DC), Anacostia near Bladensburg Marina (ANABL, Bladensburg, MD), and PISC near the Fort Washington Marina (Table 1, Figure 2). A fourth area was the Potomac River in or near Washington, DC. Each year, attempts to obtain a collection from the Potomac River near Theodore Roosevelt Island (POTR, Washington, DC), surveyed in 2009, were unsuccessful. We also targeted Dyke Marsh (DYKE, Alexandria, VA), a 154-hectare freshwater tidal wetland maintained by the National Park Service, about 5 km downriver of the Washington, DC, border. It was successfully sampled in 2016, yielding 48 fish. Each year we attempted to collect from TUCK, part of the CBRG, but only succeeded in 2015 (see Table 1 for location descriptions, collection dates, and sample sizes).
Site Descriptions and Collection Data.
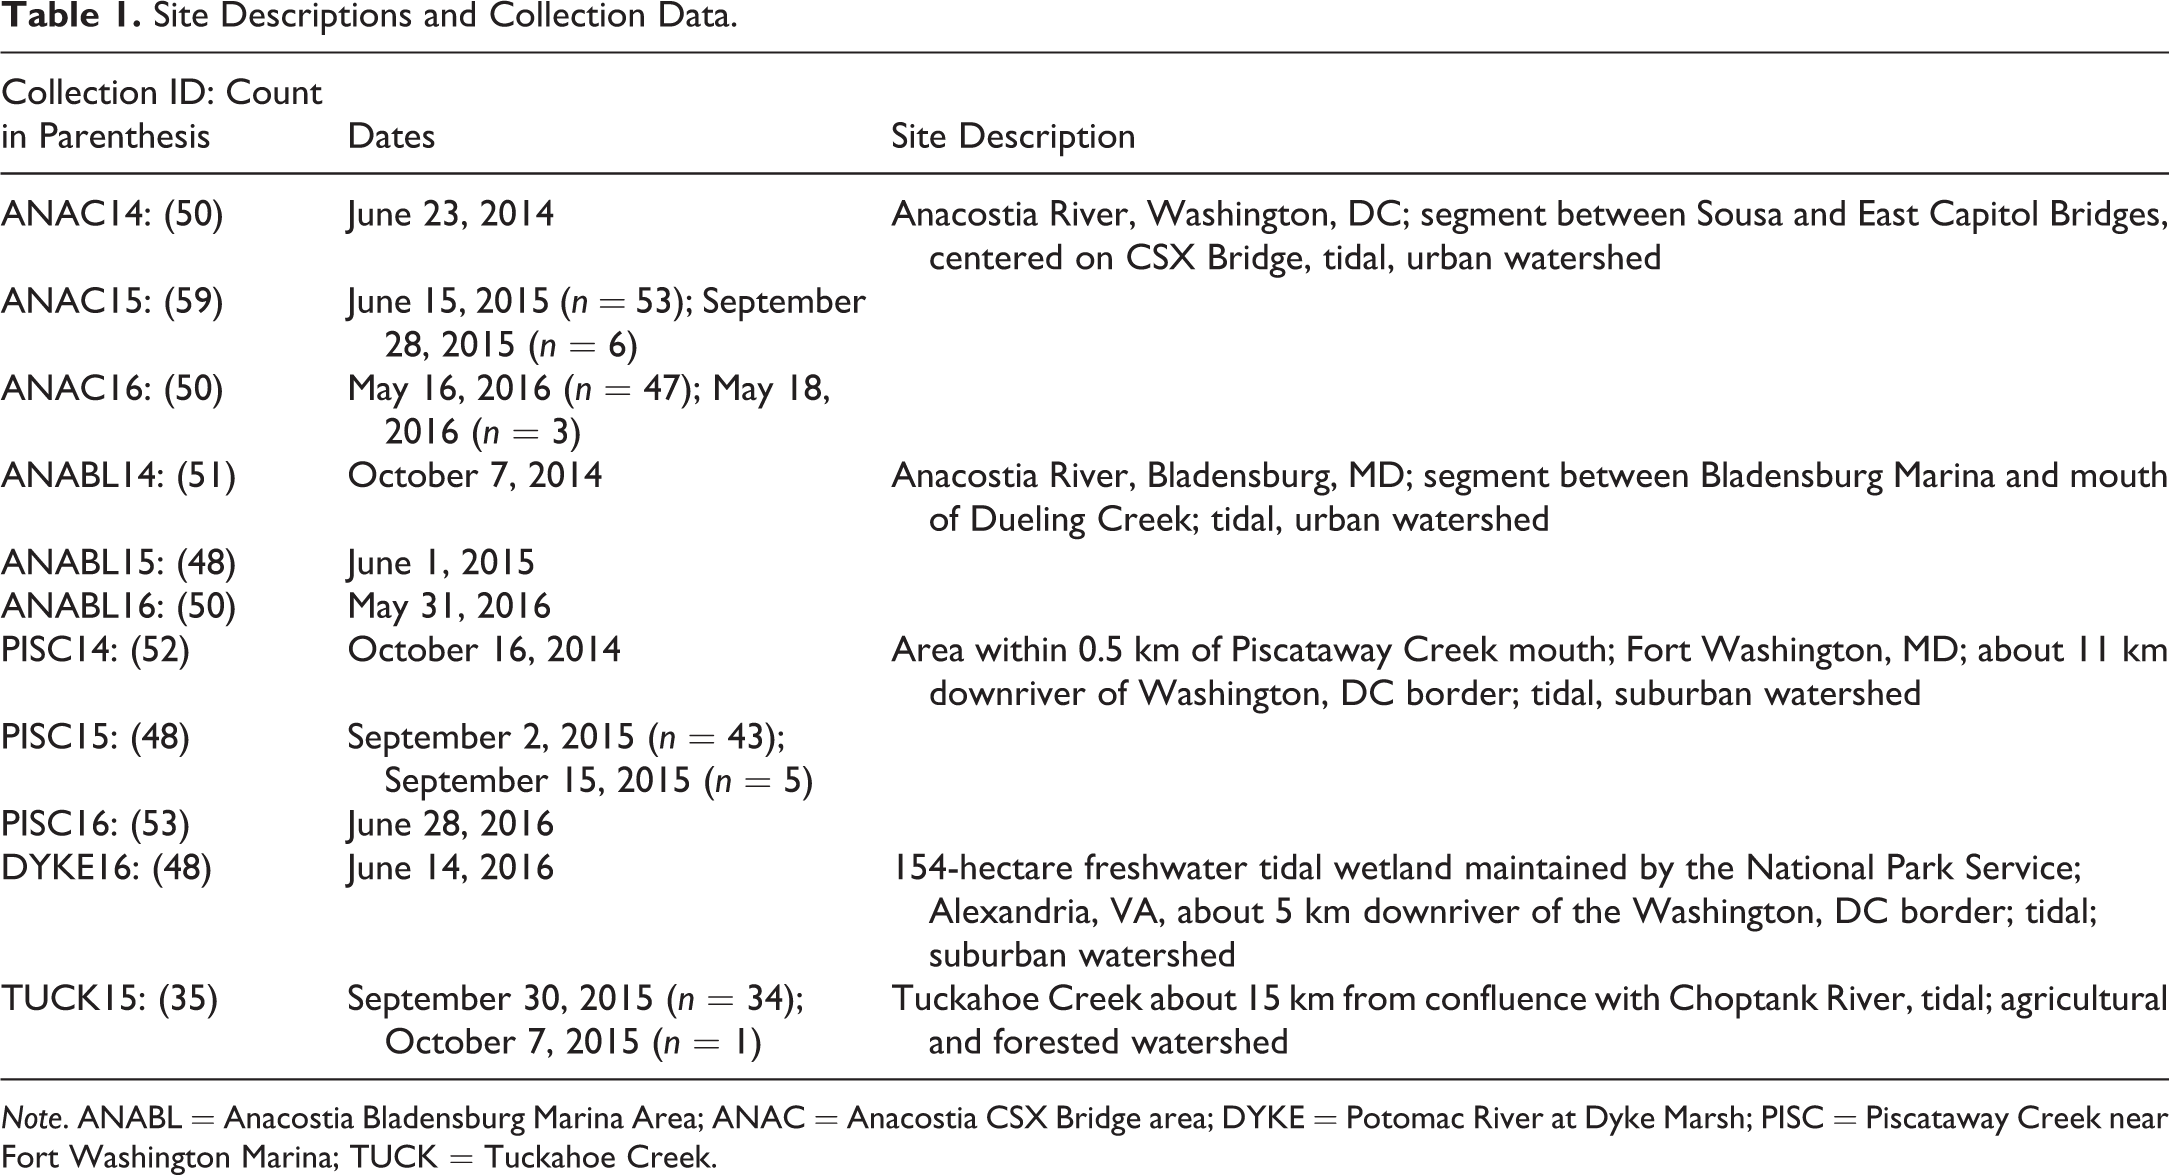
Note. ANABL = Anacostia Bladensburg Marina Area; ANAC = Anacostia CSX Bridge area; DYKE = Potomac River at Dyke Marsh; PISC = Piscataway Creek near Fort Washington Marina; TUCK = Tuckahoe Creek.
Necropsy and Diagnostic Procedures
Laboratory procedures were identical to those reported in Pinkney, Harshbarger, and Rutter (2014). In brief, fish were euthanized with tricaine methanesulfonate (99.5%, Argent Chemical Laboratories, Inc., Redmond, WA), measured for total length, weighed to the nearest gram, and necropsied. The visceral chamber was opened with a midventral longitudinal cut from the pectoral girdle to the anus followed by a short lateral cut in each direction just caudal to the pectoral girdle. Tegument flaps were deflected to expose visceral organs. Sex was determined by examining gonads and recorded. Livers were removed, weighed, and placed on a cutting board. Four, approximately evenly spaced, longitudinal blocks of liver tissue were cut from each liver. These four tissue blocks were placed into a cassette and fixed in 10% neutral-buffered formalin (NBF). All external, raised skin lesions on the mouth and ventral portion of the operculum were considered “suspect tumors,” removed with a bone cutter and fixed in 10% NBF. As necessary, maxillary, mandibular, and operculum bone were decalcified according to the formic acid citrate method described in Luna (1968). Skin and liver specimens were processed routinely for paraffin embedding, and 4-µm to 5-µm sections were microtomed and stained with hematoxylin and eosin according to Luna (1968).
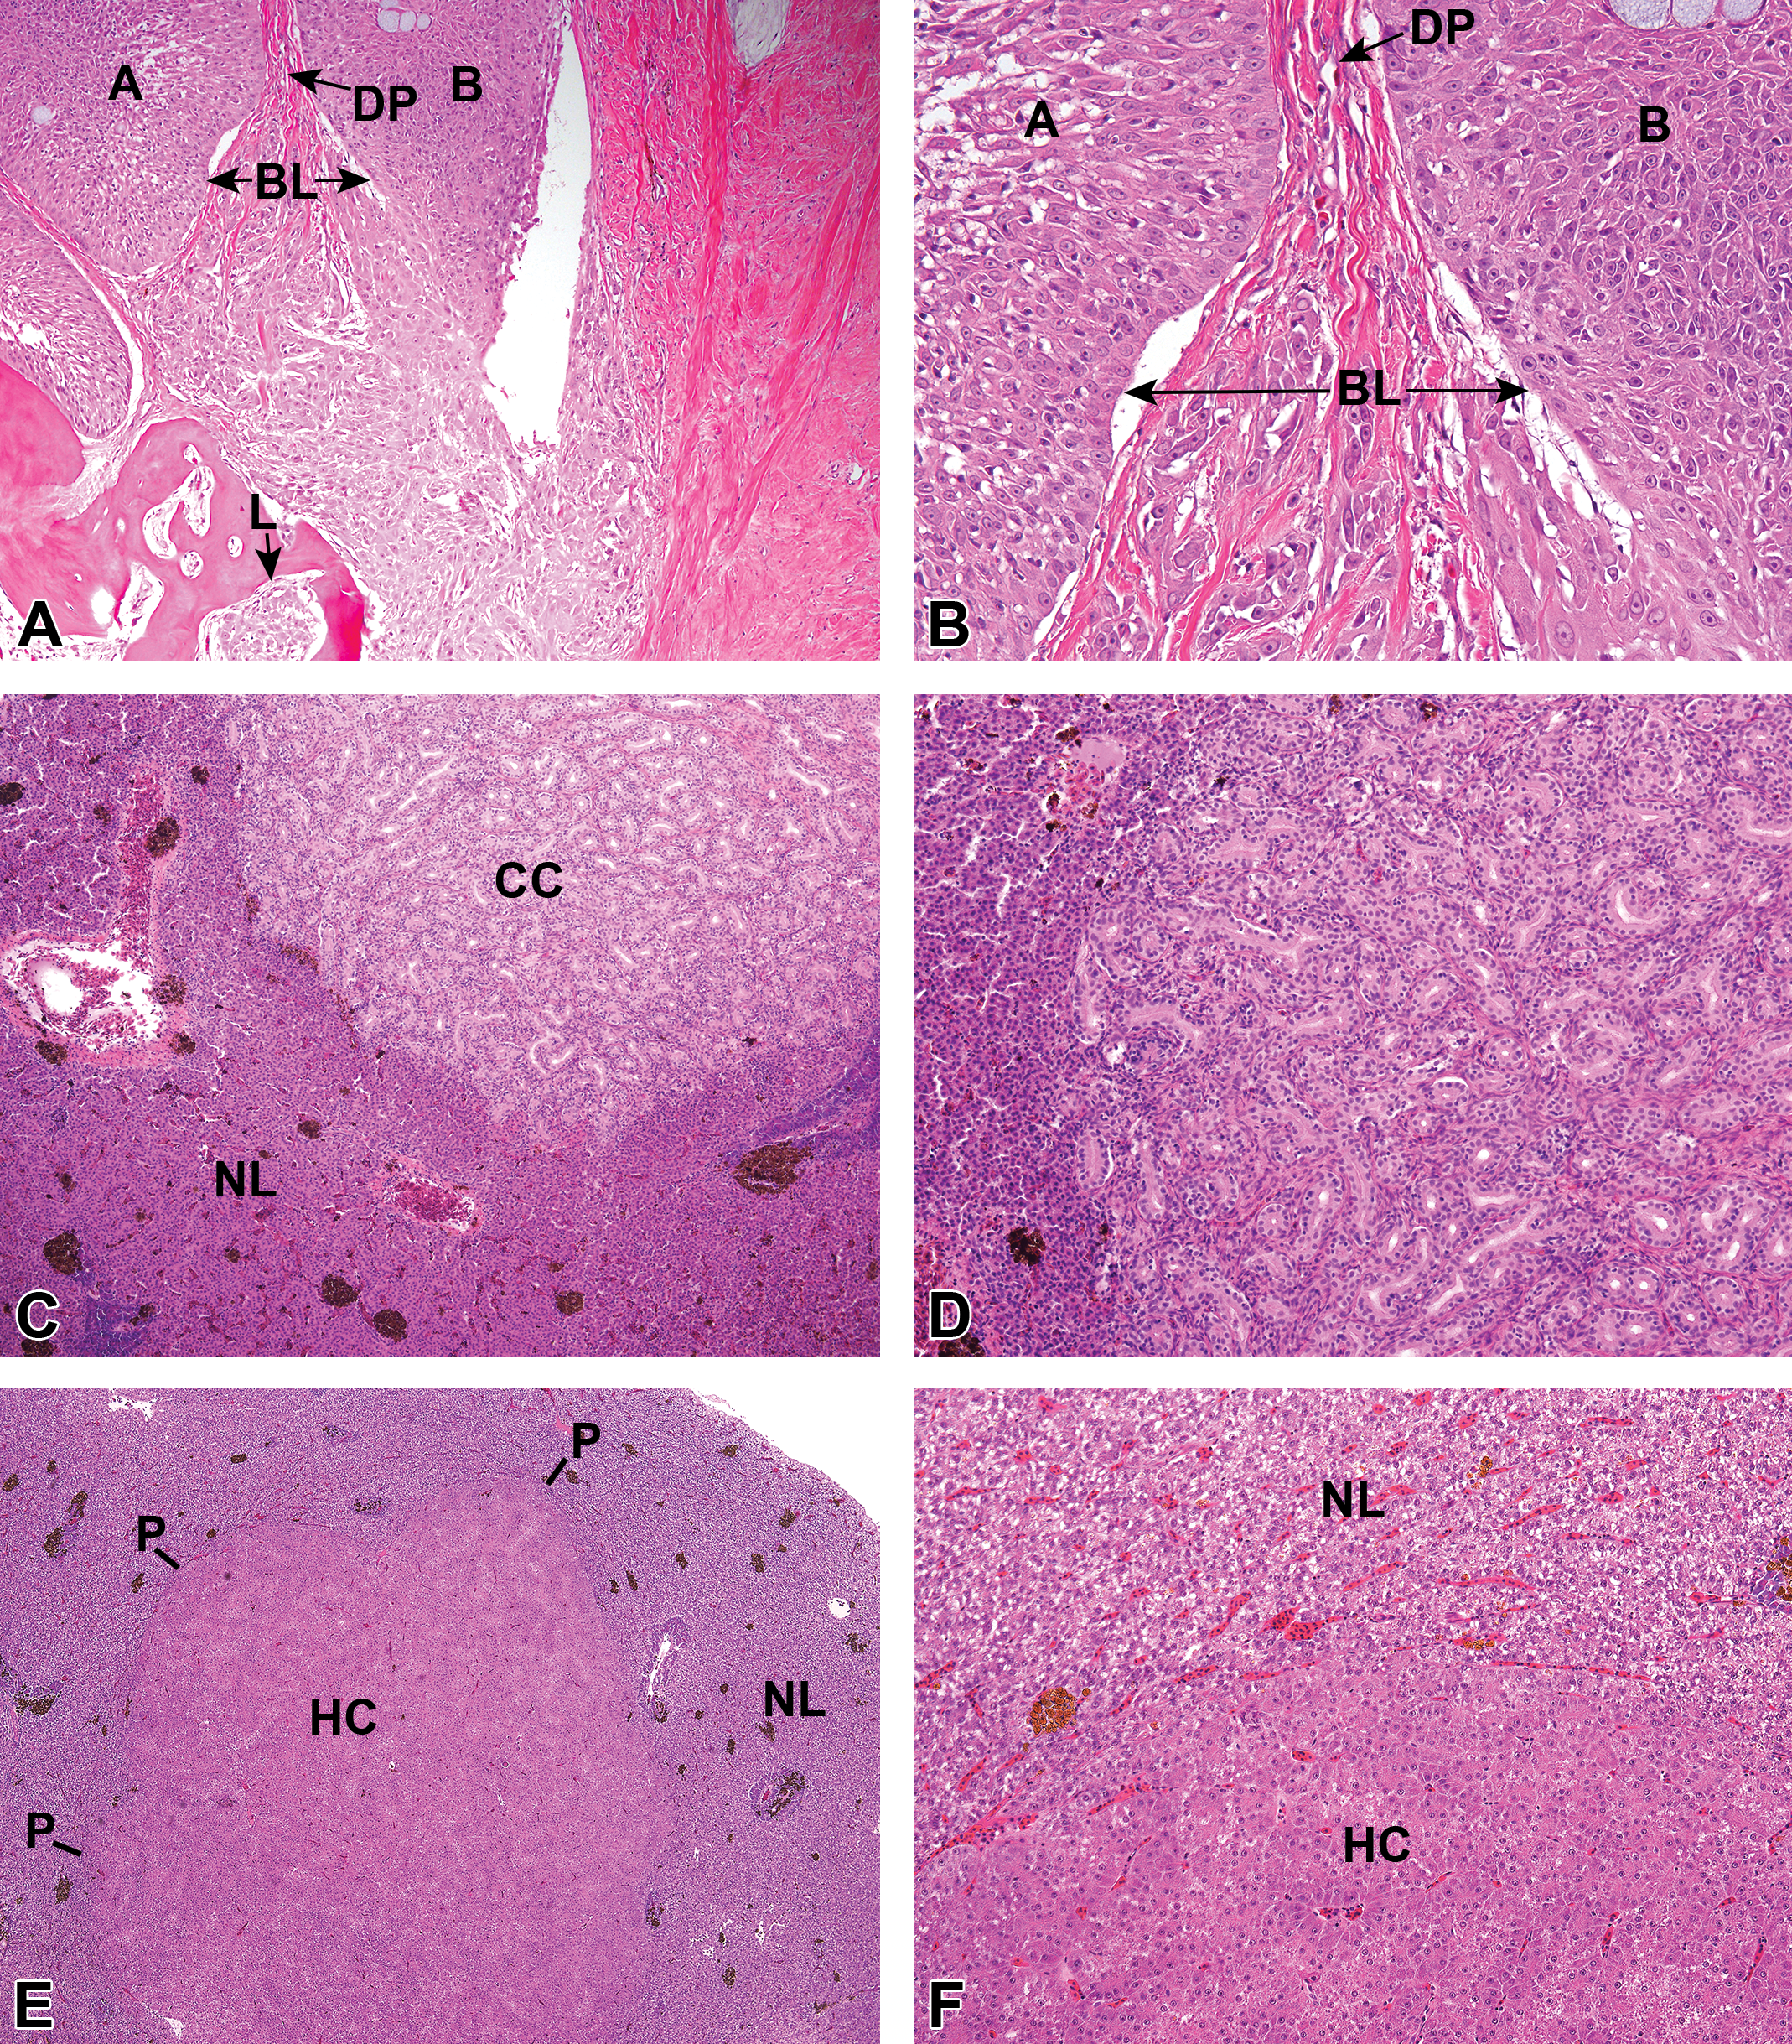
All neoplasms were confirmed by diagnostic pathology. Skin neoplasms were categorized as epidermal papillomas (EPs, noninvasive) or squamous cell carcinomas (SCs, invasive). Hepatocellular neoplasms were hepatocellular carcinomas (HCs, invasive) or hepatocellular adenomas (noninvasive). Bile duct neoplasms were cholangiocarcinomas (CCs, invasive) or cholangiomas (noninvasive). In addition, foci of hepatocellular alteration (FHA) were diagnosed because many researchers consider these likely to be preneoplastic lesions (e.g., Blazer et al. 2006). These diagnostic procedures (reported as Blazer et al. 2006, 2007) have been used by the same pathologist (Harshbarger) for all collections. Images provided in Blazer et al. (2006, 2007) are representative of the pathology observed in the current study.
Otolith Aging
Sagittal otoliths were extracted from brown bullheads and sectioned and aged according to the methods of Buckmeier et al. (2002) and Sakaris and Irwin (2008). Otoliths were lightly browned on a hotplate to improve the clarity of annuli (i.e., annular growth rings). Otoliths were then embedded in a clear epoxy resin and sectioned along a transverse plane with a high-precision, low-speed sectioning saw (Preciso, Model CL-40, low-speed diamond saw). Otolith sections were fixed with Crystalbond adhesive (Ted Pella Inc., Redmond, CA) to microscope slides and polished with ultrafine (1,500 grit) sandpaper to enhance the clarity of annuli. The otolith sections were viewed under a dissecting microscope, illuminated with incident light, and aged by an experienced reader. Annuli on each otolith section were counted from core to edge. If any sections were aged with low confidence (e.g., due to faint annuli or potential presence of false annuli), the second otolith was sectioned to confirm the age.
Sediment Chemistry
Surface sediment samples were collected with a 0.023 m2 petite Ponar grab sampler from five collection areas in 2015, ANAC (n = 5), ANABL (n = 5), PISC (n = 5), TUCK (n = 5), and DYKE (n = 4; Online Supplemental Figures 1 –3). Because of limited resources (allowing for only five samples in one year), we sampled in the middle year of the study (2015) and focused on sediments rich in fine sands, silts, and clays. Such sediments have greater surface area and greater total organic carbon (TOC) content, both of which are often positively correlated with concentrations of polychlorinated biphenyls (PCBs), PAHs, and organochlorine (OC) pesticides (Burton 2002; Hartwell and Hameedi 2007).
The top ∼5 cm from 2 to 4 grabs was scooped off with a stainless steel spoon and placed into a precleaned stainless steel bowl. The sample was homogenized with a stainless steel spoon and placed into precleaned glass jars for analysis of organic contaminants, grain size, and TOC. Samples were kept on ice and refrigerated (TOC/grain size) or frozen (contaminants). Between stations, the Ponar, stainless steel bowl, and utensils were cleaned with laboratory grade detergent, rinsed with deionized water, pesticide residue grade acetone, and deionized water.
Chemical analyses were conducted by laboratories under contract to the Service through the Analytical Control Facility, which provides quality assurance/quality control. Sediments were shipped on ice overnight to AXYS Analytical Services (Sidney, British Columbia, Canada) for analysis of 40 PAHs including alkylated compounds, OC pesticides, and 209 PCB congeners (listed in Online Supplemental Table 1). Sediment TOC and grain size samples were shipped on ice and analyzed at TDI Brooks International, College Station, TX.
PCB congeners, α-BHC, α-chlordane, β-BHC, cis-nonachlor, γ-BHC, γ-chlordane, HCB, mirex, o, p′-DDD, o, p′-DDE, o, p′-DDT, oxychlordane, p, p′-DDD, p, p′-DDE, p, p′-DDT, toxaphene, and trans-nonachlor were analyzed by low-resolution gas chromatography/mass spectrometry according to AXYS method MLA-007. Dieldrin, endrin, and heptachlor epoxide were analyzed by gas chromatograph (GC) with an electron capture detector (AXYS MLA-007). PAHs were analyzed on a high-resolution GC using a nonpolar capillary chromatographic column, coupled to a low-resolution mass spectrometer (AXYS MLA-021). Detection limits were approximately 0.001 to 0.030 ppm for PAHs and 0.5 to 2.0 parts per billion (ppb) for PCB congeners and OC pesticides.
Total PCBs were calculated as the sum of the congeners; some of which were reported as two or more co-eluting congeners (Online Supplemental Table 1). Nondetected analytes were set to zero for calculating total PCBs, total PAHs, total chlordane (sum of α- and γ-chlordane, cis- and trans-nonachlor, oxychlordane, and heptachlor epoxide), and total DDT (sum of o, p′-DDD, p, p′-DDD, o, p′-DDE, p, p′-DDE, o, p′-DDT, and p, p′-DDT). Total carcinogenic PAHs were the sum of benz(a)anthracene, benz(b)fluoranthene, benz(k)fluoranthene, benzo(a)pyrene, chrysene, benz(g, h, i)perylene, dibenz(a, h)anthracene, and indeno[1,2,3-c, d]perylene (Pinkney et al. 2001).
Data Analysis
Fish data
We followed the logistic regression approach of Pinkney, Harshbarger, and Rutter (2014). With the 2014–2016 collections, the Tumor Database now has 49 collections and 1,945 bullheads obtained from 1992 to 2016. Logistic regression (Rutter 2010) was used to identify covariates that best describe the prevalence of liver and skin tumors in the updated Tumor Database. The response variables were total skin tumors (sum of invasive SCs and noninvasive papillomas) and total liver tumors (sum of bile duct and hepatocellular neoplasms). Thus, invasive and noninvasive tumors were equally weighted. Tested models included length, sex, weight, and combinations of these variables. Because the method of aging switched from spines (1996–2011) to otoliths (2014–2016, plus Chester River 2010 [CHES10]), we did not test age as a possible covariate in the model, rather a separate analysis was performed as described below. The model with the lowest Bayes information criterion (BIC) value was considered the best fit model with the least complexity. We iteratively tested each new collection for inclusion in the CBRG.
For locations with multiple years of collection, BIC values were compared with and without combining the collections across years. Thus, when combining years resulted in lower BIC values, the tumor prevalence was considered to be similar across years, and collections were combined. Posterior distributions for tumor prevalence were determined using a Bayesian hierarchical model similar to Rutter (2010). Cauchy distributions with a median of 0 and scale parameter of 2.5 (Gelman et al. 2008) were used as prior distributions for the parameters in the logistic regression. Using the 95th highest posterior density interval (HPDI), we compared locations within the tidal Potomac and Anacostia watersheds across space and time and with the updated CBRG. The models tested for differences in prevalence between collections (or combined collections, i.e., locations) using the covariates (e.g., length and sex for liver tumors) without interaction. Thus, the model assumes the differences between locations are the same for males and females. Graphs of the probability of females (as an example) developing liver or skin tumors according to total length were prepared with the statistical groups labeled with letters. Point estimates and confidence intervals were determined for standardized 280 mm individuals; this length was chosen because it approximates the average length of bullheads in the database. Locations were determined to be different if the 95% HPDI for the difference in intercept term representing each location did not include zero, based upon the posterior distributions of the parameters. For additional details, see Rutter (2010).
To test age as a possible covariate, we conducted a separate logistic regression analysis on the 12 collections with otolith age data (Online Supplemental Table 2). These were ten tidal Potomac watershed collections—ANAC14 to 16, ANABL14 to 16, PISC14 to 16, and DYKE16—and two Eastern Shore collections—TUCK15 and CHES10.
Summary of Liver and Skin Pathology Data.
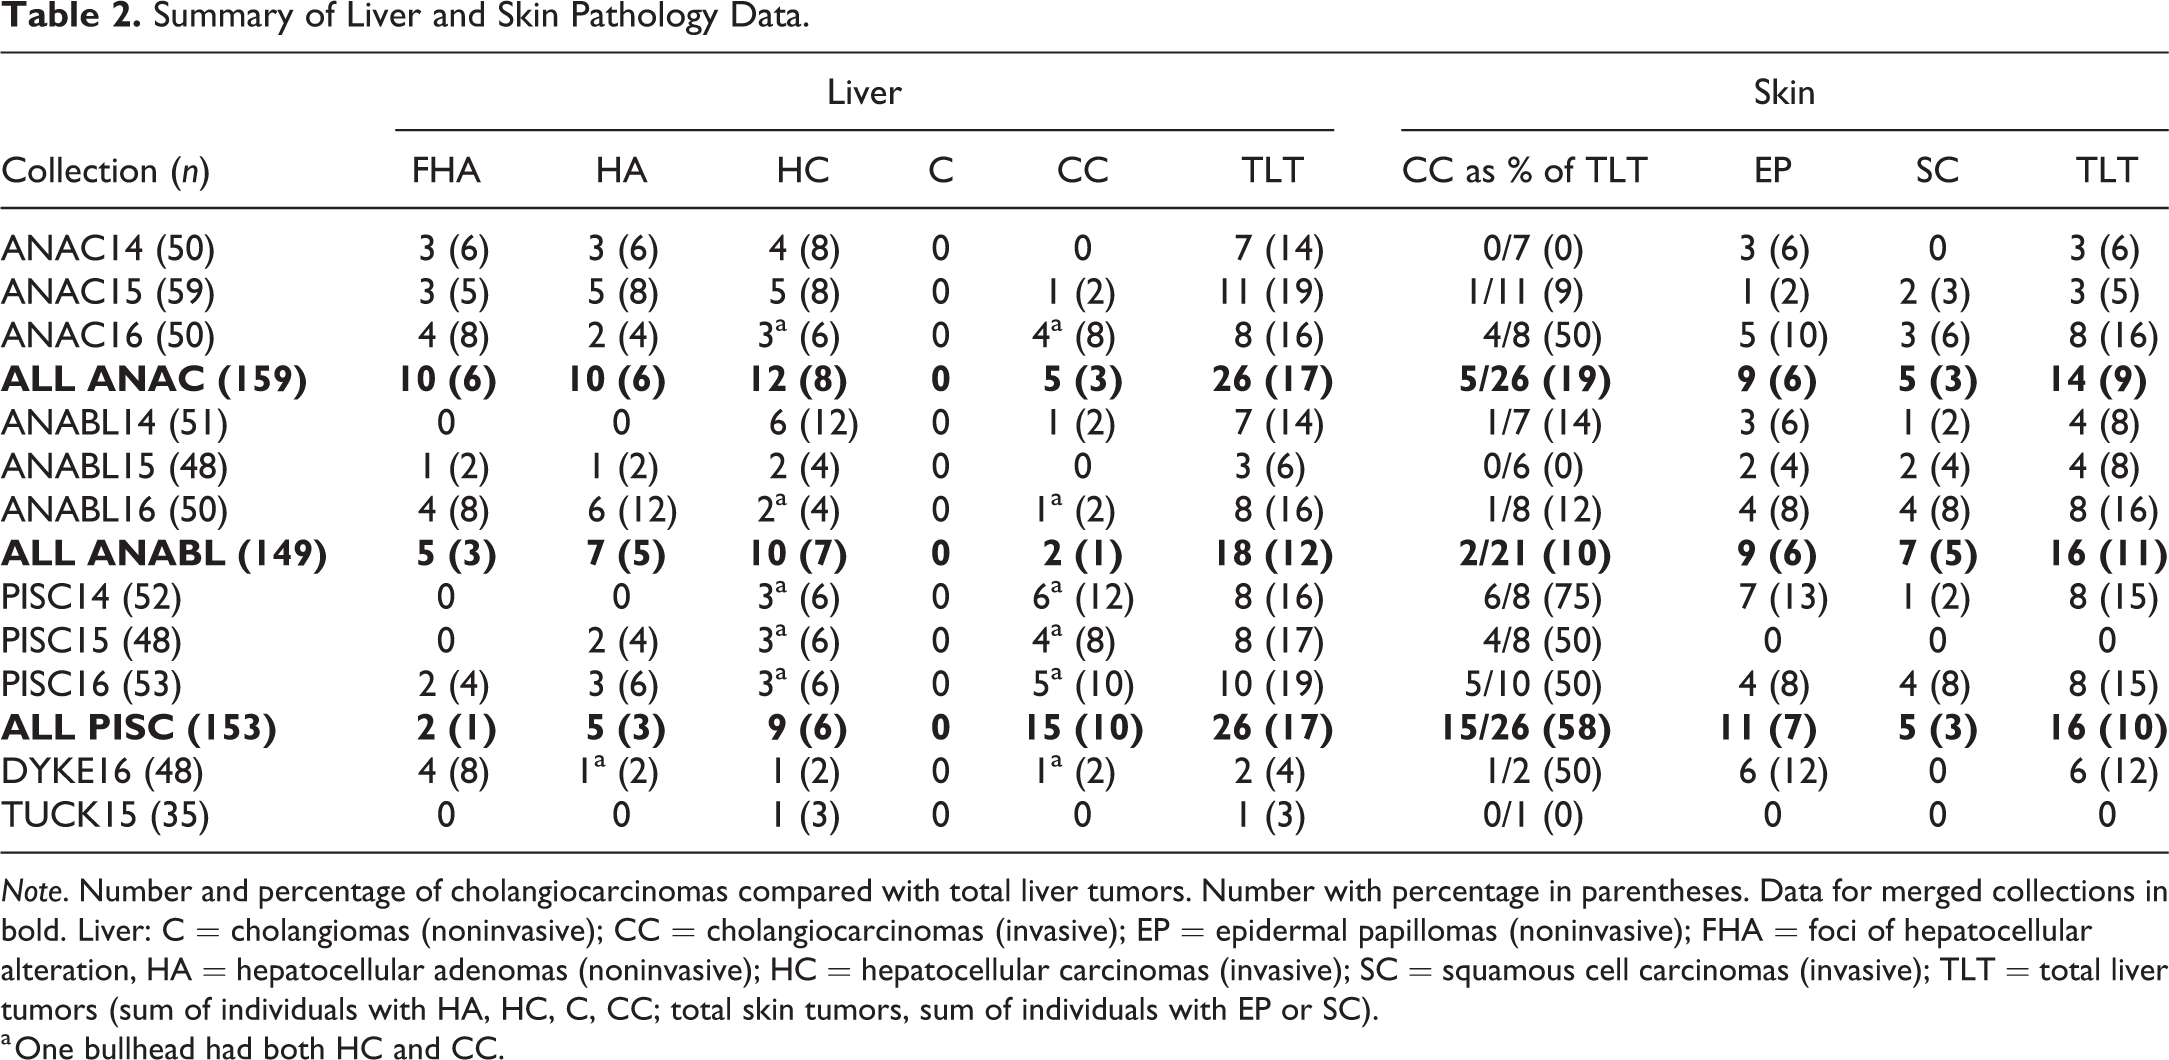
Note. Number and percentage of cholangiocarcinomas compared with total liver tumors. Number with percentage in parentheses. Data for merged collections in bold. Liver: C = cholangiomas (noninvasive); CC = cholangiocarcinomas (invasive); EP = epidermal papillomas (noninvasive); FHA = foci of hepatocellular alteration, HA = hepatocellular adenomas (noninvasive); HC = hepatocellular carcinomas (invasive); SC = squamous cell carcinomas (invasive); TLT = total liver tumors (sum of individuals with HA, HC, C, CC; total skin tumors, sum of individuals with EP or SC).
a One bullhead had both HC and CC.
Sediment data
To lessen the effect of TOC on sediment concentrations, we rejected any samples with less than 2.0% TOC, resulting in the removal of one ANABL sample with 0.16% TOC and 3.3% fine-grained sediments. We compared sediment concentrations of total and carcinogenic PAHs, total PCBs, total DDT compounds, and total chlordane for the five locations sampled in 2015. If parametric assumptions were satisfied (with or without log transformation), we used analysis of variance followed by Tukey’s multiple comparison. If parametric assumptions were not met, a Kruskal–Wallis test was performed followed by Dunn’s method.
To evaluate whether data should be normalized for TOC, we followed the approach of Sanger, Holland, and Scott (1999) by testing for a significant linear regression between the contaminant concentrations and TOC. Analyses were performed for the following locations: (1) pooled data for both Anacostia locations and (2) pooled data for DYKE and Piscataway. There were too few Tuckahoe samples to perform a regression analysis. Because these results showed significant regressions for all analyte groups, contaminant concentrations were compared across locations on both a bulk sediment- and TOC-normalized basis.
For ANAC and ANABL, we compared the 2015 concentrations with data from surface (top ∼5 cm) samples collected from these areas in 2000 by the Academy of Natural Sciences (ANS; Velinsky and Ashley 2001), retaining only those with ≥2.0 TOC. For these comparisons, t tests and Mann–Whitney tests were used as appropriate. Because the linear regression analyses of the ANS data for TOC normalization were not statistically significant, data were not normalized. All tests were performed with Sigma Plot 12 (Systat Software, Inc., San Jose, CA), using a p value of .05.
Results
Pathology
Nearly all of the suspected oral and skin lesions were diagnosed as tumors (EP or SC; Figure 3a,b). We did not observe liver lesions suspected to be tumors based on gross appearance, although an example of a CC from a previous collection is illustrated in Figure 1. Liver and skin tumors and preneoplastic lesions (FHA) were tallied (Table 2). The highest percentage of liver tumors was 19% in the ANAC15 and PISC16 collections, and the lowest was in TUCK15 at 3% and in DYKE16 at 4%. The highest percentage of skin tumors was in both ANAC16 and ANABL16 at 16%, with the lowest in PISC15 (0%). Liver tumors in the Anacostia collections (Figure 3c,d,e,f) were primarily HCs, with CCs comprising 19% of the ANAC liver tumors and 10% of the ANABL liver tumors. In the PISC collections, however, CCs were more common, comprising 58% (15/26) of the liver tumors.
Otolith Aging
Mean ages in the 12 collections ranged from 4.1 to 5.7 years. Bullheads from both Anacostia locations and DYKE ranged in age from 2 to 10 years and those from PISC from 2 to 14 years (Online Supplemental Table 2). The maximum age was 5 for CHES10 and 6 for TUCK15. The Anacostia and Piscataway collections were dominated by the 2010 year class that persisted through the three collection years. In TUCK15, the 2010 and 2011 year classes were prominent, whereas CHES10 was dominated by the 2005 year class. DYKE16 had greater variation in age structure, with a strong 2013 year class.
Logistic Regression Analyses
By adding the TUCK15 and DYKE16 collections (83 fish total), the CBRG now consists of 473 bullheads from nine Bay watershed locations (Table 3). Using 280 mm as a standard length, the mean estimates for male and female liver tumor prevalence for the CBRG were 2.7% and 9.4%, respectively. For skin tumors, the mean estimate was 3.2% for males and 4.1% for females. Based on BIC, we were able to pool skin and liver tumor data from the same locations across the sampling years (2014–2016).
Tumor Prevalence Probabilities (%; Mean with Range from Lower Bound [LB] to Upper Bound [UB]) for a 280-mm Brown Bullhead (Ameiurus nebulosus) from Locations Included in the Chesapeake Bay Reference Group (CBRG) (Mean Percent with 95% Highest Posterior Density Interval).
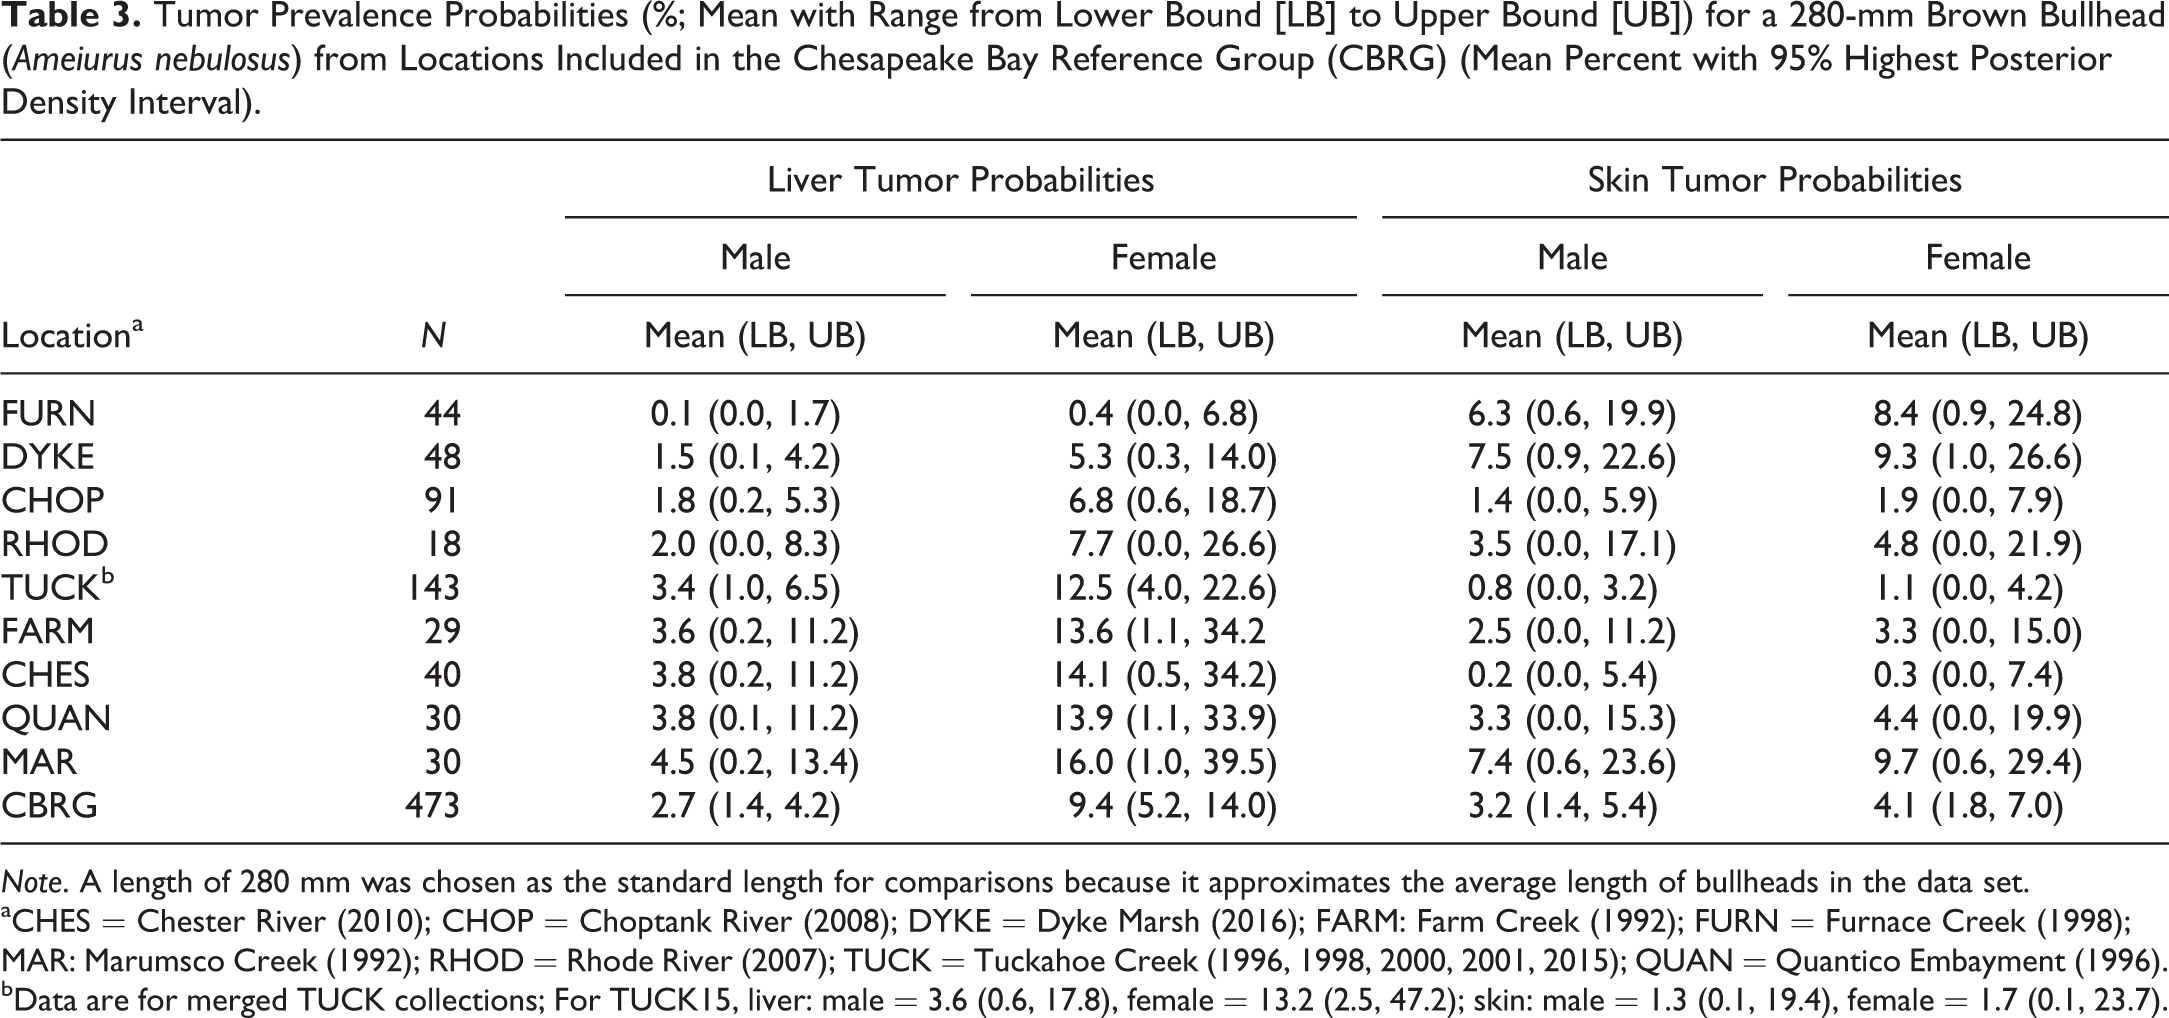
Note. A length of 280 mm was chosen as the standard length for comparisons because it approximates the average length of bullheads in the data set.
aCHES = Chester River (2010); CHOP = Choptank River (2008); DYKE = Dyke Marsh (2016); FARM: Farm Creek (1992); FURN = Furnace Creek (1998); MAR: Marumsco Creek (1992); RHOD = Rhode River (2007); TUCK = Tuckahoe Creek (1996, 1998, 2000, 2001, 2015); QUAN = Quantico Embayment (1996).
bData are for merged TUCK collections; For TUCK15, liver: male = 3.6 (0.6, 17.8), female = 13.2 (2.5, 47.2); skin: male = 1.3 (0.1, 19.4), female = 1.7 (0.1, 23.7).
For liver tumors, the best fit model (lowest BIC) included length and sex as covariates (Online Supplemental Table 3). For each location, because there were no significant differences between years, data were pooled. We reported no statistically significant differences between the pooled ANAC14 to 16, pooled ANABL14 to 16, and pooled PISC14 to 16 collections (Table 4, Figure 4). Whereas ANABL14 to 16 was not significantly elevated in relation to the CBRG, both ANAC14 to 16 and PISC14 to 16 were significantly higher. Tracking trends over time at ANAC, the liver tumor probability for a 280-mm female decreased from 77.8% in the 1996 and 2001 pooled collections to 42.5% in 2009 to 2011 and to 18.0% in 2014 to 2016. The liver tumor prevalences for all three of these periods were statistically different, with a greater than fourfold decline from the first to last period. The PISC14 to 16 prevalence, however, was not significantly different from that in 2011. No temporal comparisons were possible for ANABL, first surveyed in 2014. The spatial comparisons include Anacostia locations surveyed in 2000 and 2001 (O St. and Upper Anacostia) and the POTR location surveyed in 2009 (Figure 2).
Comparison of Liver Tumor Probabilities (Mean Percent with 95% Highest Posterior Density Interval [HPDI] for a 280-mm Brown Bullhead [Ameiurus nebulosus] in Parentheses) Based on the Best Fit Model with Length and Sex as Covariates.
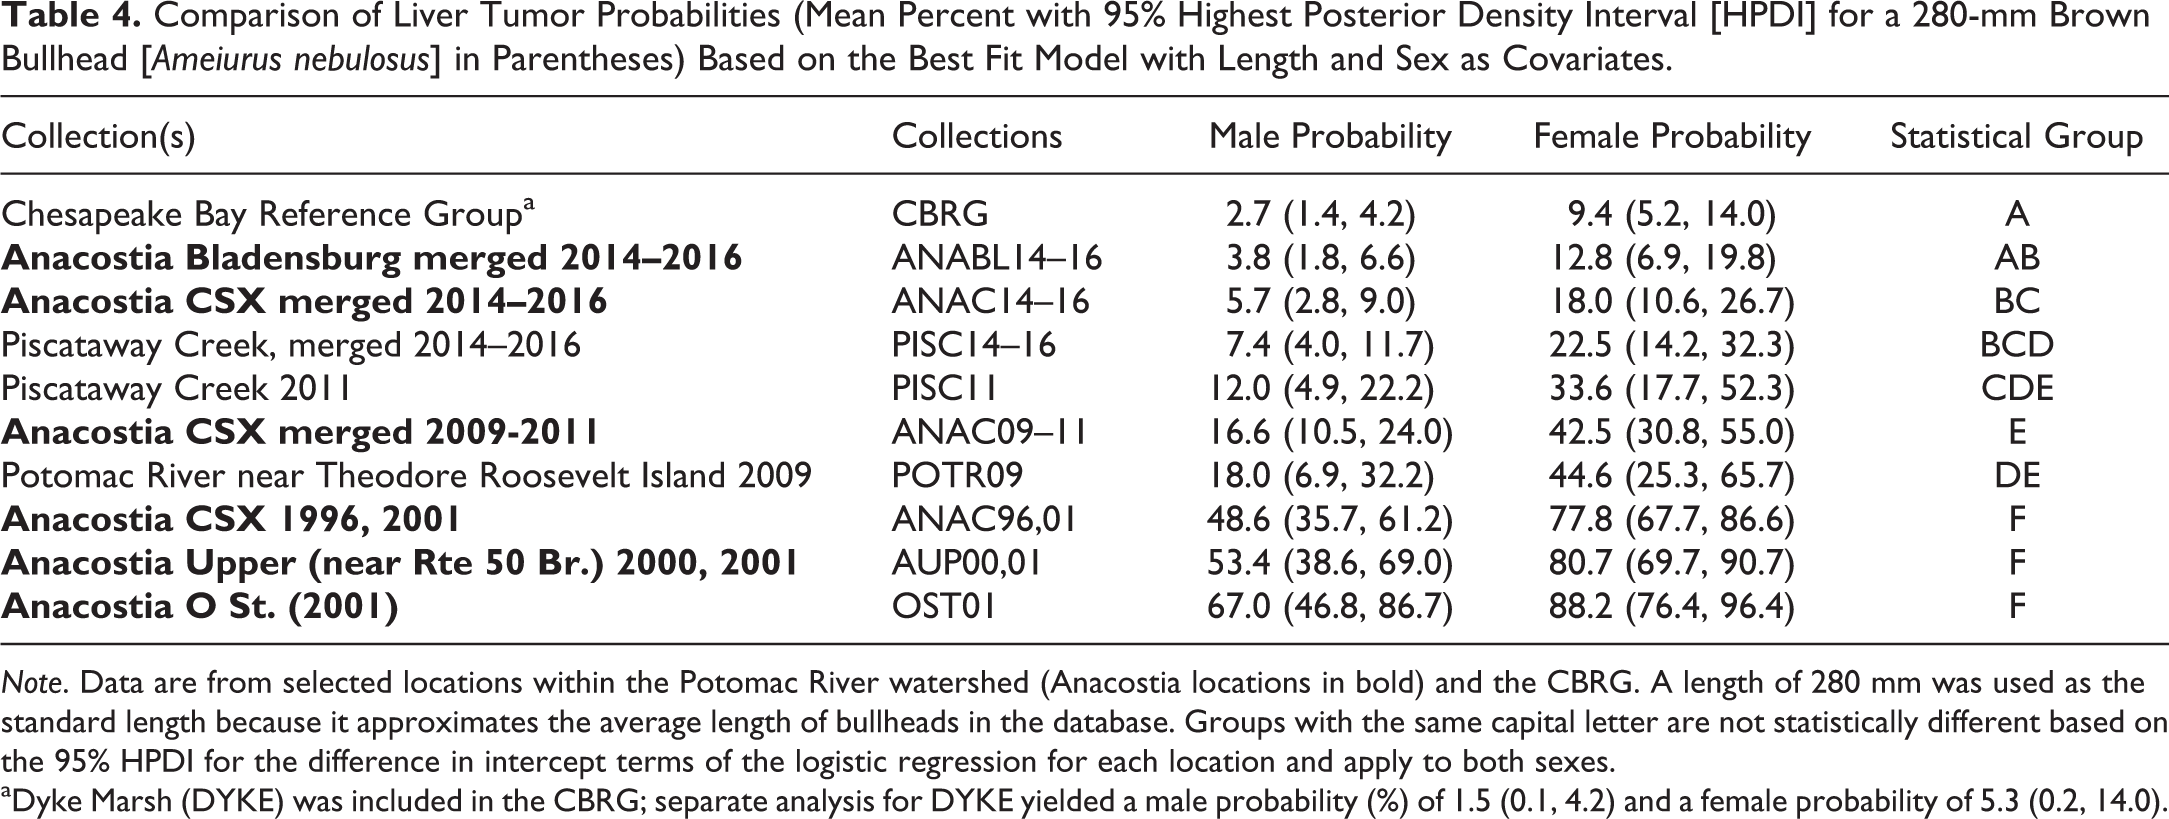
Note. Data are from selected locations within the Potomac River watershed (Anacostia locations in bold) and the CBRG. A length of 280 mm was used as the standard length because it approximates the average length of bullheads in the database. Groups with the same capital letter are not statistically different based on the 95% HPDI for the difference in intercept terms of the logistic regression for each location and apply to both sexes.
aDyke Marsh (DYKE) was included in the CBRG; separate analysis for DYKE yielded a male probability (%) of 1.5 (0.1, 4.2) and a female probability of 5.3 (0.2, 14.0).
For skin tumors, the best fit model included weight and sex as significant covariates (Online Supplemental Tables 3, 4). Using this model, there were no statistically significant differences between the ANAC14 to 16, ANABL14 to 16, PISC14 to 16, PISC11, and POTR09 collections (Online Supplemental Table 4). None of these merged collections were significantly different from the CBRG. At ANAC, the probability that a 280-mm female would have a skin tumor decreased from 26.7% in the 1996 and 2001 pooled collections to 15.8% in 2009 to 2011 and to 4.3% in 2014 to 2016, about a sixfold decline.
To be consistent with the skin tumor analysis reported in Pinkney, Harshbarger, and Rutter (2014), the third best model (Online Supplemental Table 3) using length and sex as covariates was used (Table 5, Figure 5). There were no statistically significant differences between the ANAC14 to 16, ANABL14 to 16, PISC14 to 16, PISC11, and POTR09 collections. None of these groupings were significantly elevated relative to the CBRG. The probability that a 280-mm female from the ANAC location would have a skin tumor decreased significantly from 28.3% in the 1996 and 2001 pooled collections to 16.9% in 2009 to 2011 and to 4.7% in 2014 to 2016 (Table 5, Figure 5).
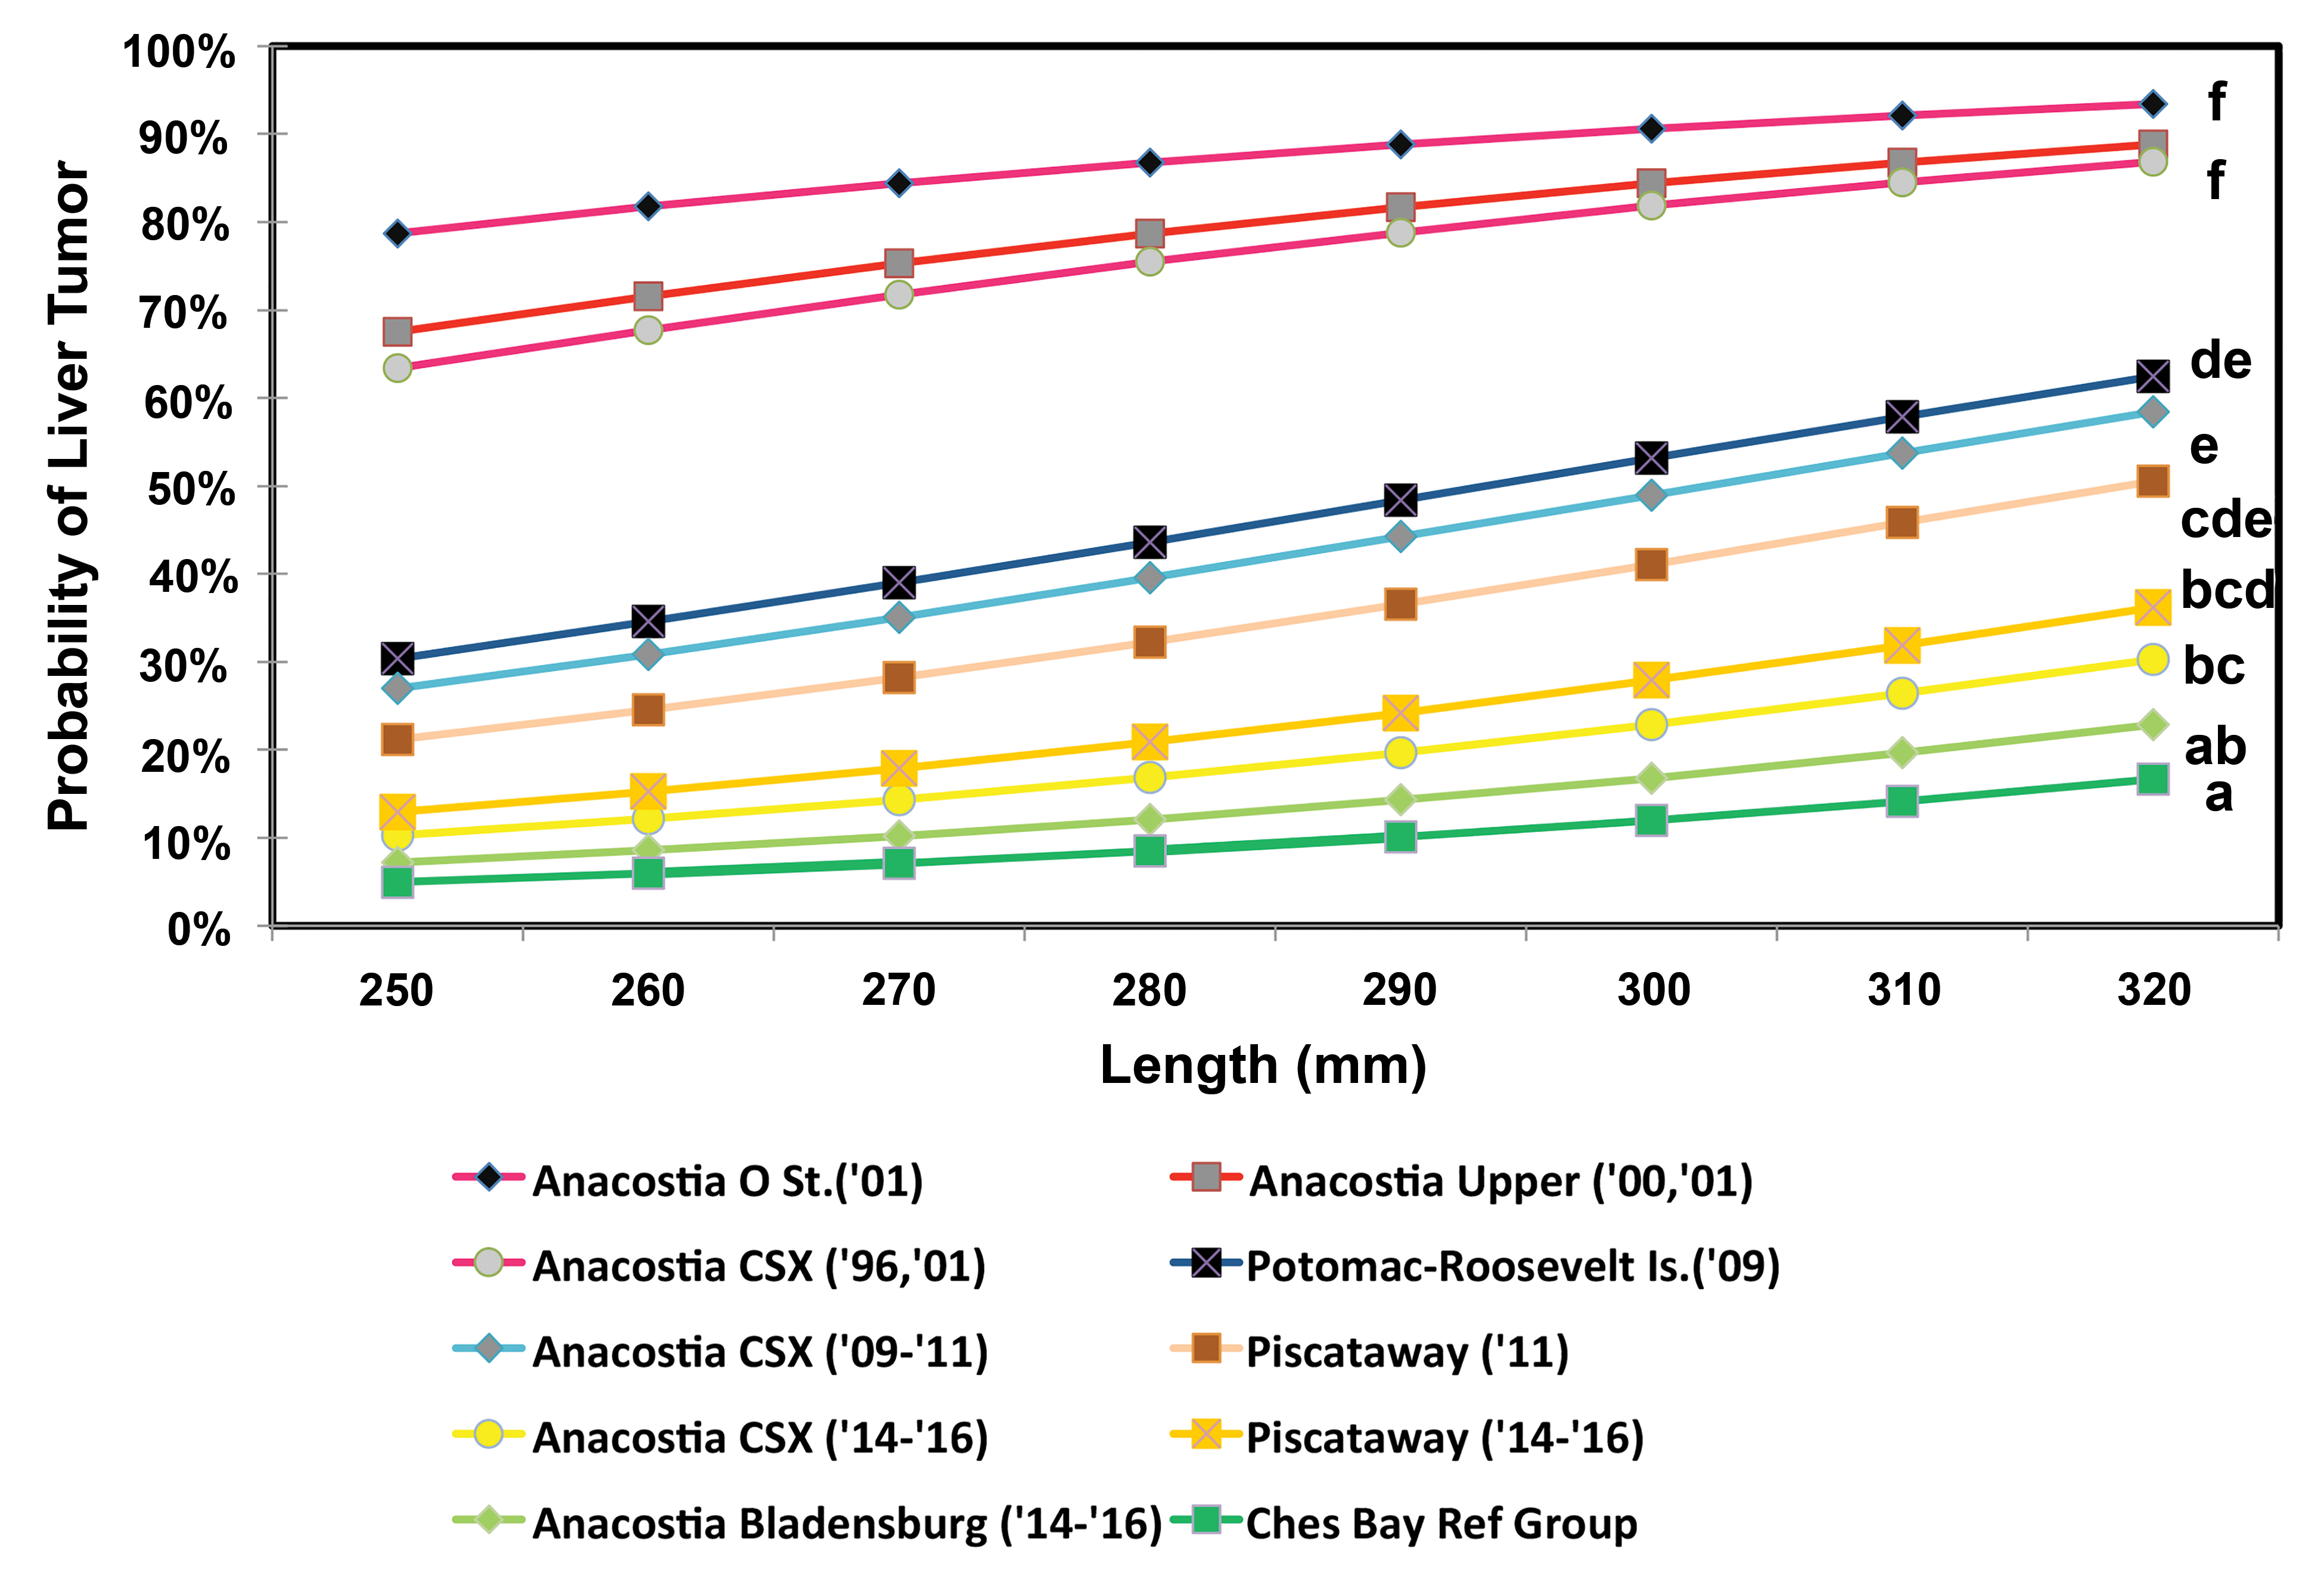
Probability of liver tumors in female brown bullhead in relation to total length. Groups with different letters are significantly different at p < .05 (see Table 4).
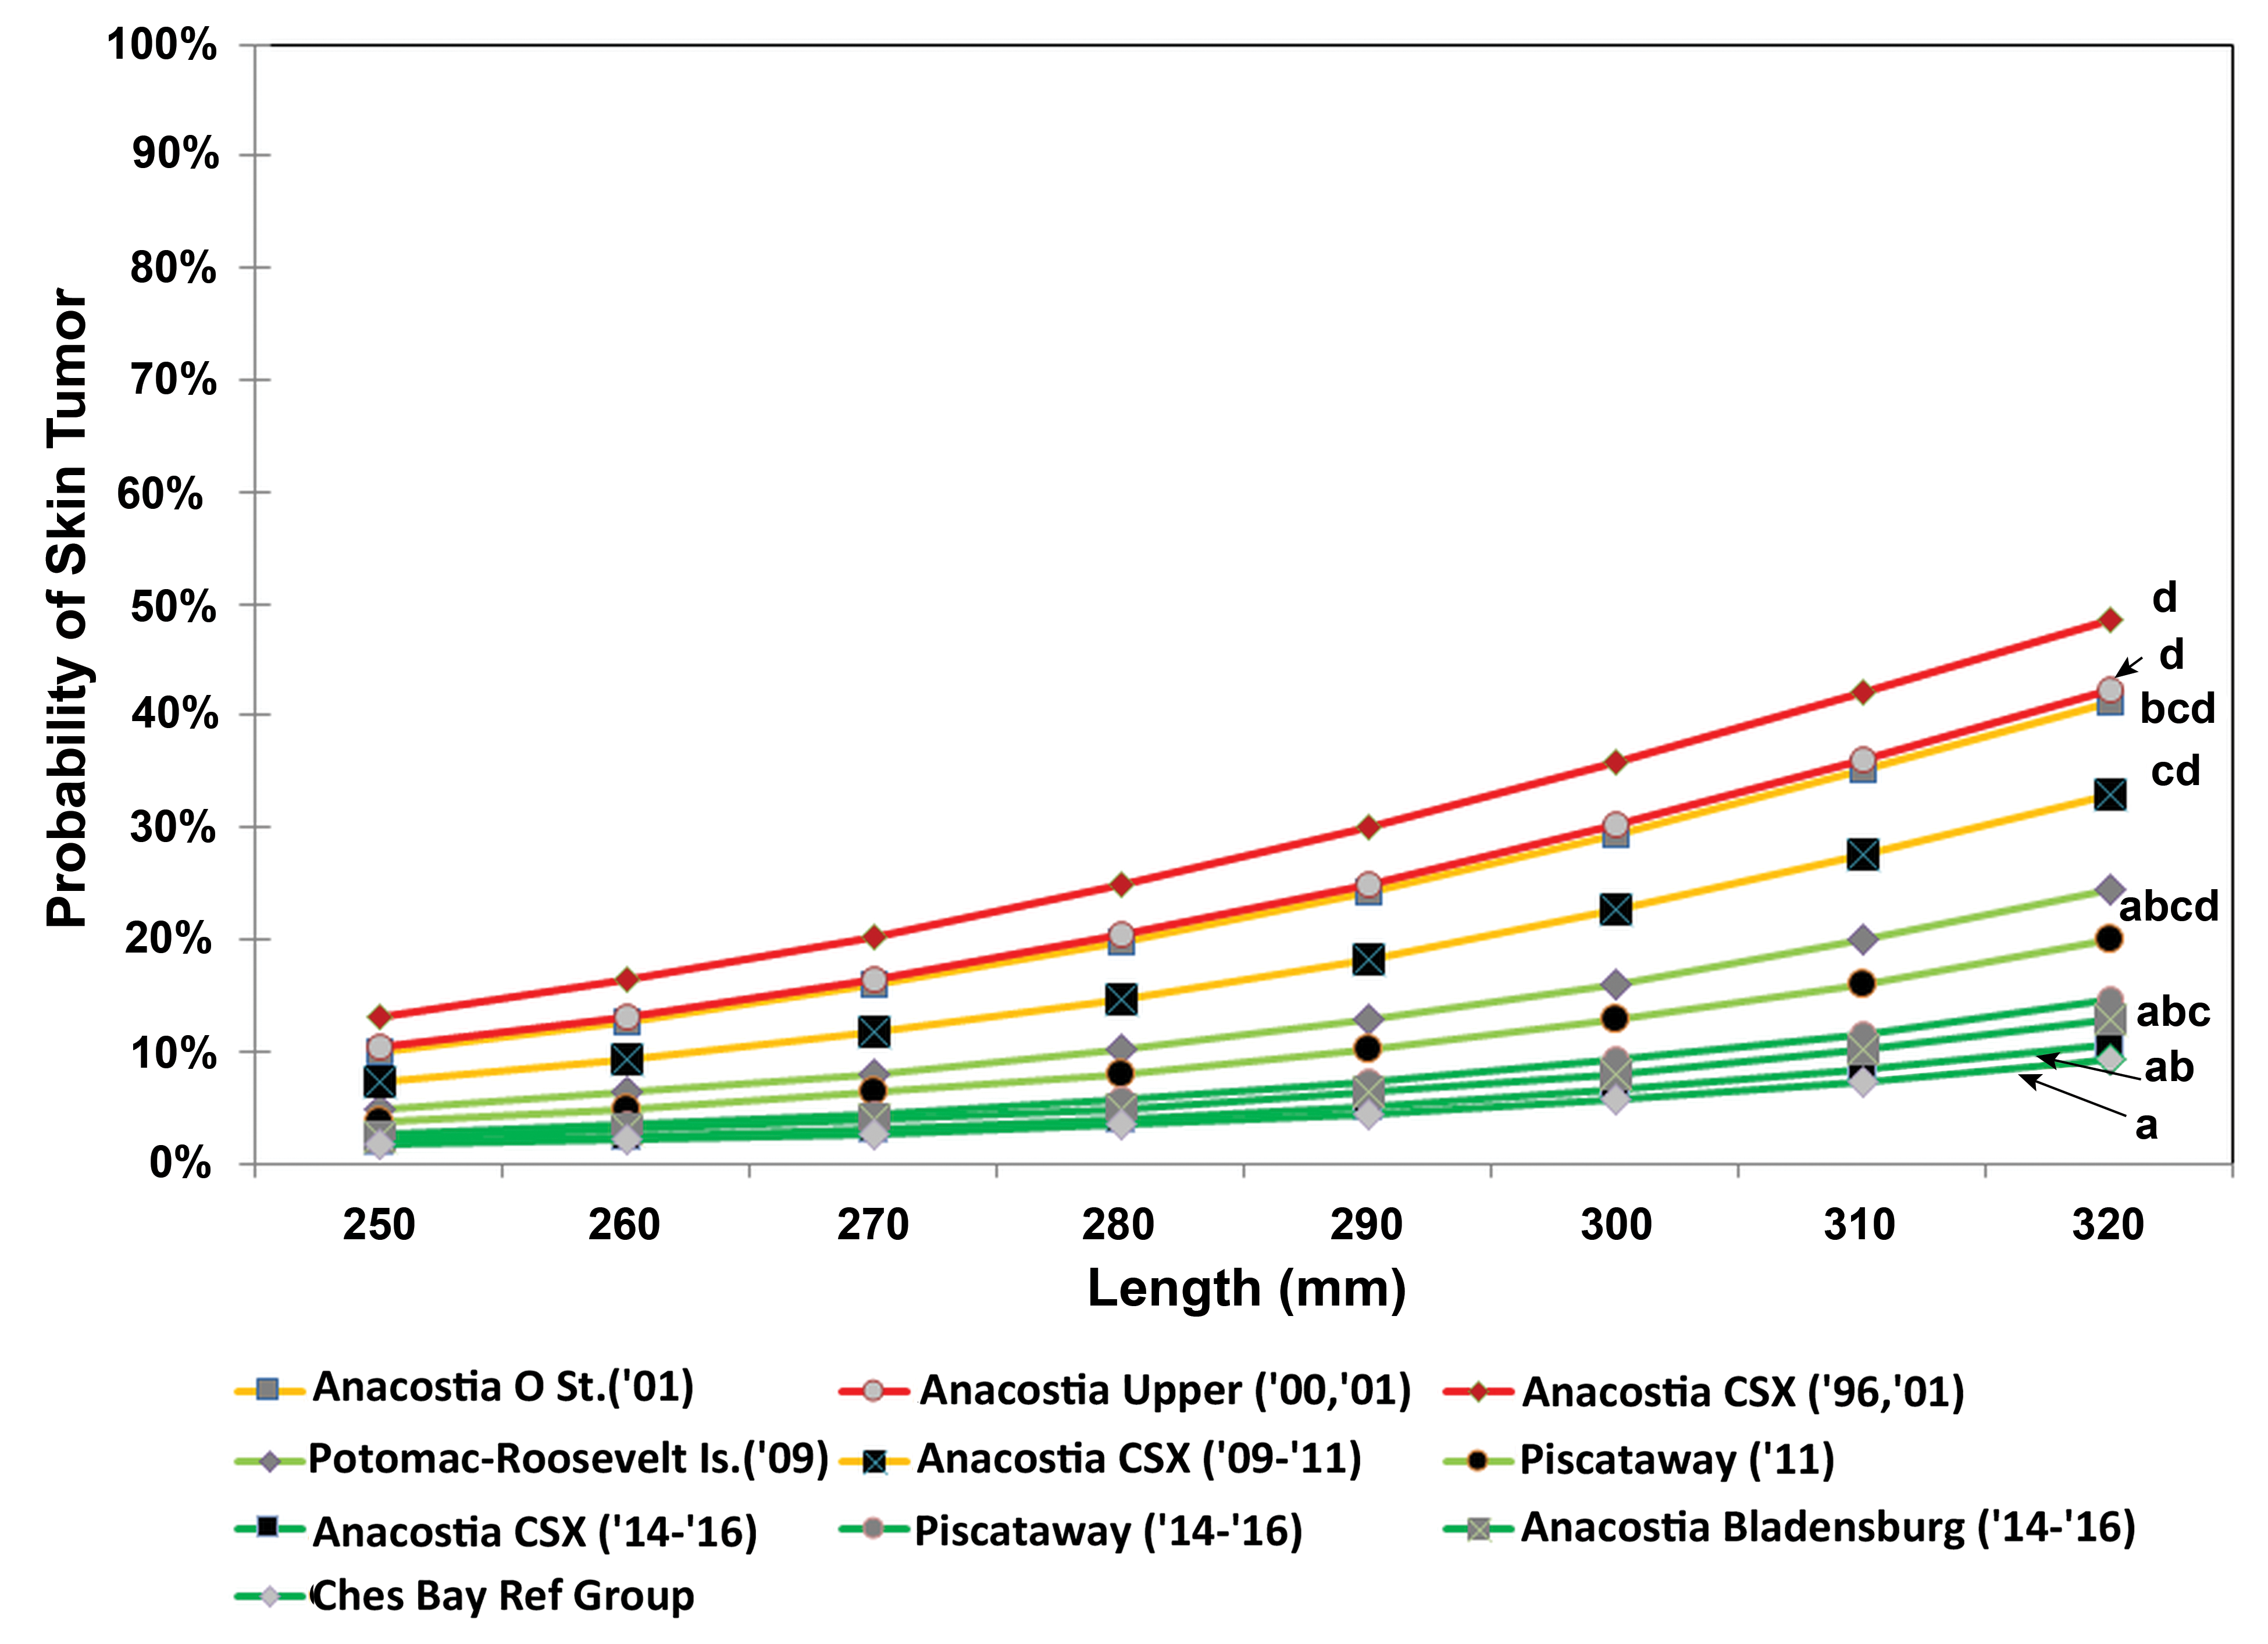
Probability of skin tumors in female brown bullhead in relation to total length. Groups with different letters are significantly different at p < .05 (see Table 5).
Comparison of Skin Tumor Probabilities (Mean Percent with 95% Highest Posterior Density Interval [HPDI] for a 280-mm Brown Bullhead [Ameiurus nebulosus] in Parentheses) Based on the Model Using Length and Sex as Covariates.
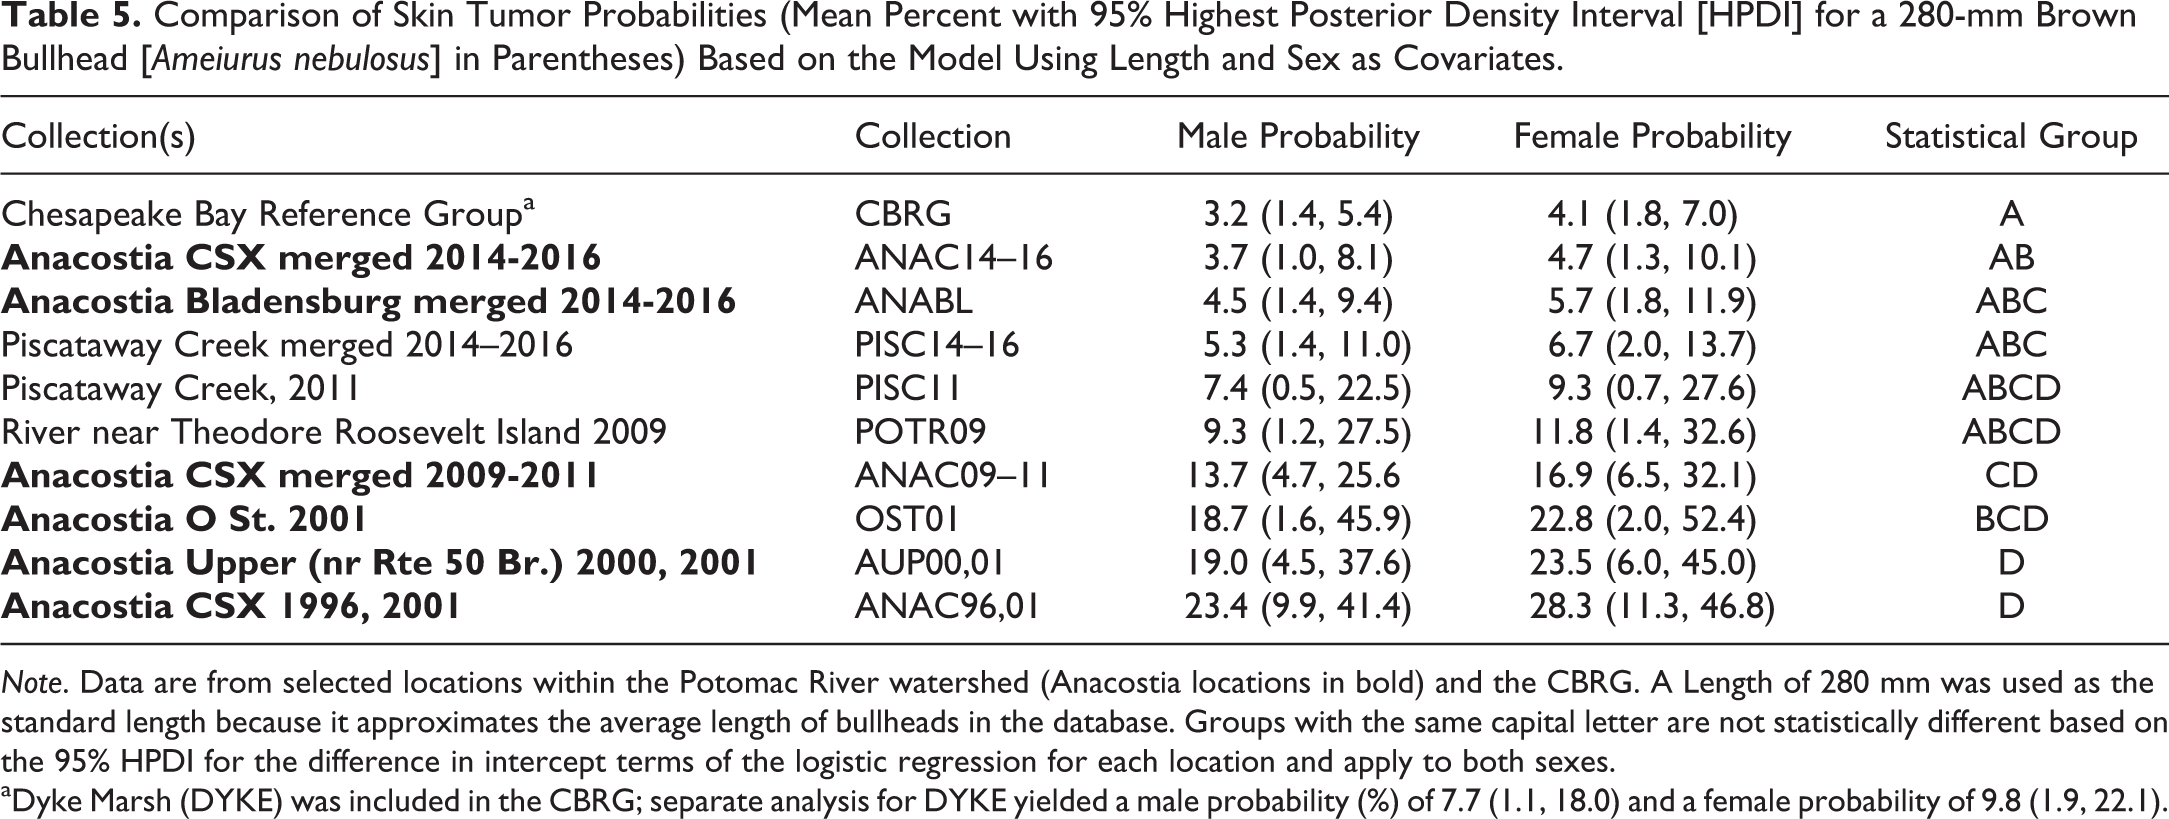
Note. Data are from selected locations within the Potomac River watershed (Anacostia locations in bold) and the CBRG. A Length of 280 mm was used as the standard length because it approximates the average length of bullheads in the database. Groups with the same capital letter are not statistically different based on the 95% HPDI for the difference in intercept terms of the logistic regression for each location and apply to both sexes.
aDyke Marsh (DYKE) was included in the CBRG; separate analysis for DYKE yielded a male probability (%) of 7.7 (1.1, 18.0) and a female probability of 9.8 (1.9, 22.1).
Based on logistic regression analysis of the 12 collections with otolith age data (Online Supplemental Table 3), the lowest BIC models did not include age. For liver tumors, two models had nearly identical BIC, one with length and one with length and sex (Online Supplemental Table 3). The model with the lowest BIC that included age was the seventh best model. For skin tumors, the model with length only had the lowest BIC. The model with the lowest BIC that included age was the fifth best model.
Sediment Chemistry
There were no statistically significant differences in median total PAHs in ANABL (25.4 ppm dry weight sediment), ANAC (30.4 ppm), DYKE (6.87 ppm), and PISC (4.58 ppm). Median concentrations for the two Anacostia locations were significantly higher than those for TUCK (1.43 ppm; see Table 6 for p values). A similar ranking of locations was evident for total carcinogenic PAHs. Total PCB concentrations were much higher at ANAC (163 µg/kg [ppb]), compared with ANABL (18.5 ppb). PCBs were not detected at TUCK and were less than 10 ppb (total) at DYKE and PISC. These analyses, performed after normalizing the contaminants on an organic carbon basis, yielded similar statistical groupings (Table 6).
Surface (Top ∼5 cm) Sediment Chemistry Data in Parts per Billion (ppb) or Million (ppm) Dry Weight Sediment and in ppb and ppm Organic Carbon (OC) with Mean ± One Standard Deviation or Median (Minimum, Maximum).
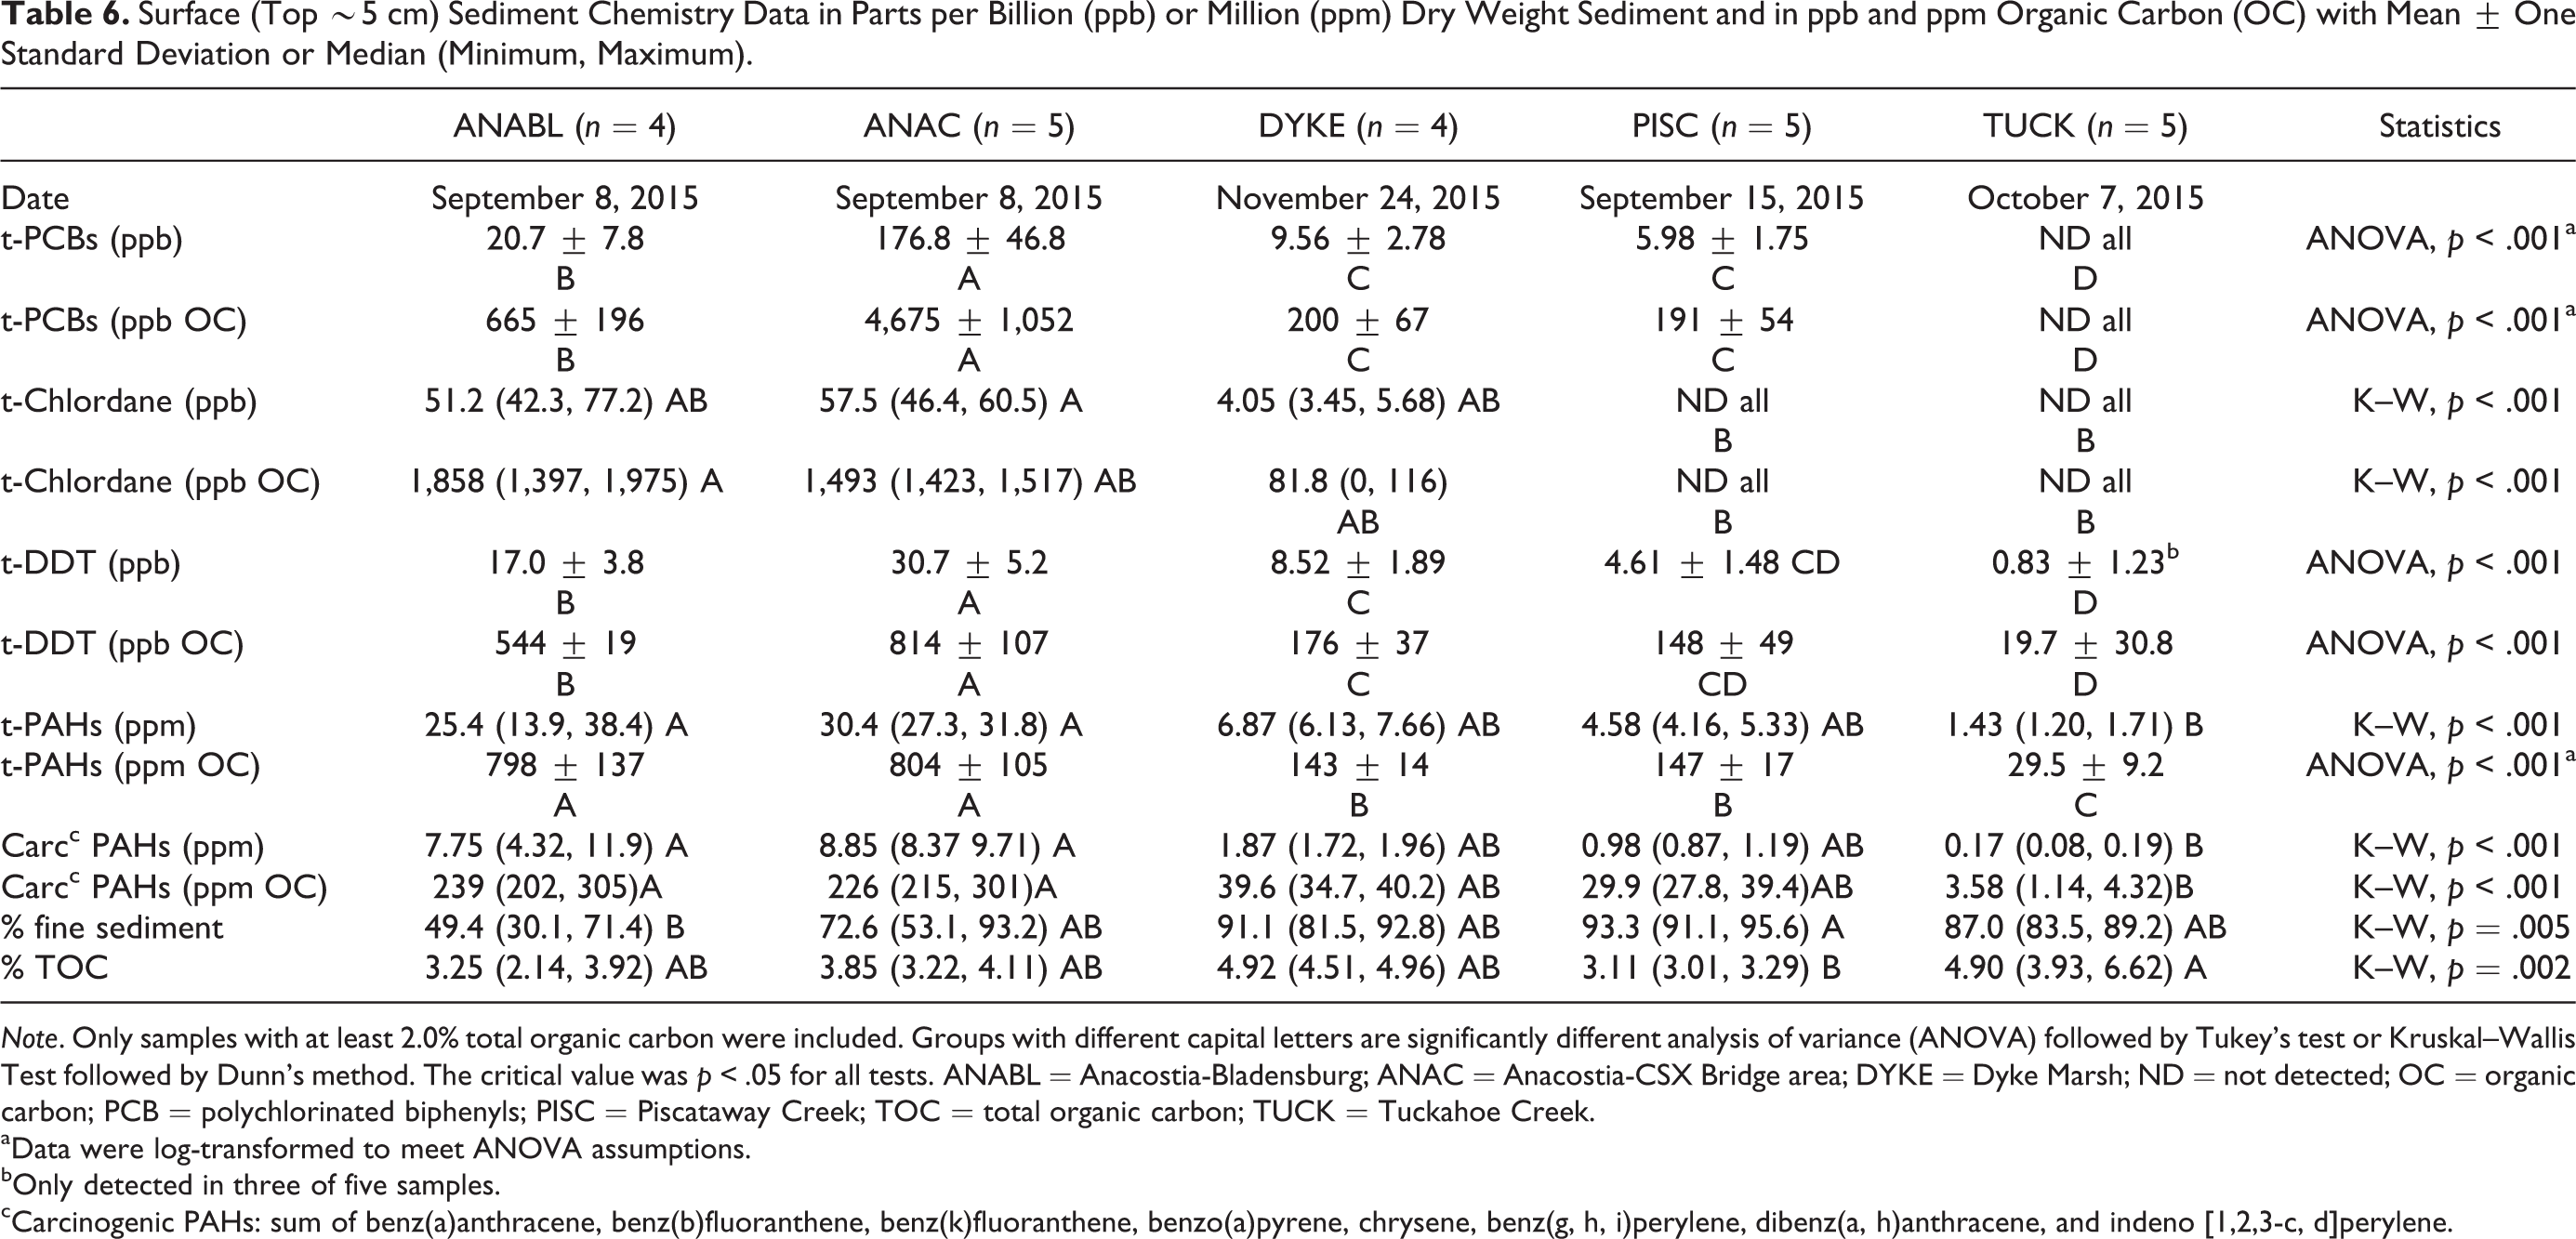
Note. Only samples with at least 2.0% total organic carbon were included. Groups with different capital letters are significantly different analysis of variance (ANOVA) followed by Tukey’s test or Kruskal–Wallis Test followed by Dunn’s method. The critical value was p < .05 for all tests. ANABL = Anacostia-Bladensburg; ANAC = Anacostia-CSX Bridge area; DYKE = Dyke Marsh; ND = not detected; OC = organic carbon; PCB = polychlorinated biphenyls; PISC = Piscataway Creek; TOC = total organic carbon; TUCK = Tuckahoe Creek.
aData were log-transformed to meet ANOVA assumptions.
bOnly detected in three of five samples.
cCarcinogenic PAHs: sum of benz(a)anthracene, benz(b)fluoranthene, benz(k)fluoranthene, benzo(a)pyrene, chrysene, benz(g, h, i)perylene, dibenz(a, h)anthracene, and indeno [1,2,3-c, d]perylene.
There were no statistically significant (p < .05) differences in total or carcinogenic PAHs at ANABL or ANAC between the 2000 (Velinsky and Ashley 2001) and 2015 samplings of the top ∼5 cm layer (Table 7), although there were decreases in carcinogenic PAHs at both locations significant at p < .10. At ANABL, the only statistically significant (p < .05) difference was for mean (± one standard deviation) total PCBs, which decreased from 99.3 ± 19.0 ppb in 2000 to 20.7 ± 7.8 ppb in 2015. Mean total PCBs were nearly identical at ANAC, 175 ppb in 2000 and 177 ppb in 2015. There were about 50% decreases at both ANABL (marginally significant at p = .051) and ANAC (p = .02) in mean total DDT concentrations between 2000 and 2015.
Statistical Comparisons of Anacostia River Surface (Top ∼5 cm) Sediment Contaminant Data from the Academy of Natural Sciences (ANS, Collected in 2000) and USFWS (Collected in 2015); Mean ± One Standard Deviation or Median (Minimum, Maximum).
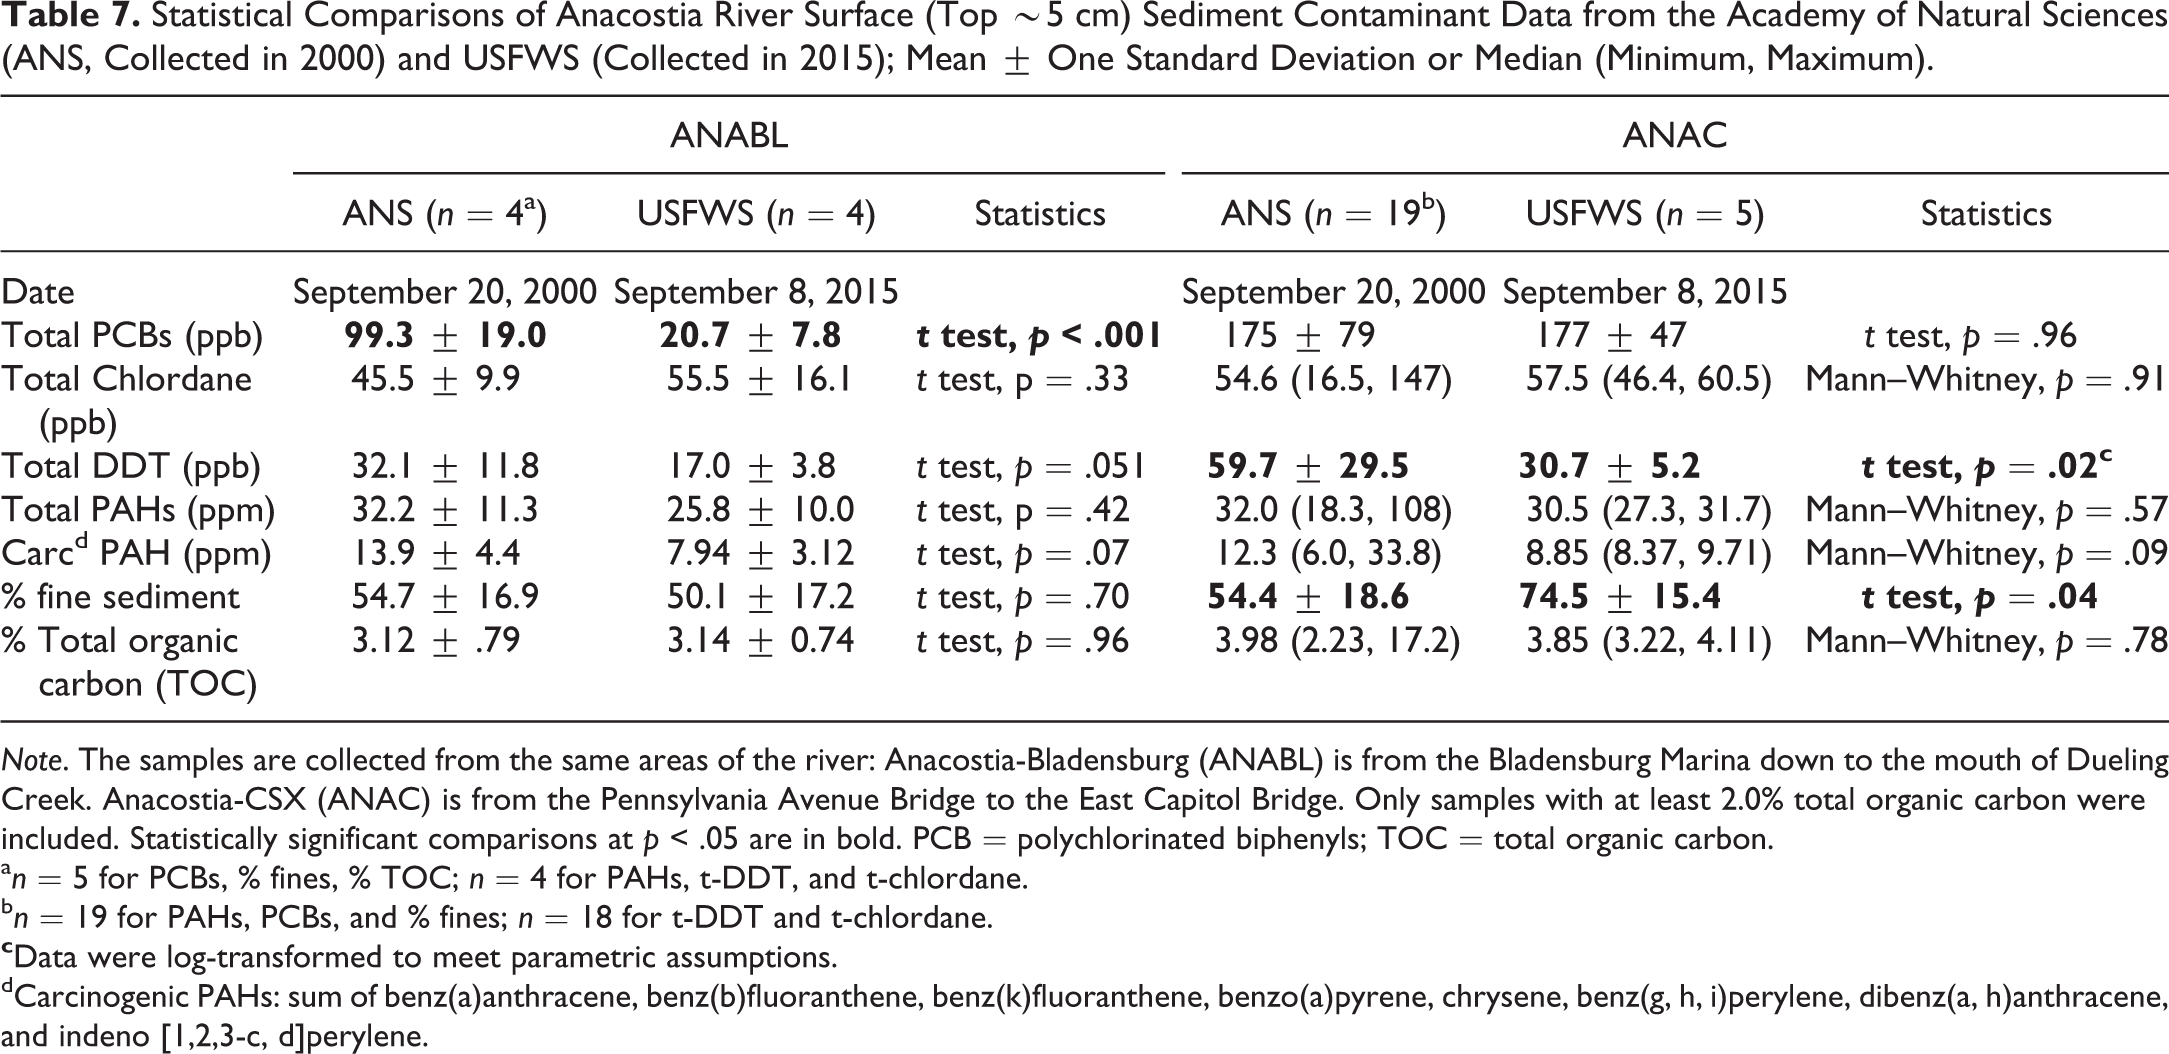
Note. The samples are collected from the same areas of the river: Anacostia-Bladensburg (ANABL) is from the Bladensburg Marina down to the mouth of Dueling Creek. Anacostia-CSX (ANAC) is from the Pennsylvania Avenue Bridge to the East Capitol Bridge. Only samples with at least 2.0% total organic carbon were included. Statistically significant comparisons at p < .05 are in bold. PCB = polychlorinated biphenyls; TOC = total organic carbon.
an = 5 for PCBs, % fines, % TOC; n = 4 for PAHs, t-DDT, and t-chlordane.
bn = 19 for PAHs, PCBs, and % fines; n = 18 for t-DDT and t-chlordane.
dCarcinogenic PAHs: sum of benz(a)anthracene, benz(b)fluoranthene, benz(k)fluoranthene, benzo(a)pyrene, chrysene, benz(g, h, i)perylene, dibenz(a, h)anthracene, and indeno [1,2,3-c, d]perylene.
Discussion
Liver Tumors
Temporal comparisons and relationships with carcinogen exposure
Our major finding was that the declining trend for liver tumors in Anacostia River bullheads reported by Pinkney, Harshbarger, and Rutter (2014) has continued. Approximately 50% decrease in liver tumor probability in ANAC bullheads between 1996, 2000 (merged), and 2009 to 2011 is now greater than 75% in 2014 to 2016.
PAHs are still the primary chemical class of interest for Anacostia and tidal Potomac bullheads, based on the literature and the previous biomarker studies with biliary PAH-like metabolites and PAC-DNA adducts (Pinkney et al. 2001, 2004a, 2011). Consistent with the declining tumor prevalence, Pinkney et al. (2011) and Pinkney, Harshbarger, and Rutter (2014) reported a 2- to 4-fold decline in PAC-DNA adducts in ANAC bullheads between 2001 (n = 14) and 2009 (n = 7).
Although the current study did not include biomarker analyses, it provided updated sediment chemistry analyses from the collection sites. If the primary source of PAH exposure is through interactions with surface sediments, one would expect substantial statistically significant decreases in total and carcinogenic PAHs over this period. This was not the case, however, although there were decreases in carcinogenic PAHs at both ANAC and ANABL between 2000 and 2015 (Table 7), significant at p < .10. There is considerable uncertainty in this comparison in that the 2015 sampling consisted of only four samples from ANABL and five from ANAC, which were compared with five ANABL samples from 2000 and 19 ANAC samples from 2000.
A key study that linked sediment PAHs and liver lesions is that of Horness et al. (1998), who proposed a threshold of 2.8 ppm total PAHs based on 29 data pairs of concentration and prevalence data for English sole (Parophrys vetulus). Pinkney, Harshbarger, and Rutter (2009) created a scatterplot of liver tumor prevalence versus mean collection site total sediment PAHs based on data pairs from the Tumor Database from 1992 through 2006. In that analysis, there appeared to be a threshold such that locations with sediment total PAHs > 15 ppm frequently had tumor prevalences
Although PAHs are both carcinogenic and immunotoxic to fish (Reynaud and Deschaux 2006), other chemicals may also be involved in the tumor process. In a review, Johnson et al. (2014) concluded that PCBs act as promoters of liver carcinogenesis by provoking cell proliferation and stimulating and promoting the growth of previously initiated preneoplastic cells. In addition, Iwanowicz et al. (2009) reported that exposure to PCBs reduces immune function in brown bullhead. Johnson et al. (2014) characterized DDT as a probable promoter of liver carcinogenesis and an immune system toxicant.
The relationship between these contaminants in bullhead fillets and liver tumor prevalence was demonstrated by Pinkney et al. (2004a) using logistic regression. They reported an odds ratio of 1.327 per 100 ppb increase in total PCBs and 1.193 per 50 ppb increase in p, p′-DDE, although they stated that these compounds co-occur with PAH exposure. To track changes over time, fillet PCB and p, p′-DDE concentrations were compared between a single composite of seven bullheads collected above the CSX Bridge in 2013 (Pinkney 2014), a 2001 ANAC collection of individual bullheads, and two 1996 ANAC bullhead collections (Pinkney, 2018). Fillets contained 56.2 ppb total PCBs in 2013, 467 ppb in 2001 (median, n = 10), and 329 and 302 ppb in 1996 (medians, n = 10 each collection). The p, p′-DDE concentrations were 4.3 ppb in 2013, 51.6 in 2001 (n = 8), and 44.0 and 41.0 ppb in 1996 (both n = 10). Total PCBs and total DDT compounds also declined in four species of bottom-dwelling fish collected in DC waters (channel and blue catfish, carp, and American eel) in 2007 versus 2013, resulting in a relaxation of the fish tissue advisories (https://doee.dc.gov/release/doee-issues-2016-fish-consumption-advisory; accessed April 30, 2018).
Thus, the decreased liver tumor prevalence at ANAC may be associated with the documented decreases in bullhead exposure to initiators (PAHs) and tumor promoters/immune system toxicants (PAHs, PCBs, and DDT compounds), based on the biomarker and tissue contaminant data. There are considerable uncertainties in this conclusion due to the infrequent monitoring and relatively small sample sizes.
Spatial comparisons and types of liver tumors
A possible interpretation of the 2009 to 2011 and 2014 to 2016 results would be that liver tumors are indicative of regional contamination encompassing Washington, DC, and nearby downriver areas. Although the prevalence at the urban locations (ANAC, ANABL, and POTR) and one suburban location (PISC) was similar, this was not the case at DYKE, about 8 km from PISC, where probabilities were low enough to be included in the reference group. Furthermore, tumor prevalences did not rank in the same order as sediment total or carcinogenic PAH concentrations, both of which were higher at DYKE than at PISC (Table 6).
Thus, based on the 2 km linear home range (Sakaris, Jesien, and Pinkney 2005), it is more likely that Piscataway bullheads are responding to unknown contaminant exposures within that creek or nearby areas. TetraTech, Inc. (2014) reported that between 2005 and 2014, there were an estimated 71.4 million gallons of sanitary overflows in the watershed, mostly at the Piscataway Wastewater Treatment Plant, ∼2 km upstream of the fish collection area. Nitrosamines, which can be formed in waters with high sewage content (Yordy and Alexander 1981), have been shown to be carcinogenic to fish in laboratory studies (reviewed by Bunton 1996; Hawkins, Walker, and Overstreet 2005). Exposure to raw sewage results in a weakened immune response in fish (Kakuta and Murachi 1997). Through the sewage releases, fish are exposed to natural and synthetic estrogens (Combalbert and Hernandez-Raquest 2010). These compounds can be detected in the bile of fish exposed to raw and treated sewage (e.g., Pettersson et al. 2006; for review, see Daughton and Brooks 2011). In a laboratory study with Japanese medaka (Oryzias latipes), Cooke and Hinton (1999) showed that 17β-estradiol (E2) was a liver tumor promoter. Exposure to E2 increased the prevalence of diethylnitrosamine-initiated tumors from 4.6% to 26%.
Different types of liver tumors were dominant in Piscataway versus Anacostia and Potomac River bullheads. Cholangiocarcinomas were 5 of 26 (19%) of the ANAC liver tumors and 2 of 21 (10%) of the ANABL tumors versus 15 of 26 (58%) of PISC tumors (Table 2). In the entire Tumor Database (Pinkney 2018), CCs were 16% of Anacostia liver tumors (30/182) and 55% of Piscataway liver tumors (21/38; chi-square p < .001). The difference in tumor types suggests exposure to different mixtures of initiators and promoters.
Logistic regression parameters
For liver tumors, the regression covariates for the best fit model, length, and sex were unchanged compared with three previous analyses of the Tumor Database (Pinkney, Harshbarger, and Rutter 2009, 2014; Pinkney et al. 2011). The finding that otolith age was not a covariate in the best fit model for the 12 collection subset of the database contrasts with analysis of 459 bullheads from Lake Erie by Rutter (2010), in which age and length were covariates in the best fit model. Sex has always been a significant covariate in analyses of liver tumor data in the Tumor Database, with higher prevalence in females, consistent with Nunez et al. (1989) and Cooke and Hinton (1999).
Skin Tumors
Temporal and spatial comparisons and relationship with carcinogens
Currently, the skin tumor prevalences in both Anacostia locations and Piscataway are not statistically different from the CBRG. The pattern in the relationship of skin tumor prevalence and total sediment PAHs from collection locations (Pinkney, Harshbarger, and Rutter 2009 plus updates from the present study) provides no evidence of a positive association. In fact, the highest tumor prevalence (53%) is from the South River with total sediment PAHs of 3.4 ppm, whereas ANAC had 9% skin tumors and 30.7 ppm total sediment PAHs.
Logistic regression
For the first time, we identified weight and sex as covariates for the best fit logistic regression model for skin tumors. Weight, length, and sex were nearly equivalent as the next best models (Online Supplemental Table 3). Previous analyses identified no covariates (Pinkney, Harshbarger, and Rutter 2009), length (Pinkney et al. 2011), and length and sex (Pinkney, Harshbarger, and Rutter 2014) as the best models. Both length and weight are related to age since older fish are longer and heavier than younger fish, although in the current study age was not a significant covariate. In the Rutter (2010) Lake Erie brown bullhead study, age and sex were significant covariates for skin tumors. Sex has been one of the covariates in the two most recent analyses (this article; Pinkney, Harshbarger, and Rutter 2014), but not the two previous ones (Pinkney, Harshbarger, and Rutter 2009; Pinkney et al. 2011). To our knowledge, no researchers have proposed a toxicological mechanism for an increased skin tumor prevalence in female fish.
Conclusions and Recommendations
We report a large, statistically significant decrease in liver tumor probabilities for standardized 280-mm bullheads from ANAC between surveys in 1996 and 2001 (merged: female, 77.8%; male, 48.6%), 2009 to 2011 (female, 42.5%; male, 16.6%), and 2014 to 2016 (female, 18.0%; male, 5.7%). Skin tumors decreased by a factor of six in both females and males. Liver tumor prevalence was similar at both Anacostia locations and at PISC. At DYKE, however, liver (and skin) tumor prevalence was low enough for the collection to be added to the CBRG.
To explain the decreases in prevalence, we analyzed sediment and fish contaminant data over time. Total and carcinogenic PAH sediment concentrations at both Anacostia locations in 2000 (ANS data) and 2015 (current study) were not significantly different at p < .05. A previous survey estimated a >50% decline in PAC-DNA adduct concentrations in ANAC bullheads from 2001 versus 2009. There was a substantial decline in PCBs and DDT compounds in Anacostia bullhead fillets from 1996 to 2013. Thus, the decreased liver tumor prevalence at ANAC may be associated with decreased exposure to initiators (PAHs), tumor promoters (PCBs and DDT compounds), and immune system toxicants (all three).
Continued monitoring of tumors in bullheads from the Anacostia and tidal Potomac on a 5-year cycle will allow scientists and managers to track trends in prevalence. Measuring biomarkers of PAH exposure and response (liver DNA adducts) will be informative for determining changes in exposure and response to carcinogenic and immunotoxic PAHs. Fish tissue contaminant monitoring, useful for fish advisories, also provides valuable data for evaluating bullhead exposure to immunotoxic and tumor-promoting PCBs and DDT compounds. Investigations of Piscataway bullheads should focus on the higher prevalence of CCs as opposed to HCs, the dominant type of liver tumors in Anacostia bullheads. Evaluating the causes of skin tumors in brown bullhead is a ripe area for research and is important for understanding reasons for the declining trend. These studies should investigate the possible role of viruses (Getchell, Casey, and Bowser 1998) using state-of-the-art methods.
Supplemental Material
Supplemental Material, FS1_TPX_10.11770192623318823150 - Trends in Liver and Skin Tumor Prevalence in Brown Bullhead (Ameiurus nebulosus) from the Anacostia River, Washington, DC, and Nearby Waters
Supplemental Material, FS1_TPX_10.11770192623318823150 for Trends in Liver and Skin Tumor Prevalence in Brown Bullhead (Ameiurus nebulosus) from the Anacostia River, Washington, DC, and Nearby Waters by Alfred E. Pinkney, John C. Harshbarger, Michael A. Rutter, and Peter C. Sakaris in Toxicologic Pathology
Supplemental Material
Supplemental Material, FS2_TPX_10.11770192623318823150 - Trends in Liver and Skin Tumor Prevalence in Brown Bullhead (Ameiurus nebulosus) from the Anacostia River, Washington, DC, and Nearby Waters
Supplemental Material, FS2_TPX_10.11770192623318823150 for Trends in Liver and Skin Tumor Prevalence in Brown Bullhead (Ameiurus nebulosus) from the Anacostia River, Washington, DC, and Nearby Waters by Alfred E. Pinkney, John C. Harshbarger, Michael A. Rutter, and Peter C. Sakaris in Toxicologic Pathology
Supplemental Material
Supplemental Material, FS3_TPX_10.11770192623318823150 - Trends in Liver and Skin Tumor Prevalence in Brown Bullhead (Ameiurus nebulosus) from the Anacostia River, Washington, DC, and Nearby Waters
Supplemental Material, FS3_TPX_10.11770192623318823150 for Trends in Liver and Skin Tumor Prevalence in Brown Bullhead (Ameiurus nebulosus) from the Anacostia River, Washington, DC, and Nearby Waters by Alfred E. Pinkney, John C. Harshbarger, Michael A. Rutter, and Peter C. Sakaris in Toxicologic Pathology
Supplemental Material
Supplemental Material, TS1_TPX_10.11770192623318823150 - Trends in Liver and Skin Tumor Prevalence in Brown Bullhead (Ameiurus nebulosus) from the Anacostia River, Washington, DC, and Nearby Waters
Supplemental Material, TS1_TPX_10.11770192623318823150 for Trends in Liver and Skin Tumor Prevalence in Brown Bullhead (Ameiurus nebulosus) from the Anacostia River, Washington, DC, and Nearby Waters by Alfred E. Pinkney, John C. Harshbarger, Michael A. Rutter, and Peter C. Sakaris in Toxicologic Pathology
Supplemental Material
Supplemental Material, TS2_TPX_10.11770192623318823150 - Trends in Liver and Skin Tumor Prevalence in Brown Bullhead (Ameiurus nebulosus) from the Anacostia River, Washington, DC, and Nearby Waters
Supplemental Material, TS2_TPX_10.11770192623318823150 for Trends in Liver and Skin Tumor Prevalence in Brown Bullhead (Ameiurus nebulosus) from the Anacostia River, Washington, DC, and Nearby Waters by Alfred E. Pinkney, John C. Harshbarger, Michael A. Rutter, and Peter C. Sakaris in Toxicologic Pathology
Supplemental Material
Supplemental Material, TS3_TPX_10.11770192623318823150 - Trends in Liver and Skin Tumor Prevalence in Brown Bullhead (Ameiurus nebulosus) from the Anacostia River, Washington, DC, and Nearby Waters
Supplemental Material, TS3_TPX_10.11770192623318823150 for Trends in Liver and Skin Tumor Prevalence in Brown Bullhead (Ameiurus nebulosus) from the Anacostia River, Washington, DC, and Nearby Waters by Alfred E. Pinkney, John C. Harshbarger, Michael A. Rutter, and Peter C. Sakaris in Toxicologic Pathology
Supplemental Material
Supplemental Material, TS4_TPX_10.11770192623318823150 - Trends in Liver and Skin Tumor Prevalence in Brown Bullhead (Ameiurus nebulosus) from the Anacostia River, Washington, DC, and Nearby Waters
Supplemental Material, TS4_TPX_10.11770192623318823150 for Trends in Liver and Skin Tumor Prevalence in Brown Bullhead (Ameiurus nebulosus) from the Anacostia River, Washington, DC, and Nearby Waters by Alfred E. Pinkney, John C. Harshbarger, Michael A. Rutter, and Peter C. Sakaris in Toxicologic Pathology
Footnotes
Authors’ Note
Collections within the District of Columbia were made by Danny Ryan, Luke Lyon, Joe Swann, and Eric Thadey of the District of Columbia Department of Energy & Environment, Fisheries Research Branch. The findings and conclusions in this report are those of the authors and do not necessarily represent the views of the U.S. Fish and Wildlife Service.
Acknowledgments
The authors appreciate the assistance of Josh Newhard, Mike Mangold, Ian Park, John Gill, and Steve Minkkinen (USFWS) in the field and Rachel Harrison (USFWS) in the CBFO laboratory.
Author Contributions
Authors contributed to conception or design (AP, JH); data acquisition, analysis, or interpretation (AP, JH, MR, PS); drafting the manuscript (AP, JH, MR, PS); and critically revising the manuscript (AP). All authors gave final approval and agreed to be accountable for all aspects of work in ensuring that questions relating to the accuracy or integrity of any part of the work are appropriately investigated and resolved.
Declaration of Conflicting Interests
The author(s) declared no potential, real, or perceived conflicts of interest with respect to the research, authorship, and/or publication of this article.
Funding
The author(s) disclosed receipt of the following financial support for the research, authorship, and/or publication of this article: Funding was provided by the Toxic Substances Division of the District of Columbia Department of Energy & Environment to compliment the Anacostia River Sediment Project Remedial Investigation/Feasibility Studies aimed at supporting a cost-effective remedy for the Anacostia River.
Supplemental Material
Supplemental material for this article is available online.
References
Supplementary Material
Please find the following supplemental material available below.
For Open Access articles published under a Creative Commons License, all supplemental material carries the same license as the article it is associated with.
For non-Open Access articles published, all supplemental material carries a non-exclusive license, and permission requests for re-use of supplemental material or any part of supplemental material shall be sent directly to the copyright owner as specified in the copyright notice associated with the article.