
Abstract
We characterized pancreatic islet lesions induced by several quinolones using functional and morphological examinations of the pancreatic islets in male rats orally administered gatifloxacin, lomefloxacin, or levofloxacin at 300 mg/kg for 14 consecutive days. Consequently, in contrast to lomefloxacin or levofloxacin, gatifloxacin increased serum glucose and glycosylated albumin on day 14 and elevated serum glucose tended to decrease insulin in the intravenous glucose tolerance test. Microscopically, only gatifloxacin induced cytoplasmic vacuoles containing eosinophilic homogenous contents in islet cells. Immunohistochemical examination revealed that vacuolated islet cells were positively stained for insulin, demonstrating they were pancreatic β cells. Electron microscopy showed that the cytoplasmic vacuoles represented dilated cisterna of the rough endoplasmic reticulum filled with electron-lucent materials in pancreatic β cells. Moreover, insulin secretory granules were drastically decreased in vacuolated islet cells, suggesting impaired insulin synthesis and/or transport. This gatifloxacin-induced pancreatic toxicity in rats was considered to be associated with high pancreatic drug distribution. These results demonstrated that gatifloxacin provoked functional and morphological pancreatic β cell alteration associated with impaired insulin synthesis and/or transport, leading to hyperglycemia.
Introduction
Quinolone antibacterial agents (quinolone) have been widely used clinically because of their broad spectrum of bactericidal activity and good pharmacokinetics. Quinolones are generally accepted as safe drugs with relatively low incidences of adverse effects. Owens and Ambrose (2005) reported that the most common adverse events associated with the quinolone class involved the gastrointestinal tract, including nausea and diarrhea, and central nervous system, including headache and dizziness. These adverse events have also been reported to be usually mild and did not require discontinuation of therapy (Owens and Ambrose 2005). However, certain quinolones have been reported to induce severe dysglycemia (hypoglycemia and hyperglycemia), which is sometimes life-threatening (Owens and Ambrose 2005; Mehlhorn and Brown 2007; Lewis and Mohr 2008).
The risk of clinically relevant dysglycemic events varies among quinolones. Gatifloxacin, a quinolone derivative, was withdrawn voluntarily from the market because of increased risks of hypoglycemia and hyperglycemia in patients treated with this agent (Mehlhorn and Brown 2007). In an analysis of the U.S. Food and Drug Administration (FDA) database, the risk of severe hypoglycemia and hyperglycemia was greater with gatifloxacin than with other quinolones (Frothingham 2005). Additionally, in a retrospective inception cohort study in outpatients treated with quinolones, the rate of severe dysglycemic episodes associated with gatifloxacin was at least 10-fold higher than that with other quinolones (Aspinall et al. 2009). Furthermore, a higher risk of dysglycemic events due to gatifloxacin has been reported in elderly patients and those with diabetes and renal insufficiency (Tamayama, Tanaka, and Saito 2004).
In the past few decades, many nonclinical studies have been conducted to clarify the mechanism underlying quinolone-induced dysglycemia. In previous in vitro studies, the stimulation of insulin secretion by inhibition of adenosine triphosphate-sensitive potassium (KATP) channels in pancreatic β cells was suggested to be one of the likely causes of the hypoglycemia induced by certain quinolones (Maeda et al. 1996; Zunkler and Wos 2003; Saraya et al. 2004). In addition, low doses of several quinolones induced a transient decrease in blood glucose levels of mice (Hori, Kizu, and Kawamura 2006), rats (Ishiwata, Sanada, and Yasuhara 2006; Ishiwata and Yasuhara 2010), and monkeys (Yoshimatsu et al. 2018) following intravenous (IV) or intraperitoneal (IP) administration. Furthermore, Ishiwata, Sanada, and Yasuhara (2006) demonstrated that gatifloxacin-induced decreased blood glucose was accompanied by increased blood insulin. In contrast, hyperglycemia was noted in rats administered IV gatifloxacin at high doses (Ishiwata, Sanada, and Yasuhara 2006; Ishiwata and Yasuhara 2010) and in diabetic rats administered repeated oral doses of gatifloxacin (Nagai et al. 2010). Furthermore, Yoshimatsu et al. (2018) reported that IV administration of gatifloxacin at a high dose induced transient hypoglycemia, followed by hyperglycemia in monkeys. These results suggest that the effect of gatifloxacin on glucose homeostasis depends on several factors including dose levels and dosing duration. Regarding the pathology of quinolone-induced dysglycemia, some agents have been reported to induce morphological lesions such as vacuolation of pancreatic islets following repeated oral dosing in rats (Nomura et al. 1988; Nagai et al. 2010). However, the relationship between morphological lesions of the pancreatic islets and glucose homeostasis induced by certain quinolones remains unclear.
In the present study, we orally administered gatifloxacin to male rats for 14 consecutive days and functionally and morphologically examined the pancreas. Furthermore, the potential induction of dysglycemia and pancreatic toxicity by gatifloxacin was compared with that induced by other quinolones, lomefloxacin and levofloxacin. In addition, the plasma and pancreatic drug concentrations were measured to clarify the determinant factor for potential pancreatic toxicity of quinolones.
Materials and Methods
Animals
Fifty-two male Crj:CD(SD) rats, 5 to 6 weeks old, were purchased from Charles River Japan Inc. (Kanagawa, Japan). The rats were housed one or two animals per wire mesh cage in an air-conditioned room (temperature, 23°C ± 2°C; relative humidity, 55% ± 20%) with a 12-hr light/dark cycle and fed a commercial rodent diet (F-2, Funabashi Farm, Chiba, Japan) and tap water ad libitum. All experimental procedures were performed in accordance with the guidelines of the Institutional Animal Care and Use Committee of Daiichi Sankyo Co., Ltd. (Tokyo, Japan).
Chemicals
Gatifloxacin, levofloxacin, and DV-7751 (an internal standard for drug concentration measurements) were synthesized, and lomefloxacin was purified from commercial tablets at Daiichi Sankyo Co., Ltd. These compounds were suspended at a concentration of 30 mg/ml in 1% methylcellulose (MC) aqueous solution using a Teflon-glass homogenizer. All other chemicals and reagents were of the highest grade available from commercial sources unless otherwise stated.
Experimental Design
The experimental protocol was approved by the Ethics Review Committee for Animal Experimentation of Daiichi Sankyo Co., Ltd. Animals were assigned to each group according to a computer randomization procedure based on stratified body weights, so that all group had similar mean weights. The test compounds were orally administered to animals by gavage at a dose of 300 mg/kg (dose level was expressed as the anhydrous free base) once daily for 7 or 14 consecutive days for gatifloxacin and 14 consecutive days for lomefloxacin and levofloxacin. The dose levels and dosing periods were selected based on our preliminary study and previous publication (Nagai et al. 2010). In the preliminary study in rats treated with 300 mg/kg of gatifloxacin for 28 consecutive days, vacuolation of pancreatic islets was observed from day 8 without any deaths throughout the experimental period. Therefore, we selected 300 mg/kg as the dose level of gatifloxacin and 7 or 14 days as its dosing duration. To compare the potential pancreatic toxicity of lomefloxacin or levofloxacin with that of gatifloxacin, the dose level and dosing duration for both quinolones were set at 300 mg/kg and 14 days, respectively. The control animals were similarly administered the vehicle, 1% MC solution alone (10 ml/kg). The first dosing day was regarded as day 1 in this study. The experimental design of the number of animals assigned to each examination item is shown in Table 1.
Experimental Design of Number of Animals Assigned to Each Examined Parameter.
Note. Control = vehicle; DM = drug concentration measurement in plasma and the pancreas; EM = electron microscopy; GA = serum glycosylated albumin; GFLX = gatifloxacin; GLU = serum glucose; IHC = immunohistochemistry; IVGTT = intravenous glucose tolerance test; LFLX = lomefloxacin; LM = light microscopy; LVFX = levofloxacin; NE = not examined.
Laboratory Tests
Clinical signs and body weights were monitored throughout the experimental period. Food consumption was measured from days 6 to 7 and 13 to 14, and the data are expressed as food consumption per animal (g/animal/day) calculated by subtracting the weight of the remaining food from that initially supplied. For measurements of serum glucose and glycosylated albumin reflecting recent blood glucose status, blood samples (1 ml) were collected from the tail vein before dosing on days 7 and 14 using 22-G needles under conscious conditions, and serum was separated by centrifugation (4°C, 3,000 rpm, 15 min). Serum glucose and glycosylated albumin concentrations were measured using an automatic analyzer (7350, Hitachi Ltd., Tokyo, Japan).
IV Glucose Tolerance Test
An IV glucose tolerance test was performed in the gatifloxacin-treated group before dosing on day 7 and in all quinolone-treated groups on day 14. The 50% glucose (2.5 g/kg) solution was administered intravenously once to animals that were fasted for >18 hr with free access to water. Blood samples for glucose (10 µl) and insulin (200 μl) measurement were collected from the tail vein as described in the Laboratory Tests subsection. Blood glucose concentrations were measured 0 (preglucose loading), and 5-, 30-, 60-, and 120-min postglucose load using a Medi-Safe portable blood glucose apparatus (Terumo Corporation, Tokyo, Japan). Serum insulin concentrations were determined 5-min postglucose loading using a commercial enzyme-linked immunosorbent assay (ELISA) kit (Shibayagi Co., Tokyo, Japan).
Pancreatic Pathology
The animals were euthanized by exsanguination under ether anesthesia on days 8 and 15 for the gatifloxacin-treated group and day 15 for the lomefloxacin- and levofloxacin-treated groups. Ether was selected in this study to minimize the effect of volatile anesthetics including isoflurane on pancreatic function like insulin secretion (Zuurbier et al. 2008). The whole pancreas including right (duodenal segment), body (parabiliary and gastric segments), and left (splenic segment) parts were removed from each animal and fixed in 10% neutral-buffered formalin solution for microscopy. The whole pancreas were embedded in paraffin wax, cut into 4-µm-thick sections, and stained with hematoxylin and eosin (H&E). Selected pancreatic sections from the control and gatifloxacin groups were examined immunohistochemically using an insulin/proinsulin antibody (1:100; Biogenesis Ltd., Poole, UK) and the EnVision System (DakoCytomation Co., Ltd., Kyoto, Japan). In our preliminary study in rats treated with gatifloxacin at 300 mg/kg for 28 consecutive days, peripheral cells of vacuolated islets showed immunohistochemically positive staining for glucagon (α cells; glucagon antibody, DakoCytomation Co., Ltd.) and somatostatin (δ cells; somatostatin antibody, DakoCytomation). These were comparable to those of the control group. The small blocks from the left part of the pancreas were fixed in 2.5% glutaraldehyde and 1% osmium tetroxide solution and embedded in epoxy resin for electron microscopy. Semithin sections were prepared, stained with toluidine blue, and examined using a light microscope to choose the target regions. Ultrathin sections were stained with uranyl acetate and lead citrate and examined using a transmission electron microscope (LEM 2000, Topcon Ltd., Inc., Tokyo, Japan). In the microscopic examination of H&E-stained sections, lesions observed with <40% of islets were scored as slight (1+) and those with >40% of islets as moderate (2+).
Drug Concentration Measurements
Blood samples (0.5 ml) were withdrawn from the rat jugular veins using disposable syringes with 22G needles under ether anesthesia 1 hr after the final dosing on day 14. The timing of blood collection was approximately coincident with the time of maximum concentration. These samples were transferred into a tube containing heparin lithium (Becton Dickinson and Company, Franklin Lakes, NJ), and the plasma was separated by centrifugation (4°C, 3,000 rpm, 15 min). The animals were euthanized by exsanguination following blood sampling, and the pancreatic tissue samples (approximately 200 mg) were collected. Drug concentrations in the plasma and pancreas were assessed using a liquid chromatography/tandem mass spectrometry (LC-MS/MS) method. Briefly, plasma samples (10 μl) were added to acetonitrile (110 μl) and DV-7751 solution (1 μg/ml, 10 μl) as the internal standard solution. The pancreatic sample was added to phosphate-buffered saline solution (pH 7.4) and homogenized using an ultrasonic disintegrator (20% homogenate). Then, the pancreatic homogenate (50 μl) was mixed with acetonitrile (510 μl) and the internal standard solution (10 μl). After centrifugation (4°C, 13,000 rpm, 5 min) of the plasma and pancreatic homogenate mixtures, the supernatant (100 μl) was collected and mixed with 0.1% acetic acid (900 μl). Aliquots of each resulting mixture (10 μl) were injected into an LC-MS/MS system. The variation study showed linear plots over concentration ranges from 0.1 to 100 μg/ml and daily measurement reproducibility.
Statistical Analysis
The quantitative data of the body weights, food consumption, blood biochemistry, glucose tolerance test were expressed as the means ± standard deviation (SD). They were analyzed statistically using the F test to evaluate the homogeneity of variance. The data were further analyzed by Student’s t test when the variance was homogeneous or by the Welch’s t test when it was heterogeneous (Excel 2013, Microsoft, Redmond, WA). A p < 5% (two-tailed) was considered significant. The drug concentrations in the plasma and the pancreases, and the ratio of the pancreatic to plasma concentration (K p value) were expressed as the mean ± SD (Excel 2013).
Result
Laboratory Tests
Repeated oral dosing of gatifloxacin at 300 mg/kg did not affect serum glucose and glycosylated albumin concentrations on day 7 but significantly increased the levels on day 14 (Figure 1). Although a significant increase in glycosylated albumin concentrations was noted in the lomefloxacin and levofloxacin groups on day 7, this was not considered to be toxicologically important because the changes were very slight and were not observed on day 14. The clinical observations revealed diarrhea, loose stool, or both in all treatment groups, which were associated with the antibacterial action (data not shown). The body weight and food consumption showed no apparent changes in all treatment groups (data not shown).
Serum glucose and glycosylated albumin levels in rats treated with vehicle, gatifloxacin, lomefloxacin, or levofloxacin. Serum glucose concentrations on days 7 (A) and 14 (B) and glycosylated albumin concentrations on days 7 (C) and 14 (D). Data of each groups consisted of 5 animals (n = 5). *p < .05 and **p < .01: Significantly different from the vehicle control group (Student’s t test). GLU = serum glucose; GA = serum glycosylated albumin; control = vehicle; GFLX = gatifloxacin; LFLX = lomefloxacin; LVFX = levofloxacin.
IV Glucose Tolerance Test
Repeated oral dosing of gatifloxacin at 300 mg/kg slightly elevated blood glucose levels at 30 min on day 7 and 30 to 120 min on day 14 (Figure 2). Gatifloxacin did not show statistically significant changes in serum insulin concentrations, primarily due to a wide variability of this parameter in the control group (Figure 3). However, the drug tended to decrease the serum insulin concentrations on day 14 to levels lower than the detection limit (25 pg/ml) in three of four rats, and 316 pg/ml in the remaining rats compared to that of the control group (mean ± SD: 2,380 ± 3,268 pg/ml). In contrast, repeated oral dosing of lomefloxacin and levofloxacin at the same dose level did not affect the blood glucose and serum insulin concentrations on day 14.
Intravenous glucose tolerance tests in rats treated with vehicle, gatifloxacin, lomefloxacin, or levofloxacin. Blood glucose levels on days 7 (A) and 14 (B, C, and D). Data of each groups consisted of 4 animals (n = 4) except that of the control group at 5 min on day 7 (n = 3) due to sampling error. *p < .05 and **p < .01 significantly different from the vehicle control group (Student’s t test), # p < .05 significantly different from the vehicle control group (Welch’s t test). GLU = blood glucose; control = vehicle; GFLX = gatifloxacin; LFLX = lomefloxacin; LVFX = levofloxacin.
Intravenous glucose tolerance tests in rats treated with vehicle, gatifloxacin, lomefloxacin, or levofloxacin. Serum insulin levels at 5-min postglucose load on days 7 (A) and 14 (B). Data of each groups consisted of 4 animals (n = 4). Data of lower limit of quantification were regarded as 25 pg/ml for statistical analysis. INS = serum insulin; control = vehicle; GFLX = gatifloxacin; LFLX = lomefloxacin; LVFX = Levofloxacin.
Pancreatic Pathology
Repeated oral dosing of gatifloxacin at 300 mg/kg induced slight cytoplasmic vacuolation in the pancreatic islets on day 7, and the lesion was more pronounced on day 14 (Table 2). The vacuoles varied in size and contained eosinophilic homogenous substances (Figure 4A and B). The affected cells were enlarged and tended to be localized in the central area of the pancreatic islet. The nuclei of these cells were compressed by vacuoles and sometimes had small vesicles. Immunohistochemically, the cytoplasm of each vacuolated islet cell was positively stained for the insulin/proinsulin antibody, demonstrating that they were pancreatic β cells (Figure 4C and D). The granular appearance of the positive reacting cells was markedly decreased compared with that of the control rat cells. The electron microscopy revealed that cytoplasmic vacuoles represented dilated cisterna of the rough endoplasmic reticulum in the pancreatic β cells (Figure 5A and C). In conjunction with formation of vacuoles, vesicles derived from the rough endoplasmic reticulum were also noted. These vesicles and vacuoles were filled with electron-lucent materials (Figure 5B and D). Furthermore, insulin secretory granules were drastically decreased in vacuolated islet cells. The nuclear vesicles of the vacuolated cells showed double membranes, indicating cytoplasmic invagination. No remarkable changes were noted in any other organelles. In contrast, repeated oral dosing of lomefloxacin and levofloxacin at the same dose did not affect the islet morphology on day 14 (Table 2).
Microscopic Findings in the Pancreas of Rats Treated Orally with Vehicle, Gatifloxacin, Lomefloxacin, and Levofloxacin for 7 or 14 Consecutive Days.
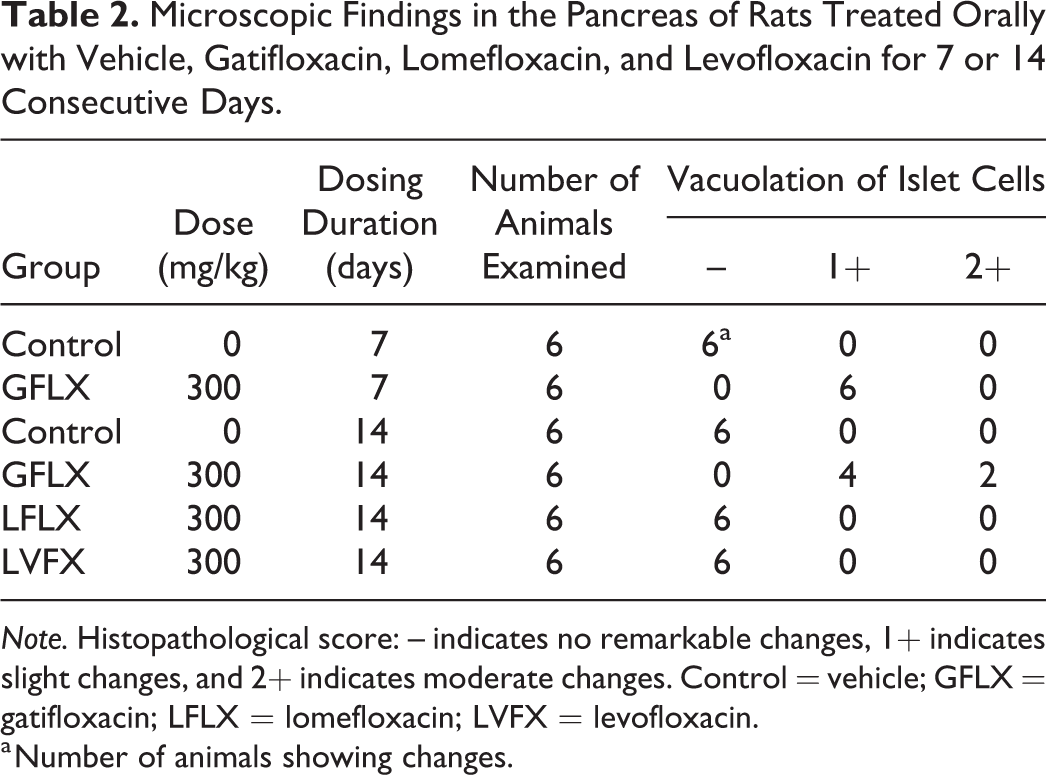
Note. Histopathological score: – indicates no remarkable changes, 1+ indicates slight changes, and 2+ indicates moderate changes. Control = vehicle; GFLX = gatifloxacin; LFLX = lomefloxacin; LVFX = levofloxacin.
a Number of animals showing changes.
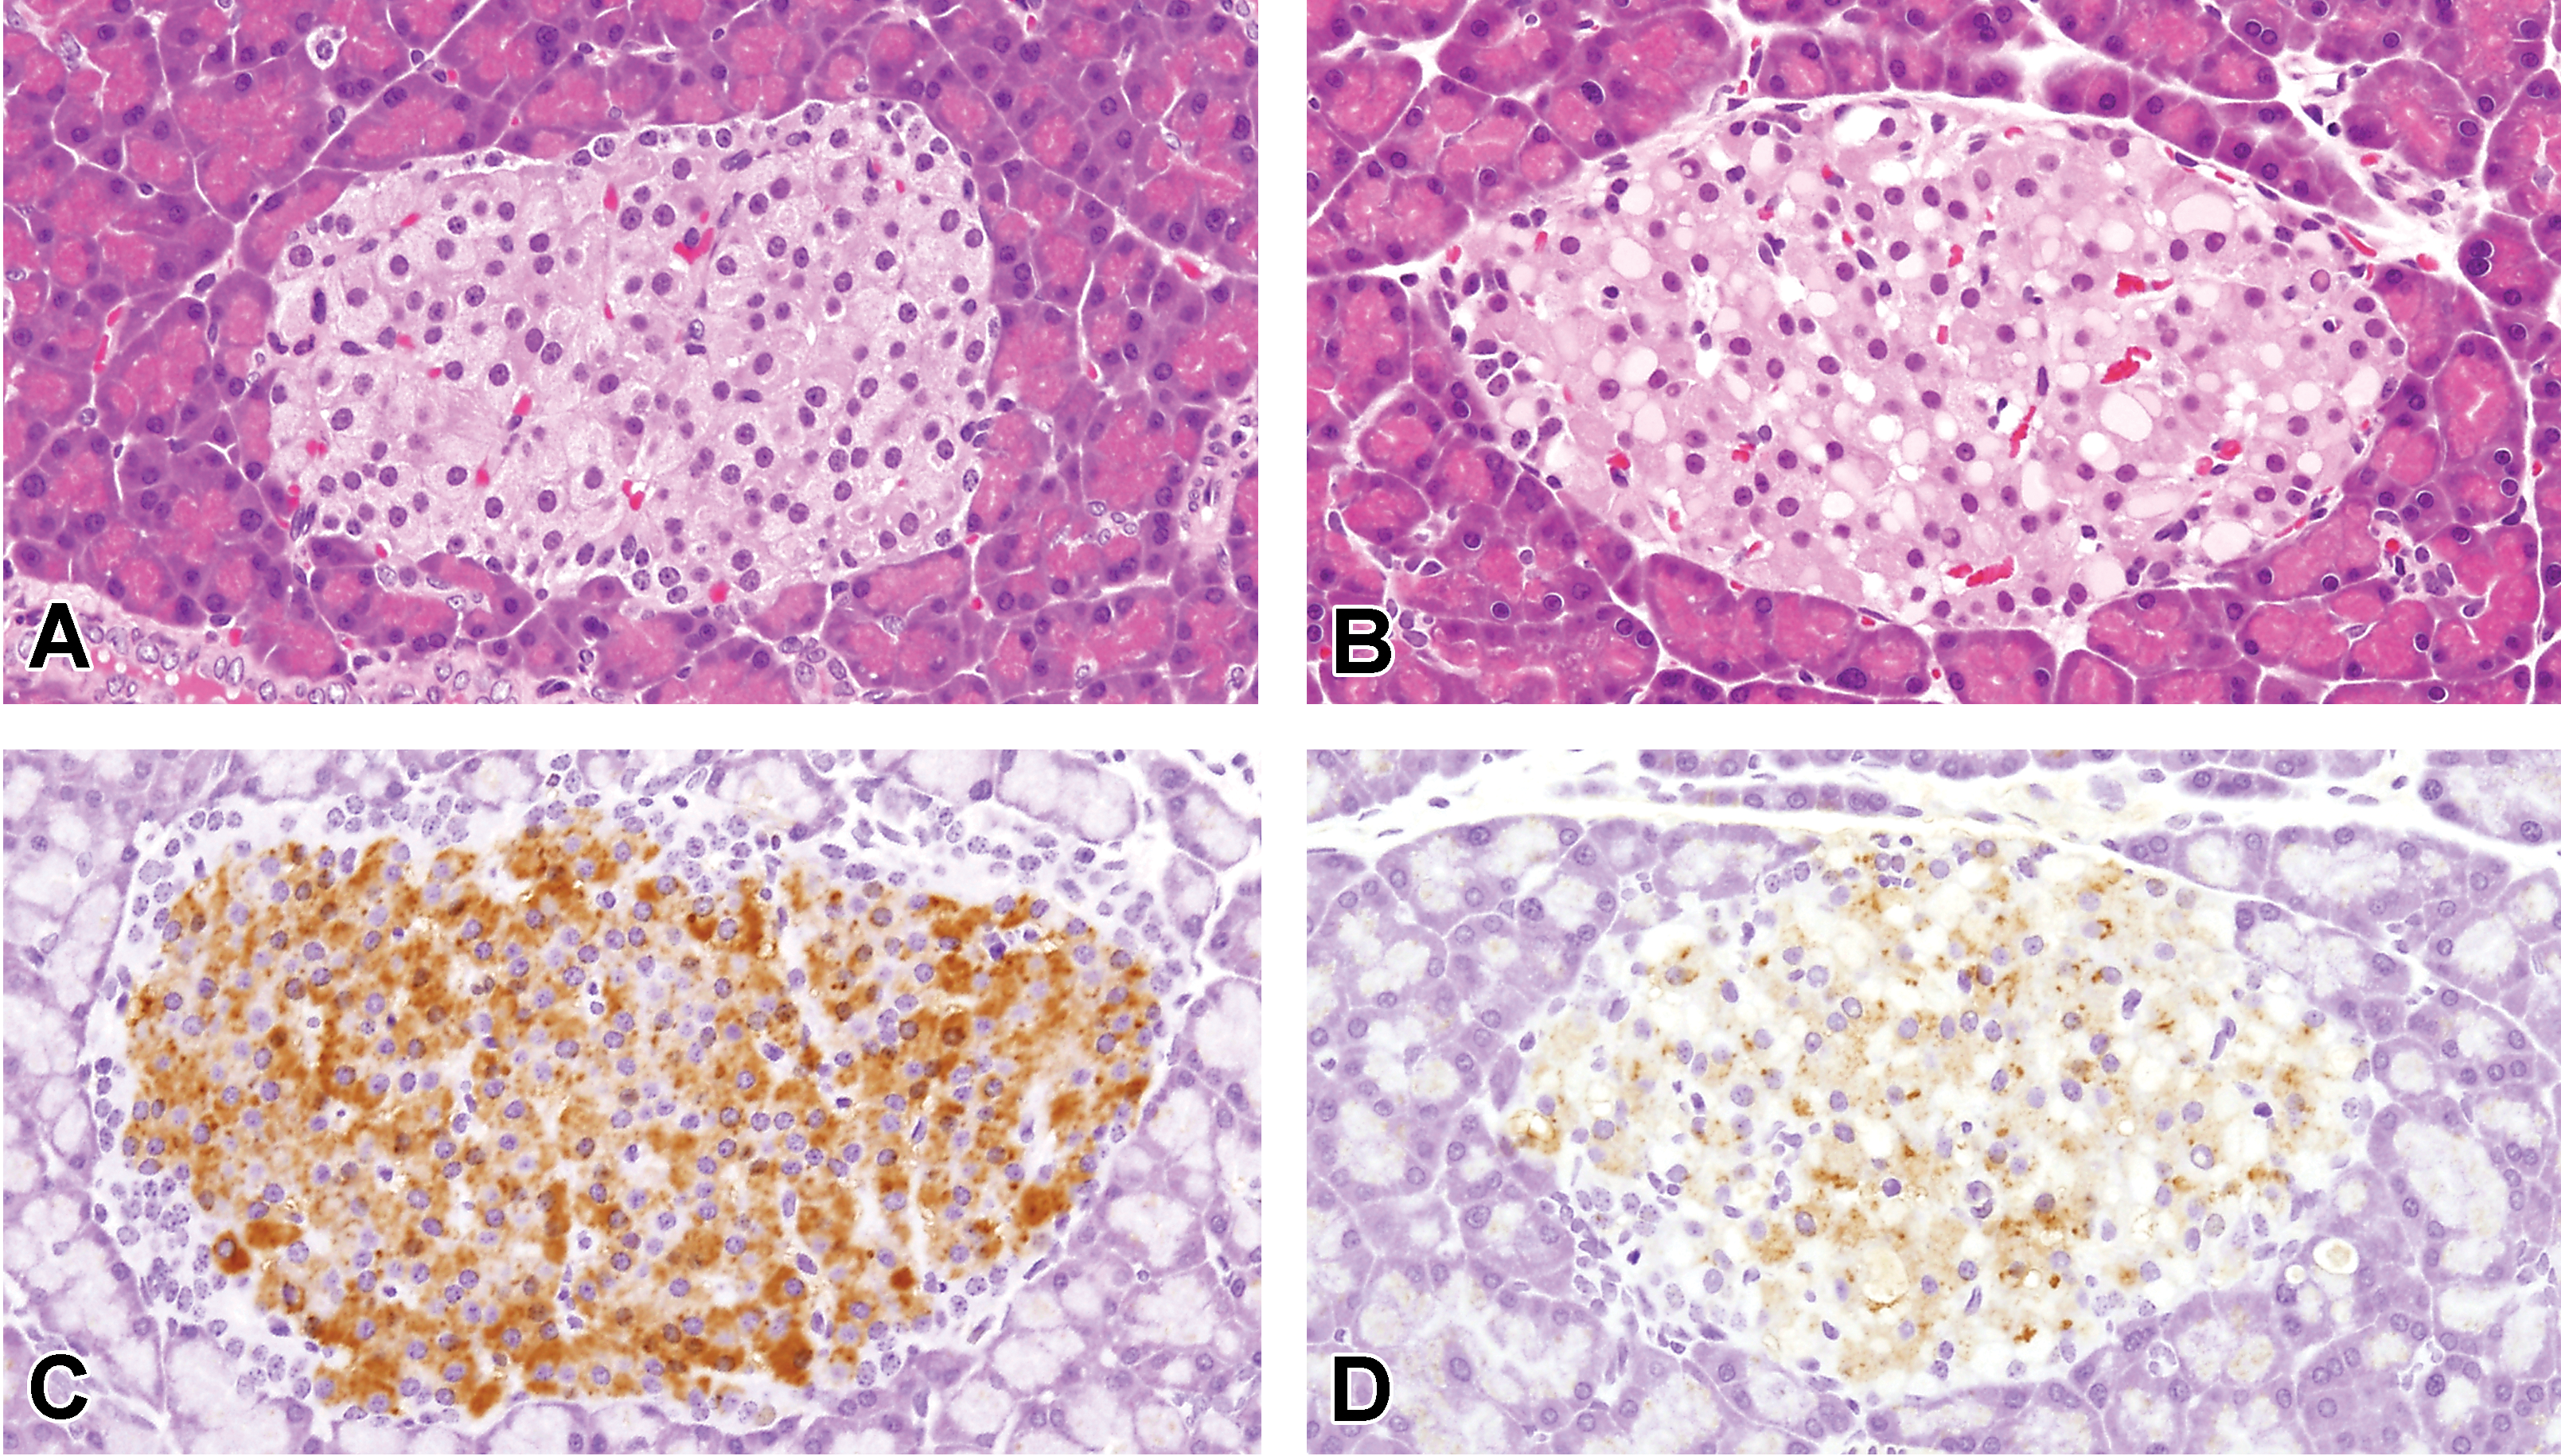
Microscopic appearance of the pancreatic islets in rats treated with vehicle and gatifloxacin on day 15. An animal of the vehicle control group (A) and gatifloxacin group (B), hematoxylin and eosin staining. An animal of the vehicle control group (C) and gatifloxacin group (D), immunohistochemistry of insulin/proinsulin. Original magnification, 40×.
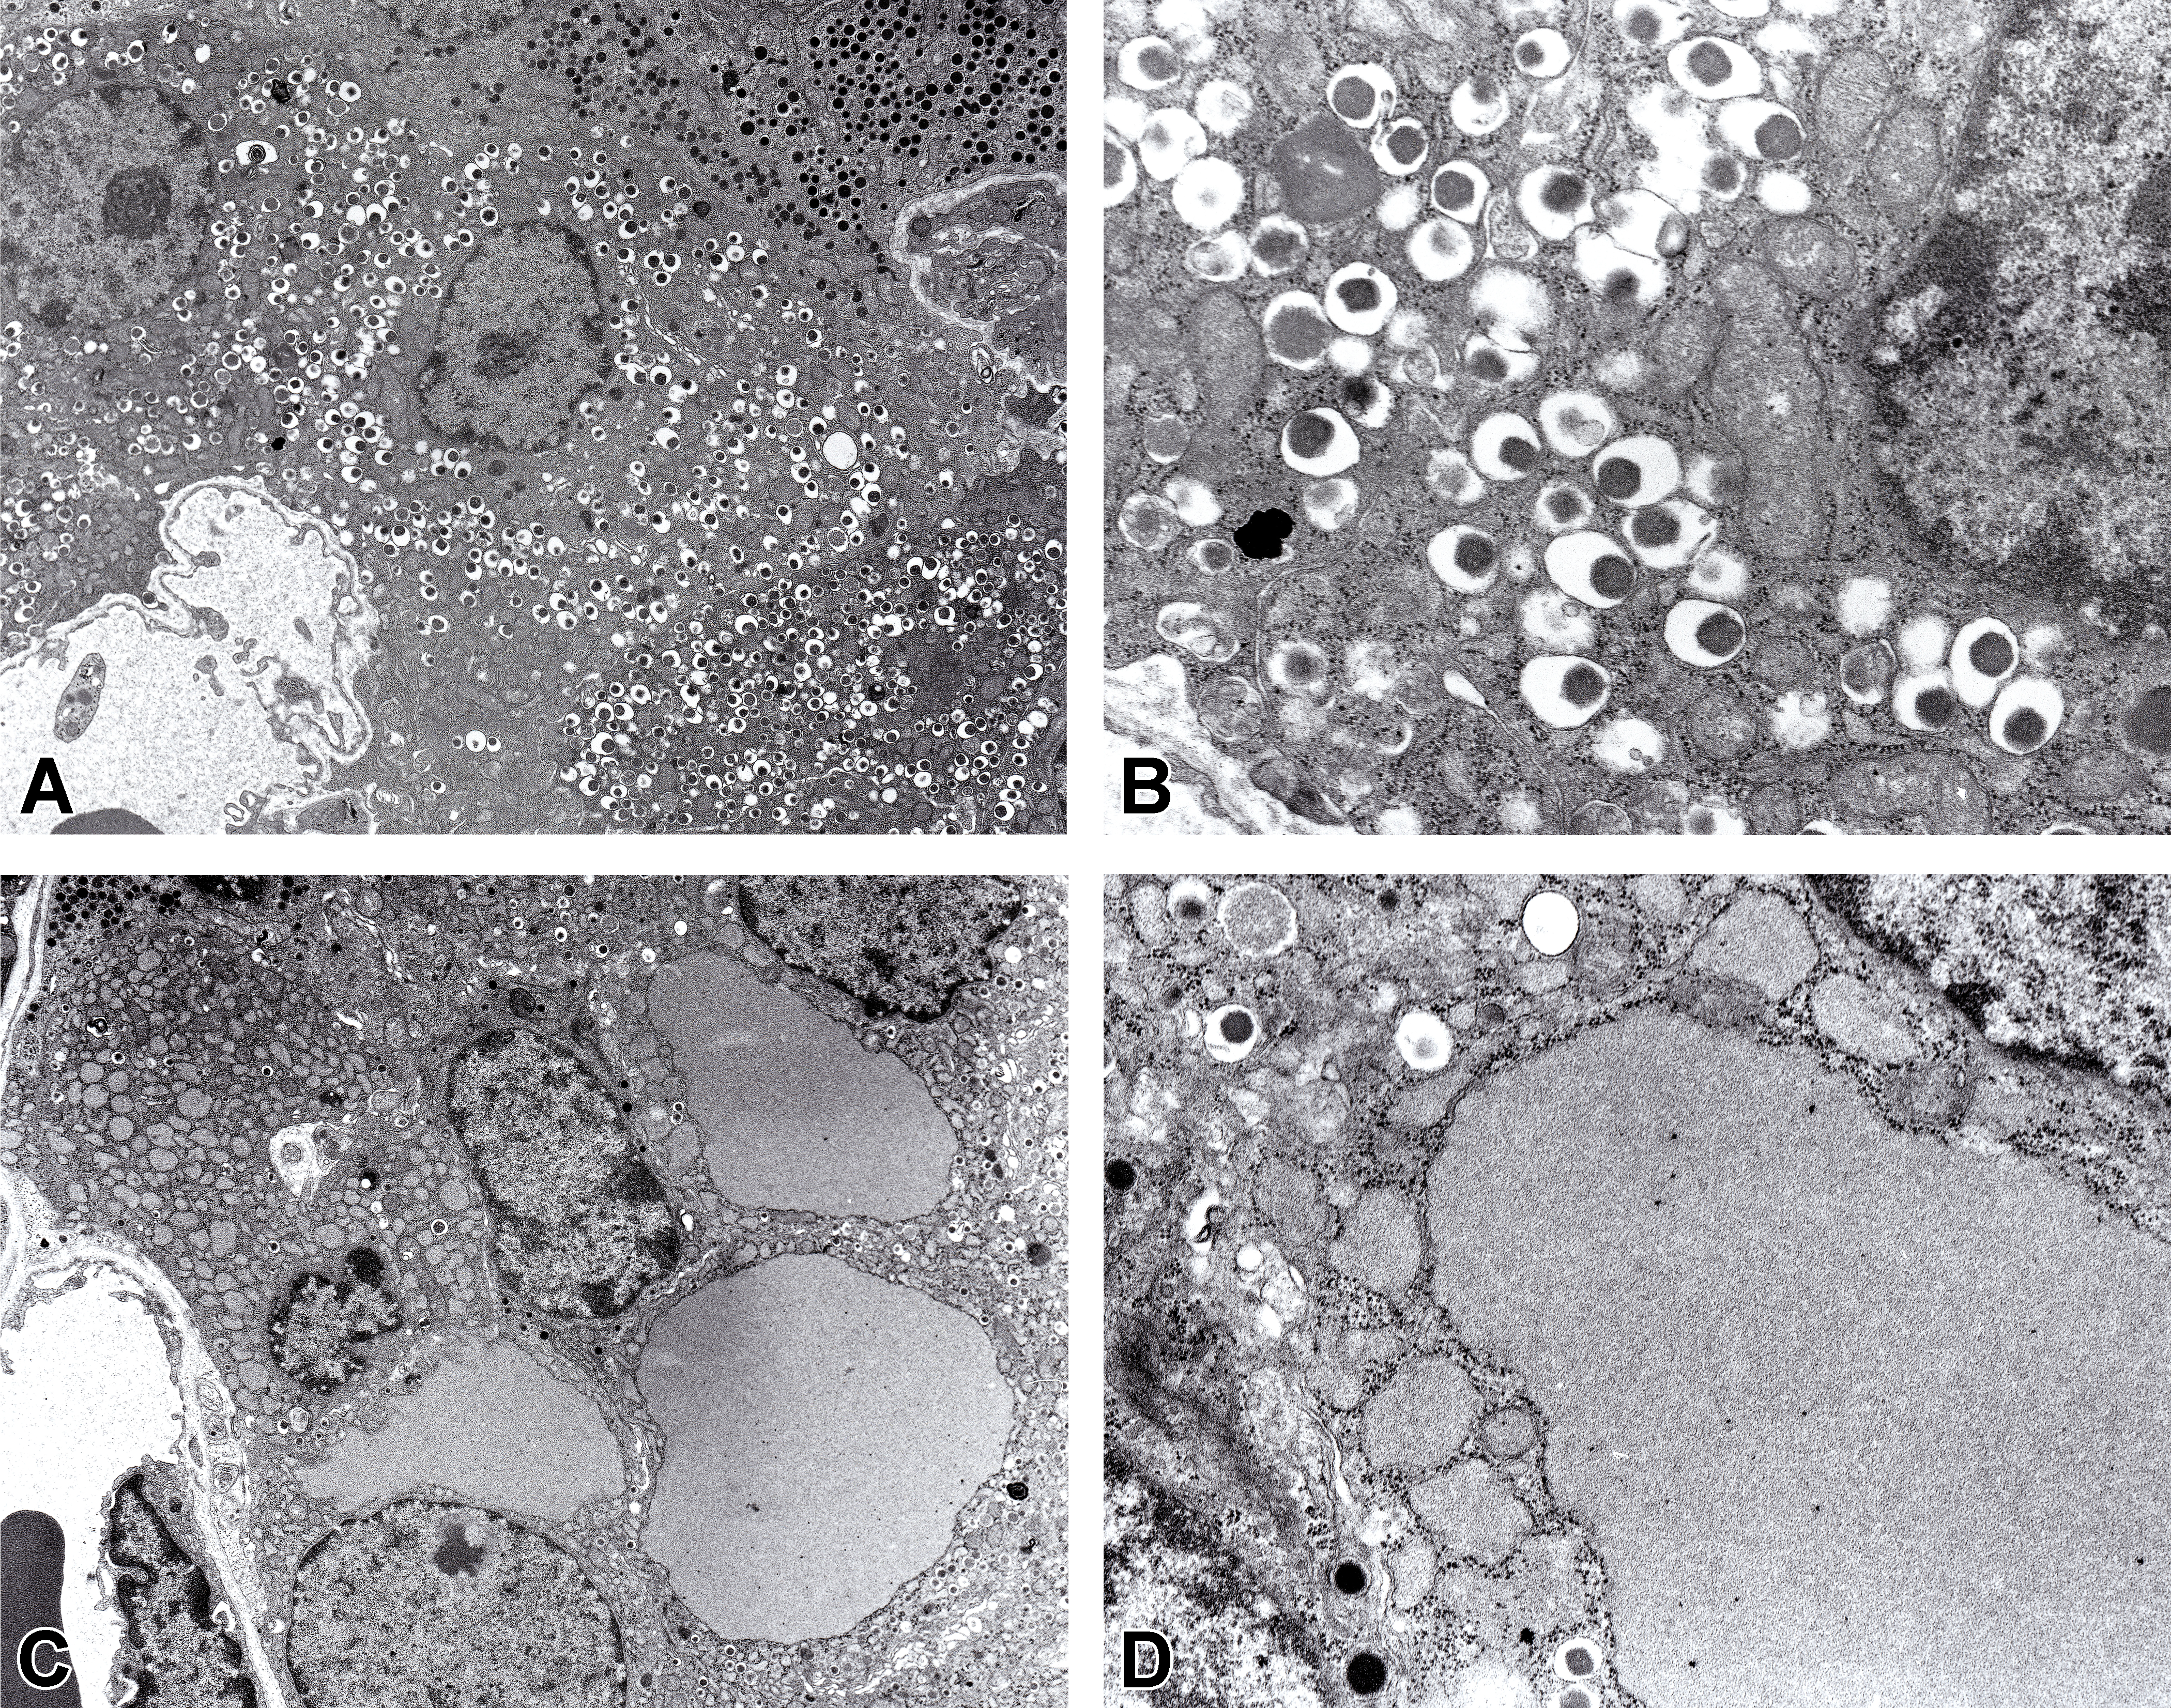
Ultrastructural appearance of the pancreatic β cells of rats treated with vehicle and gatifloxacin on day 15. An animal of the vehicle control group (A and B) and gatifloxacin group (C and D). Original magnification, A and C: 900×, B and D: 3,600×.
Drug Concentration Measurements
The drug concentrations 1 hr after gatifloxacin, lomefloxacin, and levofloxacin dosing on day 14 were 14.11, 14.64, and 11.79 μg/ml in plasma and 128.30, 69.64, and 39.29 μg/g in the pancreas, respectively (Table 3). The K p values were 9.28, 4.76, and 3.48 for gatifloxacin, lomefloxacin, and levofloxacin, respectively.
Drug Concentrations in Plasma and the Pancreas, and K p Values of Rats Treated Orally with Gatifloxacin, Lomefloxacin, and Levofloxacin for 14 Consecutive Days.
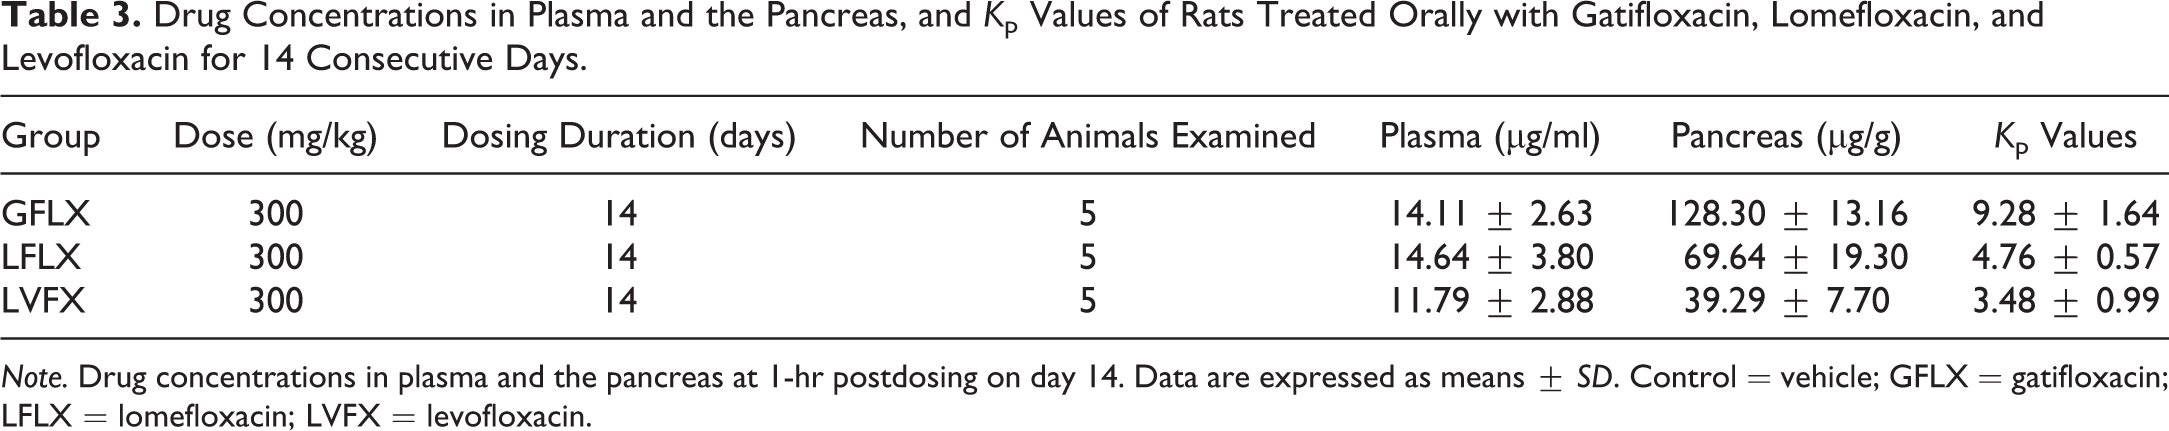
Note. Drug concentrations in plasma and the pancreas at 1-hr postdosing on day 14. Data are expressed as means ± SD. Control = vehicle; GFLX = gatifloxacin; LFLX = lomefloxacin; LVFX = levofloxacin.
Discussion
We investigated the relationship between morphological lesions of pancreatic islets and glucose homeostasis induced by repeated oral administration of gatifloxacin, lomefloxacin, or levofloxacin in rats.
Under the present experimental condition, repeated oral administration of gatifloxacin but not lomefloxacin or levofloxacin at 300 mg/kg increased serum glucose and glycosylated albumin concentrations on day 14. Additionally, an IV glucose tolerance test revealed that gatifloxacin elevated serum glucose with a tendency toward decreased insulin, which was an indicative of dysfunction of pancreatic β cells. These results implied that the hyperglycemia due to gatifloxacin was associated with dysfunction of pancreatic β cells. Clinically, hypoglycemic events are more likely to occur in patients administered quinolones within first 3 days of the therapy than later, whereas hyperglycemia is more likely to develop 4 to 10 days after the initiation of quinolone treatment (Owens and Ambrose 2005; Frothingham 2005). Therefore, the delayed occurrence of hyperglycemia in rats treated with repeated oral doses of gatifloxacin in this study might be analogues to timing of quinolone-induced hyperglycemia in humans.
Microscopic examinations revealed that gatifloxacin induced cytoplasmic vacuolation of pancreatic islet cells, consistent with a previous report (Nagai et al. 2010). Immunohistochemically, the islet cells were positively stained for insulin, which suggested they were pancreatic β cells. The granular appearance of the positive reaction in treated animals was markedly decreased compared with that of the control animals. Importantly, these morphological changes were suggestive of dysfunction of pancreatic β cells, which led to hyperglycemia. This observation is supported by the data showing that vacuolar changes in the pancreatic islet cells induced by certain chemicals were associated with hyperglycemia accompanied by dysfunction of β cells in rats (Fischer, Rickert, and Lazrow 1975; Longnecker, Wold, and Fischer 1972; Molello, Barnard, and Thompson 1984; Kast and Ueberberg 1986; Whiting et al. 1990; Hirano et al. 1992). Interestingly, the cytoplasmic vacuolation of pancreatic islet cells caused by gatifloxacin occurred on day 7 without changes in serum glucose and glycosylated albumin levels and the IV glucose tolerance test. These results suggested that the functional reserve (mass) of pancreatic β cells was still sufficient on day 7, as previously reported (Nagai et al. 2010).
Of note, cytoplasmic vacuolation of pancreatic β cells caused by gatifloxacin was observed as dilated cisterna of the rough endoplasmic reticulum, which was filled with electron-lucent materials in the electron microscopic examinations. More importantly, this was accompanied by marked depletion of insulin secretory granules in the cytoplasm. In contrast, no remarkable changes were noted in any other organelles including the Golgi apparatus. These findings suggest the increased insulin secretion or impairment of insulin synthesis and/or transport for the lesion development. Physiologically, insulin is synthesized as pre-/proinsulin in the rough endoplasmic reticulum and then delivered to the Golgi apparatus in β cells. A series of proteolytic cleavage steps in the Golgi apparatus generate mature insulin, which is then stored in secretory granules and secreted by physiological stimulation. In the present study, electron microscopic findings were accompanied by hyperglycemia and decreased insulin secretion was noted in the IV glucose tolerant test. Although the increased insulin secretion may be involved in the development of lesions at an early stage, dilation of cisterna in the rough endoplasmic reticulum is thought to reflect the disturbance of insulin synthesis and/or transport in β cells. Yamada et al. (2006) reported that decreased insulin contents and insulin messenger RNA expressions were involved in the decreased insulin secretion by cultured mouse islets after long-term exposure to gatifloxacin. Similarly, Tomita et al. (2007) reported decreased insulin secretion and suppression of reactivity to stimulation by sulfonylureas in the insulin-secreting HIT-T15 cell line following prolonged incubation with gatifloxacin. Furthermore, cyclizine, an antihistamic drug, was reported to induce cytoplasmic vacuolation characterized by dilated cisterna of the rough endoplasmic reticulum of pancreatic β cells in rats, and its vacuolar contents were positively stained with insulin antiserum immunohistochemically (Hanai 1984). These observations suggest that the impairment of insulin synthesis and/or transport would be involved in gatifloxacin-induced hyperglycemia in rats.
The drug concentration measurements showed higher distribution and retention of gatifloxacin in the pancreas than of lomefloxacin and levofloxacin, despite the comparable serum drug concentrations of these quinolones. Therefore, the higher distribution and retention of gatifloxacin than of the other agents may be determinants for the development of pancreatic lesions, as several studies have reported (Ishiwata, Sanada, and Yasuhara 2006; Nagai et al. 2010).
It is important to note that short-term exposure to gatifloxacin inhibited K ATP channel activity in mouse pancreatic islets or the insulin-secreting MIN6m9 cell line, leading to insulin secretion and hypoglycemia (Saraya et al. 2004). In contrast, long-term exposure to gatifloxacin decreased the insulin contents in mouse pancreatic islets or HIT-T15 cells (Yamada et al. 2006; Tomita et al. 2007). Furthermore, when HIT-T15 cells were exposed to gatifloxacin, insulin secretion from the cells was increased during 1 to 3 hr exposure, whereas the insulin content in the cells was decreased by 3- to 48-hr exposure (Tomita et al. 2007). These results suggested that hypoglycemia develops in the early phase of gatifloxacin treatment and subsequently progresses to hyperglycemia. However, serum glucose measurements, glucose tolerance tests, and morphological examinations of the pancreatic islet cells were conducted only on days 7 and 14, but not earlier than day 7 in the present study. Therefore, further investigations are necessary to identify the pathogenesis of dysglycemia induced by gatifloxacin.
In conclusion, gatifloxacin provoked functional and morphological alterations in pancreatic β cells associated with the impairment of insulin synthesis and/or transport, leading to hyperglycemia. Furthermore, the high distribution and retention of gatifloxacin in the pancreas were suggested to be likely determining factors for the induction of lesions by gatifloxacin in the present study.
Footnotes
Acknowledgments
The authors wish to thank Dr. Kazuhisa Furuhama and Dr. Hiroshi Satoh (Iwate University, Japan) for their helpful advice and support in the execution of these experiments.
Author Contributions
Authors contributed to conception or design (KY, KM); data acquisition, analysis, or interpretation (KY, YY, TS, ST); drafting the manuscript (KY); and critically revising the manuscript (KM). All authors gave final approval, and agreed to be accountable for all aspects of work in ensuring that questions relating to the accuracy or integrity of any part of the work are appropriately investigated and resolved.
Declaration of Conflicting Interests
The author(s) declared no potential conflicts of interest with respect to the research, authorship, and/or publication of this article.
Funding
The author(s) received no financial support for the research, authorship, and/or publication of this article.