
Abstract
Duchenne muscular dystrophy (DMD) and Becker muscular dystrophy (BMD) are neuromuscular disorders that primarily affect boys due to an X-linked mutation in the DMD gene, resulting in reduced to near absence of dystrophin or expression of truncated forms of dystrophin. Some newer therapeutic interventions aim to increase sarcolemmal dystrophin expression, and accurate dystrophin quantification is critical for demonstrating pharmacodynamic relationships in preclinical studies and clinical trials. Current challenges with measuring dystrophin include the variation in protein expression within individual muscle fibers and across whole muscle samples, the presence of preexisting dystrophin-positive revertant fibers, and trace amounts of residual dystrophin. Immunofluorescence quantification of dystrophin can overcome many of these challenges, but manual quantification of protein expression may be complicated by variations in the collection of images, reproducible scoring of fluorescent intensity, and bias introduced by manual scoring of typically only a few high-power fields. This review highlights the pathology of DMD and BMD, discusses animal models of DMD and BMD, and describes dystrophin biomarker quantitation in DMD and BMD, with several image analysis approaches, including a new automated method that evaluates protein expression of individual muscle fibers.
Keywords
Muscular Dystrophy
Muscular dystrophies are a large, heterogeneous group of diseases that result in progressive weakness and degeneration of the skeletal muscles that control movement (Guiraud et al. 2015; Kornegay 2017; Wicklund 2013). Muscular dystrophy was first described in the early 1800s, and since then, many different forms have been identified caused by an expanding list of genetic mutations (Kamdar and Garry 2016; Tyler 2003). More than 30 types of muscular dystrophy have been identified, and examples include Duchenne muscular dystrophy (DMD)/Becker muscular dystrophy (BMD), myotonic, limb-girdle, facioscapulohumeral, oculopharyngeal, and Emery–Dreifuss dystrophies (Berger and Currie 2012; Plantie et al. 2015). The genetic mutations, major muscle groups affected by each mutation, clinical syndromes, and treatment options have been reviewed elsewhere (Bastian et al. 2015; Bonne and Quijano-Roy 2013; Chau and Kalsotra 2015; Fanin and Angelini 2015; Gatica and Rosa 2016; Luigetti et al. 2015; Madej-Pilarczyk and Kochanski 2016; Meola and Cardani 2015; Wang and Tawil 2016; Wicklund 2013). This review will focus on DMD and BMD.
DMD and BMD
DMD and BMD are X-linked disorders that have a combined estimated prevalence of 1 in 7,250 males (Romitti et al. 2015). DMD affects approximately 1 in 3,500 to 5,000 live male births worldwide (Emery 1991; Guiraud et al. 2015; Kamdar and Garry 2016; Mendell et al. 2012; V. Nigro and Piluso 2015; Robinson-Hamm and Gersbach 2016; Romitti et al. 2015). Affected boys appear clinically normal at birth; however, signs and symptoms become apparent, and a diagnosis is made by around 4 to 5 years of age (Guiraud et al. 2015; Mendell et al. 2012; Robinson-Hamm and Gersbach 2016). Functional improvements due to natural growth are observed in boys younger than age 7, until the characteristic degeneration and loss of muscle tissue outpace maturational development and physical growth (E. S. Mazzone et al. 2013; McDonald et al. 2010). As muscle deterioration overtakes muscle growth, patients with DMD have difficulty walking during childhood and become wheelchair dependent by their early teens (Bello et al. 2016; Flanigan 2014; Guiraud et al. 2015; Kole and Krieg 2015; E. Mazzone et al. 2011; G. Nigro et al. 1983). These patients continue to lose upper extremity function and require progressively more assisted ventilation during the teenage years (Guiraud et al. 2015). Cardiomyopathy is typically present by 14 to 15 years old (Viollet et al. 2012). Premature death typically occurs by 30 years of age, though recent improvements in management of cardiorespiratory function are improving life expectancy (Guiraud et al. 2015; Kohler et al. 2009; V. Nigro and Piluso 2015; Zaharieva et al. 2013). BMD is milder and occurs less frequently than DMD, affecting 1 in 11,500 to 19,000 males (Kamdar and Garry 2016). Typically, BMD manifests later in life with a mean onset of 12 years, loss of ambulation is delayed until the third decade of life, onset of cardiac involvement is variable, and the overall life expectancy is longer compared with DMD patients (K. M. Bushby et al. 1993; Finsterer and Stollberger 2008; Flanigan 2014; V. Nigro and Piluso 2015). Although the disease is X-linked, 3–8% of female carriers can present with symptoms ranging from mild (symptomatic carriers) to rapidly progressive DMD-like muscular dystrophy due to skewed inactivation of X chromosomes (Guiraud et al. 2015; Miyagoe-Suzuki et al. 2017).
DMD and BMD Gene Mutations
DMD and BMD results from an inherited or spontaneous mutation in the DMD gene (Kamdar and Garry 2016). Approximately one-third of cases arise from spontaneous mutations (Nardes, Araujo, and Ribeiro 2012; Selsby et al. 2015). The correlation between mutation and phenotype is better explained by the reading frame theory of Monaco (Monaco et al. 1988). This theory argues that if a deletion leads to a shift in the open reading frame, then premature termination results in a truncated protein (or no protein), which is often associated with the DMD phenotype (Blake et al. 2002). By contrast, if a deletion does not result in a frame shift, then a partially functional, abnormally small dystrophin protein is often produced, resulting in the BMD phenotype (Blake et al. 2002). While the reading frame theory of Monaco explains >90% of cases, some cases contradict this model (Koenig et al. 1989). In this study, there were patients with milder phenotypes who had out-of-frame deletions of exons 3 to 7 and there were patients with deletions that did not disrupt the reading frame who exhibited more severe phenotypes; some of these latter patients had deletions large enough to likely result in a protein too small to be functional (Koenig et al. 1989). These contradictory cases suggest that there may be additional modifiers influencing the patient’s disease phenotype.
A variety of DMD mutations have been documented. Approximately two-thirds are large deletions or duplications detectable by microarray analysis, while approximately one-third are point mutations or small insertions/deletions detectable by gene sequencing; less than 5% of DMD mutations are in the noncoding regions of the gene (Gee, Xu, and Hotta 2017; Koenig et al. 1989; Le Rumeur 2015; Robinson-Hamm and Gersbach 2016). Deletions can occur anywhere within the dystrophin gene but are often concentrated between exons 44 and 55 (Aartsma-Rus, Ginjaar, and Bushby 2016). In-frame deletions in this region remove part of the rod domain (Blake et al. 2002). The DMD cases resulting from point mutations and very small insertions/deletions primarily introduce premature stop codons (Blake et al. 2002). These mutations seem to be evenly distributed throughout the gene (Blake et al. 2002).
Dystrophin and the Dystrophin-associated Protein Complex (DAPC)
The DAPC is present within muscle fibers. Some components are subsarcolemmal, some are associated with the cell membrane, and some are immediately outside the sarcolemma. The DAPC provides mechanical support during contraction/relaxation and likely functions in signal transduction (Heydemann, Doherty, and McNally 2007). The DAPC is composed of dystrophin, cytoskeletal proteins, and proteins that form 3 separate complexes—the dystroglycan subcomplex, the sarcoglycan–sarcospan subcomplex, and the cytoplasmic subcomplex (Ehmsen, Poon, and Davies 2002; Sancar et al. 2011). Proteins in these complexes include α- and β-dystroglycan, sarcoglycans, sarcospan, syntrophins, and dystrobrevin; abnormalities in these proteins may result in loss of membrane integrity, cell injury, and myonecrosis (Kamdar and Garry 2016; Quattrocelli, Spencer, and McNally 2017). The functions of these proteins have been reviewed by Allen, Whitehead, and Froehner (2016). Mutations in some of the nondystrophin DAPC proteins or other glycosyltransferases that support O-mannosylation of α-dystroglycan cause non-DMD and non-BMD forms of muscular dystrophy (Guiraud et al. 2015; Heydemann, Doherty, and McNally 2007).
Dystrophin is encoded by the DMD gene, which is the largest protein-coding gene in the human genome and is present on the X chromosome (Tuffery-Giraud et al. 2017). The gene is ∼2.5 Mb, composed of 79 exons and results in a 427-kDa protein predominantly expressed in cardiac, smooth, and skeletal muscle (Nardes, Araujo, and Ribeiro 2012; Sironi et al. 2002). Interestingly, splice variants of dystrophin are also expressed in the brain (cerebral cortical, hippocampal, and Purkinje cell neurons as well as glial cells), retina, and Schwann cells (Bies et al. 1992; Sironi et al. 2002). Altered dystrophin expression in these neurons is thought to explain the cognitive impairment often observed in DMD and BMD (D’Angelo et al. 2011; E. Mazzone et al. 2011). In muscle, dystrophin is a protein of low abundance (0.002% of skeletal muscle protein) located on the intracellular side of the sarcolemma (Brown et al. 2012; Hoffman, Brown, and Kunkel 1987). Functionally, dystrophin is thought to act as a molecular shock absorber, as part of the DAPC, by transmitting forces generated by contraction to the extracellular matrix (Guiraud et al. 2015; Kamdar and Garry 2016).
Utrophin, a Dystrophin Paralog
Utrophin is encoded by the UTRN gene on human chromosome 6 and mouse chromosome 10 (Helliwell et al. 1992; Nguyen et al. 1991; Schofield et al. 1993). It is a 395-kDa protein expressed in skeletal, smooth, and cardiac muscle (Helliwell et al. 1992; Pons et al. 1994; Schofield et al. 1993). Early in development, utrophin is present at the sarcolemma of skeletal muscle. It is progressively replaced by dystrophin, such that in adult muscle, utrophin is primarily expressed at myotendinous and neuromuscular junctions (Clerk et al. 1993; Janghra et al. 2016; Nguyen et al. 1991; Schofield et al. 1993; Tome et al. 1994). Utrophin is also expressed in vascular smooth muscle and nerves (Helliwell et al. 1992). In regenerating skeletal myofibers, utrophin is again expressed at the sarcolemma (Helliwell et al. 1992). Structurally, utrophin shares 80% of sequence homology with dystrophin (Schofield et al. 1993; J. M. Tinsley et al. 1992). Despite functional differences where dystrophin, but not utrophin, plays a role in microtubule organization and neuronal nitric oxide synthase (nNOS) localization to the sarcolemma, several studies have shown that utrophin improves function in dystrophic muscle (Anthony et al. 2014; Belanto et al. 2014; Janghra et al. 2016; Krag et al. 2004; Rafael et al. 1998; Squire et al. 2002; J. M. Tinsley et al. 1992).
Muscle Pathology in DMD and BMD
Nondiseased skeletal muscle is composed of fibers that in cross section have a relatively uniform size and polygonal shape; there is very little endomysial connective tissue separating adjacent muscle fibers (Figure 1A; Blake et al. 2002). DMD muscle is characterized by variable degrees of atrophy, hypertrophy, myonecrosis, regeneration, and endomysial fibrosis (Figure 1B; Blake et al. 2002; Mah et al. 2016). The severity of histopathology ranges widely depending on the age of the patient and the muscle being evaluated. The absence of functional dystrophin prevents the connection between the intracellular cytoskeleton and the cell membrane, leading to repeated cycles of myonecrosis and regeneration associated with inflammation and repair (Allen, Whitehead, and Froehner 2016; Blake et al. 2002; Falzarano et al. 2015; Mah et al. 2016; Zaharieva et al. 2013). Within individual muscle fibers, the necrosis is segmental and regeneration relies upon satellite cell proliferation to produce myoblasts that eventually fuse to bridge the necrotic segment (Blake et al. 2002). Macrophages are invariably present, as they participate in phagocytosis of the necrotic muscle fibers (Blake et al. 2002; Madaro and Bouche 2014). Lymphocyte infiltrates are variable, but lymphocytes are only rarely numerous enough to mimic myositis. Late in the disease process, myofibers are largely replaced by fibrofatty tissue (Blake et al. 2002; Collins and Morgan 2003).
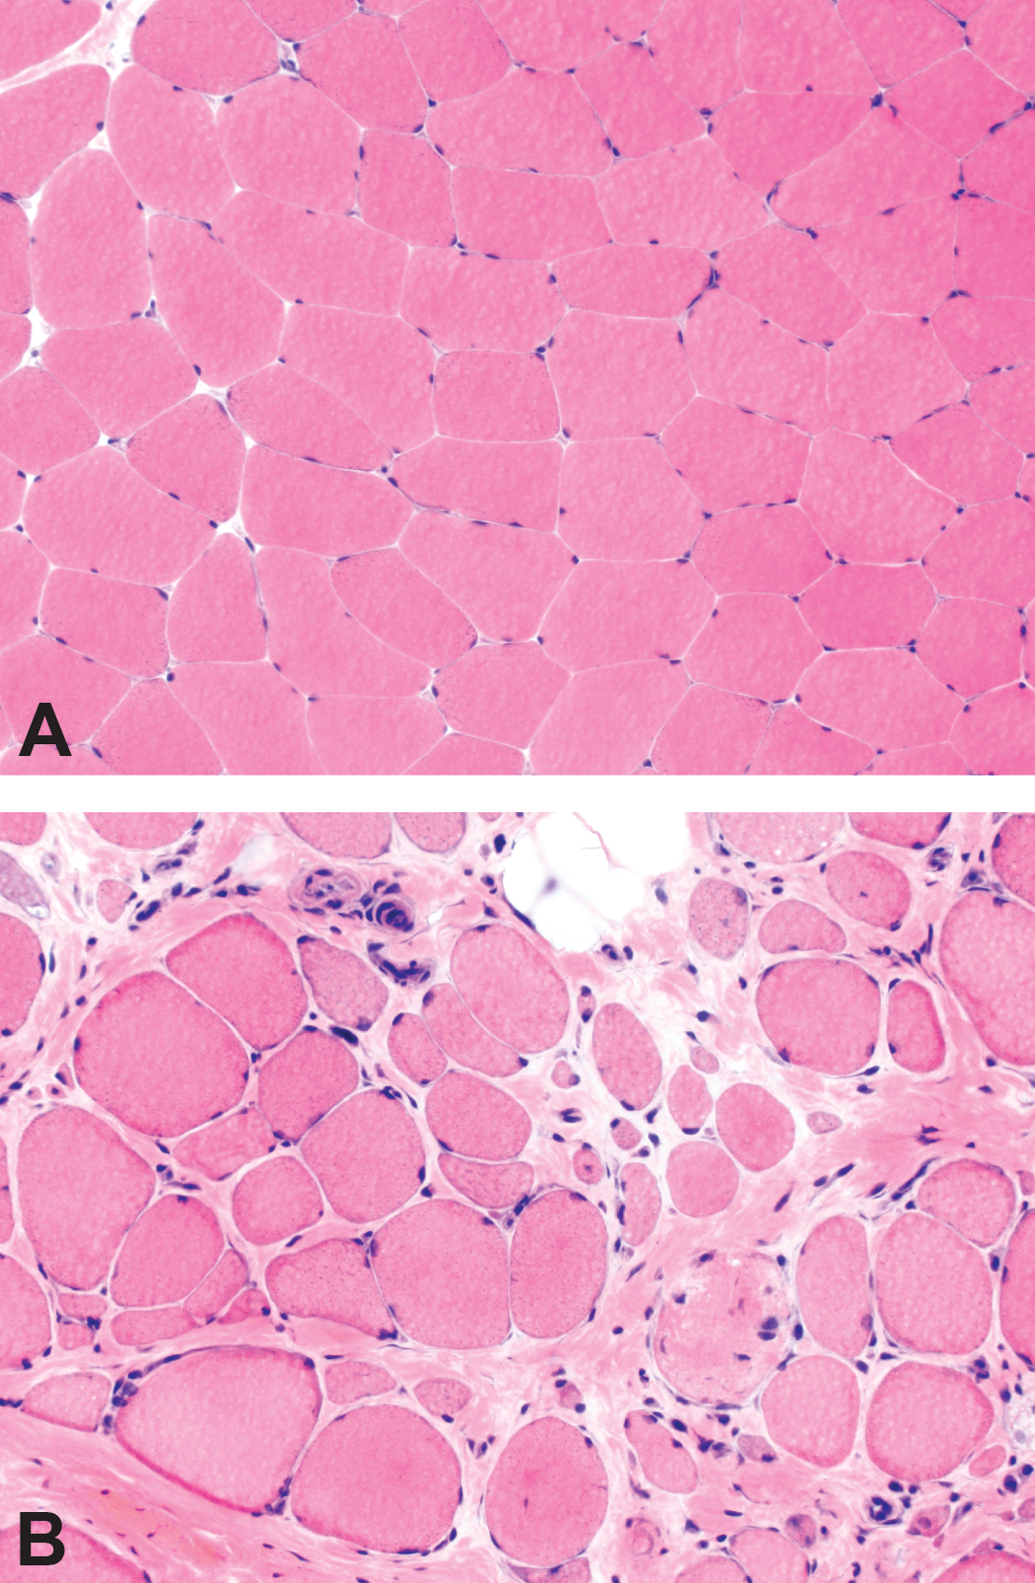
Histologic lesions of Duchenne muscular dystrophy (DMD) muscle. The section of normal muscle (A) demonstrates myofibers that are uniform in size, polygonal in shape, and evenly spaced with very little endomysial connective tissue. The section of DMD muscle (B) shows increased myofiber size variation (atrophy and hypertrophy), internal nuclei, myonecrosis, endomysial fibrosis, and fatty replacement. Hematoxylin and eosin stain.
In BMD, skeletal muscle pathology is similar to, though milder than, that present in age-matched DMD patients (Kaido et al. 1991; Tachi et al. 1993). Interestingly, Kaido et al. (1991) describe a distribution in BMD muscle pathology that segregates based on age at biopsy, not severity of disease presentation. In younger patients (≤15 years old), the pathology is predominantly active myonecrosis and regeneration, whereas in older patients (>15 years old), chronic myopathic changes (increased internally placed nuclei, split fibers, extremely hypertrophic muscle fibers, and endomysial fibrosis) were more likely to be observed (Ciciliot and Schiaffino 2010; Kaido et al. 1991; Tachi et al. 1993). The entire spectrum of DMD and BMD histopathologic changes can also be observed in the various genotypes of congenital and limb-girdle muscular dystrophies (D’Angelo et al. 2011; Robinson-Hamm and Gersbach 2016).
Mechanism of Injury in DMD
The mechanism of injury in DMD and BMD is multifactorial and complex. Early studies suggested that membrane damage and the consequences of Ca2+ influx were key to the pathology (Allen, Whitehead, and Froehner 2016; Blake et al. 2002; N. Deconinck and Dan 2007; Nowak and Davies 2004). This was supported by electron microscopy evidence of focal disruptions in the cell membrane and elevations in intracellular Ca2+ concentration (Allen, Whitehead, and Froehner 2016). Later, studies in mdx mice, a mouse model that harbors a genetic mutation resulting in a DMD-like phenotype, demonstrated that muscle contraction is required for the initial muscle damage to occur (Allen, Whitehead, and Froehner 2016; Shoji et al. 2015). In mdx mice with unlimited activity, histologic evidence of myonecrosis and regeneration first appears at 3 to 4 weeks of age and affects >50% of fibers by 8 weeks of age; whereas in muscle of limbs that were kept at a fixed length (short or long), evidence of damage (i.e., central nuclei) was not present (Allen, Whitehead, and Froehner 2016; Mokhtarian et al. 1999). Similarly, in cultured mdx myotubes, resting intracellular Ca2+ levels were higher in spontaneously contracting myotubes versus those immobilized by tetrodotoxin (Allen, Whitehead, and Froehner 2016; Hopf et al. 1996). Together, this suggests that dystrophin loss combined with calcium influx and muscle contraction results in muscle damage (Shoji et al. 2015).
Additional studies demonstrate a role for loss of nNOS and nitric oxide (NO) and increases in reactive oxygen species (ROS) and reactive nitrogen species in the pathology of DMD and BMD, though the true importance of nNOS loss is not known (see Allen, Whitehead, and Froehner 2016, for detailed review). nNOS, a signal transduction protein associated with the DAPC, produces NO, which may regulate local vascular perfusion, calcium mobilization, glucose metabolism, and contractile function (Allen, Whitehead, and Froehner 2016; Guiraud et al. 2015). In DMD patients, reduced nNOS activity results in impaired vasodilation and ischemia; however, some BMD patients lack the nNOS-binding domain but remain mildly affected and ambulant, suggesting nNOS tethering at the sarcolemma is not an absolute requirement to have a mild phenotype (Anthony et al. 2011; Guiraud et al. 2015; Thomas 2013; Torelli et al. 2004). Loss of nNOS from the sarcolemma is also associated with an increase in the ROS-producing Nicotinamide adenine dinucleotide phosphate oxidase (NOX2; Allen, Whitehead, and Froehner 2016). Increases in protein carbonyl groups and levels of isoprostanes, indicators of muscle oxidation and lipid peroxidation, respectively, have been demonstrated in muscle from mdx mice and DMD patients, suggesting a role for ROS in DMD pathology (Allen, Whitehead, and Froehner 2016; Grosso et al. 2008; Hauser et al. 1995; Haycock et al. 1996; Messina et al. 2006). Finally, studies in mdx mice suggest that stretch activation of NOX2 rapidly produces ROS, triggering Ca2+ entry through stretch-activated channels, leading to increased mitochondrial Ca2+ and ROS production, ultimately resulting in muscle damage and weakness (Allen, Whitehead, and Froehner 2016).
Experimental Models of DMD
The number of experimental models for studying DMD is high, with more than 60 models available (McGreevy et al. 2015). Stem cell models and nonmammalian models also have a role in understanding disease pathogenesis and effects of treatments on disease pathophysiology. While each has its limitations, each of the following model systems has provided significant information in understanding DMD.
Stem Cell Models
Although embryonic stem cells and induced pluripotent stem cells (iPSCs) with dmd gene mutations have been used to study the skeletal and cardiac muscle pathology and drug efficacy, the focus thus far has been on modeling cardiomyopathy (Kalra, Montanaro, and Denning 2016; Smith et al. 2016). Kalra, Montanaro, and Denning (2016) suggest that cardiomyocytes derived from iPSCs provide a superior alternative to the mdx mouse to study the cardiac complications of DMD. First, mdx mice develop mild disease late in their life span, and mdx mice with a second knockout (double knockout [dko]) that develop cardiac disease earlier have a second gene mutation not present in humans (Kalra, Montanaro, and Denning 2016). Second, mouse hearts differ physiologically from human hearts by having a faster heart rate (HR), a decrease in the force of contraction with increasing HR (vs. an increase in force for humans), differences in ion channels that repolarize the plasma membrane, and differences in expression of α- versus β-myosin heavy chain (Kalra, Montanaro, and Denning 2016). Third, iPSCs can be genetically modified using the Cas9/clustered regularly interspaced short palindromic repeat system to correct the mutation (Kalra, Montanaro, and Denning 2016). This provides an isogenic control in which the only difference between the 2 cell populations is the corrected gene sequence (Kalra, Montanaro, and Denning 2016).
Nonmammalian Models
The dystrophin gene is highly conserved, and homologues have been identified in vertebrates and invertebrates, including Caenorhabditis elegans, Drosophila melanogaster, and Danio rerio (Collins and Morgan 2003; McGreevy et al. 2015). While nonmammalian models have different musculature and pathology from their mammalian counterparts, their advantage is their physiologic simplicity and the ease of genetic manipulation (Collins and Morgan 2003).
Zebra fish (D. rerio) have rapid external development of translucent embryos that are easy to manipulate, which makes them attractive to researchers (Berger and Currie 2012). They have abundant skeletal muscle and express orthologues of most DAPC proteins that have similar membrane localization as in the human (Collins and Morgan 2003). Dystrophin-deficient zebra fish have been identified (dmd ta222a) and created by morpholino knockdown, and their histologic features include extensive muscle degeneration/necrosis, fibrosis, inflammation, activation of muscle stem cells, and variation in fiber diameter (Berger et al. 2010; Berger and Currie 2012). Similar to humans, zebra fish express dystrophin in embryos first at a junctional myotendinous location in the embryo and later at nonjunctional sarcolemma (Berger et al. 2010). Failure of this transition is believed to be the major cause of the human pathology (Berger et al. 2010; Berger and Currie 2012). Dystrophin-deficient zebra fish have been used to study exon-skipping therapies, and while they demonstrate that 20–30% of normal dystrophin levels are needed to rescue a severe phenotype in this context, they cannot be used to study issues related to systemic antisense oligonucleotide administration (Berger et al. 2011; Berger and Currie 2012).
C. elegans are readily genetically manipulatable and can be grown en masse, making them ideal for high-throughput genetic and pharmacologic studies (Collins and Morgan 2003). They express the dystrophin homologue dys-1, and when in a mutated MyoD genetic background, dys-1 mutations lead to progressive impairment of locomotion (Collins and Morgan 2003; Gaud et al. 2004). While affected nematodes have widespread degeneration of the body wall muscles, their muscular structure is dramatically different from that of mammals (Gaud et al. 2004). Their muscle fibers do not fuse and are incapable of regeneration (Gaud et al. 2004). Dystrophin-deficient C. elegans have been used to screen numerous compounds covering a wide spectrum of targets (Gaud et al. 2004). In these nematodes, prednisone reduces the number of degenerating fibers by 40%. Since they do not mount an inflammatory response to myonecrosis, this suggests that prednisone exerts a direct effect on muscle survival (Gaud et al. 2004). C. elegans have also been used to study Ca2+ signaling through their voltage-dependent Ca2+ channel (VDCC; Zhan et al. 2014). In these studies, dystrophin was shown to be a load-bearing scaffold protein that influences membrane stiffness and transduces muscle tension to VDCCs (Zhan et al. 2014).
D. melanogaster is useful because of its short generation time, large number of progeny, simple morphology, and segmental body plan (Kreipke et al. 2017; Plantie et al. 2015). The Drosophila DAPC also contains the major components present in the mammalian DAPC (Kreipke et al. 2017). Drosophila are useful for studying degenerative muscle diseases because their muscles lack satellite cells responsible for regeneration, allowing differentiation between phenotypes stemming directly from degeneration versus those arising from failure of regeneration (Kreipke et al. 2017). Similar to C. elegans, Drosophila has also been used for small molecule therapeutics (Pantoja and Ruohola-Baker 2013).
Rodent Models
The mdx mouse is commonly used to study DMD and the dystrophic phenotype arises because of a point mutation (C to T transition) in exon 23, which results in a stop codon and truncated protein (De Luca 2012; McGreevy et al. 2015; Selsby et al. 2015). While the mdx mouse is well characterized (Table 1), the disease phenotype in all commonly examined muscles except for the diaphragm is much milder than the human DMD phenotype (Selsby et al. 2015). These mice exhibit only a 25% decrease in life span (vs. 75% decrease in humans) and display minimal clinical signs (McGreevy et al. 2015). Dko mice have been developed with varying effects on phenotype (McGreevy et al. 2015; Selsby et al. 2015). For example, dko mice lacking dystrophin and utrophin have a severe DMD-like phenotype with a significantly shortened life span (A. E. Deconinck et al. 1997). Second mutations have been introduced to reduce compensatory mechanisms (i.e., loss of utrophin), humanize mice (i.e., inactivation of cytidine monophosphate sialic acid hydrolase [Cmah]), reduce muscle regeneration (i.e., elimination of MyoD), and to mutate genes involved in cytoskeleton-ECM (extracellular matrix) interactions (i.e., desmin and laminin); however, this introduces a second mutation not present in human DMD, complicating data interpretation (A. E. Deconinck et al. 1997; McGreevy et al. 2015; Selsby et al. 2015). Finally, mdx mice with second mutations to reduce inflammation have been developed (McGreevy et al. 2015). While mice are useful for studying pathogenesis, they are poor models of responses to gene therapy vectors. In mice, intramuscular injection results in persistent adeno-associated virus transduction (compared with nominal transduction in humans; McGreevy et al. 2015).
Comparison of Clinical Manifestations and Histopathology of Dystrophin-null Mice, Dogs, and Humans.
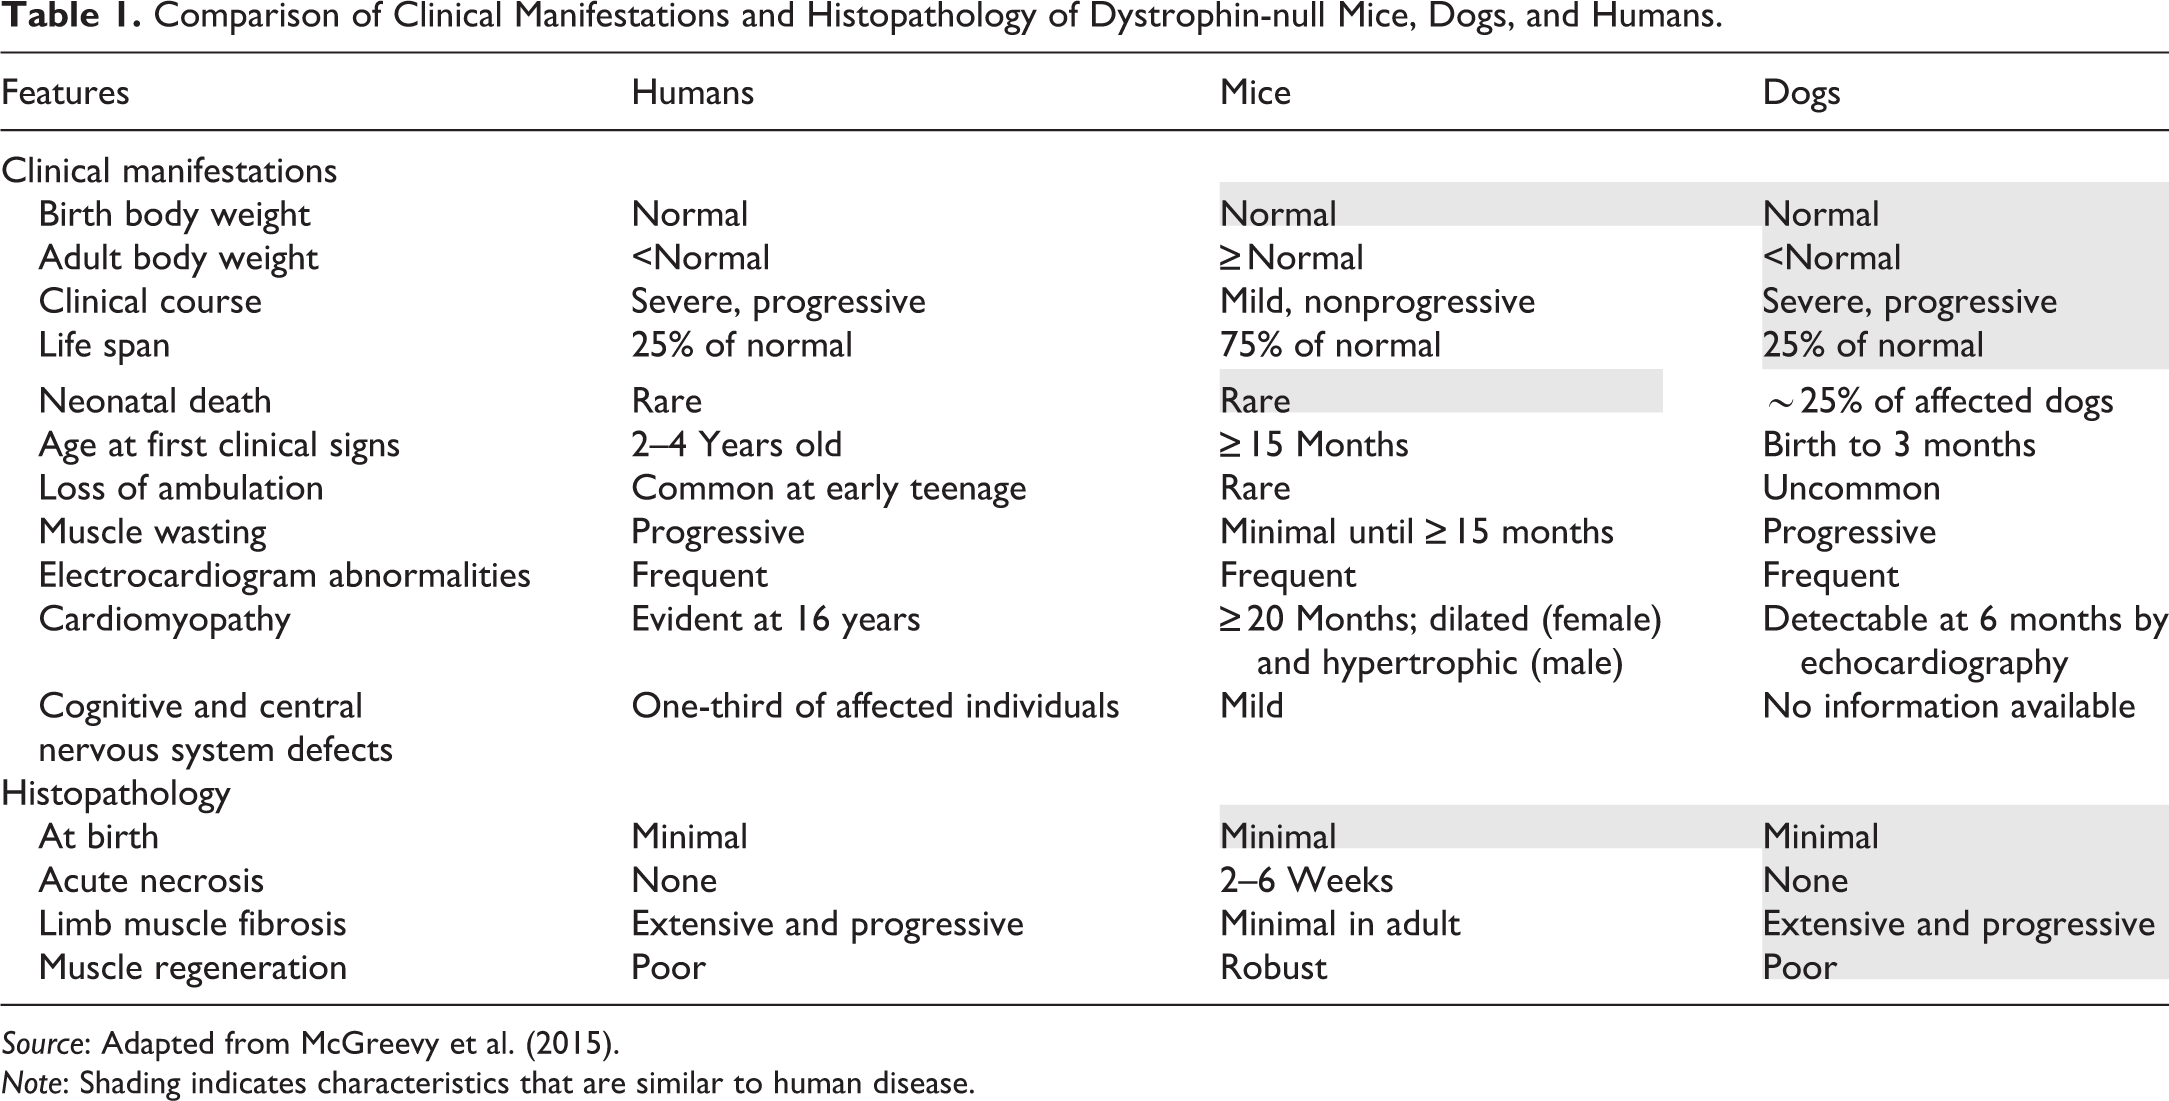
Source: Adapted from McGreevy et al. (2015).
Note: Shading indicates characteristics that are similar to human disease.
Two different strains of dystrophin-deficient rats have been created and characterized (Larcher et al. 2014; K. Nakamura et al. 2014). These rats have deletions either between exons 3 and 16 or in exon 23 (Larcher et al. 2014; K. Nakamura et al. 2014). They have undetectable levels of dystrophin (by Western blot) and <5% dystrophin-positive fibers by immunohistochemistry (IHC; Larcher et al. 2014; K. Nakamura et al. 2014). Rats with mutations in exon 23 display progressive myonecrosis and regeneration along with fibrofatty replacement (Larcher et al. 2014). Significant fibrosis arises within the heart, and they develop dilated cardiomyopathy as indicated by eccentric hypertrophy and diastolic dysfunction (Camacho et al. 2016). Because of the cardiac similarities of these rats with DMD patients, they are considered to be a better model than mdx mice for studying DMD cardiomyopathy (Camacho et al. 2016; Larcher et al. 2014).
Large Animal Models of DMD
DMD models have been established in the cat, dog, and pig (see Table 2; Klymiuk et al. 2013; Kornegay 2017; McGreevy et al. 2015). Dystrophin gene disruption has been produced in a rhesus monkey; however, a model has not been established (Chen et al. 2015). These models are useful for investigating responses to viral vectors. Canine models have similar nominal transduction rates as humans, and there is robust immune rejection following gene therapy as in DMD patients (Duan 2015). These models are also useful for identifying issues from large-scale vector production and delivery (Duan 2015). While some of these models more closely replicate the human disease than the nonmammalian and rodent models, they are costly and availability for research is limited. Additionally, the golden retriever muscular dystrophy (GRMD) dog and pig models have breeding issues. Finally, each of these large animal models is based on a single DMD mutation, which cannot model the heterogeneity of human mutations (McGreevy et al. 2015).
Animal Models of DMD.
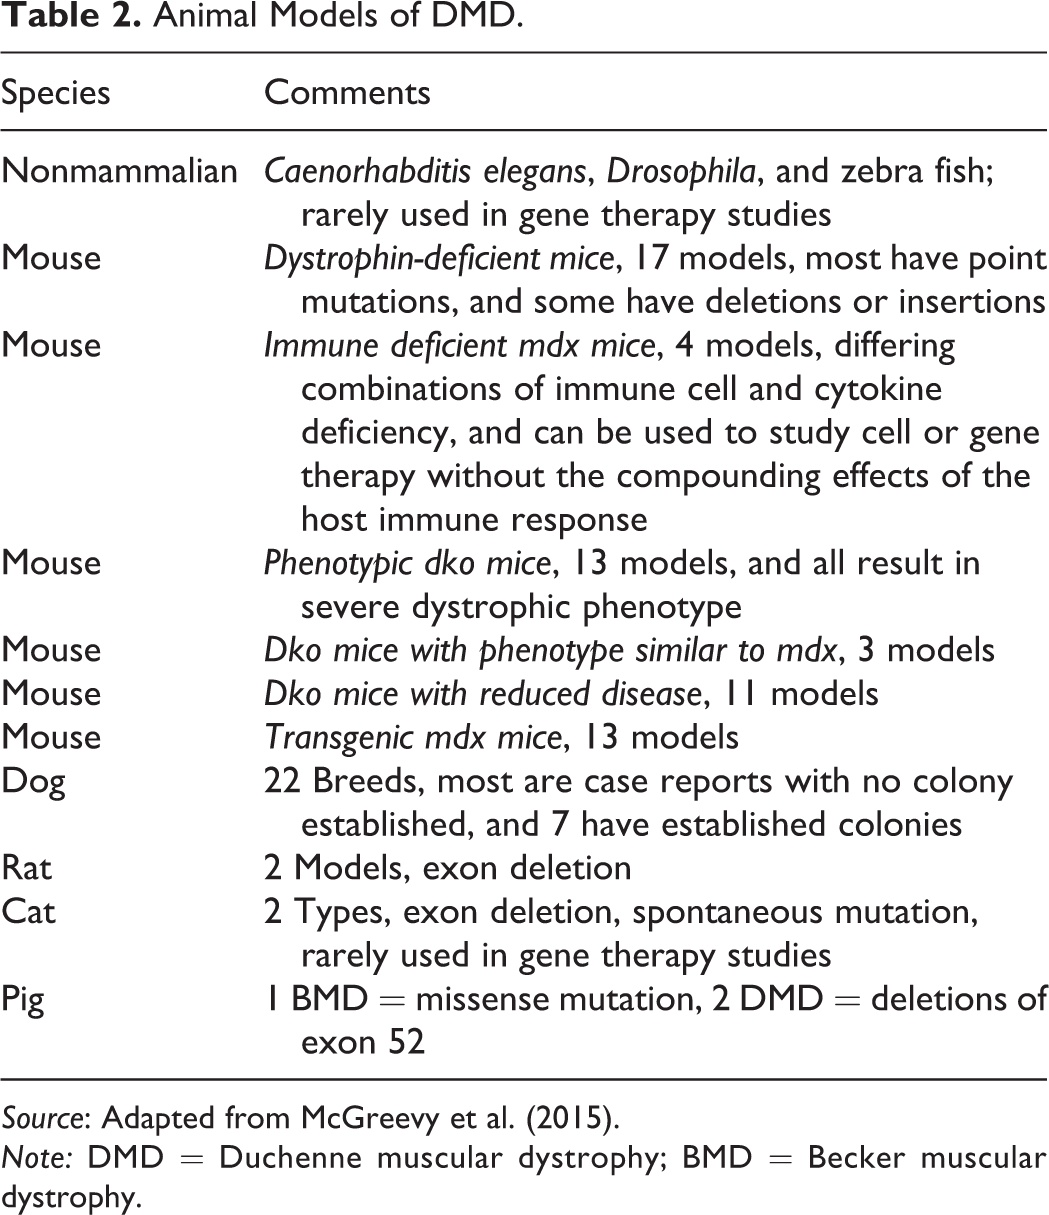
Source: Adapted from McGreevy et al. (2015).
Note: DMD = Duchenne muscular dystrophy; BMD = Becker muscular dystrophy.
In the dog, dystrophin deficiency has been documented in 20 different dog breeds and colonies of affected animals have been established for 7 breeds (McGreevy et al. 2015). The GRMD is the most widely used dog model; these dogs have a point mutation in intron 6, 1 of the hot spots of mutation in DMD patients (McGreevy et al. 2015). This mutation results in exclusion of exon 7 and a frame shift that introduces a stop codon in exon 8 (A. Nakamura and Takeda 2011; Selsby et al. 2015). The GRMD dogs display a similar disease course to that of DMD patients, with limb weakness and exercise intolerance at 2 to 3 months of age, muscle atrophy, dysphagia, abnormal weight gain, signs of heart disease by 6 months, and death at about 3 years (McGreevy et al. 2015; A. Nakamura and Takeda 2011). Unfortunately, these dogs have a “honeymoon” period around 6 to 10 months, where disease progression stabilizes and the GRMD and human DMD phenotypes diverge (Kornegay 2017; McGreevy et al. 2015). Although the genotype of these dogs remains consistent, phenotype can be variable and is likely due to genetic modifiers, including secreted phosphoprotein 1 and latent transforming growth factor β-binding protein 4 (Klymiuk et al. 2016; Kornegay 2017). In the Cavalier King Charles spaniel (CKCS) with muscular dystrophy, the missense mutation was identified in exon 50, another hot spot for mutations in DMD patients, and these dogs are valuable for studying exon-skipping drugs (A. Nakamura and Takeda 2011; Walmsley et al. 2010). Because of the genetic limitations of this breed, Professor Piercy at the Royal Veterinary College (United Kingdom) has engineered a model of DMD in the beagle with this same mutation, and the natural history study of these dogs is ongoing (Porter 2015).
Dystrophin-deficiency with multifocal myonecrosis and regeneration has been identified in cats, and the large deletion mutations are located at the muscle and Purkinje promoters of the dystrophin gene (Carpenter et al. 1989; F. Gaschen and Burgunder 2001; Klymiuk et al. 2016; Selsby et al. 2015). Affected cats develop hypertrophy of the tongue, neck, and shoulder muscles as well as megaesophagus, hepatosplenomegaly, and kidney failure (A. Nakamura and Takeda 2011). In contrast to DMD patients, they develop hypertrophic cardiomyopathy (L. Gaschen et al. 1999; McGreevy et al. 2015). With the difference in skeletal and cardiac muscle phenotype as well as tongue and diaphragm hypertrophy leading to feeding difficulties and death, these cats are rarely used as a research animal (A. Nakamura and Takeda 2011; Selsby et al. 2015).
Dystrophin-deficient pigs have been generated by deleting exon 52 (Klymiuk et al. 2013). These pigs demonstrate similar progressive multifocal myonecrosis and regeneration as in DMD patients (Klymiuk et al. 2013, 2016). Interstitial fibrosis and mononuclear cellular infiltration are also present (Koenig et al. 1989; Le Rumeur 2015). These pigs also demonstrate similar functional impairment but in an accelerated manner. Similar to the CKCS and beagle models of DMD with deletions of exon 50 to 52, the pig model can be used to study exon-skipping drugs (Klymiuk et al. 2016). The pigs can also be used to study proteomic changes at the various disease stages (Frohlich et al. 2016). Affected pigs have a maximum life expectancy of 14 weeks and since the male pigs do not live to breeding age, these pigs cannot be propagated by breeding (Klymiuk et al. 2016). To overcome these breeding difficulties, female carriers have been generated and have been mated with wild-type boars. Studies characterizing the offspring are in progress (Klymiuk et al. 2016).
Evaluating Efficacy of Therapeutic Candidates
DMD Pipeline
Currently, there is no cure for DMD and BMD, and only 2 therapies are approved for use in these patients in the United States. Additional therapeutics are approved in Europe. One of the approved U.S. therapies reduces inflammation (Emflaza™, the glucocorticoid deflazacort). Inflammation plays an important role in the pathogenesis of DMD. Early inflammation removes dead myofibers; however, without an increase in dystrophin, which is associated with a reduction in inflammatory marker expression, a chronic inflammatory state is established with overexpression of NF-κB, TNF-α, and dysregulation of M1/M2 macrophages (De Luca 2012; Madaro and Bouche 2014). Glucocorticoids increase muscle strength, prolong independent ambulation, delay onset of cardiomyopathy, improve pulmonary function, and reduce the incidence of scoliosis (Griggs et al. 2016). While clinical improvement is observed with these therapies, the improvement is temporary (disease progression is delayed), and treatment is associated with side effects including weight gain, cataracts, and bone fractures (Lim, Maruyama, and Yokota 2017). Deflazacort is associated with less weight gain than prednisone (which is used off-label), and this helps reduce mechanical load on impaired muscles (Griggs et al. 2016). Because of the lack of long-term efficacy of glucocorticoids, potentially more curative therapies for DMD are in development. Strategies include cell-based strategies (transplantation of healthy myoblasts or stem cells into patients), gene-based strategies (gene therapy, exon-skipping drugs), utrophin modulators, and calcium modulators (Allen, Whitehead, and Froehner 2016; Willcocks et al. 2016). Eteplirsen (Exondys 51™), the second U.S.-approved drug, promotes dystrophin production by restoring the translational reading frame of the DMD gene by skipping translation of exon 51 (Lim, Maruyama, and Yokota 2017). Ataluren (Translarna™), approved for use in the European Union, is used in patients with DMD caused by a nonsense mutation (Bushby et al. 2014). Ataluren is believed to interact with ribosomes to read through premature stop codons, allowing production of the full-length protein (Welch et al. 2007).
End Points Used for Assessing Clinical Improvement
Methods for measuring efficacy can be broadly classified into 2 categories—clinically meaningful and surrogate. Clinically meaningful end points relate to quality of life, and in DMD patients, include the 6-min walk test (6MWT), timed function tests (time to stand from a supine position, time to walk/run 10 m, and time to climb or descend 4 standard-sized stairs), and quantitative strength using handheld myometry (McDonald et al. 2013b). Surrogate end points are used to predict clinical benefit and include muscle enzymes, forced vital capacity and imaging (magnetic resonance imaging [MRI]-T2/1H-magnetic resonance spectroscopy [MRS], echocardiography), quantitative assessment of dystrophin in biopsies, and gene expression profiling. The 6MWT, MRI-T2/1H-MRS, and quantitative assessment of dystrophin in biopsies are discussed below.
The 6MWT is an indicator of global muscle and cardiorespiratory function (Allen, Whitehead, and Froehner 2016). In this test, boys walk down a flat, straight, well-lit, and seldom-traveled corridor (see Figure 2; McDonald et al. 2010, 2013a). A tape line indicates the length of the course and is marked in 1-m increments, and cones are used at the beginning and end of the course (McDonald et al. 2010, 2013a). Distance traveled at each minute and location of falls are recorded (McDonald et al. 2010, 2013a). Testing staff can provide verbal encouragement to maintain attention to the task, and “safety chasers” can help fallen boys stand (McDonald et al. 2013a). While the 6MWT is becoming the gold standard for assessing therapies, it does have practical difficulties (Allen, Whitehead, and Froehner 2016). In normal boys, the distance traveled increases with age but decreases as the disease becomes more debilitating (Allen, Whitehead, and Froehner 2016). Thus, the test is insensitive to disease progression in younger boys. Also, distance increases in a drug trial are only unequivocally the result of the drug if the disease is in a stage of decline (Allen, Whitehead, and Froehner 2016). This complicates data interpretation in younger boys, who might benefit most from the therapy under study.
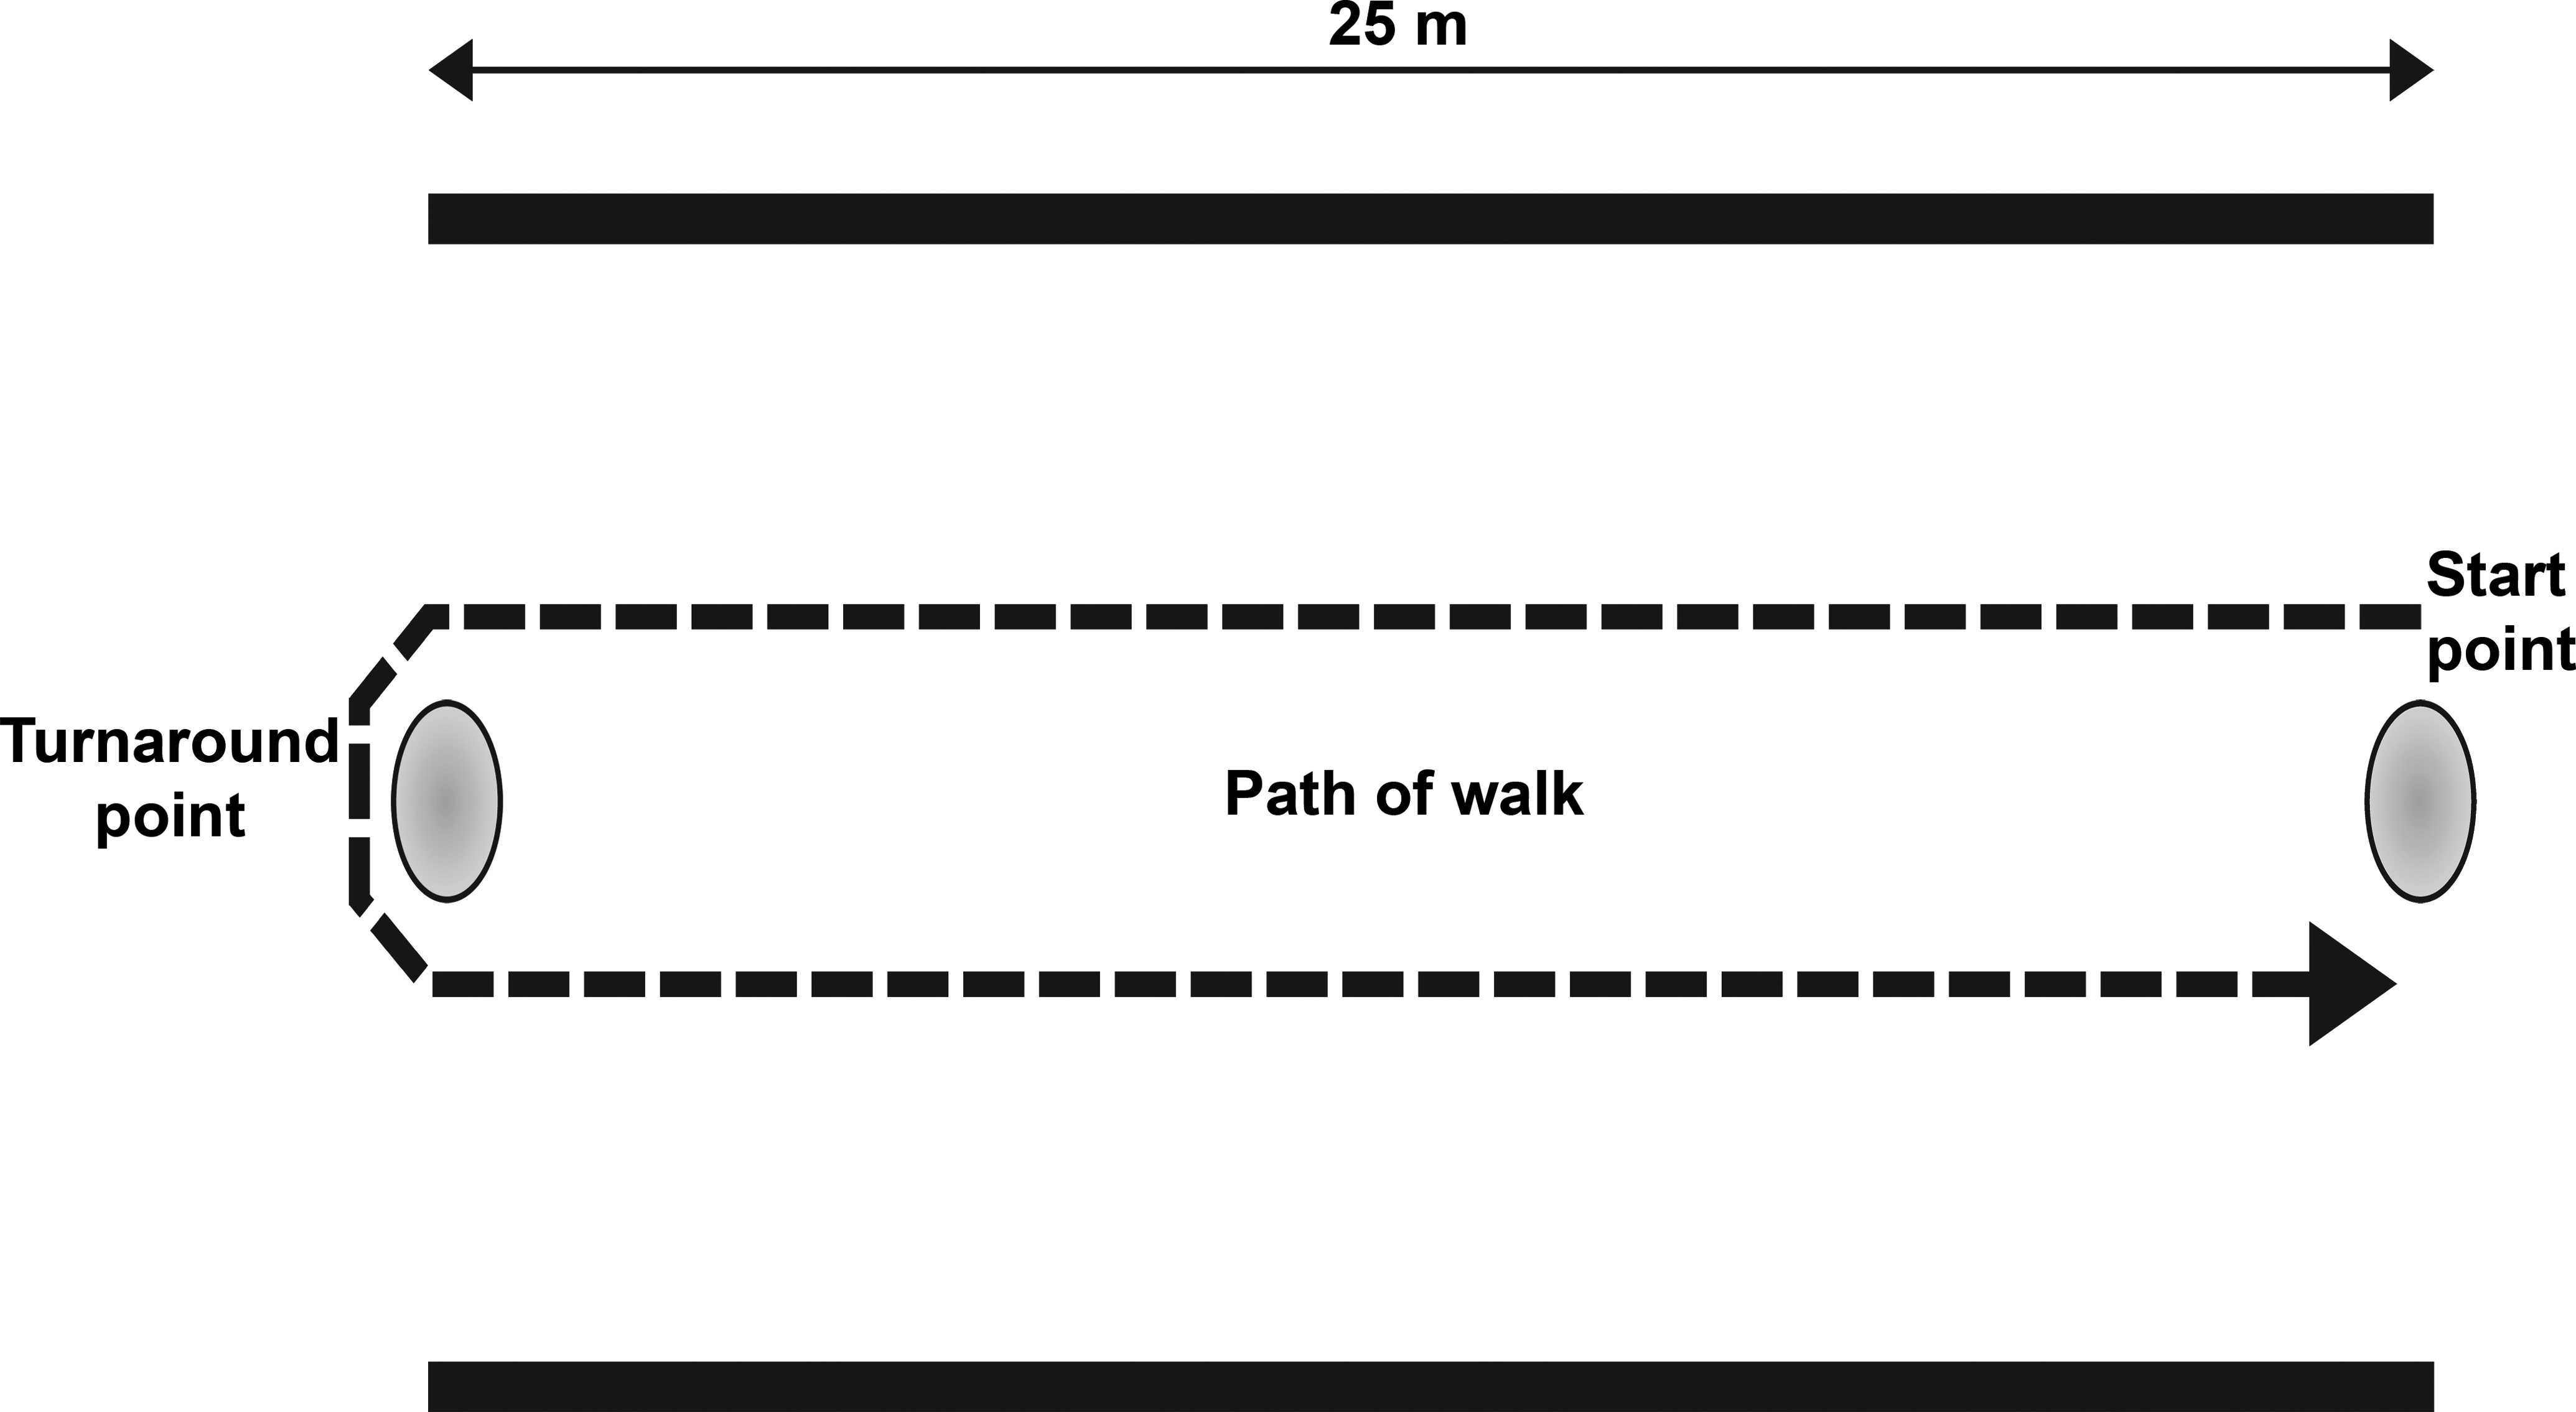
Representative course for the 6-min walk test (6MWT). The image shows the course for the 6MWT. A strip of tape 25 m long is placed in the center of a quiet, well-lit corridor at least 8-feet wide. Cones are positioned at the beginning and end of the course. Distance traveled at each minute and total are measured along with locations of falls.
MRI and MRS are promising surrogate end points for DMD clinical trials (Willcocks et al. 2016). MRI-T2 images allow assessment of muscle damage, inflammation and fat infiltration, and 1H-MRS allows assessment of fat infiltration into muscle (i.e., fat fraction; Willcocks et al. 2016). A study of 109 boys (ages 5.0–12.9 years old) demonstrated an increase in MRI-T2 signal and 1H-MRS fat fraction even in boys with stable or an improved 6-min walk distance, suggesting that these MR biomarkers can detect subclinical disease progression (Willcocks et al. 2016). While this technique requires trained personnel and careful calibration across test sites, it allows inclusion of younger test subjects (Willcocks et al. 2016). Additionally, these techniques allow for serial assessment of multiple muscles without needing multiple invasive muscle biopsies.
Dystrophin expression (protein and transcript) can be measured in excised muscle specimens with a variety of techniques, including Western blot, mass spectrometry, enzyme-linked immunosorbent assay (ELISA), real-time quantitative reverse transcription polymerase chain reaction (RT-qPCR), and IHC/immunofluorescence (IF) with scoring (Anthony et al. 2012, 2014; Brown et al. 2012; Nguyen et al. 1990; Nicholson et al. 1990). Currently, quantifying dystrophin in muscle is the earliest indicator of efficacy; however, accurate assessment of dystrophin expression is challenging because of the low abundance and large size of the protein (Anthony et al. 2012; Merlini and Sabatelli 2015; Taylor et al. 2012). Western blot, mass spectrometry, and ELISA excel at quantifying dystrophin in whole tissue samples, but lack fiber-by-fiber data and some techniques are challenged by limits of quantification (i.e., LLOQ of 3–5% for mass spectrometry is too high for DMD patients; Anthony et al. 2014; Brown et al. 2012). While RT-qPCR does not measure dystrophin levels, this method can be used to measure dystrophin mRNA levels in patients treated with exon-skipping drugs (Anthony et al. 2012). IHC/IF excels at providing fiber-by-fiber data, exclusive assessment of muscle fibers (allowing exclusion of areas of necrosis, fibrofatty infiltrate), assessment of revertant fibers, measurement of expression heterogeneity across the tissue and within individual muscle fibers (completeness of membrane expression), and measurement of variation in staining intensity. Manual methods can provide robust data, but they must be carefully controlled or the quantification of dystrophin is likely to be affected by scoring biases (Aeffner et al. 2017; Arechavala-Gomeza et al. 2010b; Beekman et al. 2014). Despite these challenges, there is strong correlation of the number of positive fibers counted in IF-stained sections and protein quantified by Western blot, suggesting that IF/IHC and Western blot are comparable methods (Nicholson et al. 1993). Finally, care needs to be taken when selecting an antibody-based detection method, as inaccurate dystrophin levels will be reported if the antibody selected binds an epitope lost by a patient’s specific mutation.
Image Analysis in Nonclinical and Clinical Studies
Image analysis methods quantify protein expression in IF or IHC images. Methods range from scoring small, high-power fields (HPF) manually to scoring whole-slide images manually to scoring whole-slide images with image analysis software. While HPFs are easier to score, this method is subject to bias, particularly in image selection. Scoring whole-slide images prevents the sampling bias, but manual evaluation can be time-consuming. Digital image analysis of whole sections is becoming the preferred method (Janghra et al. 2016). In addition to sampling bias, scoring biases can exist with manual scoring of either HPFs or whole-slide images. Unless scorers and scoring conditions are carefully controlled, scorers are prone to drift in threshold and estimating the percentage of membrane with positive staining, both resulting in an increase in number of positive fibers over time. The visual trap in Figure 3 demonstrates how context can impact perceived fiber intensity and why it is necessary to constantly reassess the performance of manual scorers. In this example, the shadow cast by the cylinder obscures the true intensity of the adjacent squares.
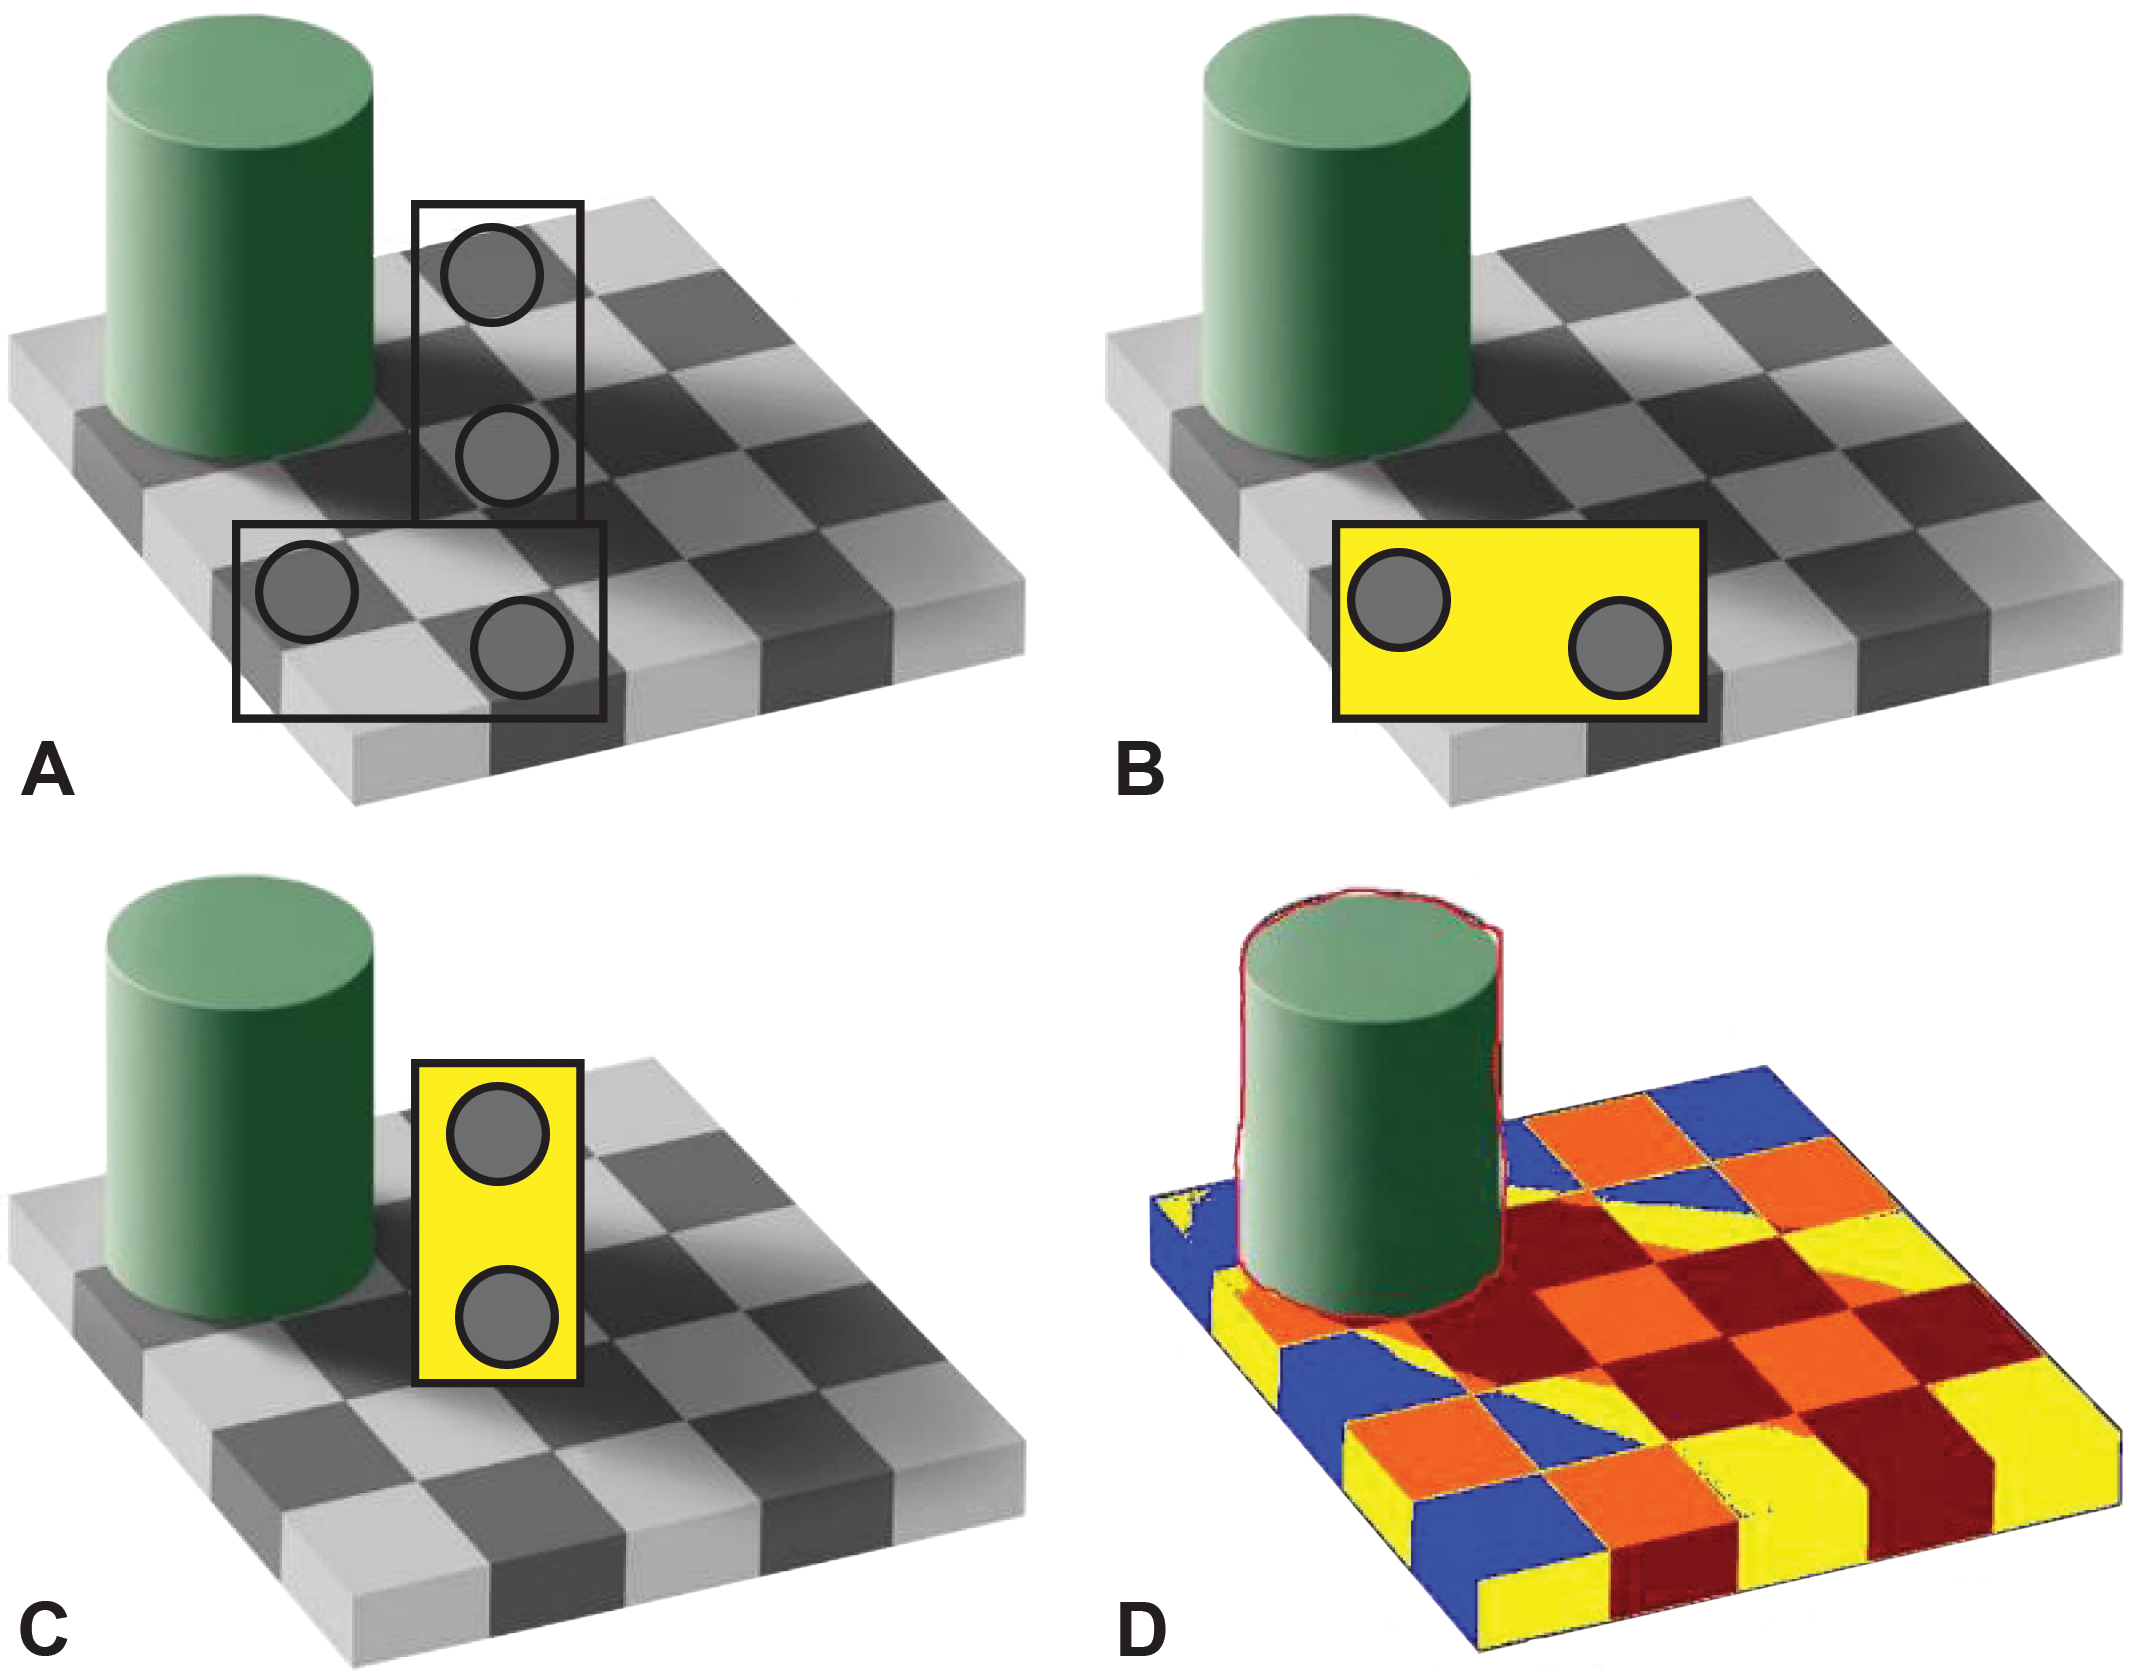
Adelson’s visual trap. In this cognitive trap, 2 pairs of boxes are compared without (A) and with masks (B, C) to demonstrate how the brain is tricked into seeing boxes of equal intensity as different intensity (C). Image D displays an image analysis markup where boxes have been colored by intensity (i.e., all red boxes are the same intensity, etc.). Source: Adapted from Adelson (2001).
Several efforts have been made to objectively measure dystrophin intensity in DMD muscle biopsies. In the first 2 reports, sections were labeled with dystrophin only, circles were placed over select areas of the sarcolemma, and maximum membrane intensity within that circle was calculated (Arechavala-Gomeza et al. 2010a, 2010b). In the third report, sections were dual labeled with dystrophin and spectrin (a cytoskeletal protein lining the inner surface of the plasma membrane), and the average dystrophin intensity from all muscle fibers was calculated (Taylor et al. 2012). In the fourth report, sections were dual labeled with dystrophin and spectrin, and the distribution of dystrophin intensity for each fiber was calculated (Beekman et al. 2014). Together, these methods present pros and cons of measuring dystrophin in IF-stained sections. Among the 4 reports, methods differed in measuring intensity in both positive and negative fibers, measuring mean versus maximum intensity versus distribution of intensity, and measuring intensity in a portion of the membrane versus the entire membrane. While these early attempts provide reproducible data, they lack the sophistication of newer methods.
Considering the positives and negatives of the current solutions, our group has developed a software solution, MuscleMap™ (version 0.1), that assesses dystrophin or utrophin intensity in individual fibers identified by a membrane-associated marker (i.e., laminin-α2 or spectrin) in a duplex immunostaining assay (Figure 4). Images are captured under identical conditions with a scanner qualified for reproducible image capture. MuscleMap identifies all muscle fibers using the membrane-associated marker and then identifies and calculates the amount of dystrophin or utrophin. MuscleMap data outputs include membrane completeness (a measure of the circumference of the membrane with dystrophin or utrophin expression), biomarker intensity (which can be gated by thresholds into positive/negative or 0 to 3+ bins; Figure 5), and a mathematic combination of these 2 values (the 4CC [4 continuous category] score). MuscleMap also calculates morphometric features (such as minimum fiber diameter), assesses levels of intra- and interfiber heterogeneity, and counts the number of revertant fibers. Although first developed to analyze IF-stained images, MuscleMap can now be used to analyze IHC-stained images, as referenced in the future steps below and illustrated in Figure 6 (J. Tinsley et al. 2016). Overall, these image analysis techniques on images captured under controlled conditions help to overcome biases in sample selection as well as manual scoring. These standardized methods can be used to accurately and consistently measure biomarker changes to evaluate drug efficacy.
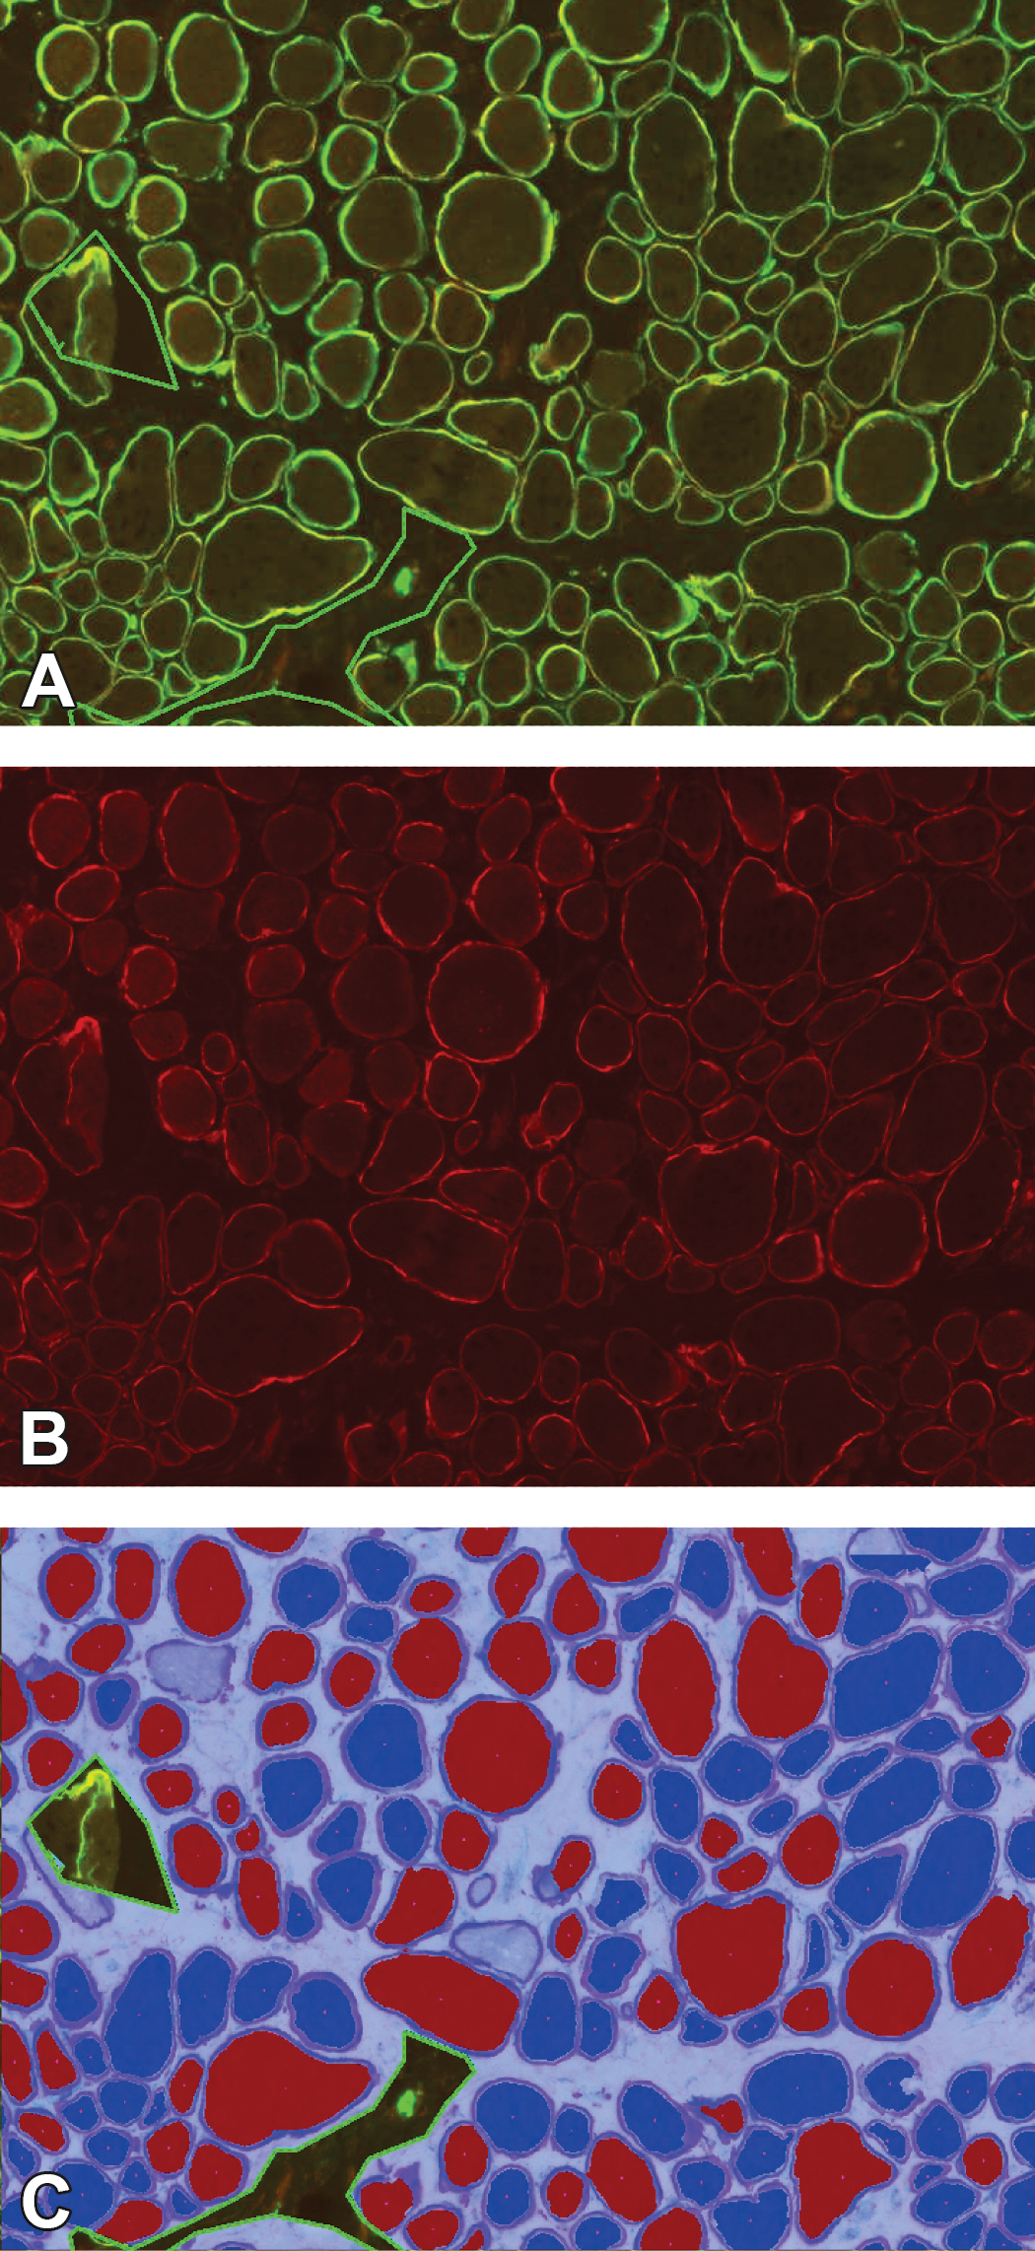
MuscleMap consistently scores protein expression in muscle fibers. The figure shows the dual-labeled assay in A (tetramethylrhodamine [TRITC]–dystrophin, fluorescein isothiocyanate–spectrin), with just the TRITC–dystrophin in image B and the image analysis markup in C showing positive and negative fibers. A fiber is classified as negative (dark blue cytoplasm in C) or positive (red cytoplasm in C) based on achieving a minimum with respect to membrane intensity and percentage of circumference at that threshold. Image C shows three areas of artifact excluded from analysis (indicated by the green line) as well as several fibers not meeting the fiber definition (light blue center) and not included in the analysis.
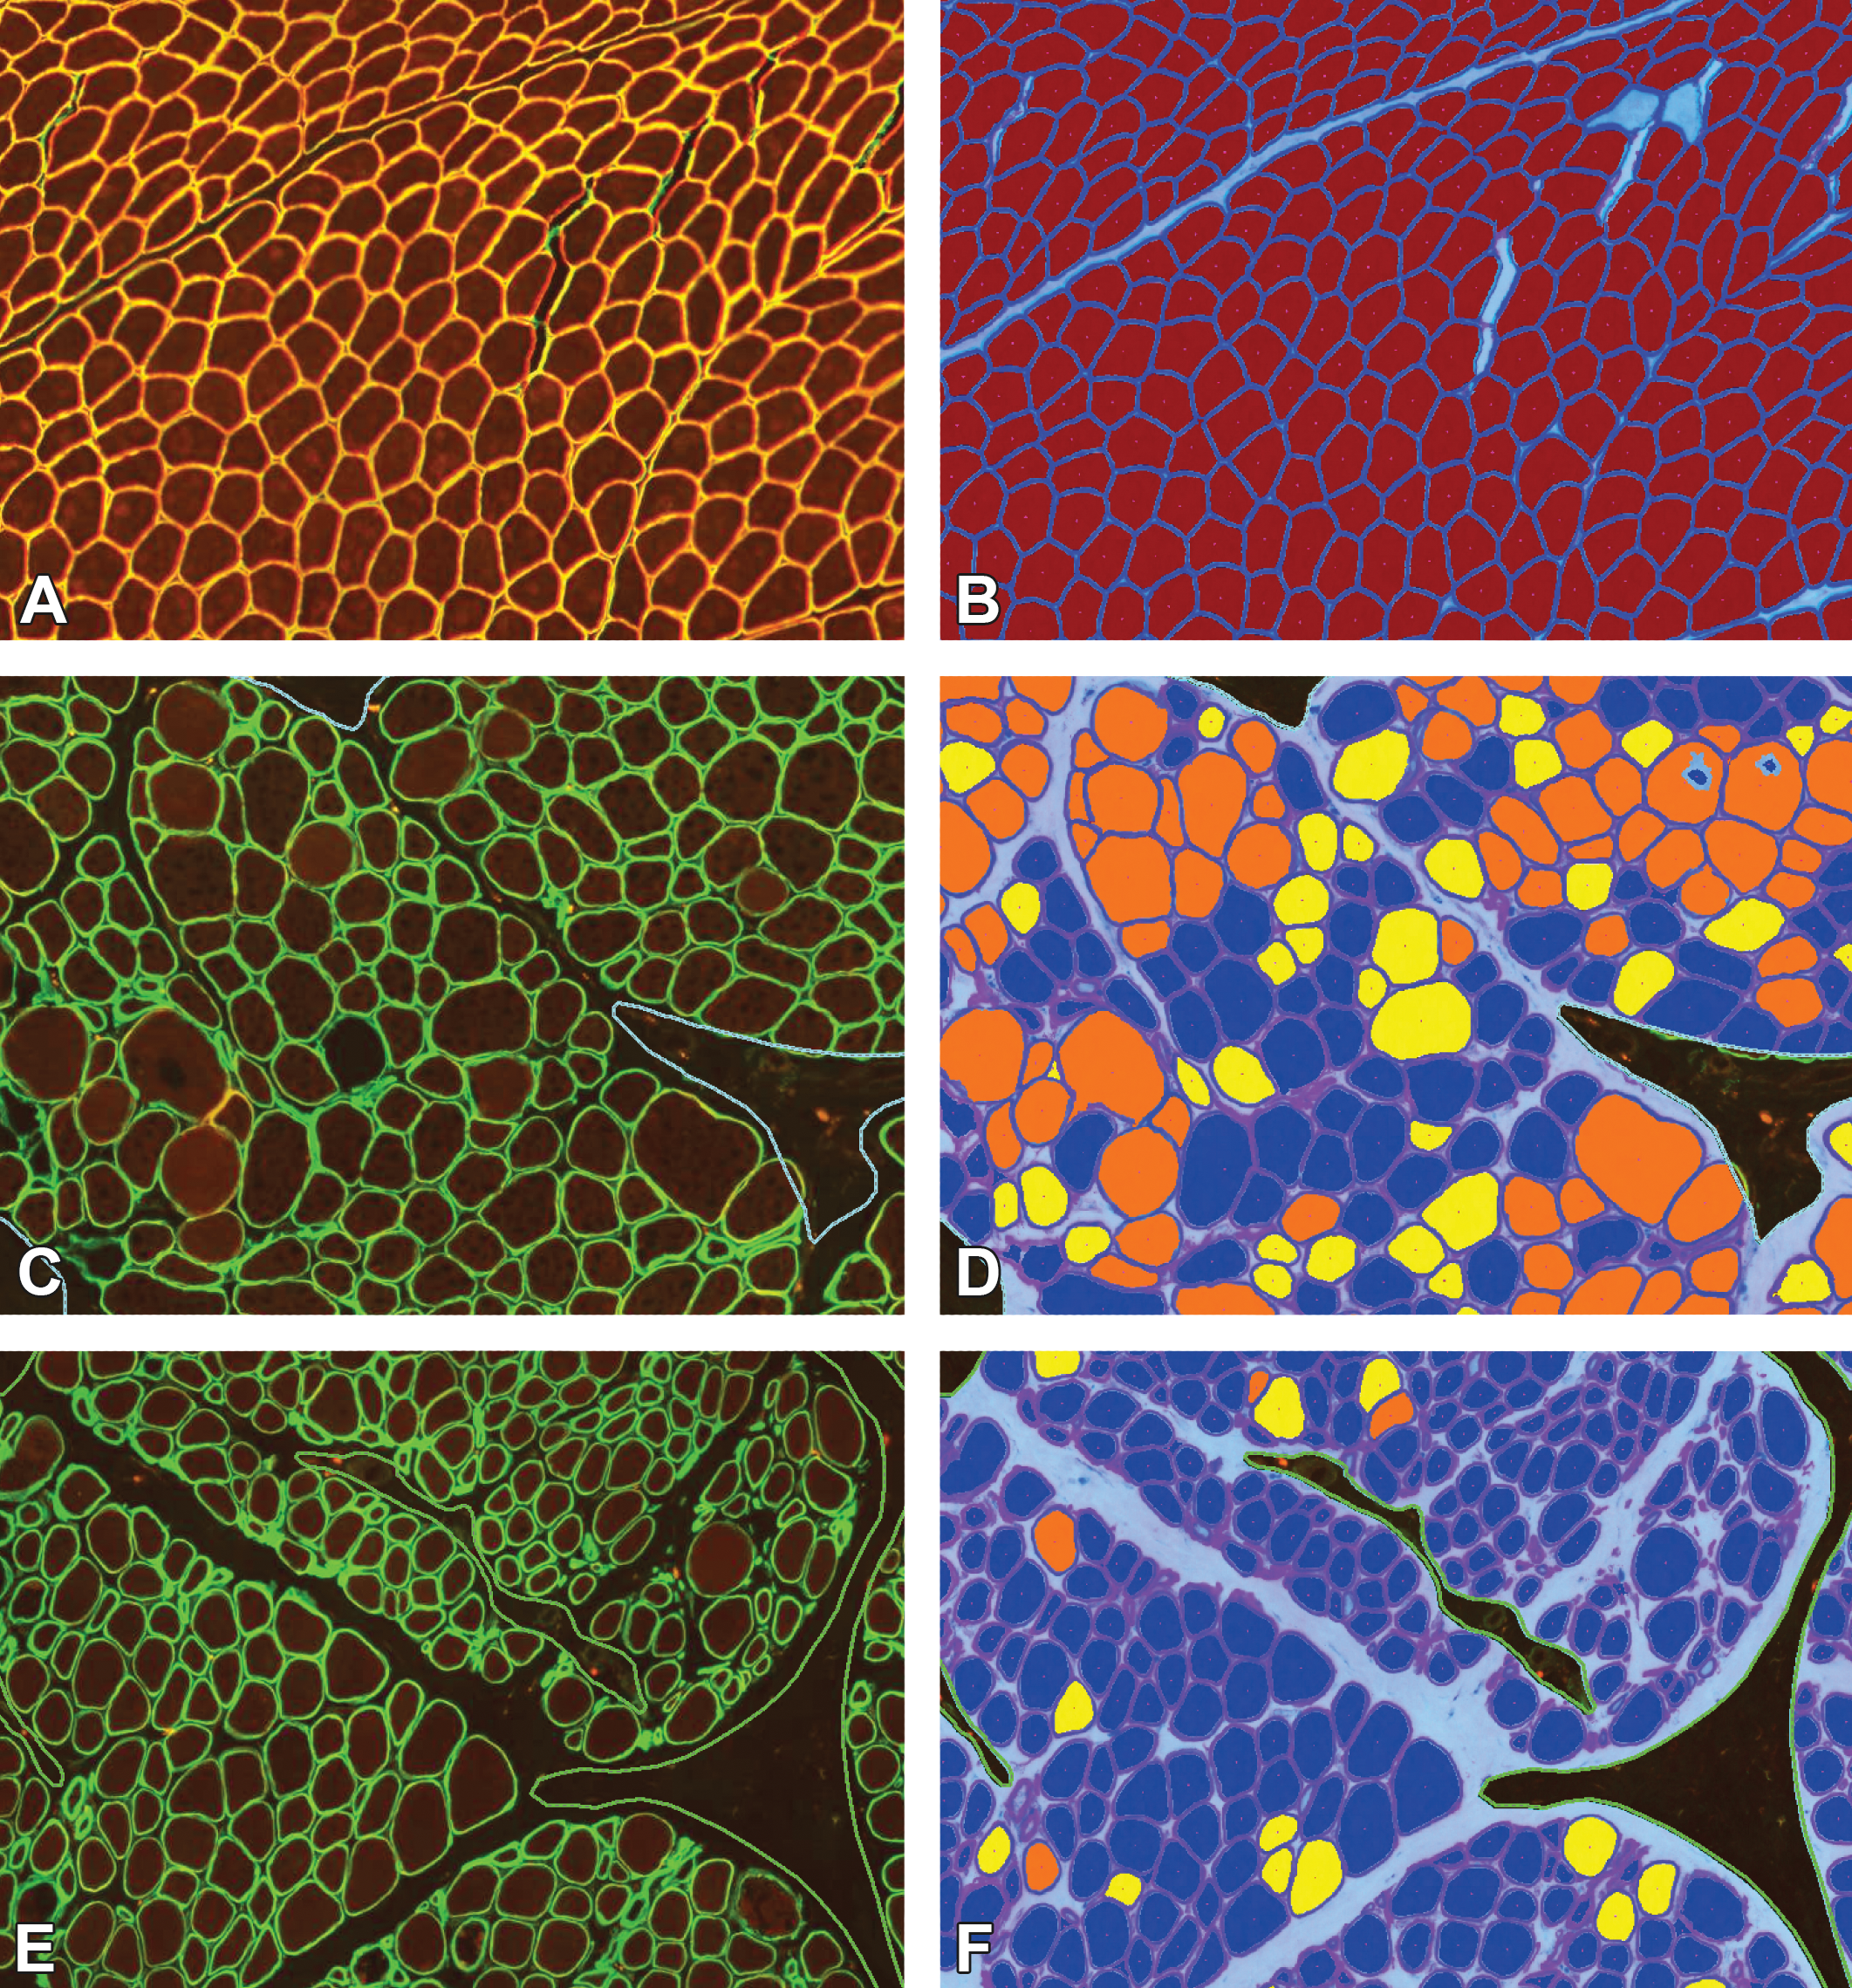
MuscleMap separates muscle fibers by expression intensity. The figure shows the dual-labeled images in panels A, C, and E and the respective image analysis markups in panels B, D, and F. In panels B, D, and F, muscle fibers have been classified by intensity, where dark blue = negative, yellow = low intensity, orange = medium intensity, and red = high intensity. Similar to Figure 4, areas of artifact (dashed green line) and myofibers not meeting the fiber definition (light blue center) were not included in the analysis. Muscle in panels A, C, and E are from a non–Duchenne muscular dystrophy (DMD)/non–Becker muscular dystrophy (BMD) control, BMD patient and DMD patient, respectively.
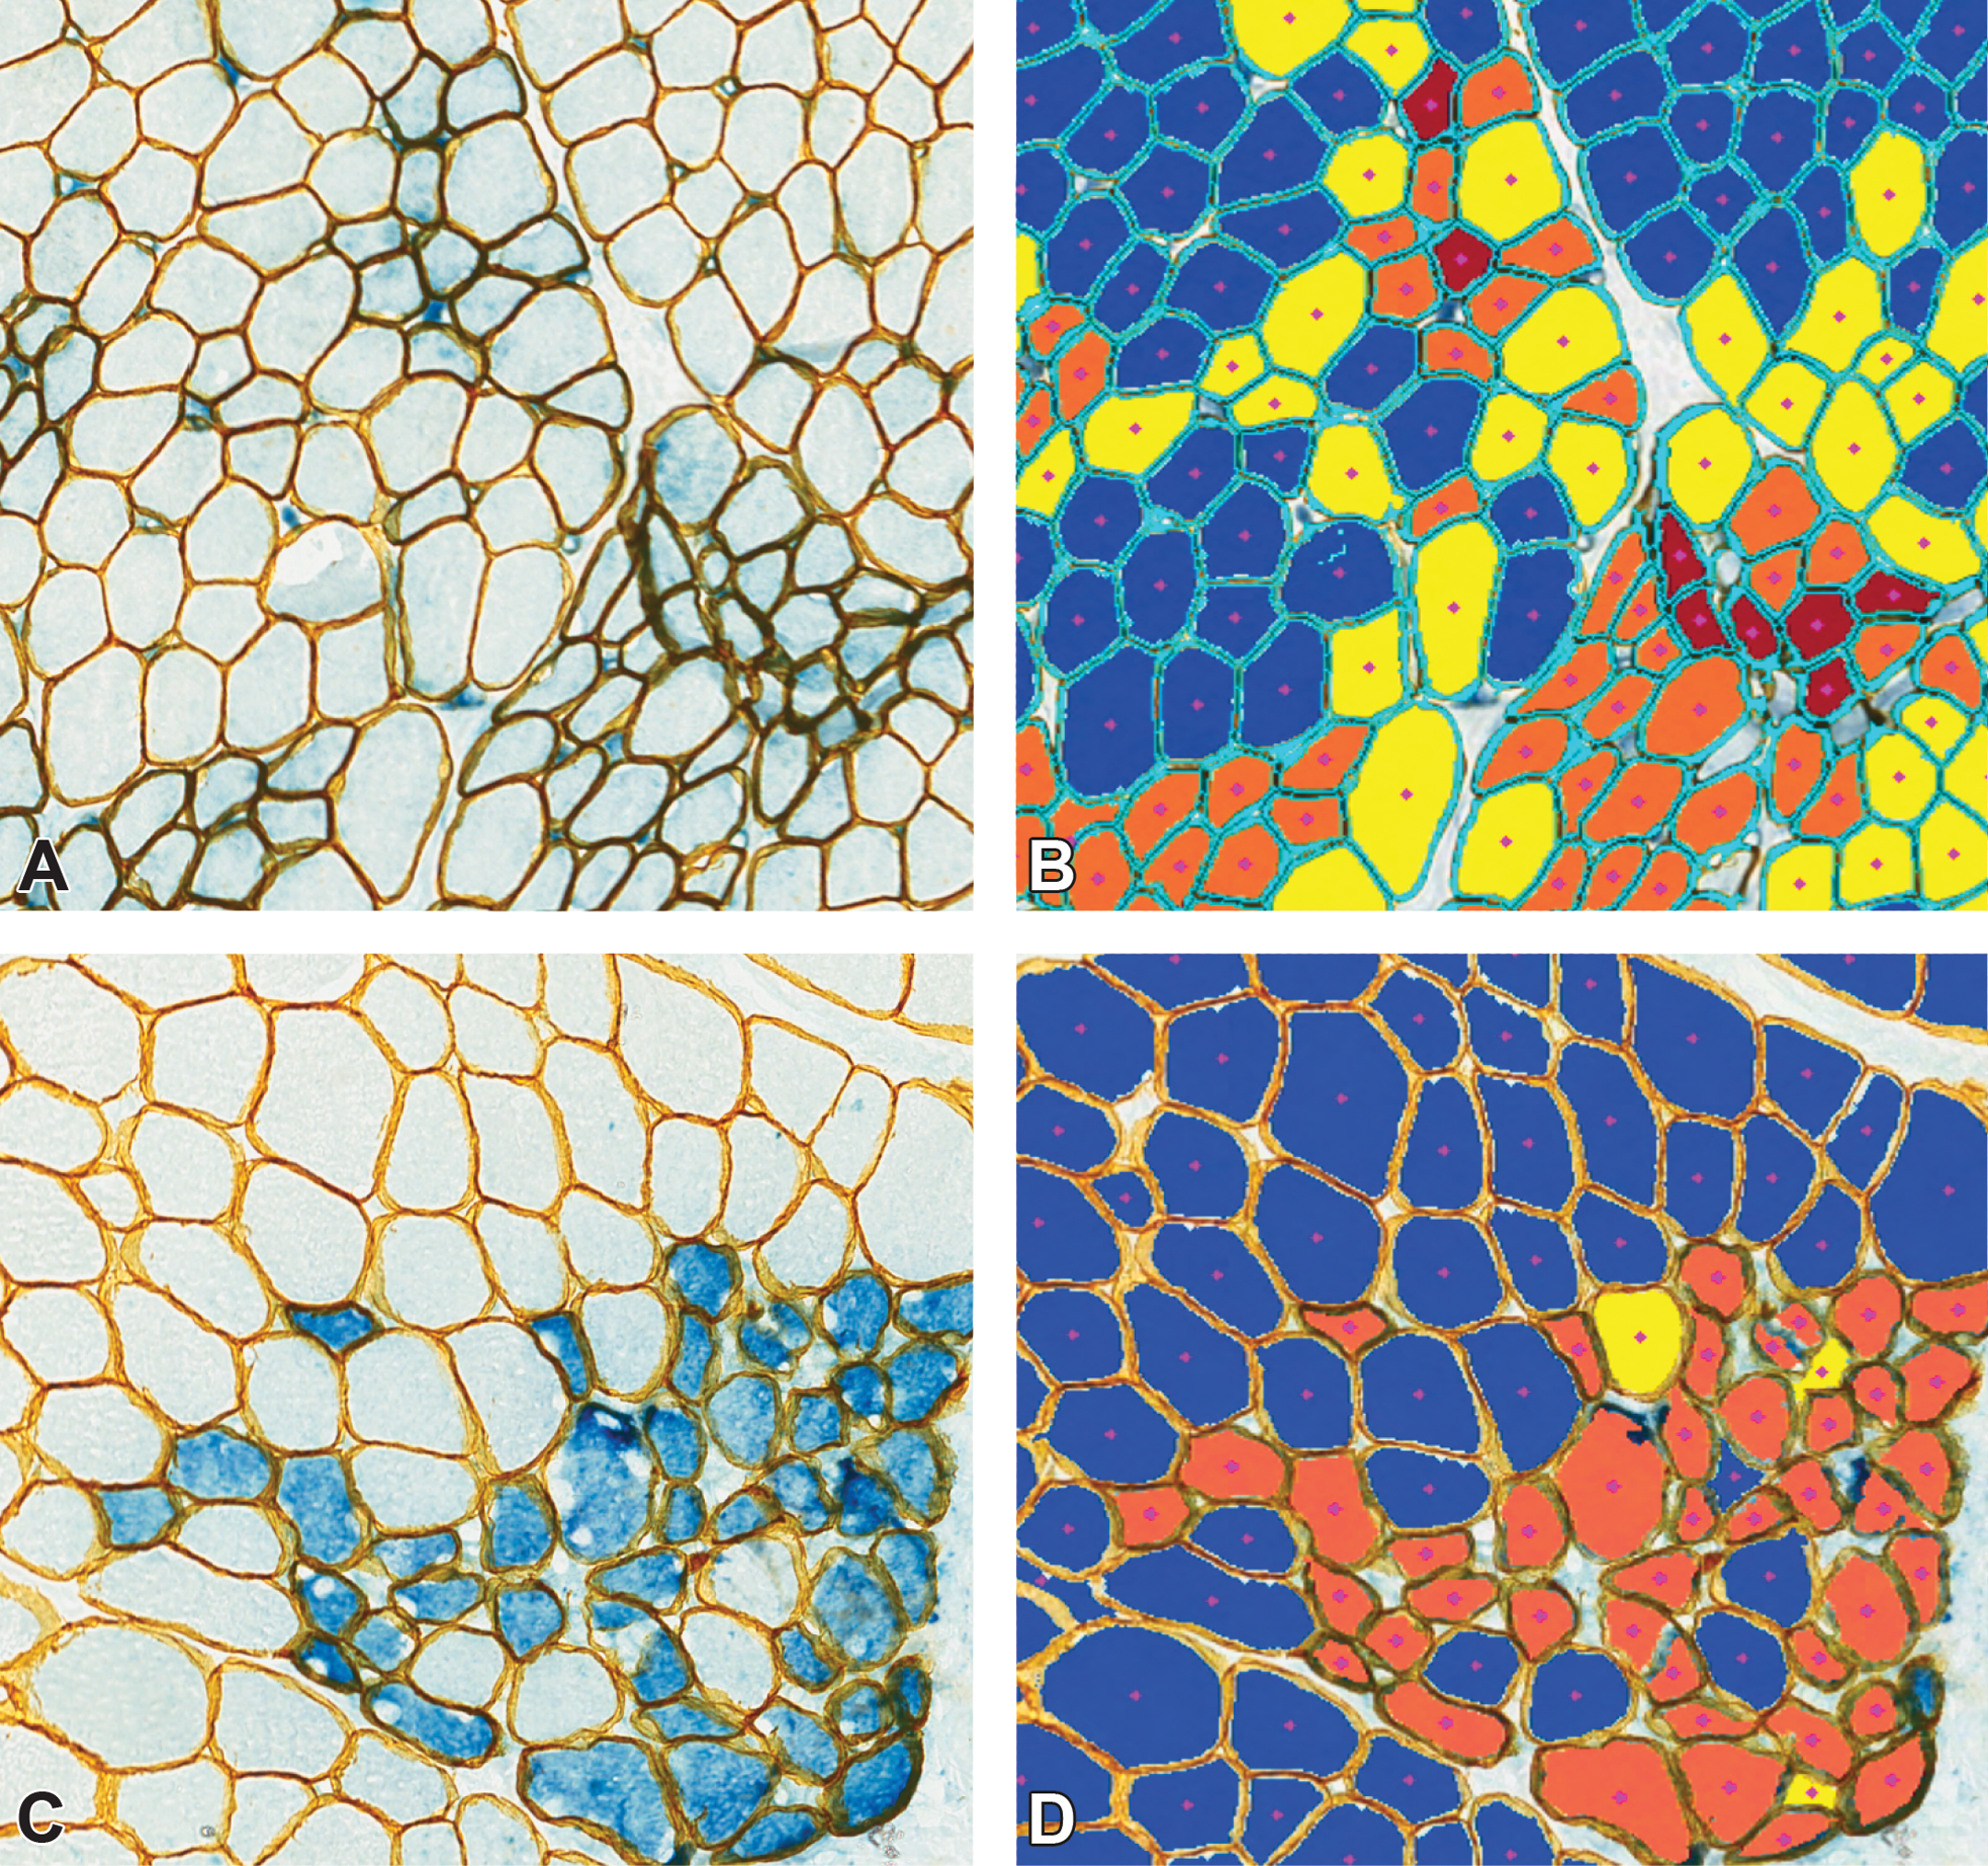
MuscleMap measures pathologist-impossible end points. The figure shows Duchenne muscular dystrophy muscle samples stained with two duplex immunohistochemistry assays: in image A, utrophin is in blue and laminin-α2 is in yellow; and in image C, developmental myosin heavy chain is in blue and laminin-α2 is in yellow. In images B and D, muscle fibers have been classified by intensity, where dark blue = negative, yellow = low intensity, orange = medium intensity, and red = high intensity. Myofibers not meeting the fiber definition (uncolored) were not included in the analysis.
Future Directions
While the number of potential therapies is increasing, <20% of phase II trials are successful (Kornegay 2017). These clinical trials often fail from either safety concerns or lack of efficacy, which results from the inability to accrue sufficient patients to achieve the necessary power (Kornegay 2017). Because of the challenges in recruiting large numbers of patients, classical large clinical trial designs are not practical or even possible. This raises the question: Are we using the best primary end point for these trials? Do we need to refine the methods of the 6MWT/timed functional tests or do we need to choose an alternative? In late 2016, the U.S. Congress passed the 21st-Century Cures Act, which allows companies to seek accelerated approval using surrogate biomarkers that are likely to predict clinical benefit. One proposed alternative is using MR-based tools (i.e., MRI-T2 or 1H-MRS) to measure fat fraction. As part of their assessment of MRI/MRS techniques, Willcocks et al. (2016) simulated patient numbers needed to detect stabilization of disease progression with 80% power. Their simulation suggests that only 13 patients/group would be required with this surrogate end point (Willcocks et al. 2016).
Similarly, tissue collection techniques and muscle-based measurements of dystrophin may benefit from refinement. Currently, open biopsies are used to collect muscle specimens (Kinali et al. 2011). The advantages of open biopsy are direct visualization, a relatively large quantity of muscle obtained, and ease of freezing muscle in the correct orientation for IF/IHC studies. Needle biopsies might provide an alternative method of collection. The smaller incision size might make it more palatable for biopsies to be taken from multiple sites, allowing assessment of heterogeneity of disease. The downside to the small sample size obtained is that it may be insufficient for some of the in vitro techniques used, particularly IF/IHC. Needle biopsy sample size may obscure fiber orientation, which is particularly important for assessing dystrophin or other biomarker expression using IF-/IHC-based assays. Additionally, staining is darker at the edge of samples for some antibodies (“edge effect”), and this edge effect may hinder interpretation in small samples. Imprecise assay performance can result in under- or overestimation of protein levels. Alternatively, transitioning IF assays into IHC assays that utilize more robust visualization components may be beneficial. While fluorescent detection allows for easier multiplexing signal separation, better target colocalization, and higher dynamic range, IF-stained slides have lower sensitivity and are susceptible to photobleaching. By contrast, IHC has greater sensitivity and a longer lasting signal, which may prove beneficial during clinical trials. Our lab has developed IHC methods for measuring utrophin/laminin-α2 and developmental myosin heavy chain (Figure 6A and B, respectively) and image analysis can reliably separate those signals to facilitate accurate quantification of multiplex assays (J. Tinsley et al. 2016).
Footnotes
Acknowledgment
The authors would like to thank the following people for their contributions to this work: Terese Nelson (Histology Laboratory at the University of Iowa), Alexander Moody (Flagship Biosciences, Inc.), Sara K. Whitney (Flagship Biosciences, Inc.), and Rebecca Kim (Flagship Biosciences, Inc.).
Authors’ Contribution
Authors contributed to conception or design (KW, CF); data acquisition, analysis, or interpretation (KW, CF, JP, DR, SM, DK, JC, JT, GY, AM); drafting the manuscript (KW); and critically revising the manuscript (CF, JP, DR, SM, DK, JC, JT, GY, AM). All authors gave final approval and agreed to be accountable for all aspects of work in ensuring that questions relating to the accuracy or integrity of any part of the work are appropriately investigated and resolved.
Declaration of Conflicting Interests
The authors declared the following potential conflicts of interest with respect to the research, authorship, and/or publication of this article: Kristin Wilson, Crystal Faelan, Janet C. Patterson-Kane, Daniel G. Rudmann, G. David Young, and Anthony J. Milici are employed by Flagship Biosciences, Inc. Diane Frank and Jay Charleston are employed by Sarepta Therapeutics, Inc. Jon Tinsley is employed by Summit Therapeutics.
Funding
The author(s) disclosed receipt of the following financial support for the research, authorship, and/or publication of this article: This work was partially supported by the National Institutes of Health grant U54-NS053672, Iowa Wellstone Muscular Dystrophy Cooperative Research Center, and through cTA projects sponsored by Sarepta Therapeutics, Inc., and Summit Therapeutics.