
Abstract
Evaluation of the central nervous system (CNS) in the developing mouse presents unique challenges, given the complexity of ontogenesis, marked structural reorganization over very short distances in 3 dimensions each hour, and numerous developmental events susceptible to genetic and environmental influences. Developmental defects affecting the brain and spinal cord arise frequently both in utero and perinatally as spontaneous events, following teratogen exposure, and as sequelae to induced mutations and thus are a common factor in embryonic and perinatal lethality in many mouse models. Knowledge of normal organ and cellular architecture and differentiation throughout the mouse’s life span is crucial to identify and characterize neurodevelopmental lesions. By providing a well-illustrated overview summarizing major events of normal in utero and perinatal mouse CNS development with examples of common developmental abnormalities, this annotated, color atlas can be used to identify normal structure and histology when phenotyping genetically engineered mice and will enhance efforts to describe and interpret brain and spinal cord malformations as causes of mouse embryonic and perinatal lethal phenotypes. The schematics and images in this atlas illustrate major developmental events during gestation from embryonic day (E)7.5 to E18.5 and after birth from postnatal day (P)1 to P21.
Congenital malformations, deformations, and chromosomal abnormalities were the leading cause of human infant death in the United States in 2013 (Osterman et al. 2015). Each year, approximately 3% of live births (∼12,000 infants) have a detectable birth defect, of which 2% (∼250) are neural tube defects (NTDs; Simeone et al. 2015; Rynn, Cragan, and Correa 2008). From data collected by the U.S. National Birth Defects Prevention Network during 2004 to 2006, the adjusted national prevalence per 10,000 live births for anencephaly was 2.06, for spina bifida without anencephaly was 3.50, and for encephalocele was 0.82, yielding estimated annual numbers of cases nationally for these conditions of 859, 1,460, and 341, respectively (Parker et al. 2010). In most cases, the cause of NTDs is unknown, but both genetic and environmental risk factors have been implicated in NTD induction in humans and many animal species (Greene and Copp 2014; Shepard and Lemire 2010) and thus are widely studied in order to provide preventative strategies for abnormal embryogenesis. Few human genes are known to cause or contribute to NTDs, but multiple environmental risk factors are known to adversely impact central nervous system (CNS) development. The risk of birth defects, including NTDs, has been reduced by intake of folic acid during gestation and improved glycemic control, which minimizes maternal diabetes and hyperglycemia (Crider, Bailey, and Berry 2011; Boulet et al. 2008; Salbaum et al. 2015; Williams et al. 2002).
Mouse models are used increasingly to investigate the developmental basis of human birth defects. In order to identify and characterize lesions in these models, one must have a sound working knowledge of normal organ and cellular architecture for each stage of development, keeping in mind that the timing of key developmental events varies substantially among the various organs of interest. Several resources on embryologic mammalian development are previously referenced in our cardiovascular and hepatobiliary mouse embryological histology atlases (Crawford, Foley, and Elmore 2010; Savolainen, Foley, and Elmore 2009; Swartley et al. 2016), and more specific resources on the developmental neurological system include, among others, the Allen Developing Mouse Brain Atlas (2015), Schambra, Lauder, and Silver’s (1992) histologic atlas of the mouse brain, and Jacobowitz and Abbott’s (1998) mouse chemoarchitectonic atlas that presents the brain using 6 chemical markers, revealing specific neuron locations. Timing of key events in mouse CNS prenatal and postnatal development has been compiled (Bolon and Ward 2015; Workman et al. 2013; DeSesso 2006; Clancy et al. 2013). These resources, while excellent in many respects, have limitations with regard to the depth of image magnification, lack of color images, and limited number of time points and planes of section.
The purpose of this embryological atlas of the murine CNS is to provide easily accessible (online) high-magnification, high-resolution, hematoxylin and eosin (H&E)-stained, scanned whole-slide color images, with histologic descriptions for pathologists and biomedical researchers to use when phenotyping genetically engineered mice (GEM) and for the identification and better understanding of normal developmental processes. The rationale for producing the atlas is to provide a well-annotated resource showing principal anatomic features and their evolution over time in the conventional H&E-stained tissue sections that are used by bench pathologists who evaluate developmental phenotypes in mice. The schematics and images in this atlas illustrate major gestational events from embryonic day (E)7.5 to E18.5 and perinatal events from postnatal day (P)1 to P21, where E0.5 was set as the morning of the day after mating. Key anatomic CNS structures and cell types are highlighted in multiple sectional planes (coronal, sagittal, and transverse). For ease of use, there is an overview of early CNS development, a section on normal developmental events arranged in chronological order, a section on key processes during pre- and postnatal development, after which commonly encountered abnormal CNS developmental phenotypes are illustrated. Tables listing the timing of major milestones in nervous system development (Table 1), the timing of major milestones in pituitary and pineal gland development (Table 2), and the timing of major milestones in sensory system development (Table 3) are provided and include correlations with figures when possible. A list of pertinent abbreviations in the figures and text (Online Supplemental Tables 1 and 2, respectively) and a glossary of common neurological and embryological terms (Online Supplemental Table 3) are also provided.
Timing of Major Milestones in Nervous System Development.
Source: Data adapted from values reviewed in references nos. (DeSesso 2006; Hoar and Monie 1981; Theiler 1972; Schneider and Norton 1979). Reproduced with minor modifications from Bolon and Ward (2015). CA = cornu ammonis.
Note: Values represent the day(s) of development. Numbers without associated letters denote embryonic days (E), while numbers with “PND” denote postnatal days.
aDenotes predicted value based on statistical modeling (Clancy et al. 2007; Clancy et al. 2013).
Timing of Major Milestones in Pituitary and Pineal Gland Development.
Source: Data adapted from values reviewed in references nos. (DeSesso 2006; Hoar and Monie 1981; Theiler 1972; Nishimura and Shiota 1977; Szabo 1989). Reproduced with minor modifications from Bolon and Ward (2015).
Note: Values represent the day(s) of development. Numbers without associated letters denote embryonic days (E), while numbers with “PND” denote postnatal days.
Timing of Major Milestones in Sensory System Development.
Source: Data adapted from values reviewed in references nos. (DeSesso 2006; Hoar and Monie 1981; Theiler 1972; Nishimura and Shiota 1977; Szabo 1989). Reproduced with minor modifications from Bolon and Ward (2015).
Note: Values represent the day(s) of development. Numbers without associated letters denote embryonic days (E), while numbers with “PND” denote postnatal days.
aDenotes predicted value based on statistical modeling (Clancy et al. 2007; Clancy et al. 2013).
All scanned and supplemental images can be viewed online as high-resolution color files at https://niehsimages.epl-inc.com with the username “ToxPathCNS” and the password “embryoCNS.” Select the CNS embryo development folder under projects to access the bright-field slide scans by embryonic or postnatal development day.
Material and Method
Approaches to Phenotypic Analysis of the Developing Nervous System
The analysis of neural phenotypes in developing mice is guided by the initial identification of a structural defect or neurological malfunction. The histological appearance of anatomic lesions in the developing nervous system may provide clues regarding their cause, timing, and the most appropriate techniques that might be used to further characterize their attributes and impact. Major neural defects commonly arise during the organogenesis period of development, which encompasses the initial development of the neural plate and neural tube as well as its massive expansion and substantial region-specific differentiation. Evaluations of early events, such as neural tube formation and closure, are typically done from E7.5 to E9.5, while examination of later events, like region-specific neuronogenesis and neuronal circuitry, is generally performed later in gestation and/or after birth.
Terminology and Embryonic Staging
The “embryo” classification scheme allows for a standardized staging system for human embryos and distinguishing between these stages may occasionally be of critical importance. By this system, an “embryo” is the in utero entity in which all organ primordia are initially forming (in humans, weeks 1–8 following fertilization), while a “fetus” is the in utero organism in which all primordia have formed and undergo extensive expansion and remodeling (in humans, weeks 9–37 following fertilization). Since the mouse has a much shorter gestation period (19–20 days), the designation of “embryo” versus “fetus” is less important in this species, whereas the developmental age postconception is critically important. For this reason, the term “embryo” is used to define all prenatal stages of murine development between fertilization and birth, with the stage of development indicated by the gestational age (with conception, designated as E0, occurring approximately 0.5 days after mating; Kaufman 1999). For comparison, using the human staging convention, the first 2 trimesters of development (embryo) extend from E0 to E14.5 in mice, while the last trimester (fetus) encompasses E15 to approximately P10 in mice. This comparison illustrates that a substantial portion of the “third trimester” in mice actually occurs after birth (Bolon and Rousseaux 2015).
Selection of appropriate control specimens (especially for times before E15) is defined in 1 of the 2 fashions. The preferred means is to identify “stage-matched” controls using key macroscopic features of the developing embryo (i.e., the developmental stage) rather than to choose “age-matched” controls based on the gestational day at which the animal is collected (i.e., the embryonic age). This strategy is essential because the difference in developmental stage between the oldest and youngest embryos in a mouse litter of a given embryonic age varies from 10 to 24 hr (Kaufman 1992; Malle et al. 2004; Rugh 1990; Thiel et al. 1993); exposure to a toxicant may amplify the apparent difference between developmental stage and embryonic age by causing delays in the rate in which treated embryos reach particular developmental milestones (Bolon and Rousseaux 2015). This factor is especially critical if the pathology assessment will include acquisition of quantitative data (e.g., morphometric or stereologic measurements). While an obvious “best practice,” control mice should share the same genetic background as the experimental animals because the “average” developmental stage for 1 mouse strain may vary by as much 0.5 days from that of other mouse strains for the same embryologic time point (Thiel et al. 1993).
Embryo/Tissue Collection
The procedure used to isolate samples of the nervous system depends on the developmental stage during which the assessment is to be conducted. Prior to E10 or so, embryos typically must be removed using a stereomicroscope and jeweler’s forceps to tease apart the tough uterine wall and softer placental tissue. Such fine dissections are done with the embryos submersed in a buffer solution (e.g., phosphate-buffered saline [PBS] or Tyrode’s solution, pH 7.4) to prevent collapse of the fragile embryo, and especially the thin-walled CNS, once it is extracted from the yolk sac. In older embryos (E10.5 to term), a pair of small scissors may be used to open the uterus and placental membranes instead. The use of scissors will permit more rapid specimen collection during gestation. In general, the nervous system should be evaluated in situ for embryos from E7.5 to E15, and it is often convenient to perform such in situ assessments in older embryos (E15 to term) and neonates (P0–P10) as well. However, the larger brain size of older embryos and neonates may permit isolation of this organ in order to protect labile molecules from the damaging effects of tissue fixation. In such instances, removal of unfixed brain is sometimes associated with manipulation-induced changes to neural cell populations (e.g., “dark neuron” artifact in cerebrocortical neurons), so it is critical that these iatrogenic effects are recognized as incidental and not interpreted as a component of the predicted neural phenotype.
Fixation Protocols
The choice of fixation protocol will need to strike a balance between the degree of neuro-architectural preservation and practical considerations such as technical skill required and speed. In general, nervous tissue is preserved best by perfusion fixation, and the protocols for this procedure can be utilized readily in older embryos and neonates (McKerlie, Newbigging, and Wood 2015) and with practice in embryos (Abrunhosa 1972). Common fixatives for perfusion techniques are aldehydes, such as 10% neutral buffered formalin (NBF, which in commercial solutions typically contains methanol as a stabilizer to inhibit the oxidation of formaldehyde to formic acid); 4% paraformaldehyde (PFA 1 ) and, if electron microscopy is of interest, modified Karnovsky’s fixative (2.5% glutaraldehyde with 2% PFA, or similar mixtures). This practice will rapidly infuse the fixative deep into the CNS parenchyma, thereby reducing the number of artifactual changes introduced into the delicate brain and spinal cord tissues. Alternatively, immersion fixation with NBF is a suitable practice in instances where the incompletely developed skin is permeable (i.e., E14 and earlier). Bouin’s solution or modified Davidson’s solution includes components (acids and alcohols) which can penetrate deeply and rapidly through dense skin and thus can be used for older embryos and neonates (Bolon and Ward 2015). An added advantage of Bouin’s and modified Davidson’s solutions when used for embryos of any age is that these agents substantially harden soft tissues, which permit manipulation and tissue trimming of delicate embryonic specimens with less chance of producing handling-related artifacts in the final tissue sections.
Pathology Evaluation
Structural examination of the developing nervous system for potential phenotypes is comparable to the neuropathologic evaluation performed in older animals. If a necropsy is performed, the brain surface should be examined after removal for any abnormalities in shape, size, and/or color; other neural organs typically are left in situ for processing and thus are not available for an external evaluation. The choice of orientation for brain sections will dictate the manner in which it is trimmed. In our experience, preparation of multiple cross sections (i.e., coronal) is preferable for the initial evaluation since bilateral symmetry of paired regions may be assessed most easily in this orientation. A common alternative approach is to prepare mid-sagittal or parasagittal sections, which offer the opportunity to examine the integrity of major white matter tracts and the lobular pattern of the cerebellum. Either approach is acceptable as long as highly homologous sections showing the same internal features are available from developmental stage-matched control animals. Preliminary histopathologic assessment of neural phenotypes using conventional end points is often limited to evaluating the contours and sizes of major structures (i.e., cerebrum, hippocampus, cerebellum, corpus callosum, brainstem, etc.), using H&E or cresyl violet stains and the degree of myelination using Luxol fast blue stain or anti-myelin basic protein (MBP) immunohistochemistry (IHC). Assessments of glial numbers using IHC to detect astrocytes (antiglial fibrillary acidic protein [GFAP]; Online Supplemental Figures 1–3) or microglia (anti-ionized calcium-binding adaptor molecule 1 [Iba-1]; Online Supplemental Figures 4–7) typically are delayed until after birth due to the relatively late onset of glial formation in the developing mouse brain. Application of IHC to detect neurotransmitter expression in various cell populations may be warranted throughout gestation as molecules that function to propagate signals at axon terminals in differentiated neural circuits of adults often act as morphogens (i.e., guides to direct differentiation) during CNS development (Herlenius and Lagercrantz 2001; Lauder 1988). Special techniques to examine the size and/or number of cells (via morphometrics and/or stereology) in major brain regions generally are done to evaluate specific hypotheses (de Groot et al. 2005).
Animals
Timed-pregnant CD-1® IGS/Crl: CD1(ICR) dams (Charles River Laboratories, Raleigh, NC) were used based on their availability, large litter size, and the common use of this outbred stock for developmental toxicity testing in mice. Differences in developmental events do occur among various inbred mouse strains (Thiel et al. 1993), but this outbred stock was appropriate for this project as it follows the normal (i.e., average) course of neurological development during both prenatal and postnatal periods.
Males were housed individually; dams were group-housed 2 to 4 per cage; when breeding mice were housed 2 females/1 male per cage; and once confirmed pregnant, dams were housed 1 per cage. Filter-capped polycarbonate cages on corn cob bedding were used and animals were provided filter-purified tap water and pelleted chow ad libitum. Environmental conditions were maintained at 22°C ± 2°C and 45% ± 10% relative humidity. A constant light cycle (12-hr light, 12-hr dark) was maintained before and after breeding.
All animal procedures used in this study were approved in advance by the U.S. National Institute of Environmental Health Sciences (NIEHS) Institutional Animal Care and Use Committee.
Time Points Evaluated
E7.5 was selected as the earliest time point because the neural plate (i.e., the earliest indication of neural development) is formed at this time. P21 was chosen as the latest time point because neural development continues after birth up to this stage.
Staging, Tissue Handling, IHC, and Scanning
Staging
The morning on which the vaginal plug was found was designated as E0.5 (described in the literature as 0.5 days postconception). Since considerable variation occurs in the timing of ovulation and conception and in the developmental status of individual embryos, even within the same litter, special care was taken to match both the external and internal features of each embryo to the known developmental landmarks (Kaufman 1992). Corresponding Theiler stages (TSs), another staging system widely used for staging mouse embryos (Theiler 1989), can also be utilized. 2
Tissue handling
Embryo collection was carried out on the mornings of the designated days between E7.5 and E18.5. Pregnant mice were euthanized by carbon dioxide (CO2) inhalation according to the NIEHS euthanasia methods for rodent fetuses and neonates. Using a dissecting microscope, individual embryos were isolated from the uterus and extra-embryonic membranes and immersed in ice-cold 0.1 M PBS (1× PBS). Embryos then were fixed by immersion at room temperature (RT) in Bouin’s solution (Poly Scientific, Bay Shore, NY). Fixation time was dependent upon gestational age: E7.5 to E11.5—2 hr, E12.5 to E16.5—4 hr, and E17.5 to E18.5—48 hr. Following fixation, embryos were washed multiple times in 70% ethanol saturated with lithium carbonate. 3 Embryos younger than E13.5 were embedded in 1% agar prior to tissue processing, thereby ensuring orientation in the correct plane while minimizing handling during paraffin embedding. For each time point, embryos were embedded on their backs, sides, or heads for sectioning in the respective coronal (frontal), sagittal (longitudinal), or transverse (horizontal) planes. While this CNS atlas is focused on embryonic neurodevelopment, brains from postnatal mice were evaluated at selected time points. For this purpose, developing mice at P2 and P4 were euthanized by placing on wet ice for 30 min, whereas P10, P16, and P21 mice were euthanized by CO2. Brains were removed and fixed intact by immersion for 48 hr at RT in 4% PFA. At least 1 animal was embedded in the coronal, sagittal, or transverse plane for each postnatal time point. For both embryonic and postnatal time points, samples were sectioned at 6 μm. Sections were placed on charged slides (A. Daigger & Company, Vernon Hills, IL). Every fifth slide was routinely stained with H&E for histopathologic review and slide scanning.
IHC
All IHC procedures were performed using polymer-based techniques. Tissue sections were deparaffinized in xylene and rehydrated through a graded series of ethanol to 1× PBS. Endogenous peroxidase activity was blocked with 3% H2O2. Following a rinse in 1× PBS, heat-induced epitope retrieval was conducted by high heat and pressure in a Decloaker™ (Biocare Medical, Concord, CA) for 5 min. Slides were then depressurized for 10 min, cooled for 10 min, and rinsed twice in distilled water. After blocking (Biocare Mouse Detective™, Biocare Medical) for 30 min at RT, the respective primary antibody was applied to the tissue section. All primary antibody incubations were 1 hr at RT. Online Supplemental Table 4 identifies the primary antibodies, their respective dilutions, and their sources. A universal negative control for polymer IHC (Biocare Medical) was used on a serial section for each antibody. The primary antibody was linked and labeled with a pre-dilute horseradish peroxidase polymer for mouse (Biocare Medical). Sections were incubated with the Biocare Medical Betazoid Diaminobenzidine Chromogen™ for 6 min at RT to visualize the polymer antibody complex. Sections were counterstained with Harris hematoxylin (Harelco, Gibbstown, NJ) for 45 s, placed in 1× PBS to blue, rehydrated through a series of graded alcohols, and coverslipped with Permount (Surgipath, Richmond, IL).
Scanning
Bright-field scanning was completed on all stained slides with a ScanScope XT™ instrument (Leica, Vista, CA). Regions of interest were digitally captured using ImageScope™ software (v12.3.0.5056, Leica). If an image required rotation, the selected region of interest was captured using the extraction feature in ImageScope. White balance correction and image resizing were completed using Adobe Photoshop (Adobe Photoshop™ Creative Cloud, 2014.0.0, San Jose, CA). Image resolution was set at 300 dpi to fit the publisher’s requirements for image resolution.
Overview of Early CNS Development (E7.0–E10.5)
“Neurulation” refers to the coordinated morphogenetic stages during chordate embryogenesis that give rise to the neural tube, which through continued growth and differentiation ultimately develops into the brain and spinal cord. During neurulation, the neural plate (established about E7.0; Table 1) folds upon itself to form the neural tube. Different regions of the neural tube form by 2 different processes: primary and secondary neurulation. In primary neurulation, the flat neural plate proliferates and invaginates, creasing inward until the elevating edges come in contact and fuse to form a cylindrical, hollow neural tube. Secondary neurulation occurs in the caudal section where the solid cord of cells sinks into the embryo and cavitates to form a separate hollow tube in the tail bud. The tubes formed by primary and secondary neurulation eventually connect. Detailed accounts of the cellular and molecular events underlying vertebrate neurulation are available to the interested reader (Copp and Greene 2013; Rubenstein et al. 1998; Zohn 2012; Zohn and Sarkar 2008). Massarwa and Niswander (2013) have developed a live imaging system for visualizing the development of a variety of embryonic tissues in the midgestation mouse embryo, demonstrating the dynamics of neural tube closure during mouse embryogenesis, and movements of the cranial neural tissue that are independent of neural fold zipping. Tools such as these can help to provide a solid understanding of basic neurodevelopmental events for investigators engaged in mouse neurobiology research, particularly by individuals seeking to interpret static images in a developmental neuroanatomy atlas with respect to the dynamic shifts taking place in the specimens they are seeking to analyze. Key structures of neurogenesis are summarized in Figure 1.
Key stages and structures of neural tissue histogenesis. This flow diagram illustrates stages at which select brain structures are derived in forming the developing central nervous system.
Briefly, the neural plate develops as a thickened region of embryonic ectoderm overlying the notochord and prechordal plate (Rubenstein et al. 1998). Following neural plate formation, the neural groove develops along the midline (Theiler 1989), and the lateral edges of the neural plate elevate to form neural folds that ultimately will meet and undergo fusion at the dorsal midline, giving rise to the closed neural tube. Closure of the neural tube is initiated in the cervical region at the hindbrain–cervical boundary and then proceeds cranially and caudally until the ends are sealed; the rostral (anterior) neuropore closes slightly before the caudal (posterior) neuropore. The cephalic end of the neural tube subsequently dilates to form the 3 primary brain vesicles: prosencephalon (forebrain), mesencephalon (midbrain), and rhombencephalon (hindbrain; Figures 2 and 3A, C, E). Shortly thereafter, the prosencephalon subdivides into the telencephalon (cerebral hemispheres) and diencephalon (consisting chiefly of the thalamus and hypothalamus). The mesencephalon (midbrain) is the most rostral brain domain in which the neural boundaries for organizing brain nuclei (i.e., the alar and basal plates, the sulcus limitans) remain distinct. The rhombencephalon subdivides into the metencephalon (cerebellum and pons) and the myelencephalon (medulla oblongata). The postcephalic region of the neural tube remains a hollow cylinder and develops into the spinal cord (Figures 2 and 3B, D F). The spinal cord is also organized using the alar and basal plates. Extensions from the brain (cranial nerves [CNs]) and spinal cord (peripheral nerves) reach the periphery, often after passing through 1 or 2 ganglia. Structural relationships among brain and spinal cord domains in space and over time may be explored in more detail using developmental neuroanatomy atlases (eHistology Atlas [emouseatlas.org, retrieved February 2017]; Graham et al. 2015; Jacobowitz and Abbot 1998; Kaufman 1992; Paxinos et al. 2007; Schambra 2008; Theiler 1989).
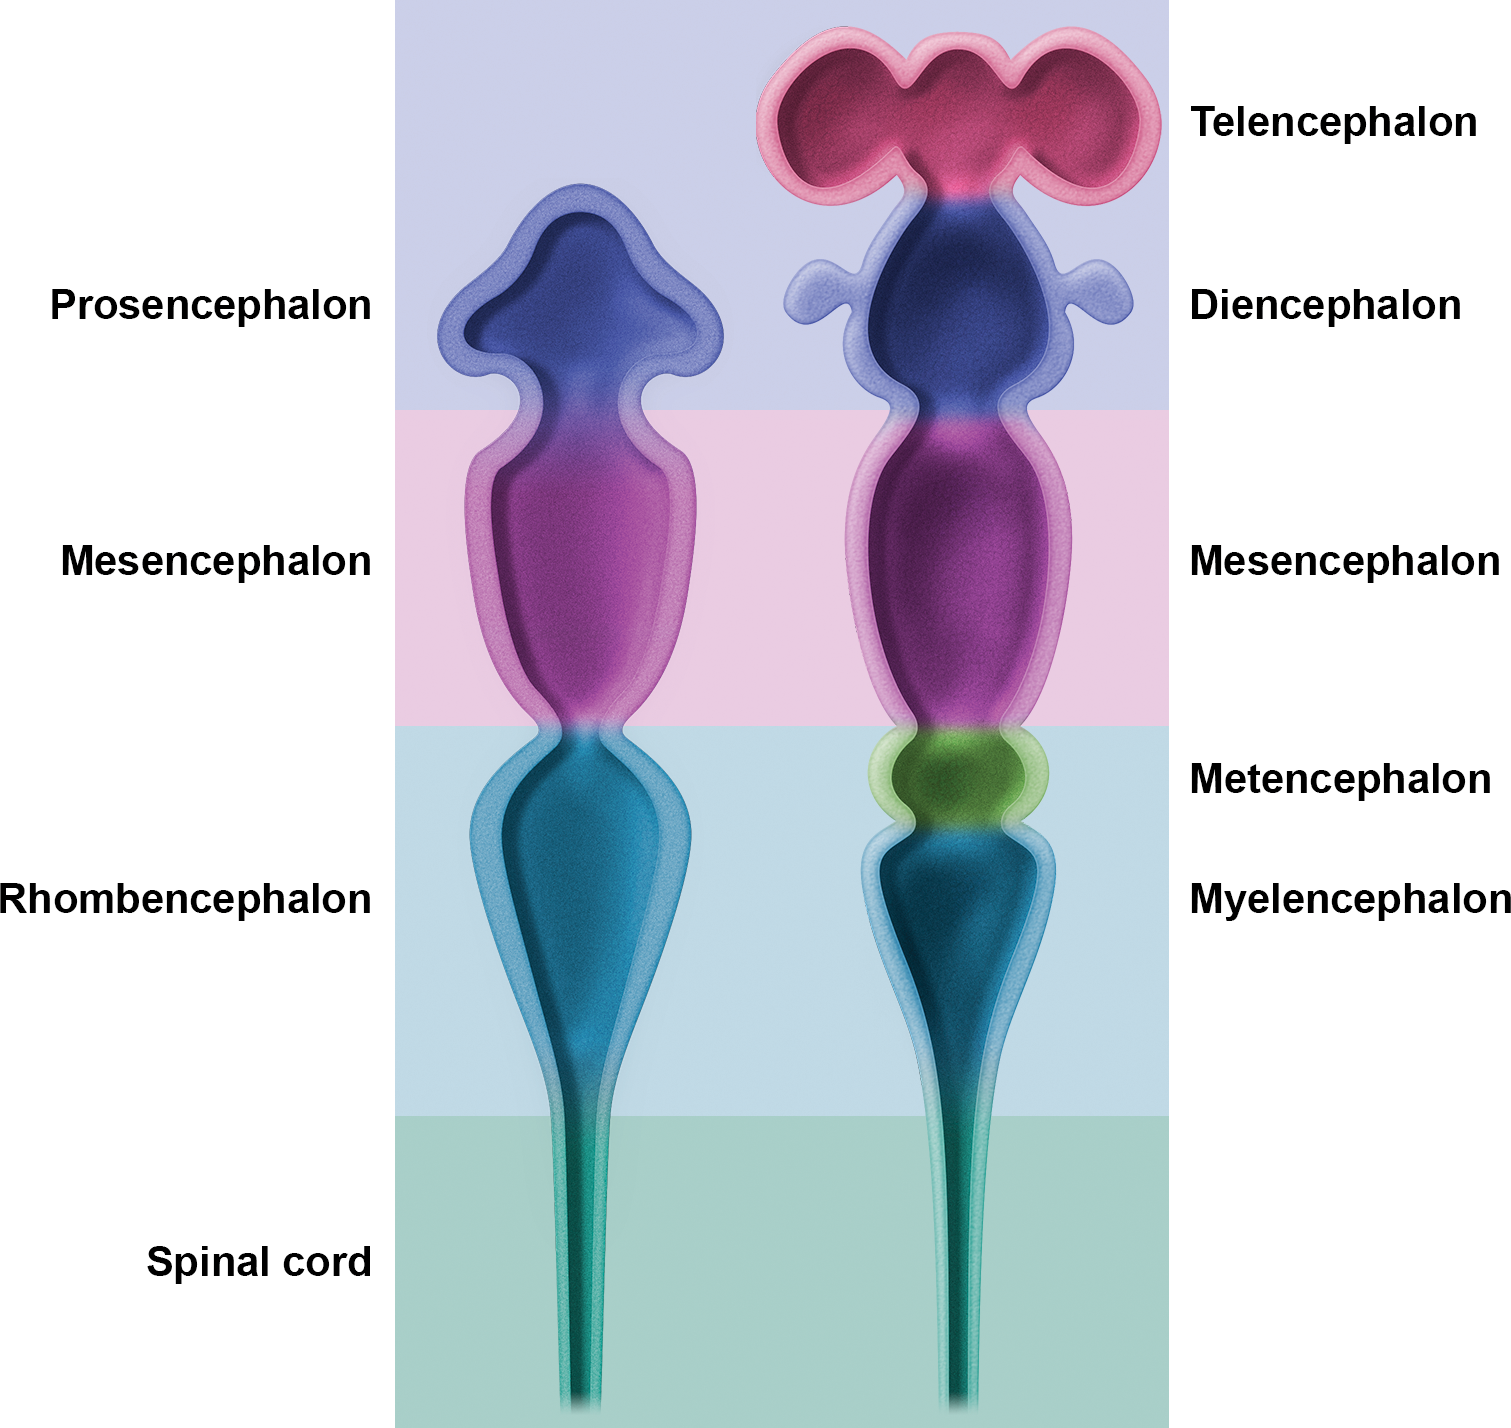
Main subdivisions of the embryonic mouse central nervous system. The early embryonic brain (left image) is composed of 3 swellings at the cephalic end of the neural tube that develop into 3 primary brain vesicles: prosencephalon (forebrain), mesencephalon (midbrain), and rhombencephalon (hindbrain). Soon after (right image), the 3 vesicles shift their contours to assume a 5-vesicle conformation. The prosencephalon divides into the telencephalon (paired cerebral hemispheres) and the diencephalon (thalamus and hypothalamus). The mesencephalon does not subdivide. The rhombencephalon partitions into the metencephalon (cerebellum and pons) and the myelencephalon (medulla oblongata). The caudal end of the neural tube develops into the spinal cord.
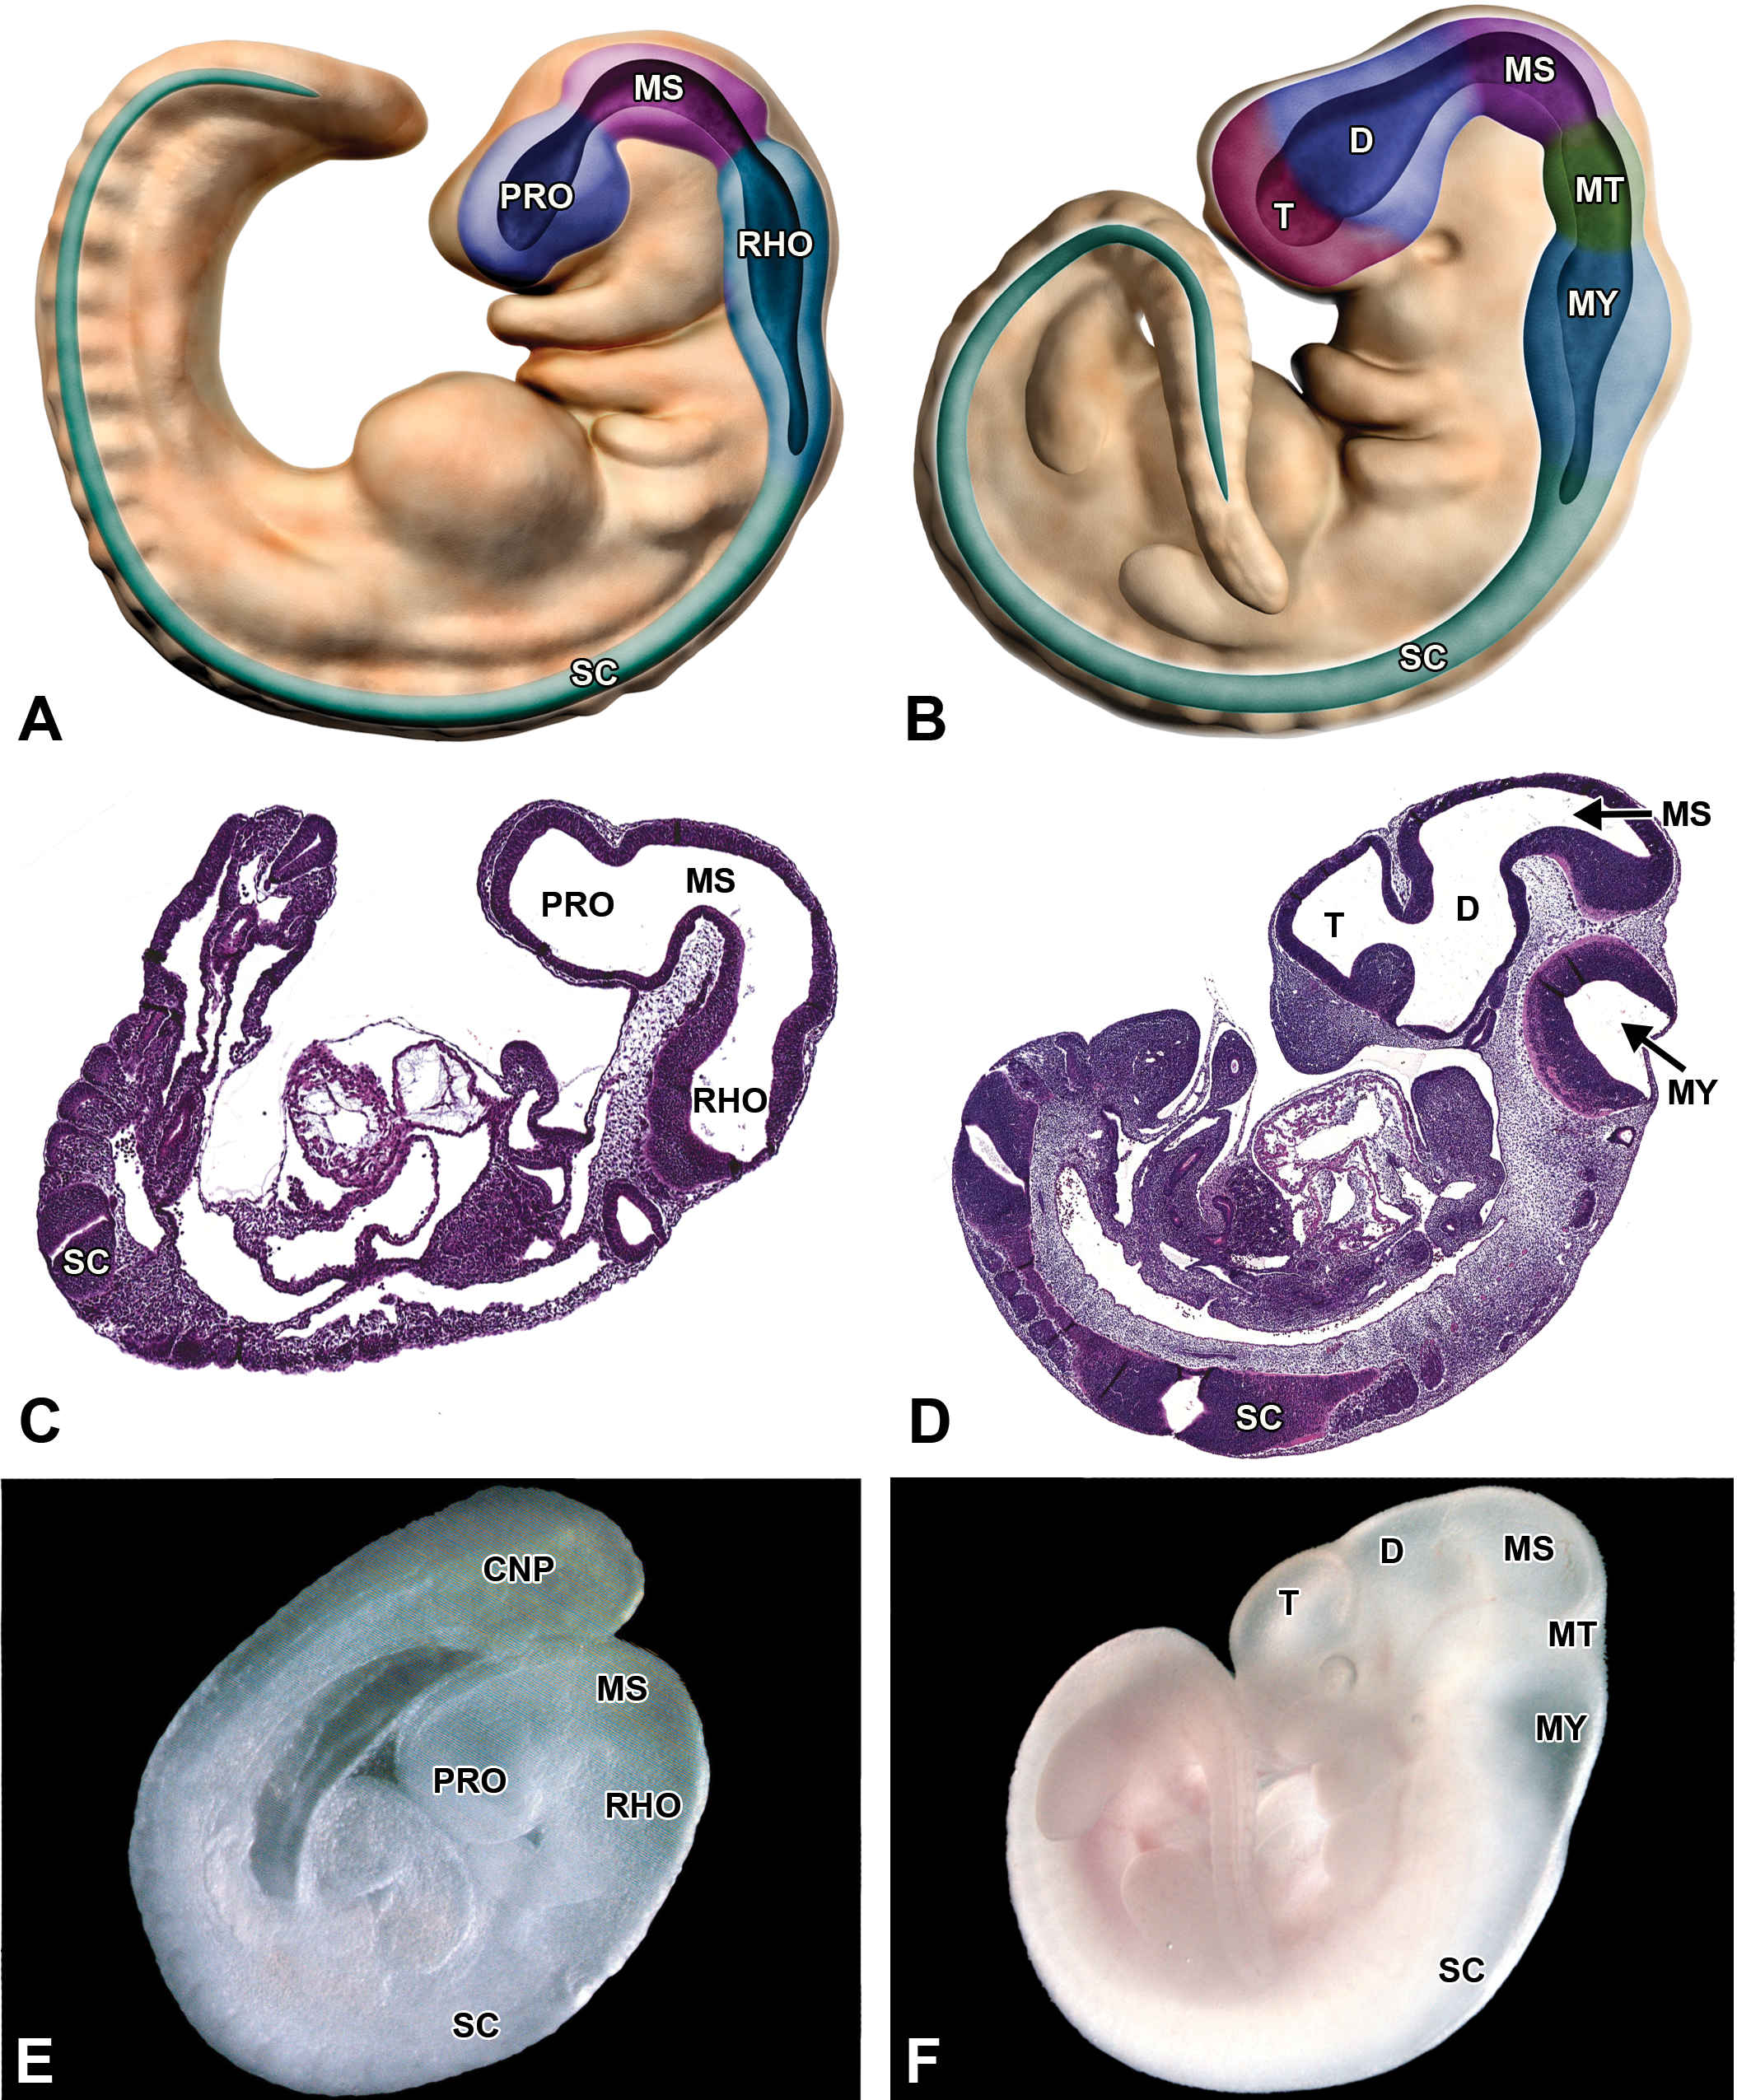
Embryonic transformation of the mouse brain from a 3- to a 5-vesicle structure. (A, C, and E) Structure of the 3-vesicle brain as shown in diagrammatic representation, hematoxylin and eosin (H&E)-stained sagittal section and gross image showing the prosencephalon (PRO), mesencephalon (MS), rhombencephalon (RHO), and spinal cord (SC) in a E9.0 mouse embryo. (B, D, and F) Structure of the 5-vesicle brain as shown in diagrammatic representation, H&E-stained sagittal section and gross image of an E11.5 mouse embryo. At this later developmental stage, the PRO expands into the telencephalon (T) and the diencephalon (D), the MS remains unchanged, and the RHO becomes the metencephalon (MT) and myelencephalon (MY). The SC is evident in the histologic section as 2 oblique profiles rather than a longitudinal column because the curled axis of the developing mouse embryo imparts a twist on the caudal part of the organ. CNP = caudal neuropore.
Key Developmental Events Arranged by Embryonic Day
As with the development of other embryonic organs, neurulation may be divided into a series of sequential stages in which the outcome of later phases depends on successful completion of earlier events (Tables 1–3). Commonly, the stages of neurulation are distinguished by the revolving appearance and disappearance of distinctive anatomic landmarks during narrow windows of time. There are 2 conventions for designating these stages: the embryonic day (E), where the presence of a vaginal plug in the dam is defined as E0.5 (Bolon and Rousseaux 2015; Kaufman 1992), and the TS, based on functional and structural changes in the embryo (Theiler 1989). For this atlas, embryonic day was used to define the embryonic stage. This choice was made for the practical reason that “staged” specimens were not needed as no comparison was being made between control and toxicant-treated embryos in producing this atlas of normal neurohistological development.
Neural Tube Development (E7.5–E10.0)
E7.5 (TS11, Presomite Stage)
The primitive node is an indentation located on the ventral aspect of the cranial end of the primitive streak and is the site at which the primitive body plan is organized along the embryonic cranial–caudal axis (also referred to as the anterior–posterior axis; Kaufman 1992). It consists of mesoderm cells that give rise to the notochord. The primitive node is analogous to Hensen’s node in the chick and the shield in Xenopus (Rossant and Tam 2002). At approximately E7.5, signals released from the primitive node induce the overlying embryonic ectoderm to thicken and form the neural plate (reviewed in Colas and Schoenwolf 2001). As the neural plate expands apicobasally, it also morphs through directed cellular migration, a process referred to as “convergent extension” (Keller, Shih, and Sater 1992), into a structure that is narrow mediolaterally and elongated cranio-caudally. The cranial and lateral edges of the neural plate are clearly defined by raised borders, but caudally the neural plate merges into the primitive streak (Kaufman 1992). Toward the end of this stage, the lateral edges of the neural plate begin to elevate, while a shallow neural groove forms in the midline of the embryonic axis (Kaufman and Bard 1999). This elevation takes place all along the central axis, but the prominence of the tube walls at the cephalic end of the plate results in the production of enlarged head folds as the first structural landmark of “cephalization” (i.e., expansion of the embryonic head due to centralization of neural and sensory anatomic and functional centers in this region; Figure 4A, B).
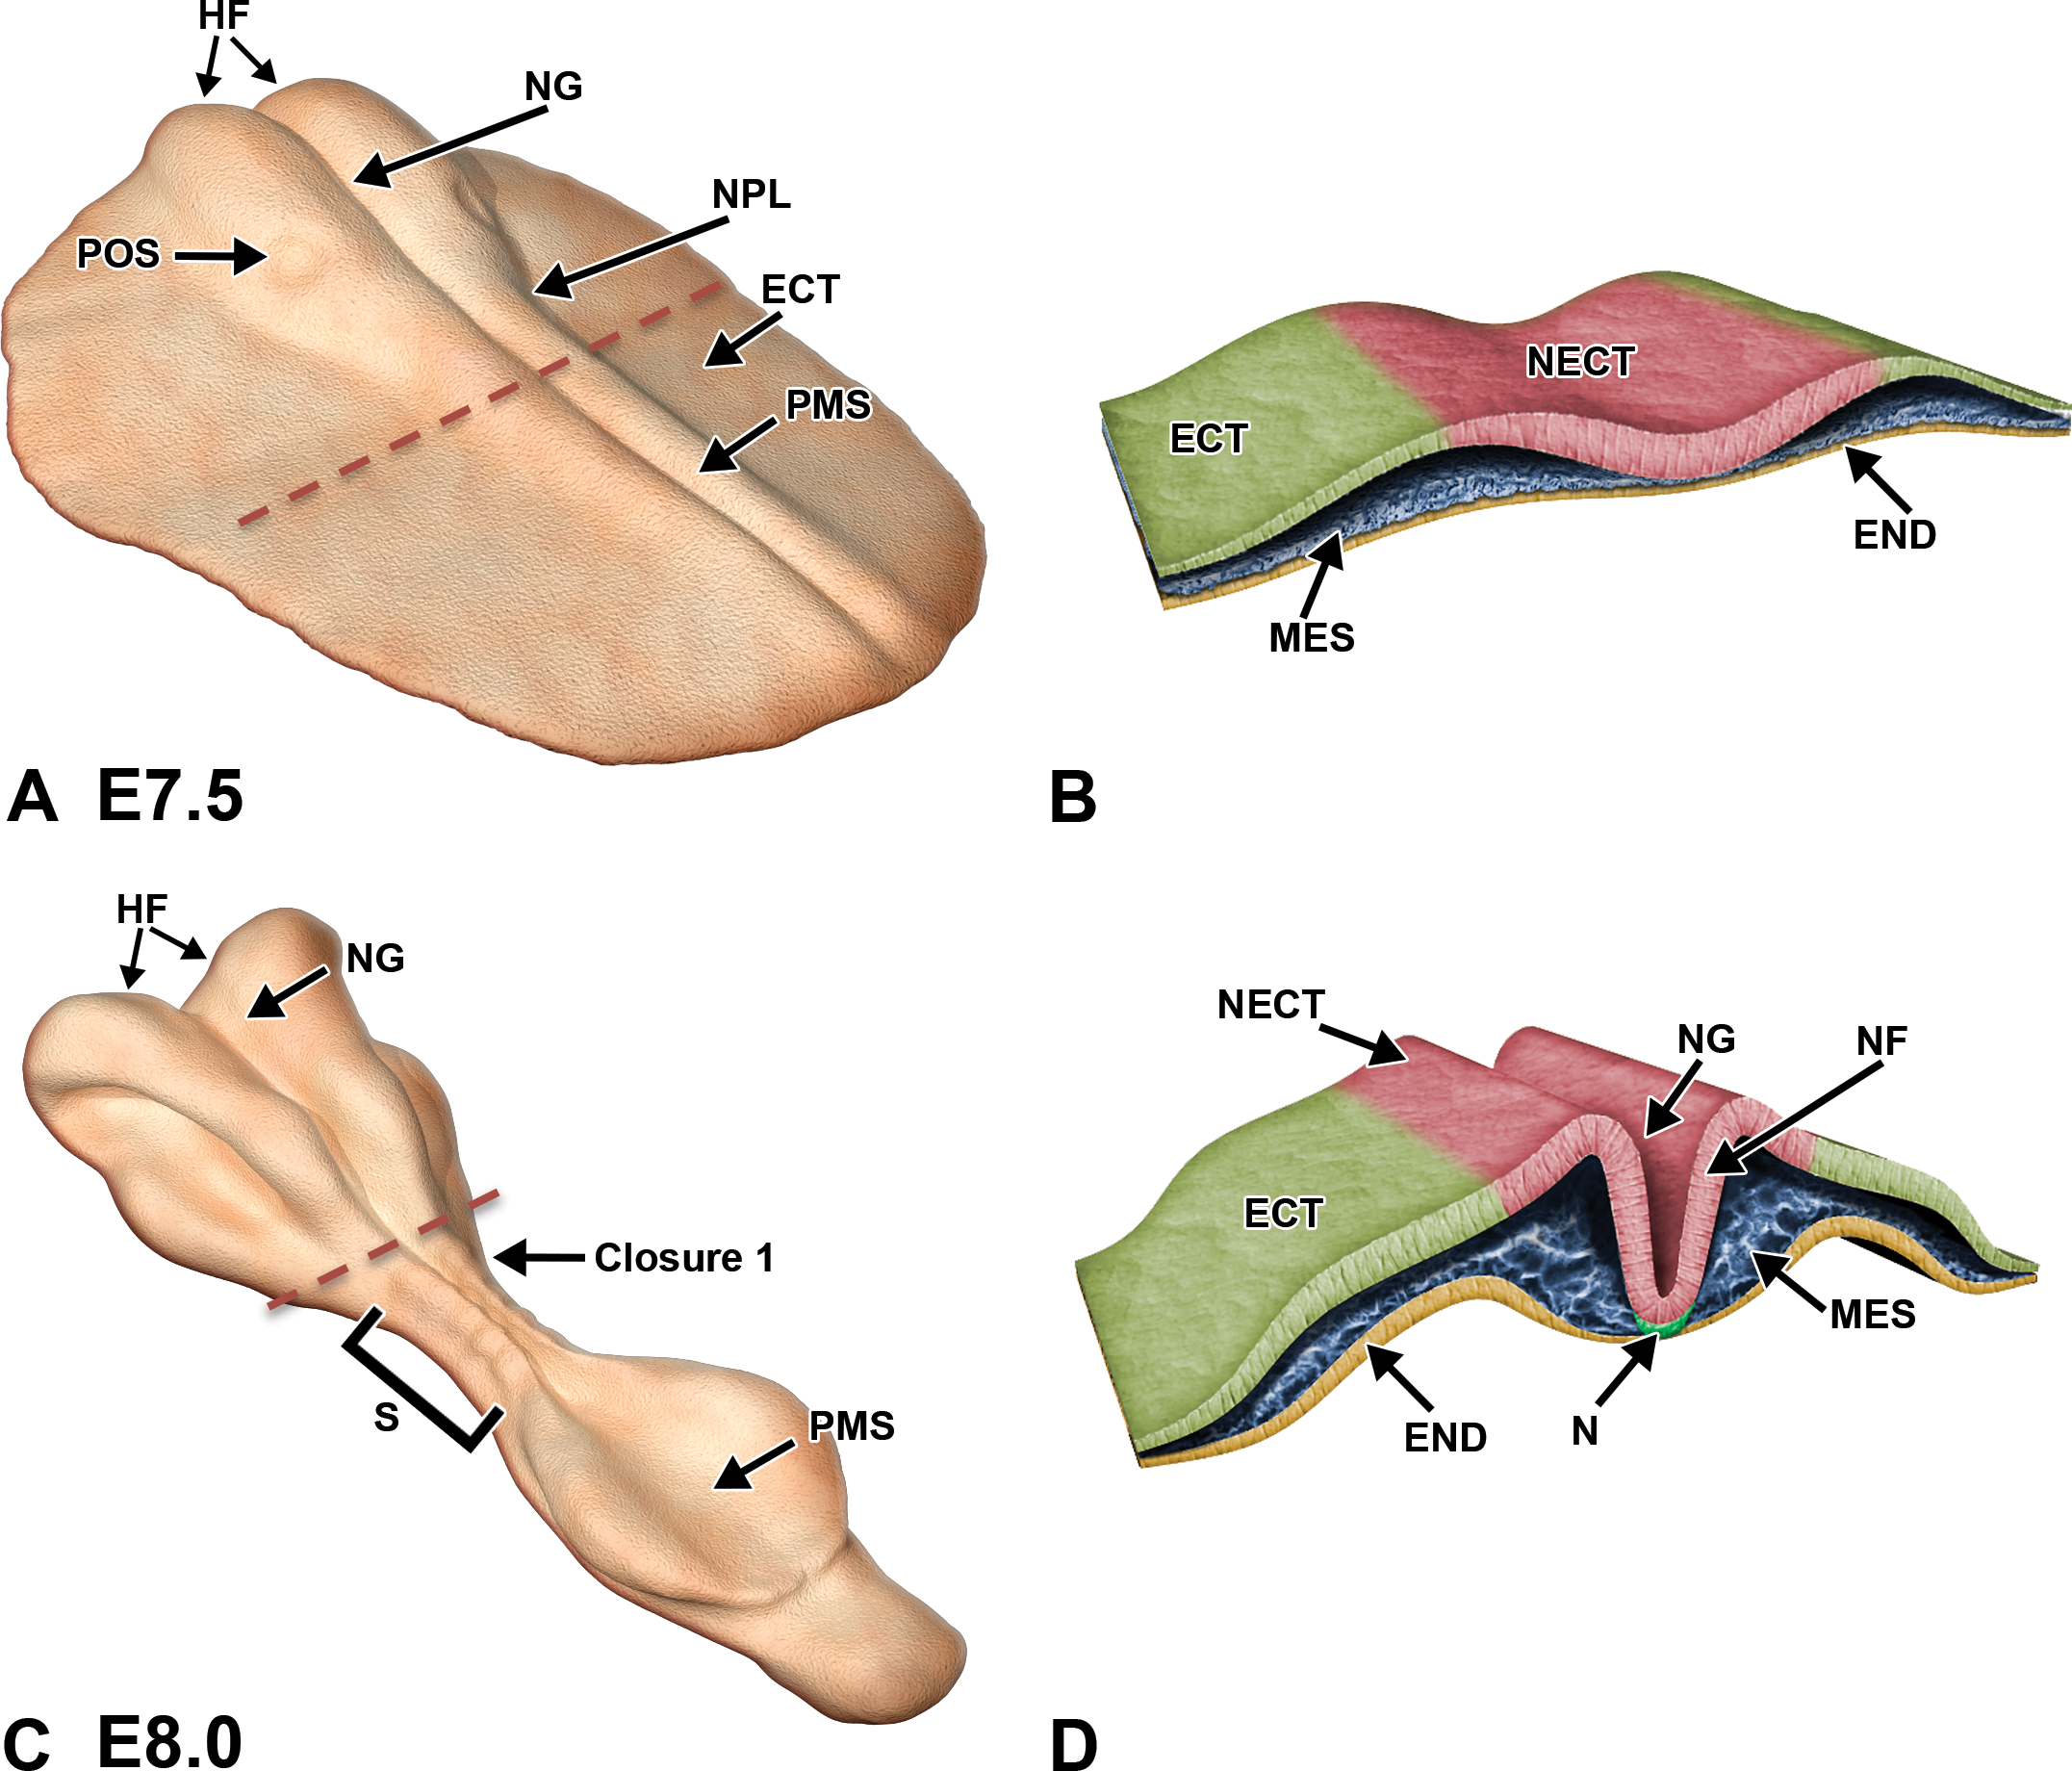
Diagrammatic representation of neurulation in the mouse embryo. Illustrations demonstrating key stages in neurulation represent the intact embryo at 2 early stages of development with representative transverse sections through the embryo. The red dashed lines in A, C, and E indicate the regions for the corresponding cross sections in B, D, and F, respectively. (A and B) Embryo at E7.5. Cephalization begins with the presence of enlarged head folds and formation of the neural plate (NPL) from the ectoderm (ECT). The neural groove (NG) begins to form as a forward extension of the primitive streak (PMS), while the preoptic sulcus (POS) becomes visible as a small depression on the caudal portion of the neural folds. On cross section, the mesoderm (MES) is subjacent to the neuroectoderm (NECT) of the NPL and is confined on the inner surface by the endoderm (END). (C and D) Embryo at E8.0. Convergence of the neural folds (NF) as well as the appearance of the notochord (N) and first few somite pairs (S) occurs in conjunction with the initiation of neural tube formation beginning at closure (fusion site) 1. (E and F) Embryo at E8.5. Neural folds in the cephalic region begin to fuse along 3 specific closure sites (1–3) and progress in a zipper-like fashion in both directions, thus forming a neural tube (NT) that differentiates into the 3-vesicle brain rostrally and the spinal cord caudally. In closing, the neural crest cells (NCRs) at the edges of the neural folds migrate beneath the neuroectoderm and assume a position in the mesodermal layer adjacent to the neural tube. The openings at the ends of the neural tube represent the rostral (RNP) and caudal (CNP) neuropores. (G and H) Embryo at E9.0. Segmental differentiation of the neural tube into the primitive 3 vesicles: prosencephalon (PRO), mesencephalon (MS), and rhombencephalon (RHO). NCRs migrate and differentiate just lateral to the spinal cord (SC), while somites give rise to the dermatome (DER) and myotome (MYO). HRT = heart, OV = optic vesicle.
E8.0 (TS12, 1–7 Somites)
By E8.0, the neural groove has progressively deepened, and the cephalic (head) neural folds are prominent (Theiler 1989; Figure 4C, D). The apices of the cephalic neural fold remodel to create 2 epithelial layers: the outer surface ectoderm and the inner neuroectoderm (Adelman 1925, reviewed in Greene and Copp 2009). The boundary zone that separates these layers becomes clear. The first somite pair forms in the cervical region at approximately E7.5. The expanding number of somite pairs coupled with shifts in the contours of brain and related craniofacial structures permits relatively accurate assignment of the developmental stage (i.e., age since conception) for mouse embryos undergoing neurulation during the next several gestational days (Bolon and Ward 2015; Brown 1990).
Formation of the neural tube requires fusion of the neural folds at the dorsal midline along the embryonic cranio-caudal axis. Closure or “zipping” takes place at several specific sites along the axis. In mice, the initial fusion of the neural folds occurs at the level of the fourth and fifth somites (designated closure 1), which comprises the hindbrain–cervical boundary. Closure then progresses in zipper-like fashion rostrally to form the bulbous neural tube of the future brain and caudally to form the narrow neural tube of the future spinal cord (Greene and Copp 2009; Kaufman and Bard 1999; Figure 4E, F). Neural fold fusion begins at 2 additional sites in the cephalic region at a slightly later stage in development (see E8.5 section).
At the rostral end of the developing neural tube, the lens placodes form at the lateral aspects of the future diencephalon. They are characterized by thickening neuroectoderm comprised of tall columnar cells, as opposed to the smaller cuboidal cells of the adjacent neuroectoderm (Kaufman and Bard 1999). Preoptic recess becomes visible and increasingly indented, forming prominent optic vesicles by E9.0 (Figure 4G). Subsequent events of optic development are beyond the scope of this review but have been well reviewed elsewhere (Kaufman and Bard 1999; Kaufman 1992; Graw 2010).
In the region of the future hindbrain, 2 rhombomeres (so named because these segments of the rhombencephalon are equivalent to the neuromere divisions of the torso) are beginning to form (Tomás-Roca et al. 2016). At this stage, the cephalic neural crest cells arise from the apices of the elevating neural folds along the neuroectodermal/surface ectodermal junction (i.e., the neural “crest”; Figure 4F, H). These cells delaminate from the neuroepithelium, undergo an epithelial-to-mesenchymal transition, and migrate in streaming columns to colonize specific regions of the head and branchial arches (Clay and Halloran 2010). Particularly during this stage, neural crest cells from the future midpontine region of the hindbrain migrate to the maxillary component of the first pair of branchial arches in the cephalic region to intermingle with the branchial arch mesoderm; collectively, these cells give rise to the neurons and glia of the trigeminal ganglia (CN V) as well as many nonneural structures (Kaufman and Bard 1999; Creuzet 2009). Neural crest cell migration from distinct rhombomeres of the hindbrain occurs progressively from this stage through approximately E9.5 and contributes to the complement of neurons and glia that populate the ganglia associated with CNs VII, VIII, IX and X as well as diverse tissues of the head and neck. Recent research has also identified a critical role of neural crest-derived tissues in organizing forebrain development (Le Douarin and Dupin 2016).
E8.5 to E9.0 (TS13–TS14, 8–20 Somites)
By E8.5, the fusion of the cephalic neural tube has been initiated at 2 additional sites: closure 2, at the forebrain–midbrain boundary and which progresses bidirectionally, and closure 3, at the rostral extremity of the forebrain and which progresses caudally (Figure 4E). By E9.0, the caudal progression of closure 3 meets the rostral progression of closure 2, thereby extinguishing the rostral neuropore and completing the formation of the rostral neural tube. This region of neural tube includes the prosencephalon (forebrain vesicle), which is further distinguished by its bilaterally protruding optic vesicles and the infundibular recess, a small evagination on the floor of the vesicle which is the primordium of the neurohypophysis (pars nervosa [posterior lobe] of the pituitary gland). Meanwhile, the progression of neural fold fusion caudally from closure 2 meets and fuses with the comparable wave of fusion moving rostrally from closure 1, thus completing the closure of the hindbrain and the formation of the mesencephalon (midbrain vesicle) and rhombencephalon (hindbrain vesicle). Caudal extension of fusion from the cervical neural folds (closure 1) extends to the proximal part of the tail, with closure of the caudal neuropore occurring by E9.5 to E10.0. Fusion of the neural folds at the dorsal midline along the embryonic cranio-caudal axis concludes with the physical separation of the neuroectoderm (the future CNS) from the surface ectoderm (the future skin).
The exact locations and closure times for these additional sites vary slightly among mouse strains, which may explain strain differences in prevalence of various NTDs. Unlike closures 1 and 3, closure 2 is polymorphic among mouse strains (Juriloff et al. 1991, reviewed in Copp, Greene, and Murdoch 2003), displaying considerable variability in the initial site of closure along the cranio-caudal axis of the neural tube. Strains with a rostral location for closure 2 (e.g., SWV/Bc) are predisposed to develop exencephaly (“permissive”), while that lesion is rare in strains with a caudal site for closure 2. In addition, the rostral neuropore, located rostral to closure 2, closes late in ICR/Bc embryos (Juriloff et al. 1991). This divergence emphasizes the critical importance of having strain-appropriate controls when evaluating a CNS phenotype, as NTDs are one of the major lesions indicating abnormal nervous system development.
At E9.0, the fundamental topology of the brain is established. Segmental differentiation of the cranial neural tube at this stage produces 3 linked primitive vesicles: the prosencephalon (forebrain), the mesencephalon (midbrain), and the rhombencephalon (hindbrain). These divisions are formed following closure of the rostral part of the neural tube, at which time the lumen of the future brain begins to dilate and the rostral neural tube begins to “fold.” The morphological transition results in production of 2 flexures: the midbrain flexure, occurring at the level of the midbrain, and the cervical flexure, occurring between the most caudal part of the future hindbrain and most cranial part of the future spinal cord (Kaufman and Bard 1999).
E9.5 (TS15, 21–29 Somites)
By E9.5, the volume of the prosencephalon has increased dramatically, and the telencephalic vesicles begin to develop as 2 buds forming from its rostrolateral margins. At the midline, the most rostral aspect of the prosencephalon thins to form the lamina terminalis (Figure 5), which separates the 2 developing telencephalic vesicles, the lumens of which later form the lateral ventricles. The third ventricle of the diencephalon is contiguous with the lumina of the 2 telencephalic vesicles through the interventricular foramina. Concurrently, the infundibular recess of the third ventricle differentiates and deepens, so that its basal lamina comes into direct contact with the basal lamina of the dorsal wall of Rathke’s pouch (the source for progenitor cells of the adenohypophysis [pars distalis, anterior lobe, of the pituitary gland]). Rathke’s pouch arises embryologically, as a dorsal extension of ectoderm from the roof of the stomodeum (i.e., oral cavity), and thus, is lined by ectoderm.
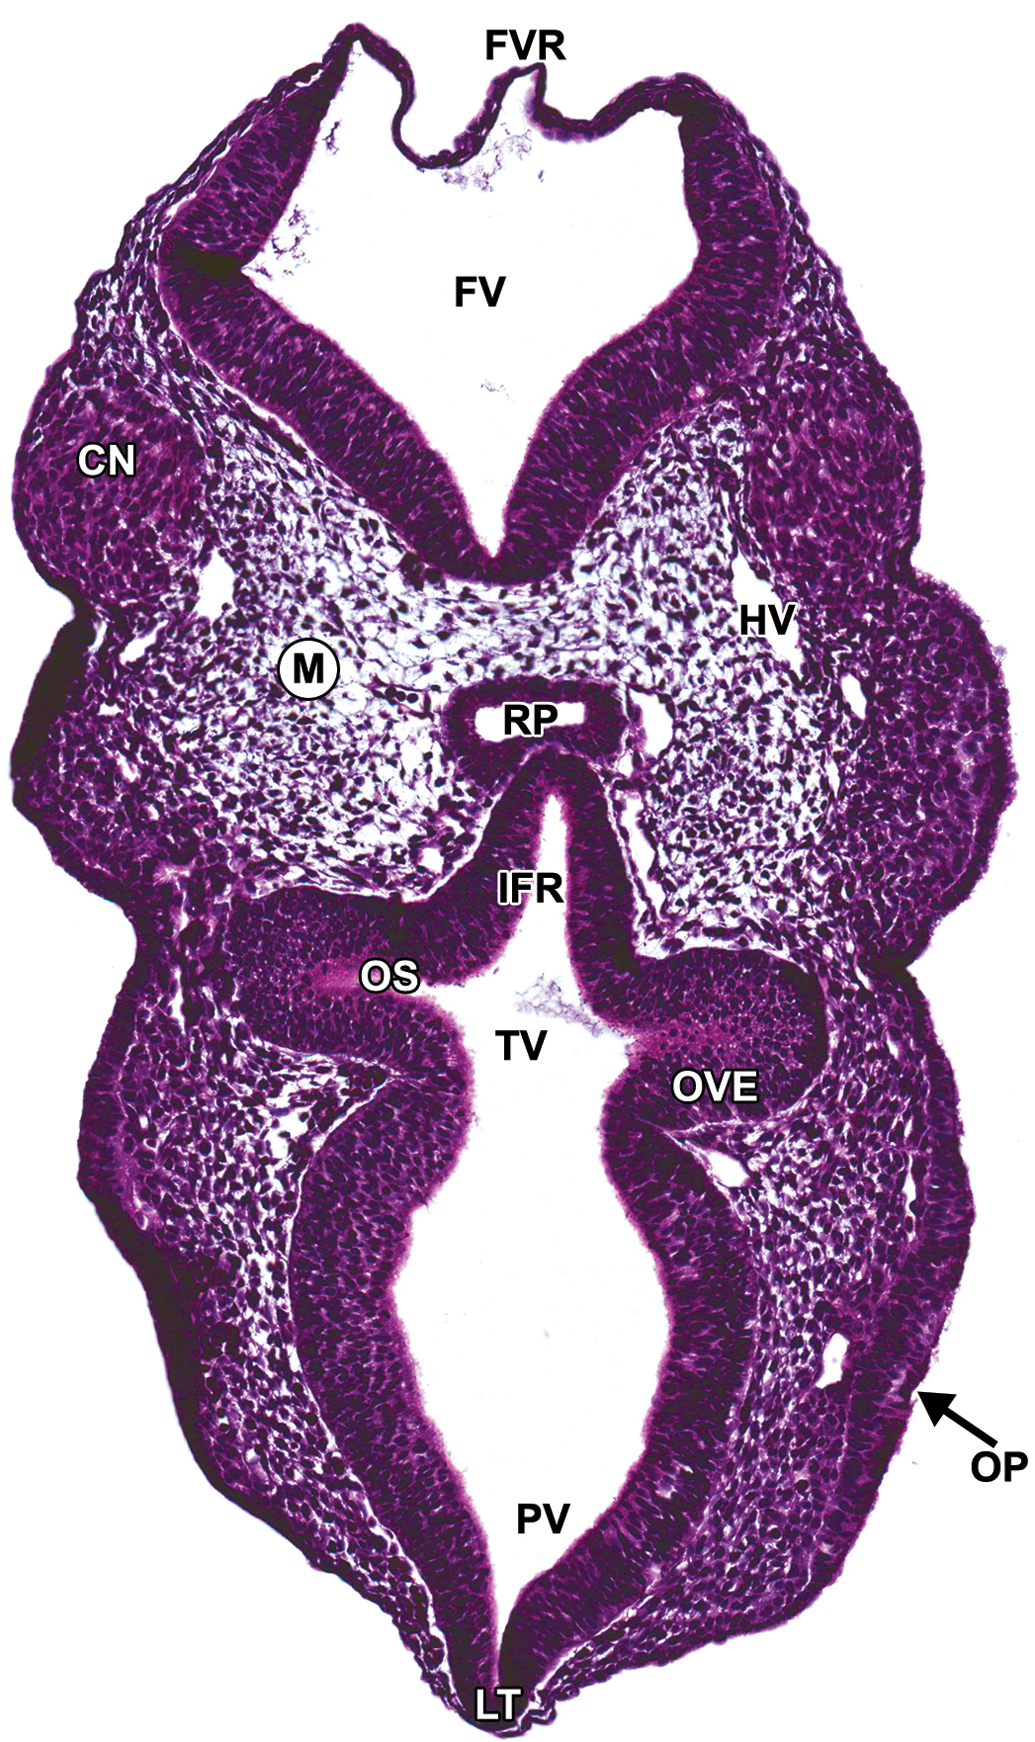
Representative image of an E9.5 embryonic mouse brain. Hematoxylin and eosin–stained, transverse section. CN = cranial nerve ganglion (neural crest); FV = fourth ventricle; FVR = fourth ventricle roof; HV = head vein; IFR = infundibular recess; LT = lamina terminalis; M = mesenchyme; OP = olfactory placode; OS = optic stalk; OVE = optic vesicle neuroepithelium; PV = prosencephalic vesicle; RP = Rathke’s pouch; TV= third ventricle.
The caudal portion of the prosencephalon forms the remaining structures of the diencephalon. This region associates with the optic nerve (CN II) and will differentiate into the epithalamus, thalamus, and hypothalamus by E12.0. In the rhombencephalon, the volume of the fourth ventricle increases dramatically, thus stretching and thinning its roof plate (Figure 5). This attenuation is a reproducible event during development and should not be confused with a focal area of neuroepithelial aplasia.
Central components of neural organs that contact peripheral sensory organs also begin to develop at E9.5. The parasympathetic ganglia of the oculomotor nerve (CN III), as well as the mesenchyme rostral to the mesencephalon and surrounding the globe of the eye, arise from cranial neural crests of the caudal prosencephalon and the mesencephalon (Figure 5; Kaufman and Bard 1999). The surface ectoderm overlying the ventrolateral aspect of the telencephalic vesicles thickens to form the olfactory placodes (Figure 5), which in time will differentiate into the olfactory neuroepithelium and olfactory nerve (CN I).
E10.0 (TS16, 30–34 Somites)
By E10.0, the walls of the 2 telencephalic vesicles display increased thickening and cerebrocortical differentiation, resulting in a progressive decrease in the diameter of the interventricular foramina until they become slit-like by E12.0 (Figure 6A, B). The neuroectoderm that surrounds the central lumen of the neural tube begins to differentiate into 3 morphologically distinct layers: the inner ventricular zone (VZ; “ependymal layer”; Figure 7A), an intermediate zone (“mantle layer”), and an outer marginal zone (“marginal layer”; Kaufman and Bard 1999). At this stage, the synonym “ependymal layer” as applied to the inner portion of the neural tube wall is somewhat misleading as this region is composed of the neuroepithelial progenitor cells that ultimately give rise to the great majority of the neural cell populations in the CNS (neurons, astrocytes, and oligodendrocytes) in addition to the ependymal cells lining the ventricular system (Figure 7A). During the first cycles of stem cell division in the VZ, “radial glia” are produced and then extend their processes across the entire thickness of the cerebral cortex (Online Supplemental Figure 8). Although radial glia were once considered to be an independent cell population from the neuroprogenitor cells, considerable evidence now indicates that they represent a continuum and can give rise to both neurons and glia throughout embryonic development (Tramontin et al. 2003; Gotz and Huttner 2005). Whereas the ependymal layer is distinct at E10, clear differentiation of the mantle and marginal layers as distinct zones begins around E10.5, progressively leading to the formation of mature gray matter and white matter, respectively, as the different brain regions mature. Morphological evidence of differentiation into gray and white matter occurs at different rates throughout the brain and spinal cord, with the spinal cord and caudal regions of the brain developing earlier than the forebrain elements, particularly the cerebral cortex.
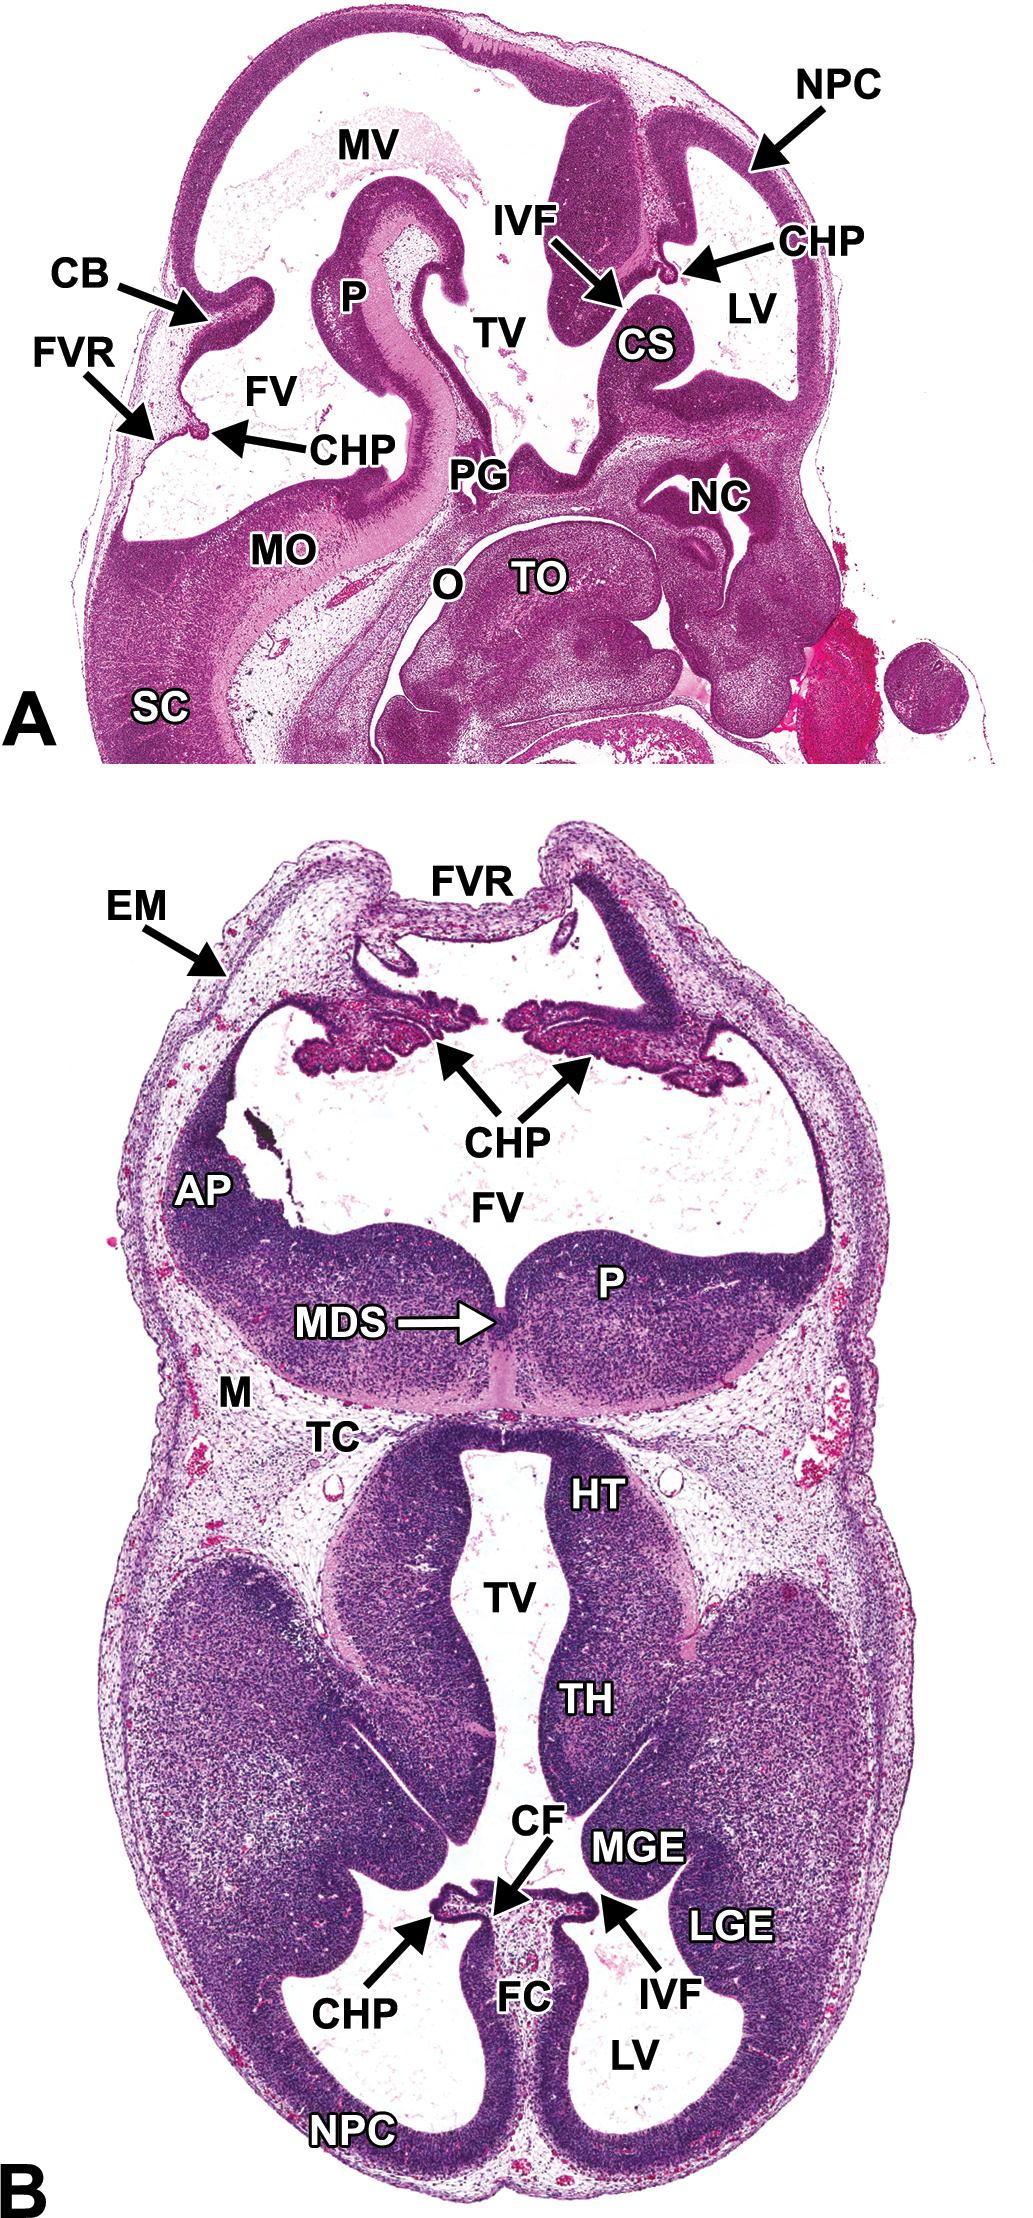
Representative images of an E12.5 embryonic mouse brain. Hematoxylin and eosin–stained sagittal (A) and transverse (B) sections. AP = alar plate; CB = cerebellum; CF = choroidal fissure; CHP = choroid plexus; CS = corpus striatum; EM = ectomeninx; FC = falx cerebri; FV = fourth ventricle; FVR = fourth ventricle roof; HT = hypothalamus; IVF = interventricular foramen; LGE = lateral ganglionic eminence; LV = lateral ventricle; M = mesenchyme; MDS = median sulcus; MGE = medial ganglionic eminence; MO = medulla oblongata; MV = mesencephalic vesicle; NC = nasal cavity; NPC = neopallial cortex; O = oropharynx; P = pons; PG = pituitary gland; SC = spinal cord; TC = tentorium cerebelli; TH = thalamus; TO = tongue; TV = third ventricle.
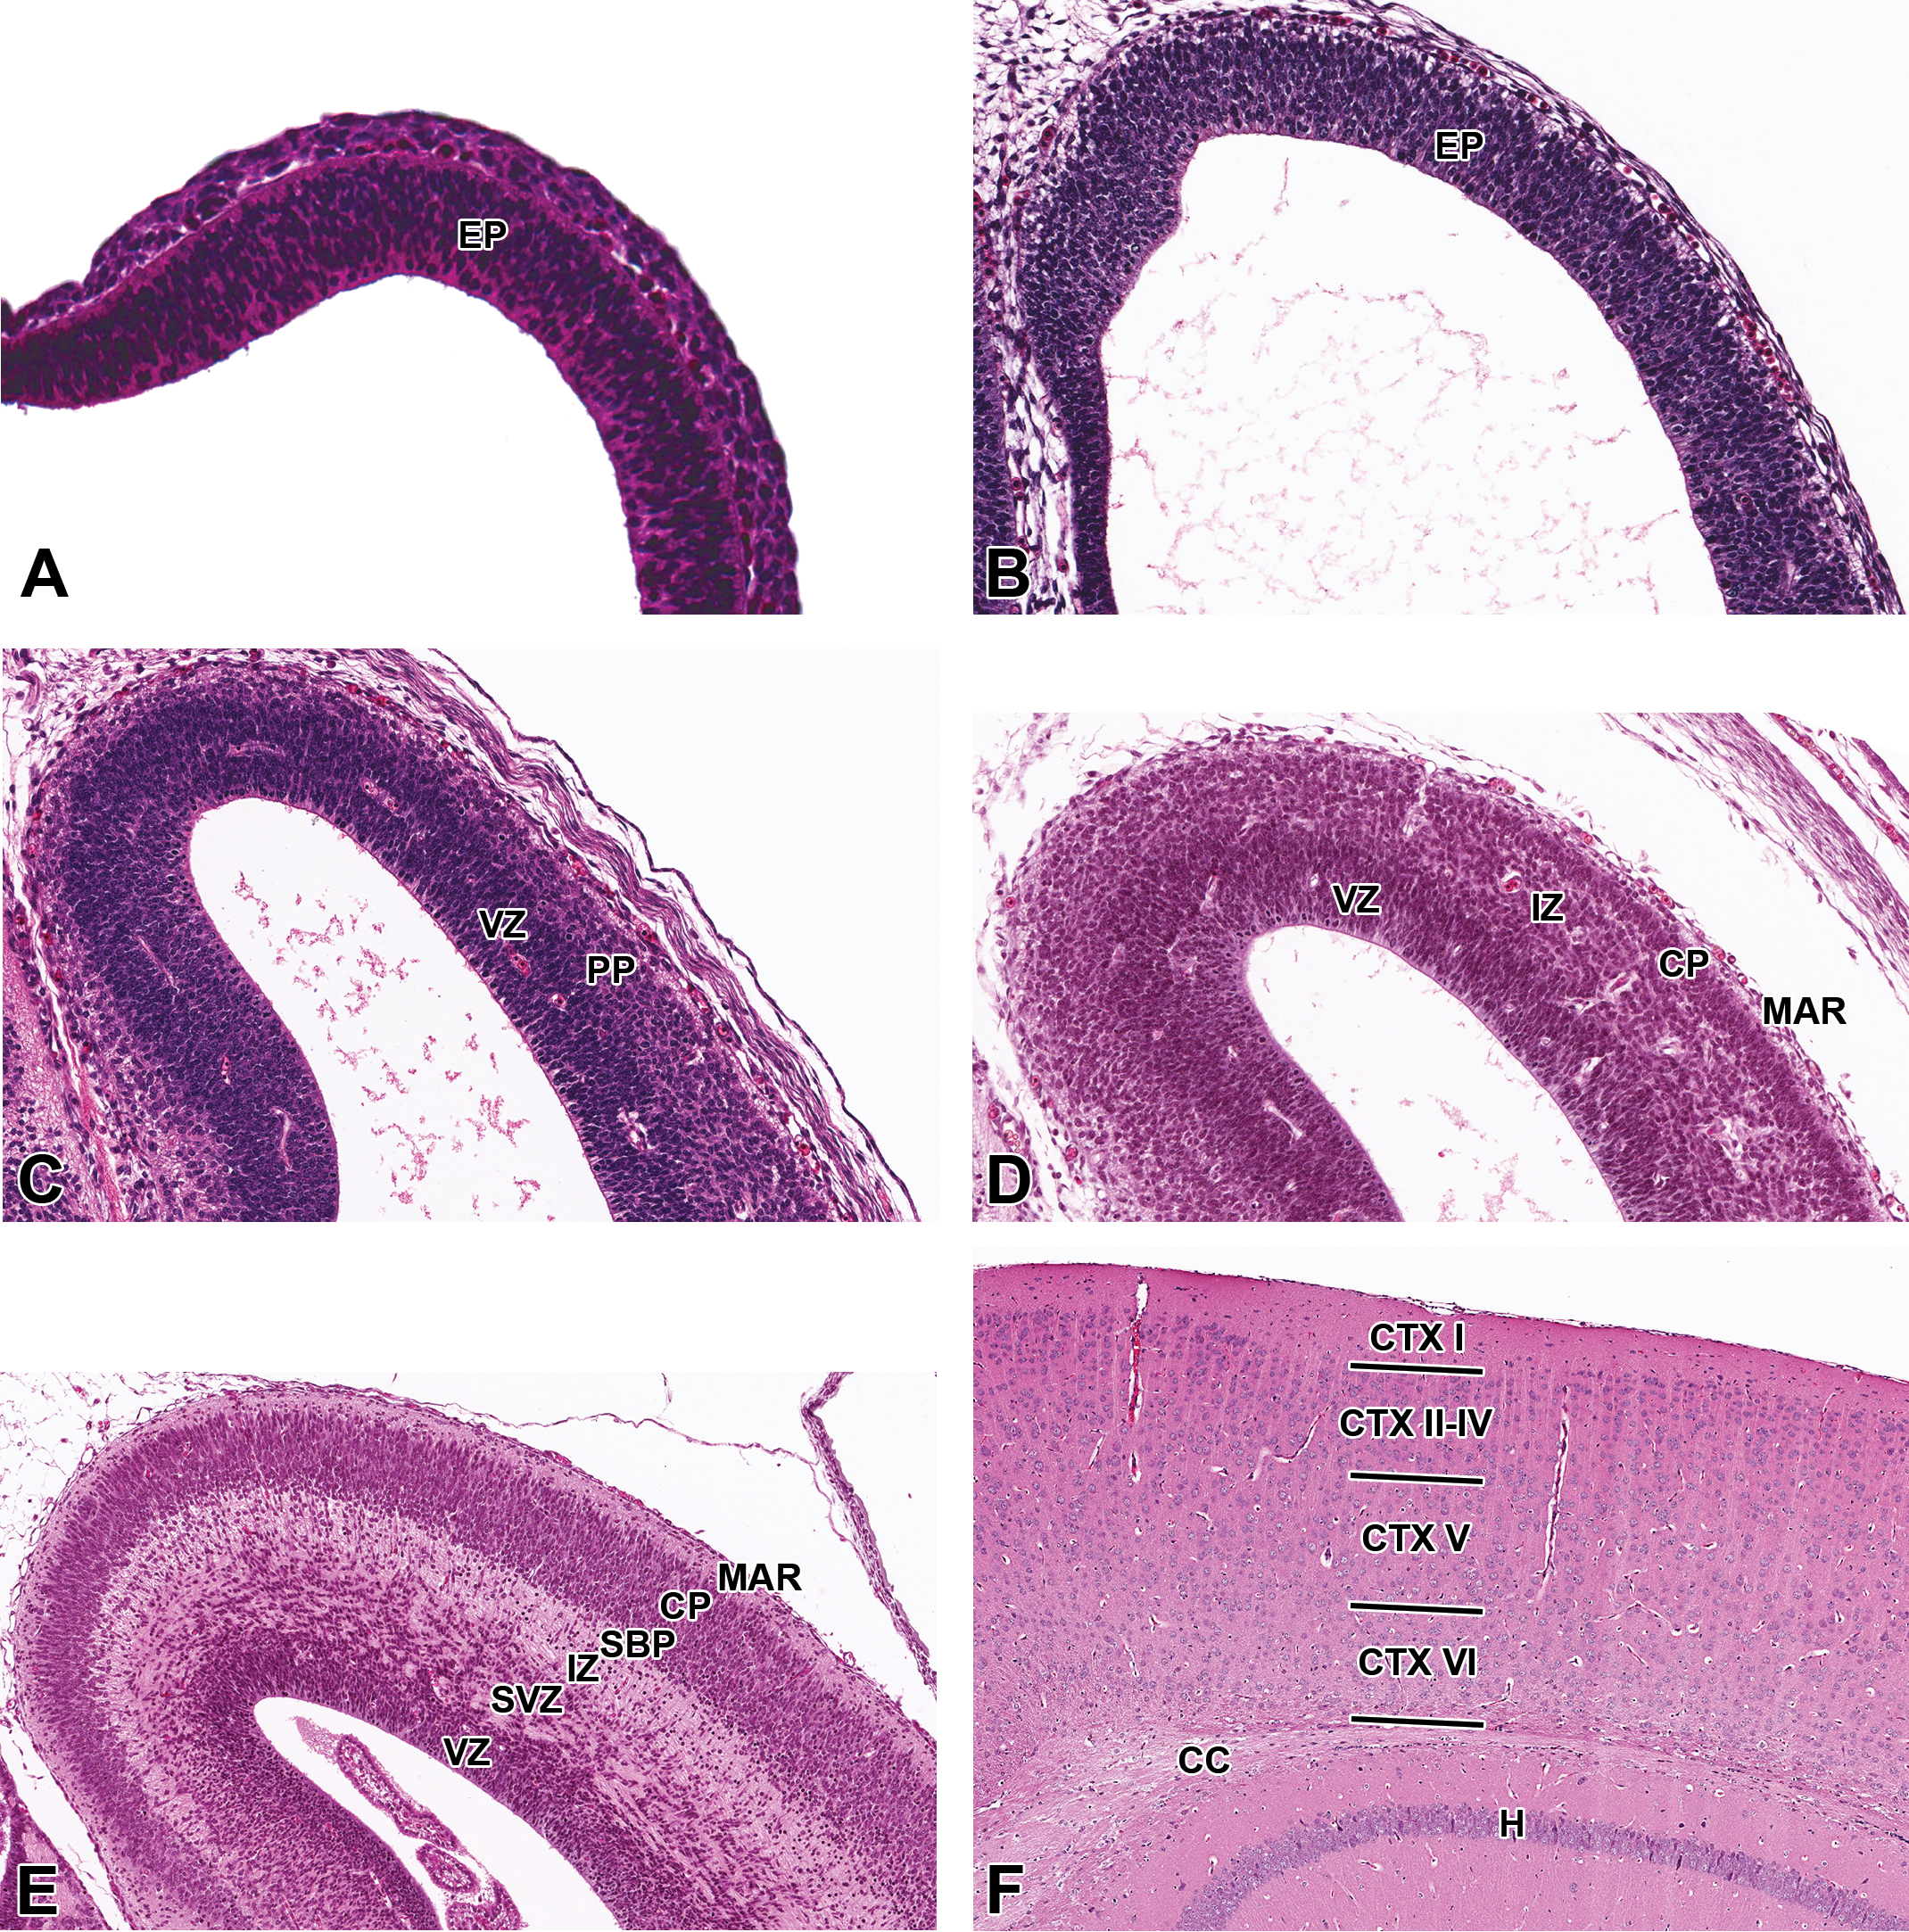
Representative images of the cerebral cortex during brain development. Hematoxylin and eosin–stained sections of the prosencephalic (A) and telencephalic (B, C, D, E, and F) walls. (A) E9.5, sagittal section. (B) E11.5, transverse section. (C) E13.5, coronal section. (D) E15.5, coronal section. (E) E17.5, coronal section. (F) P21, coronal section. CC = corpus callosum; CP = cortical plate; CTX I-VI = cortical layer I-VI; EP = ependymal layer; H = hippocampus; IZ = intermediate zone; MAR = marginal layer; PP = cortical preplate; SBP = cortical subplate; SZ = subventricular zone; VZ = ventricular zone.
The definitive pituitary gland begins to assume a recognizable shape and position at this stage (see Figure 6A for E12.5). The infundibular recess further differentiates as an extension from the ventral diencephalon, increasing in size and making contact with the rostral extremity and caudal surface of Rathke’s pouch (Figure 8A–C).
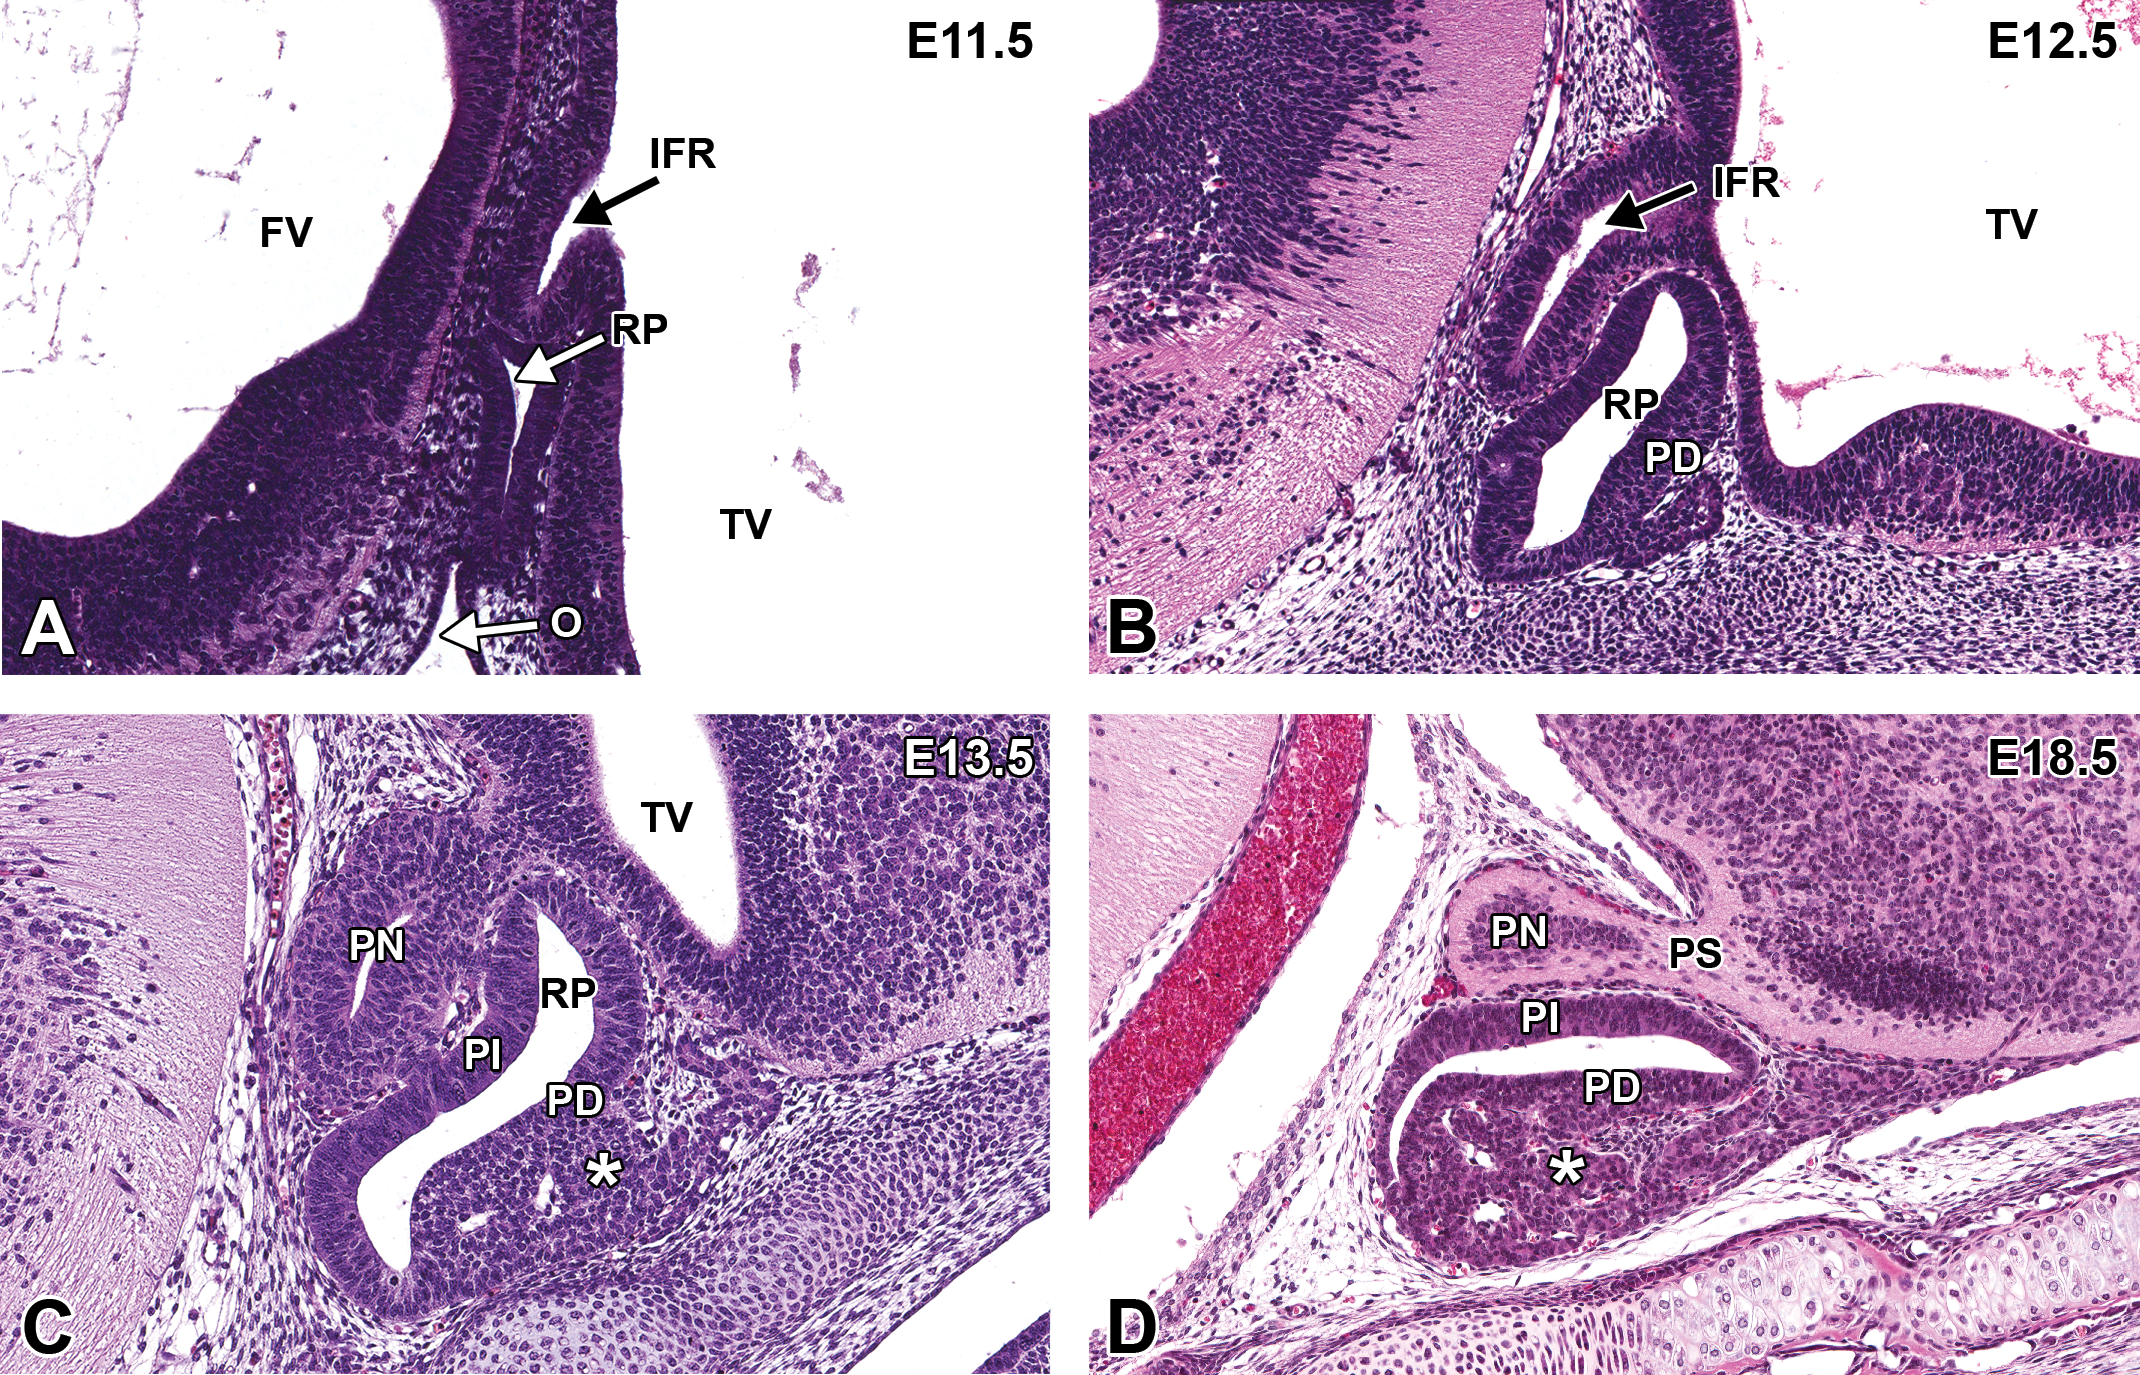
Representative images of the pituitary gland during brain development. Hematoxylin and eosin–stained, sagittal sections. (A) E11.5. (B) E12.5. (C) E13.5. (D) E18.5. FV = fourth ventricle; IFR = infundibular recess; O = oropharynx; PD = pars distalis (adenohypophysis); PI = pars intermedia; PN = pars nervosa (neurohypophysis); PS = pituitary stalk; RP = Rathke’s pouch; TV = third ventricle. * = Vascular network derived from the plexus of the diencephalic floor.
Localized regions of transient neural lumen occlusion occur in the spinal cord of the caudal trunk, eventually expanding to involve up to 60% of the tube length. The resulting rise in fluid pressure within the cephalic neural tube is hypothesized to play a role in dilation of the brain vesicles during early neurulation (Kaufman 1983; Desmond 1982). For example, in Figure 9A, the lumen of the proximal neural tube is narrowed, so that the neuroepithelium lining the opposite sides is apposed, but the canal remains completely patent. Similarly, in Figure 9B, the lumen of the distal end of the neural tube is occluded in some segments and open in the flanking segments. Ultrastructural studies have demonstrated that closely apposed neuroepithelial cells on opposite walls may interdigitate their processes to initiate luminal occlusion (Kaufman 1983). The timing and patterning of neuroepithelial apposition and the duration of luminal occlusion can vary among mouse embryos, as well as among embryos of various vertebrate species. In the mouse, occlusion may be visible in embryos with as few as 10 to 12 pairs of somites even when both the cephalic and caudal regions of the neural tube are still open (Kaufman 1983).
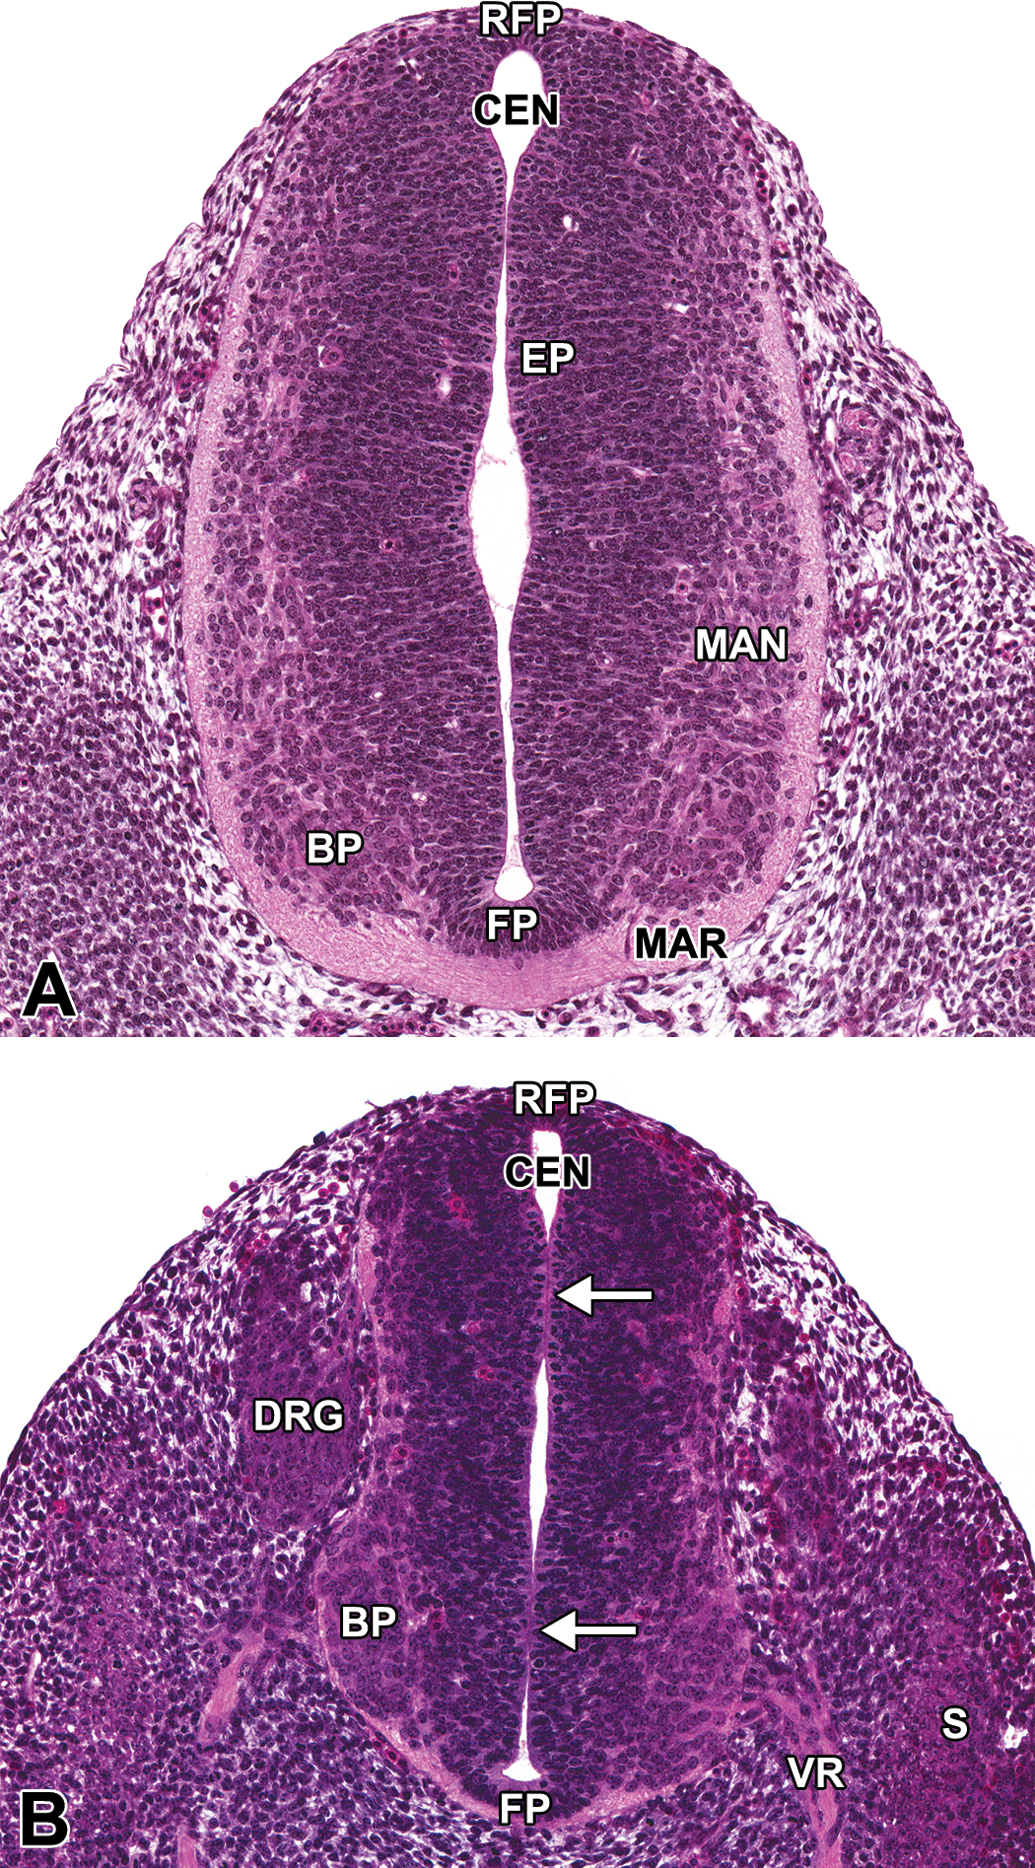
Representative images of the transient neural lumen occlusion of the spinal cord. Hematoxylin and eosin–stained, coronal (dorsoventral) sections of an E11.5 embryo. Neural lumen occlusion in the spinal cord of the caudal trunk results in the rise of fluid pressure within the cephalic neural tube and, thus, dilation of the brain vesicles during neurulation. (A) The lumen of the proximal neural tube is narrowed with apposition of opposite sides but complete patency. (B) The lumen of the distal end of the neural tube is segmentally occluded (white arrows). BP = basal plate; CEN = central canal; DRG = dorsal root ganglion; EP = ependymal layer; FP = floor plate; MAN = mantle layer; MAR = marginal layer; RFP = roof plate; S = somite; VR = ventral root.
In the region of the developing tail bud (which is an aggregate of undifferentiated mesenchymal cells at the caudal end of the spine), a process termed “secondary neurulation” is proceeding rapidly at this stage (see Figure 10A, B, C as examples of caudal, mid-, and cranial tail bud mesenchyme, respectively, and secondary neurulation at E12.5). This term refers to the development of the neural tube immediately caudal to the caudal neuropore through the condensation of tail bud mesenchyme rather than neural tube formation. “Primary neurulation” refers to the formation of the cephalic and majority of the postcephalic neural tube through fusion of the neural folds, as described in detail above. The condensing mesenchyme undergoes a mesenchymal-to-epithelial transition to form a medullary rosette of neuroepithelium, the center of which cavitates and connects to the lumen of the remainder of the neural tube (Schoenwolf 1984; Griffith, Wiley, and Sanders 1992).
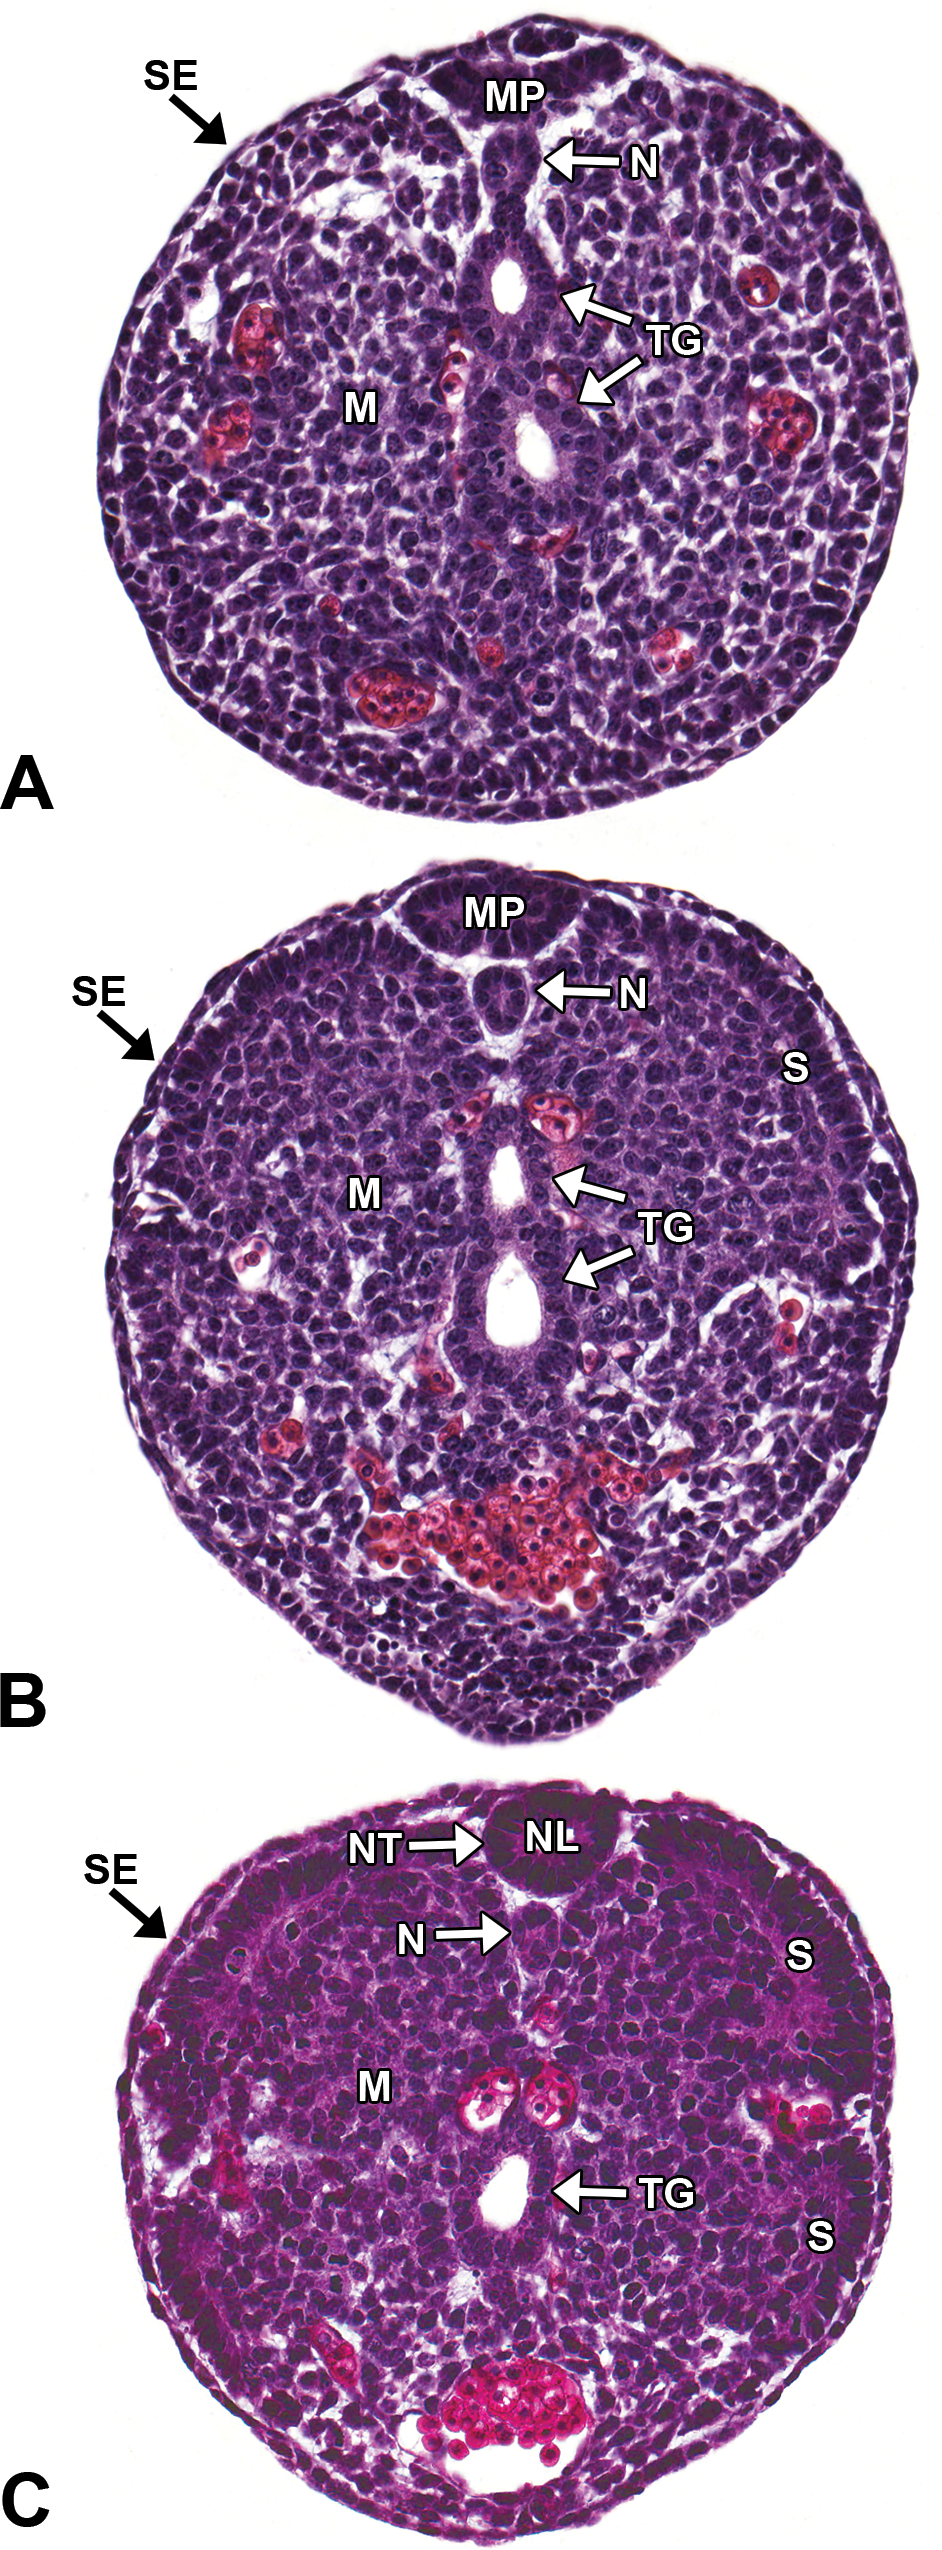
Representative images of secondary neurulation. Hematoxylin and eosin–stained, transverse sections of an E12.5 embryo. Secondary neurulation forms the neural tube (NT) caudal to the caudal neuropore through the condensation of tail bud mesenchyme (M), which undergoes mesenchymal-to-epithelial transition to form a medullary plate (MP) of neuroepithelium. (A and B) Caudal tail bud and mid-tail bud, respectively. The MP consists of columnar epithelium from mesenchymal cells that extend dorsoventrally from the surface ectoderm (SE). (C) Cranial tail bud. A slit-like lumen appears below the MP, and the plate begins to round while cavitating to form the neural lumen (NL). The center then connects to the lumen of the remainder of the neural tube. The notochord (N) forms from mesenchymal cells directly ventral to the secondary neural tube. S = somite; TG = tail gut.
Development after Neural Tube Closure (E10.5–E18.0)
E10.5 to 11.0 (TS17–TS18, 35–40 Somites)
Differentiation of the mantle and marginal layers begins around E10.5 and eventually will form the gray matter and white matter, respectively, of the brain and spinal cord. However, at this early stage of differentiation, the histologic appearance of the neuroepithelium is still dominated by the proliferative ependymal layer, which is characterized by numerous mitotic figures along the developing ventricles and metabolically hyperactive cells having a very high nucleus-to-cytoplasm ratio. The developing mantle and marginal layers comprise a much thinner, peripheral zone in most brain regions; although in the hindbrain and spinal cord, these layers are more prominent. In this atlas, the described neuroepithelial layers are best illustrated in the next stage of development during E11.5 to E12.0. As development proceeds, the histologic appearance progressively shifts in favor of mantle and marginal layers in all regions of the CNS.
The 2 telencephalic vesicles, which began as outgrowths of the ventrolateral diencephalon, continue to grow rapidly and expand caudodorsally into the midbrain region. Their lumens, which become the future lateral ventricles, are very large relative to their wall thickness at this stage (Figure 11A–D). The fourth ventricle of the rhombencephalon also appears dilated at this stage and is accompanied by a characteristically thin roof, which should not be mistaken for focal aplasia of the brain parenchyma, and a wide floor with prominent yet transitory elevations (Theiler 1989; Figure 11D). It should be noted that neural crest cells organize in the cranial half of each somite, forming dorsal root ganglia (DRG; Figure 11A) in which sensory neurons reside.
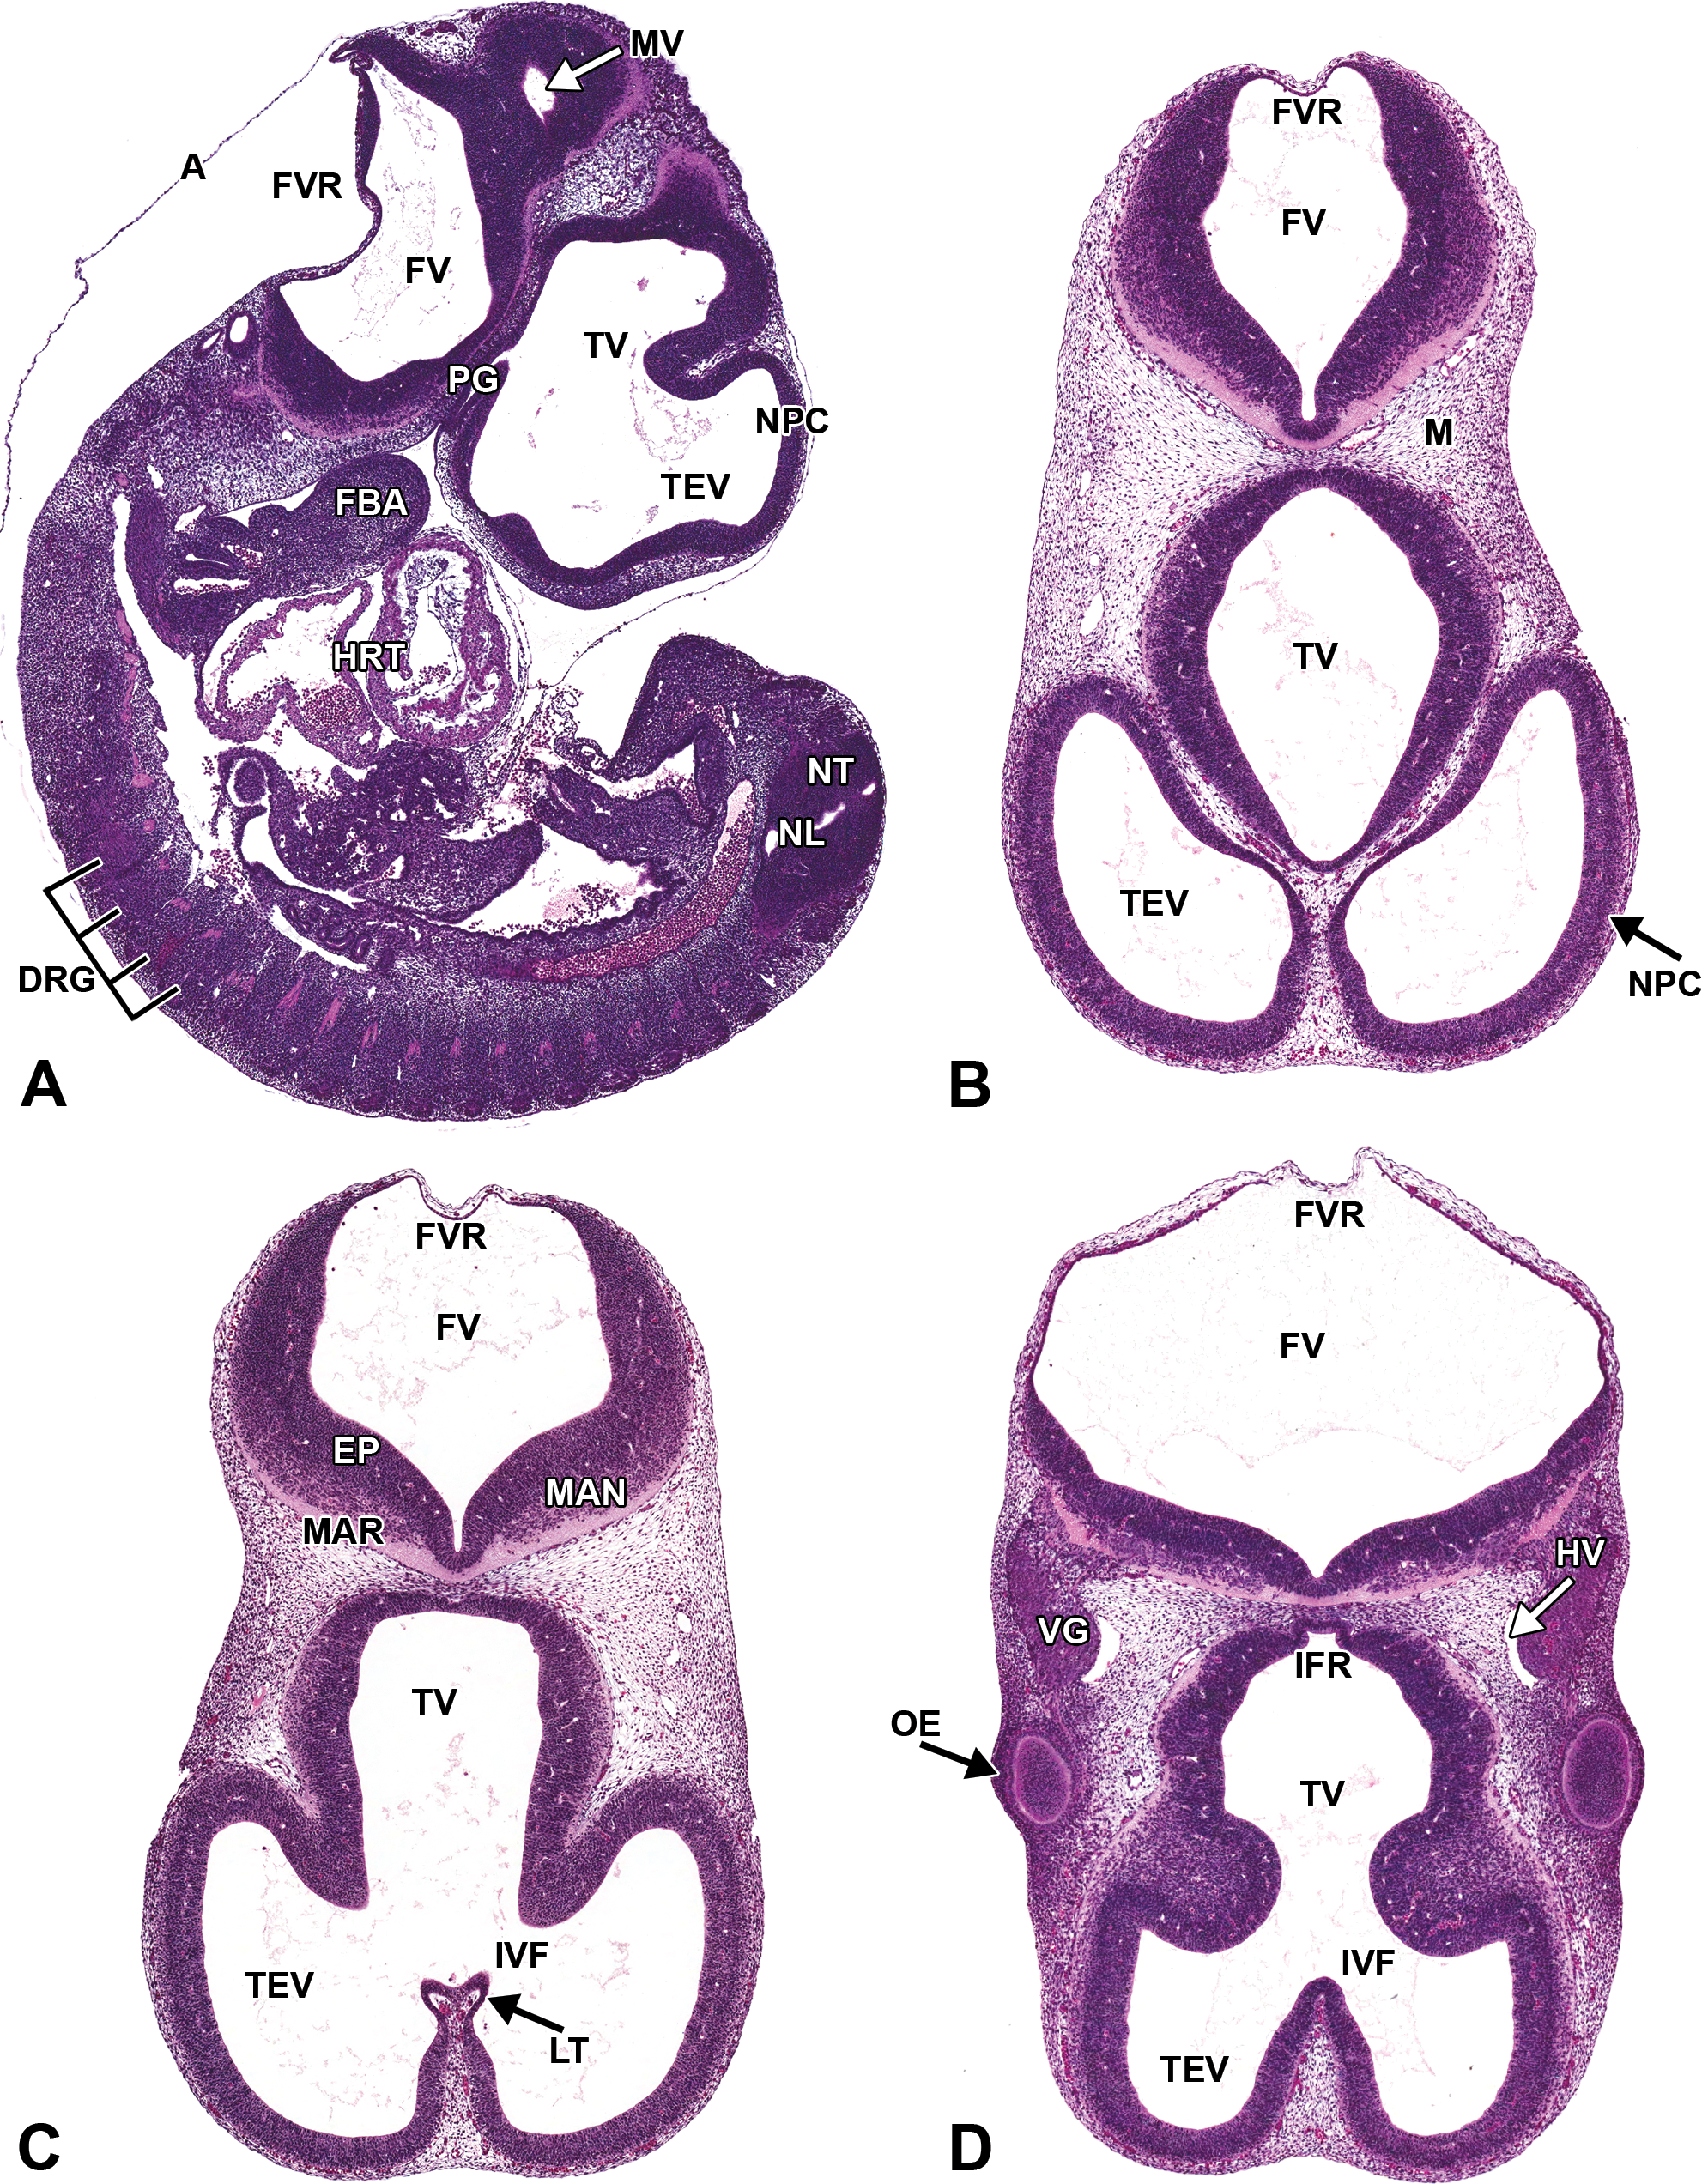
Representative images of E11.5 embryonic mouse brain. Hematoxylin and eosin–stained sections. (A) Sagittal section. (B, C, and D) Transverse sections, superficial (B) to deep (D). A = amnion; DRG = dorsal root ganglion; EP = ependymal layer; FBA = first branchial arch; FV = fourth ventricle; FVR = fourth ventricle roof; HRT = heart; HV = head vein; IFR = infundibular recess; IVF = interventricular foramen; LT = lamina terminalis; M = mesenchyme; MAN = mantle layer; MAR = marginal layer; MV = mesencephalic vesicle; NL = neural lumen of spinal cord; NPC = neopallial cortex; NT = neural tube; OE = optic eminence; PG = pituitary gland; TEV = telencephalic vesicle; TV = third ventricle; VG = cranial nerve V (trigeminal) ganglion.
The neuroepithelium of the ventral telencephalon (i.e., the subpallium) undergoes massive proliferation during approximately E10 to E12, resulting in the formation of large medial, lateral, and caudal ganglionic eminences protruding into the lumens of the developing ventricles (Figures 6B and 12). The medial and lateral eminences form distinct bulges in more rostral coronal sections, whereas caudally they fuse and subsequently are referred to as the caudal ganglionic eminence. Tangential migration of cells to form the basal nuclei (or basal ganglia) is directed by the lateral and medial ganglionic eminences, with the lateral eminence giving rise to the striatum (the caudate and putamen dorsally, and the nucleus accumbens and olfactory tubercle ventrally) and the medial eminence giving rise to the globus pallidus (Corbin, Nery, and Fishell 2001). The medial eminence also contributes to the population of GABAergic (γ-aminobutyric acid-containing) interneurons and oligodendrocytes of the developing cerebral cortex and other telencephalic structures (Rowitch and Kriegstein 2010; Molnar et al. 2006). The caudal eminence ultimately differentiates into the amygdaloid body (Molnar et al. 2006; Corbin, Nery, and Fishell 2001). The peak of neurogenesis in the cerebrum varies somewhat depending on the precise location, with initial populations of the globus pallidus and amygdala beginning approximately 2 embryonic days prior to the first production in the striatum (E10/11 and E13, respectively; Finlay and Darlington 1995; Rodier 1980). Histologically, the appearance of this region remains fairly undifferentiated through E12, but the mantle and marginal zones gradually enlarge and become more distinct through E14.
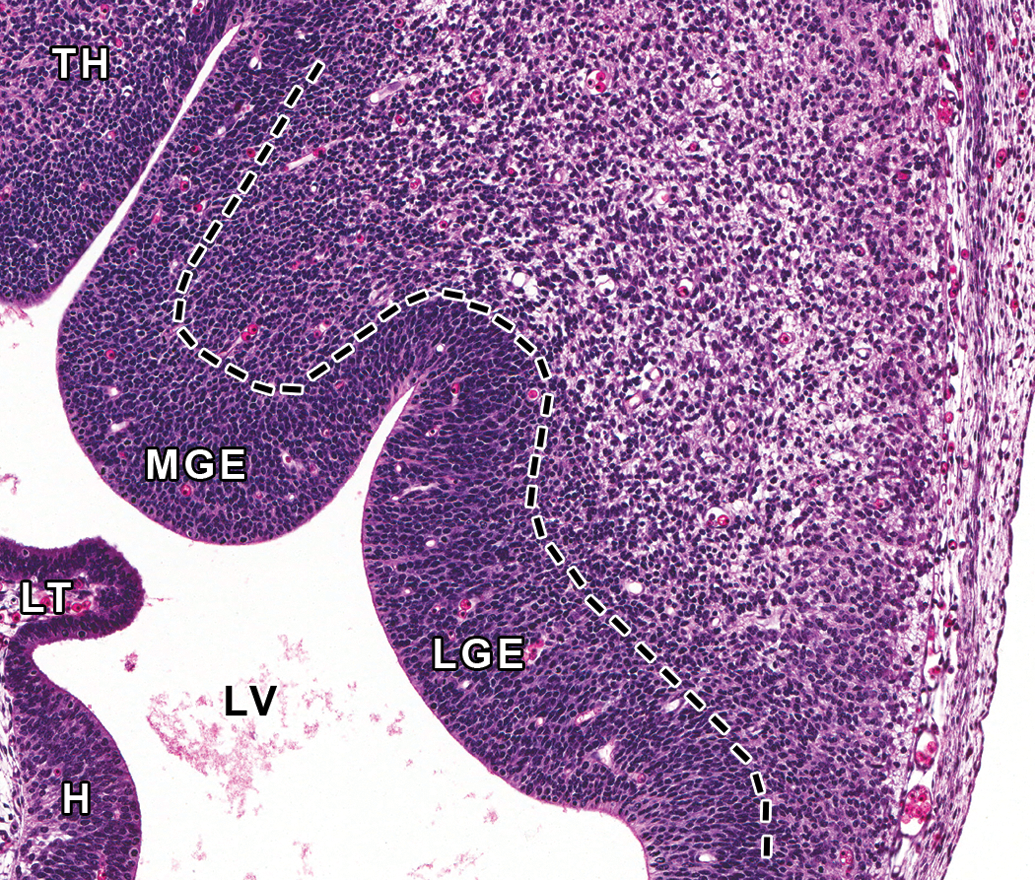
Representative image of forebrain ganglionic eminences at E12.5. Hematoxylin and eosin–stained, transverse section, high magnification of ganglionic eminences in Figure 6B. Ganglionic eminences are transitory, embryonic brain structures that protrude into the lateral ventricles (LV) of the ventral telencephalon and guide tangential migration of neural cells. The lateral ganglionic eminence (LGE) gives rise to the striatum (caudate and putamen dorsally, nucleus of accumbens and olfactory tubercle ventrally), and the medial ganglionic eminence (MGE) gives rise to the globus pallidus and contributes to the population of GABAergic (γ-aminobutyric acid-containing) interneurons and oligodendrocytes of the developing cerebral cortex and other telencephalic structures. The caudal eminence (not pictured) differentiates into the amygdaloid body. H = hippocampus; LT = lamina terminalis; TH = thalamus.
In the diencephalon at E11.0, the optic recess, or entrance to the optic stalk, is still apparent bilaterally off the ventral aspect of the third ventricle (Figure 13). At this age, the recess lumen is still patent through the optic stalk and extends into the eye between the layers of developing retina.
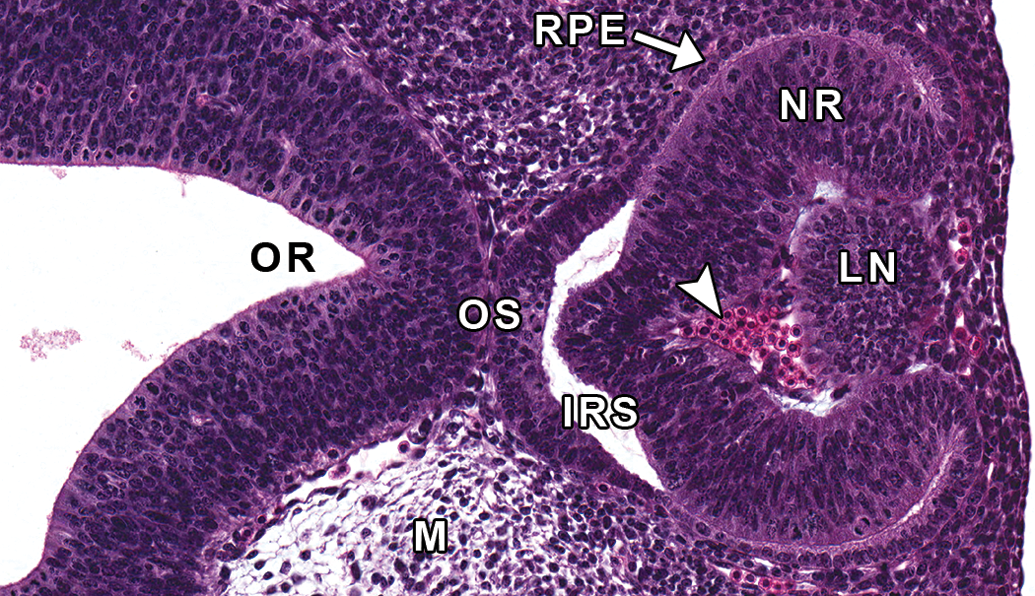
Representative image of the developing eye at E11.5. Hematoxylin and eosin–stained, transverse section. IRS = intraretinal space; LN = lens; M = mesenchyme; NR = neural retina; OR = optic recess; OS = optic stalk; RPE = retinal pigmented epithelium; arrowhead = nucleated red blood cells.
By E11.0, a distinct infundibular recess forms a downward projection from the third ventricular floor extending toward the pituitary gland (Figure 8A). Moreover, several CN ganglia are apparent at this stage: trigeminal (CN V) ganglia, facio-acoustic (CN VII/VIII) ganglion complex, proximal and distal glossopharyngeal (CN IX) ganglia, and proximal and distal vagal (CN X) ganglia (Kaufman 1992; Figure 14).
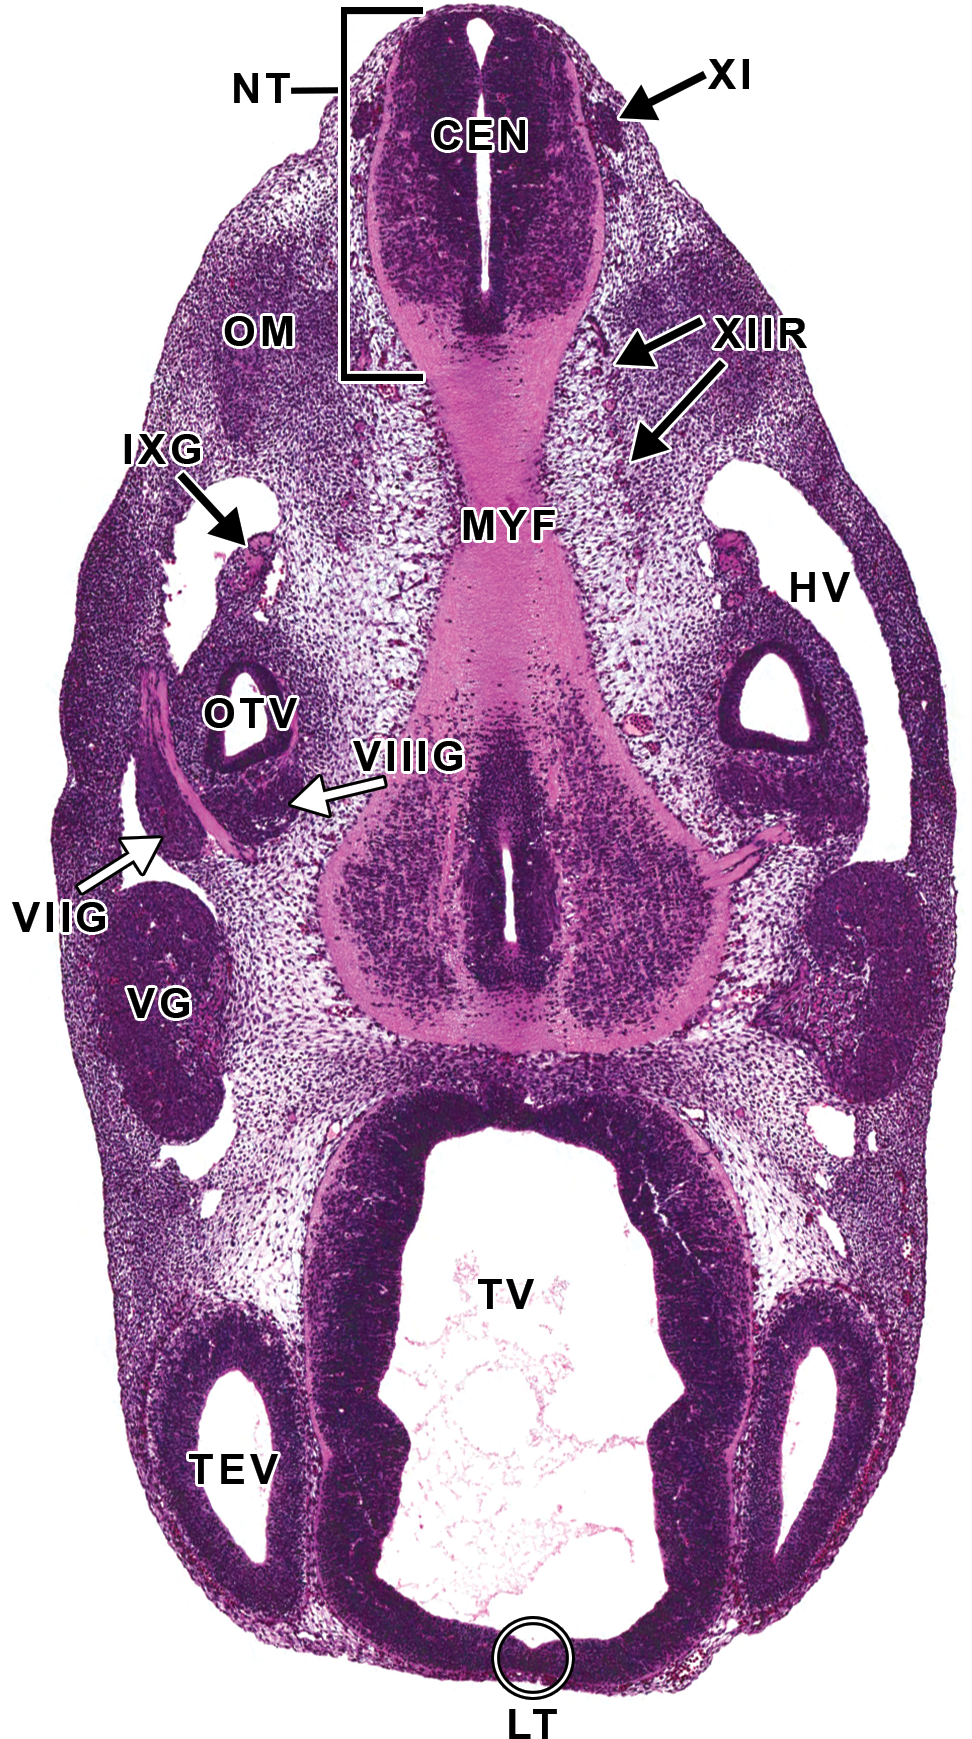
Representative image of several cranial nerve (CN) ganglia and CNs at E11.5. Hematoxylin and eosin–stained, transverse section. CEN = central canal of the spinal cord; HV = head vein; IXG = cranial nerve IX (glossopharyngeal) ganglion; LT = lamina terminalis; MYF = myencephalon floor; NT = neural tube; OM = occipital myotome; OTV = otic vesicle; TEV = telencephalic vesicle; TV = third ventricle; VG = cranial nerve V (trigeminal) ganglion; VIIG = cranial nerve VII (facial) ganglion; VIIIG = cranial nerve VIII (vestibulocochlear) ganglion; XI = cranial nerve XI (accessory); XIIR = cranial nerve XII (hypoglossal) rootlets.
In the spinal cord, differentiation of motor neurons and sensory neurons has been initiated by E11.0 in the ventral and dorsal horns, respectively, and will continue through approximately E12. Motor neuron differentiation precedes sensory neuron differentiation (Rodier 1980).
E11.5 to E12.0 (TS19–TS20, 45–51 Somites)
By E11.5, the rapid expansion of the brain results in the formation of larger and more defined subdivisions (Theiler 1989). The neuroectoderm continues its differentiation by segregation into morphologically distinct ependymal, mantle, and marginal layers. As previously mentioned, the mantle and marginal layers are demonstrated best in the spinal cord and brainstem, which functions as a rostral extension of the spinal cord, while the cerebral neocortex displays the least differentiation into layers at this stage (Figure 7B). In Figure 9A and B, the neural tube is characterized by a broad inner ependymal layer and an intermediate mantle layer (i.e., future ventral horn gray matter) located adjacent to the floor plate. The ependymal layer still constitutes the majority of the neural tube thickness but becomes less pronounced by E12.5 to E13. The outer marginal layer (future white matter tracts) in the spinal cord can be seen clearly in the ventral and lateral regions (Figure 9A, B). In the brain, these tissue layers originate similarly, but the definitive layout of the cerebrum (rostral brain), mesencephalon (midbrain), and the more caudally located hindbrain differs. Beginning around E14.0, the mantle layer neuroblasts in the brain migrate toward the periphery of the organ, so that in maturity, the gray matter is superficial to the white matter.
At E12.0, the telencephalic vesicles have continued their rapid expansion dorsolaterally and nearly cover the diencephalon by this stage (Figure 6A). In the diencephalon, the thalamus, hypothalamus, and epithalamus continue to enlarge and begin to exhibit regional differentiation into distinct nuclei (Figure 6B). The 2 halves of the thalamus nearly come to meet at the midline, with a concomitant decrease in third ventricle volume.
E12.5 to E13.0 (TS21–TS22, 52–55 Somites)
Forebrain
The medial, lateral, and caudal ganglionic eminences of the forebrain continue their rapid proliferation and expansion. The caudate nucleus, putamen, and amygdala are recognizable beginning at approximately E13.0 (Figure 15D). The globus pallidus lags the other basal nuclei slightly and does not begin to become apparent as a distinct structure until approximately E14 (Kaufman 1992).
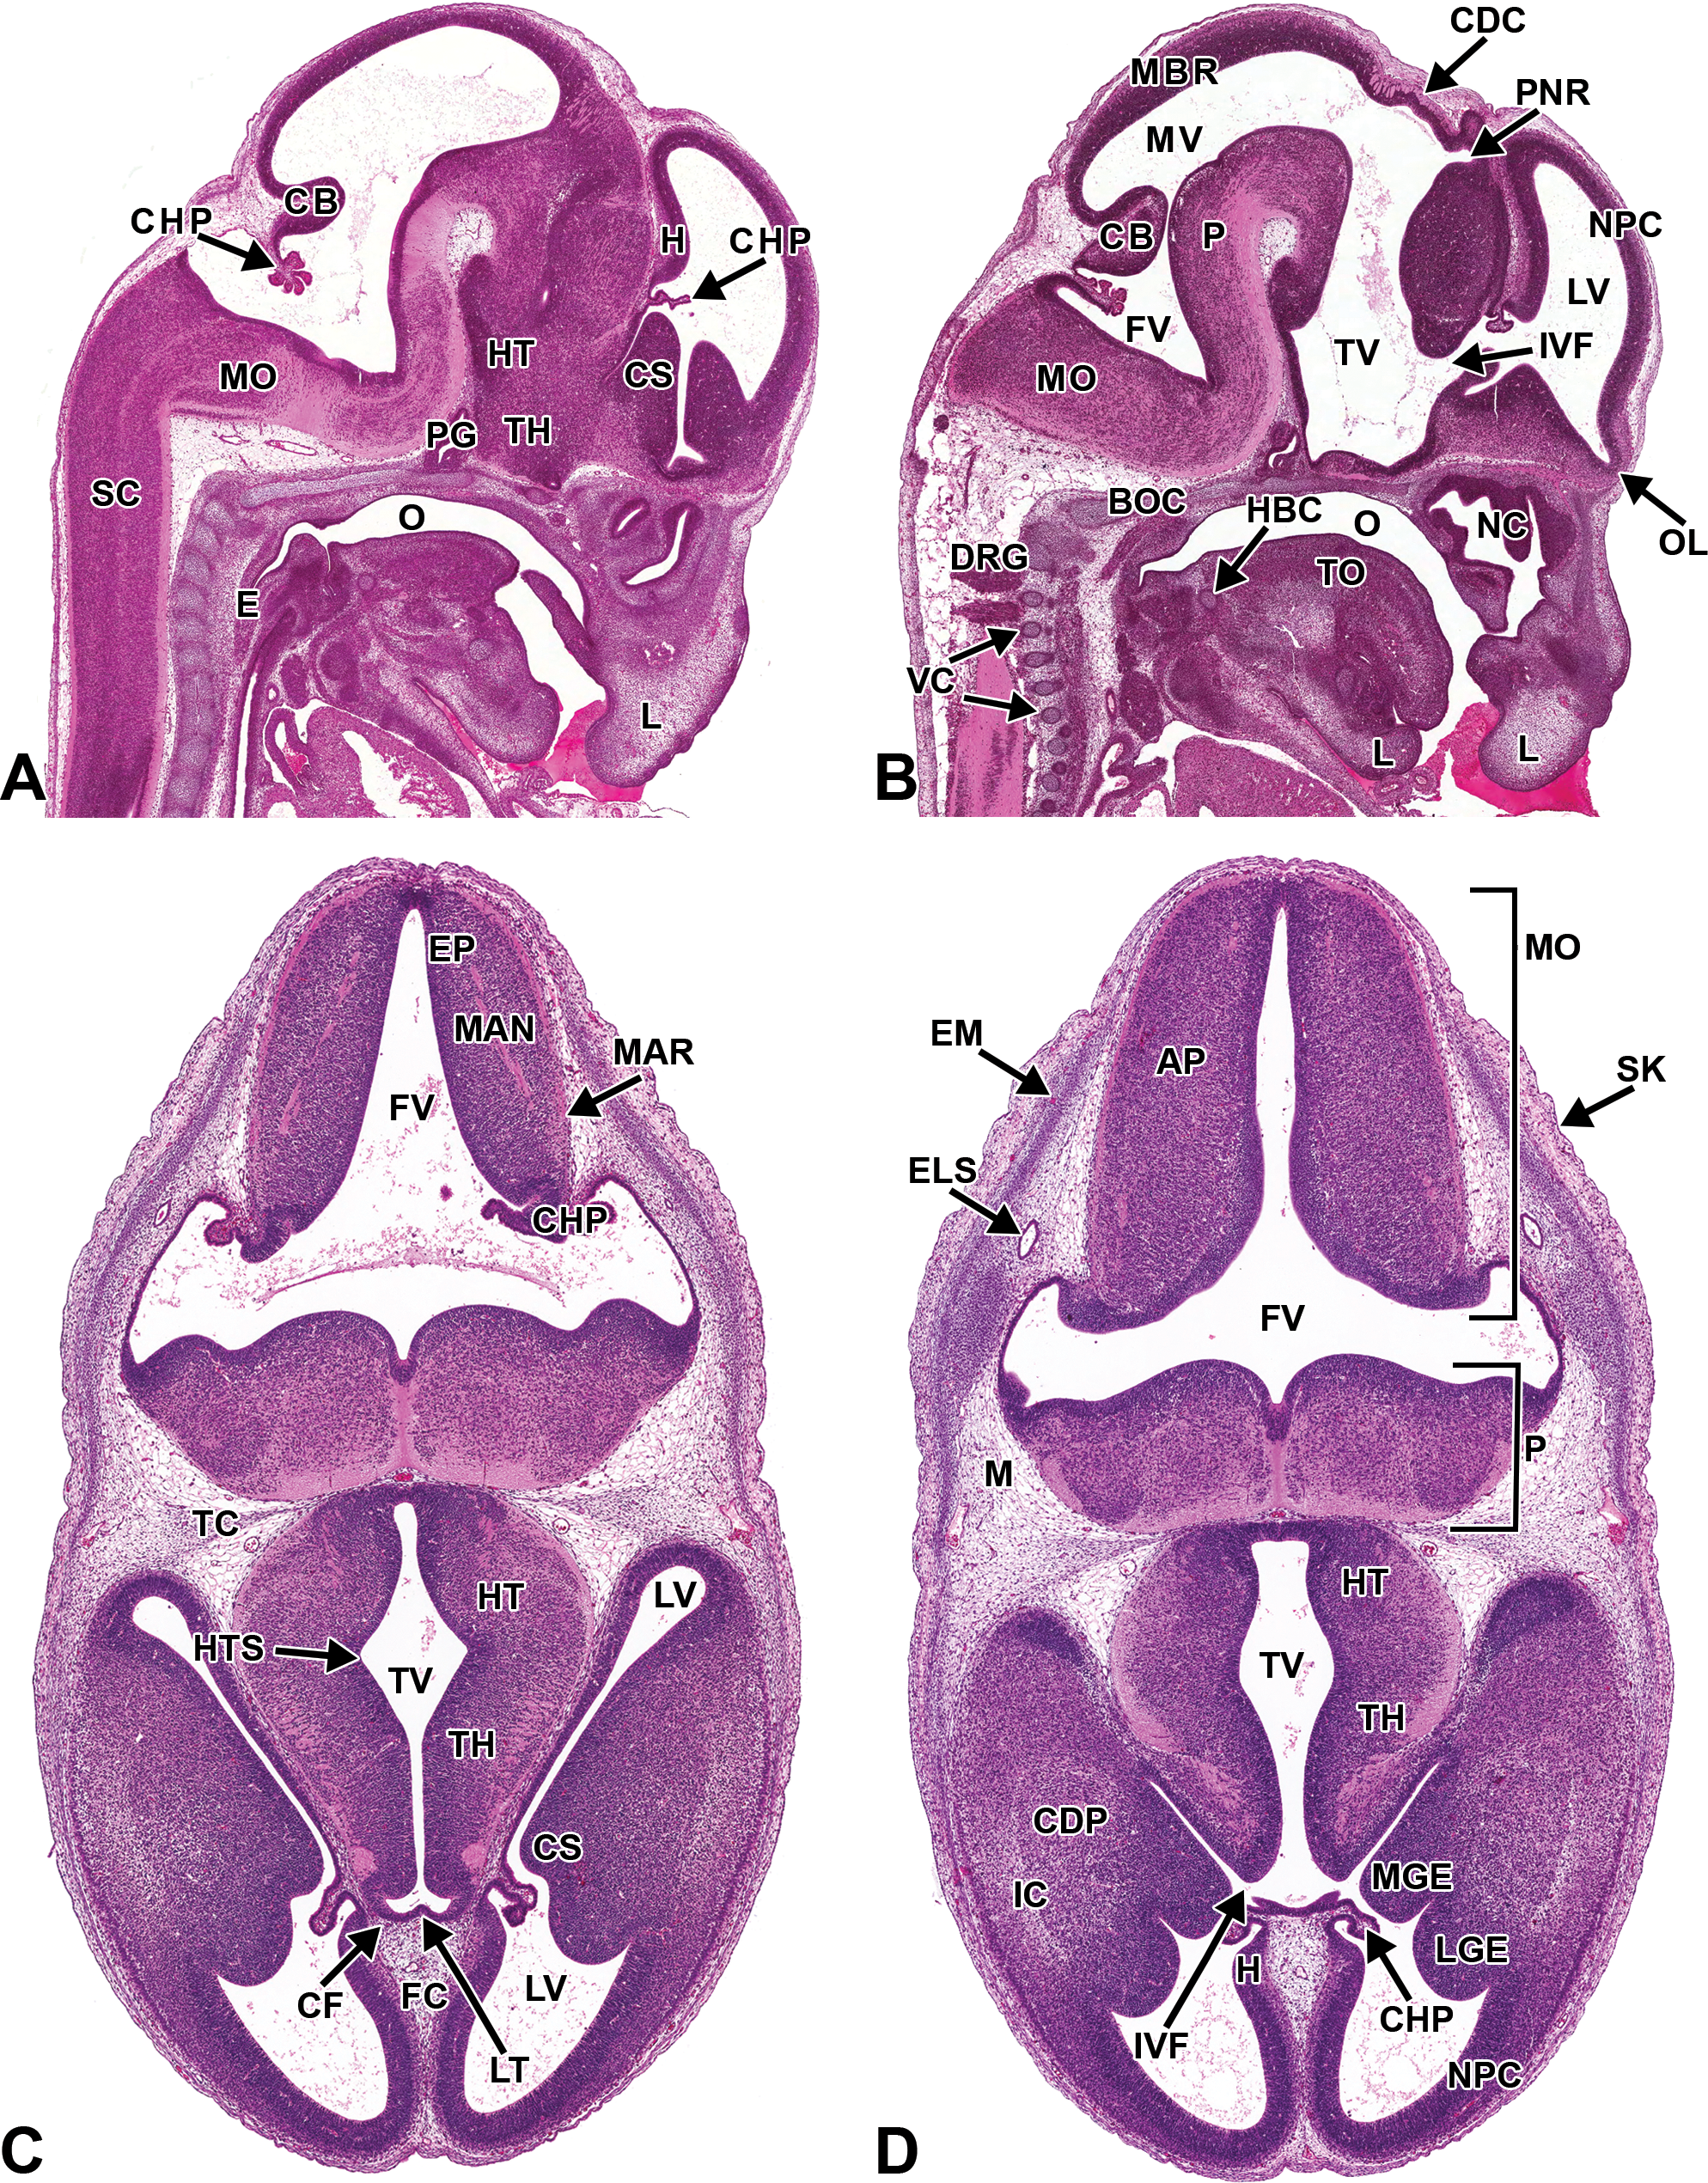
Representative images of the E13.5 mouse brain. Hematoxylin and eosin–stained sections. (A and B) Sagittal sections, medial to lateral. (C and D) Transverse sections, superficial to deep. AP = alar plate; BOC = basioccipital bone, cartilage primordium; CB = cerebellum; CDC = caudal commissure; CDP = caudate/putamen; CF = choroidal fissure; CHP = choroid plexus; CS = corpus striatum; DRG = dorsal root ganglion; E = esophagus; ELS = endolymphatic sac; EM = ectomeninx; EP = ependymal layer; FC = falx cerebri; FV = fourth ventricle; H = hippocampus; HT = hypothalamus; HTS = hypothalamic sulcus; IC = internal capsule; IVF = interventricular foramen; LGE = lateral ganglionic eminence; LT = lamina terminalis; LV = lateral ventricle; M = mesenchyme; MAN = mantle layer; MAR = marginal layer; MBR = midbrain roof; MGE = medial ganglionic eminence; MO = medulla oblongata; MV = mesencephalic vesicle; NC = nasal cavity; NPC = neopallial cortex; O = oropharynx; OL = olfactory lobe; P = pons; PG = pituitary gland; PNR = pineal recess; SC = spinal cord; TC = tentorium cerebelli; TH = thalamus; TO = tongue; TV = third ventricle; VC = vertebrae, cartilage primordium.
The pineal recess (Figure 15B) now is apparent as a discrete evagination in the caudal region of the roof of the third ventricle. The pineal primordium, which originates from the wall of the recess, is not evident until E13.5 to E14.5 (Kaufman 1992).
The first evidence of the choroid plexus arises at this stage. The hindbrain choroid plexus arises from both the roof (alar) plate (Figure 6B) and the rhombic lip (Hunter and Dymecki 2007; Awatramani et al. 2003). The hypothalamus and thalamus continue to enlarge in the diencephalon (Figures 6B and 15C, D). The caudal commissure is also becoming apparent immediately caudal to the pineal recess (Figure 15B). Further forward, the neocortex expands rostrally to overlie the olfactory epithelium in the roof of the primitive nasal cavity; this brain protrusion forms the future olfactory lobe of the brain (Figure 15B). Olfactory (CN I) nerves are evident as they pass from the multilayered olfactory epithelium in the caudodorsal nasal cavity through the cribriform plate of the ethmoid bone toward the olfactory cortex (Figure 16B; Kaufman 1992). Despite this early evidence of olfactory lobe differentiation, the olfactory bulbs are not yet histologically discernible from the rest of the neocortex. A narrow extension of the lateral ventricles extends into the future olfactory lobes. Although significant cellular differentiation is absent at this stage, the developing hippocampi are apparent bilaterally as focal bulges in the medial wall of the telencephalic vesicles (Figures 6B, 15A, D; Kaufman 1992). Pyramidal cell neurogenesis is initiating in the neocortex at this time and continues through E17 (Rodier 1980).
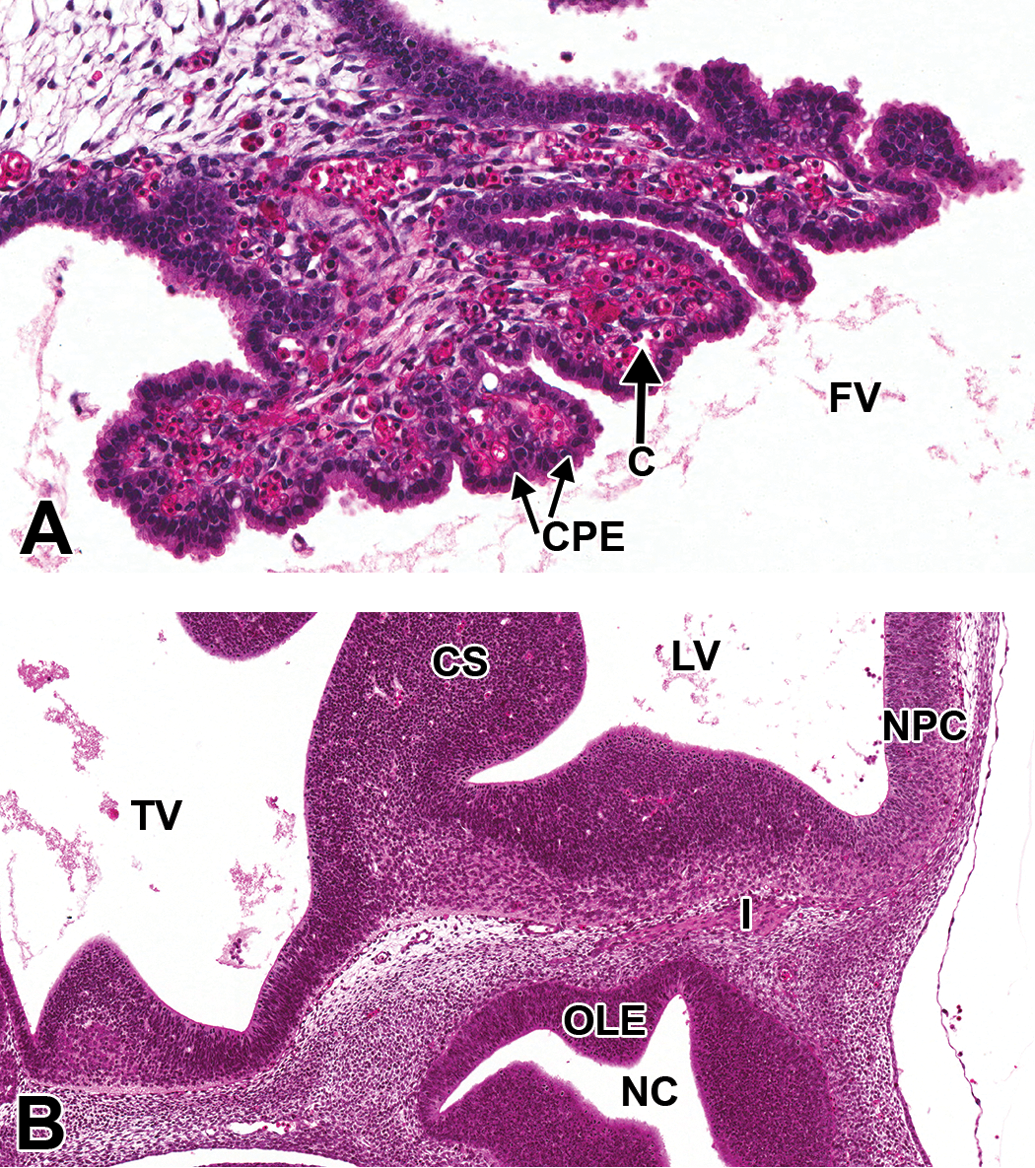
Representative images of choroid plexus and olfactory nerve in the E12.5 mouse brain. Hematoxylin and eosin–stained sections. (A) High magnification of the choroid plexus region in Figure 6B. (B) High magnification of Figure 6A, showing olfactory nerve (cranial nerve I) passing from the olfactory neuroepithelium of the nasal cavity toward the olfactory cortex. C = capillary; CPE = choroid plexus epithelial cell; CS = corpus striatum; FV = fourth ventricle; I = cranial nerve I (olfactory); LV = lateral ventricle; NC = nasal cavity; NPC = neopallial cortex; OLE = olfactory epithelium; TV = third ventricle.
At E13.0, the infundibular recess continues to differentiate, increasing in overall size but with a narrowing of its neck. This constricted zone is the region that is later identified as the stalk of the pituitary gland (Figure 8B). At this stage, the original contact between the roof of the oropharynx and Rathke’s pouch (from which it arose as a dorsal extension of the mucosal epithelium) is no longer present in most embryos. However, increased cellular proliferation and a vascular network derived from the plexus of the diencephalic floor are evident in Rathke’s pouch in the area of the future adenohypophysis.
Hindbrain
This stage of development is also distinguished by major morphological changes to the rhombencephalon (Kaufman 1992). In the metencephalon, the primordia of the cerebellum and pons, located dorsal and ventral to the fourth ventricle, respectively, enlarge and display early steps toward cellular differentiation. The cerebellum spans the roof and both lateral regions of the metencephalon, while the pons comprises the floor (Figure 15B). The dorsal part of the alar plate of the metencephalon is the intraventricular part of the developing cerebellar plate (Figure 15D). This VZ of the cerebellar plate gives rise to neuronal precursors that subsequently migrate dorsally into the cerebellar primordium, where they differentiate into Purkinje cells and the neurons of the deep cerebellar nuclei at approximately this developmental stage (range, E11–E13; Rodier 1980; Sotelo 2004; Wullimann 2011). Meanwhile, the myelencephalon differentiates more recognizably into the medulla oblongata.
Spinal cord
The VZ of the spinal cord diminishes in size and is gradually replaced by the mantle and marginal zones (Figure 17A, B). As the white and gray matter expand and differentiate, a concomitant decrease occurs in the size of the central canal. The parallel alar (sensory or dorsal) and basal (motor or ventral) plates are separated by a lateral groove (termed the sulcus limitans) in the surface of the central canal. Minimal regional differences in morphology exist between the cervical, thoracic, and lumbar levels of the spinal cord at this stage, the chief of which is the greater lateral expansion, especially in the ventral horn, of the cervical domain relative to the thoracic and lumbar divisions.
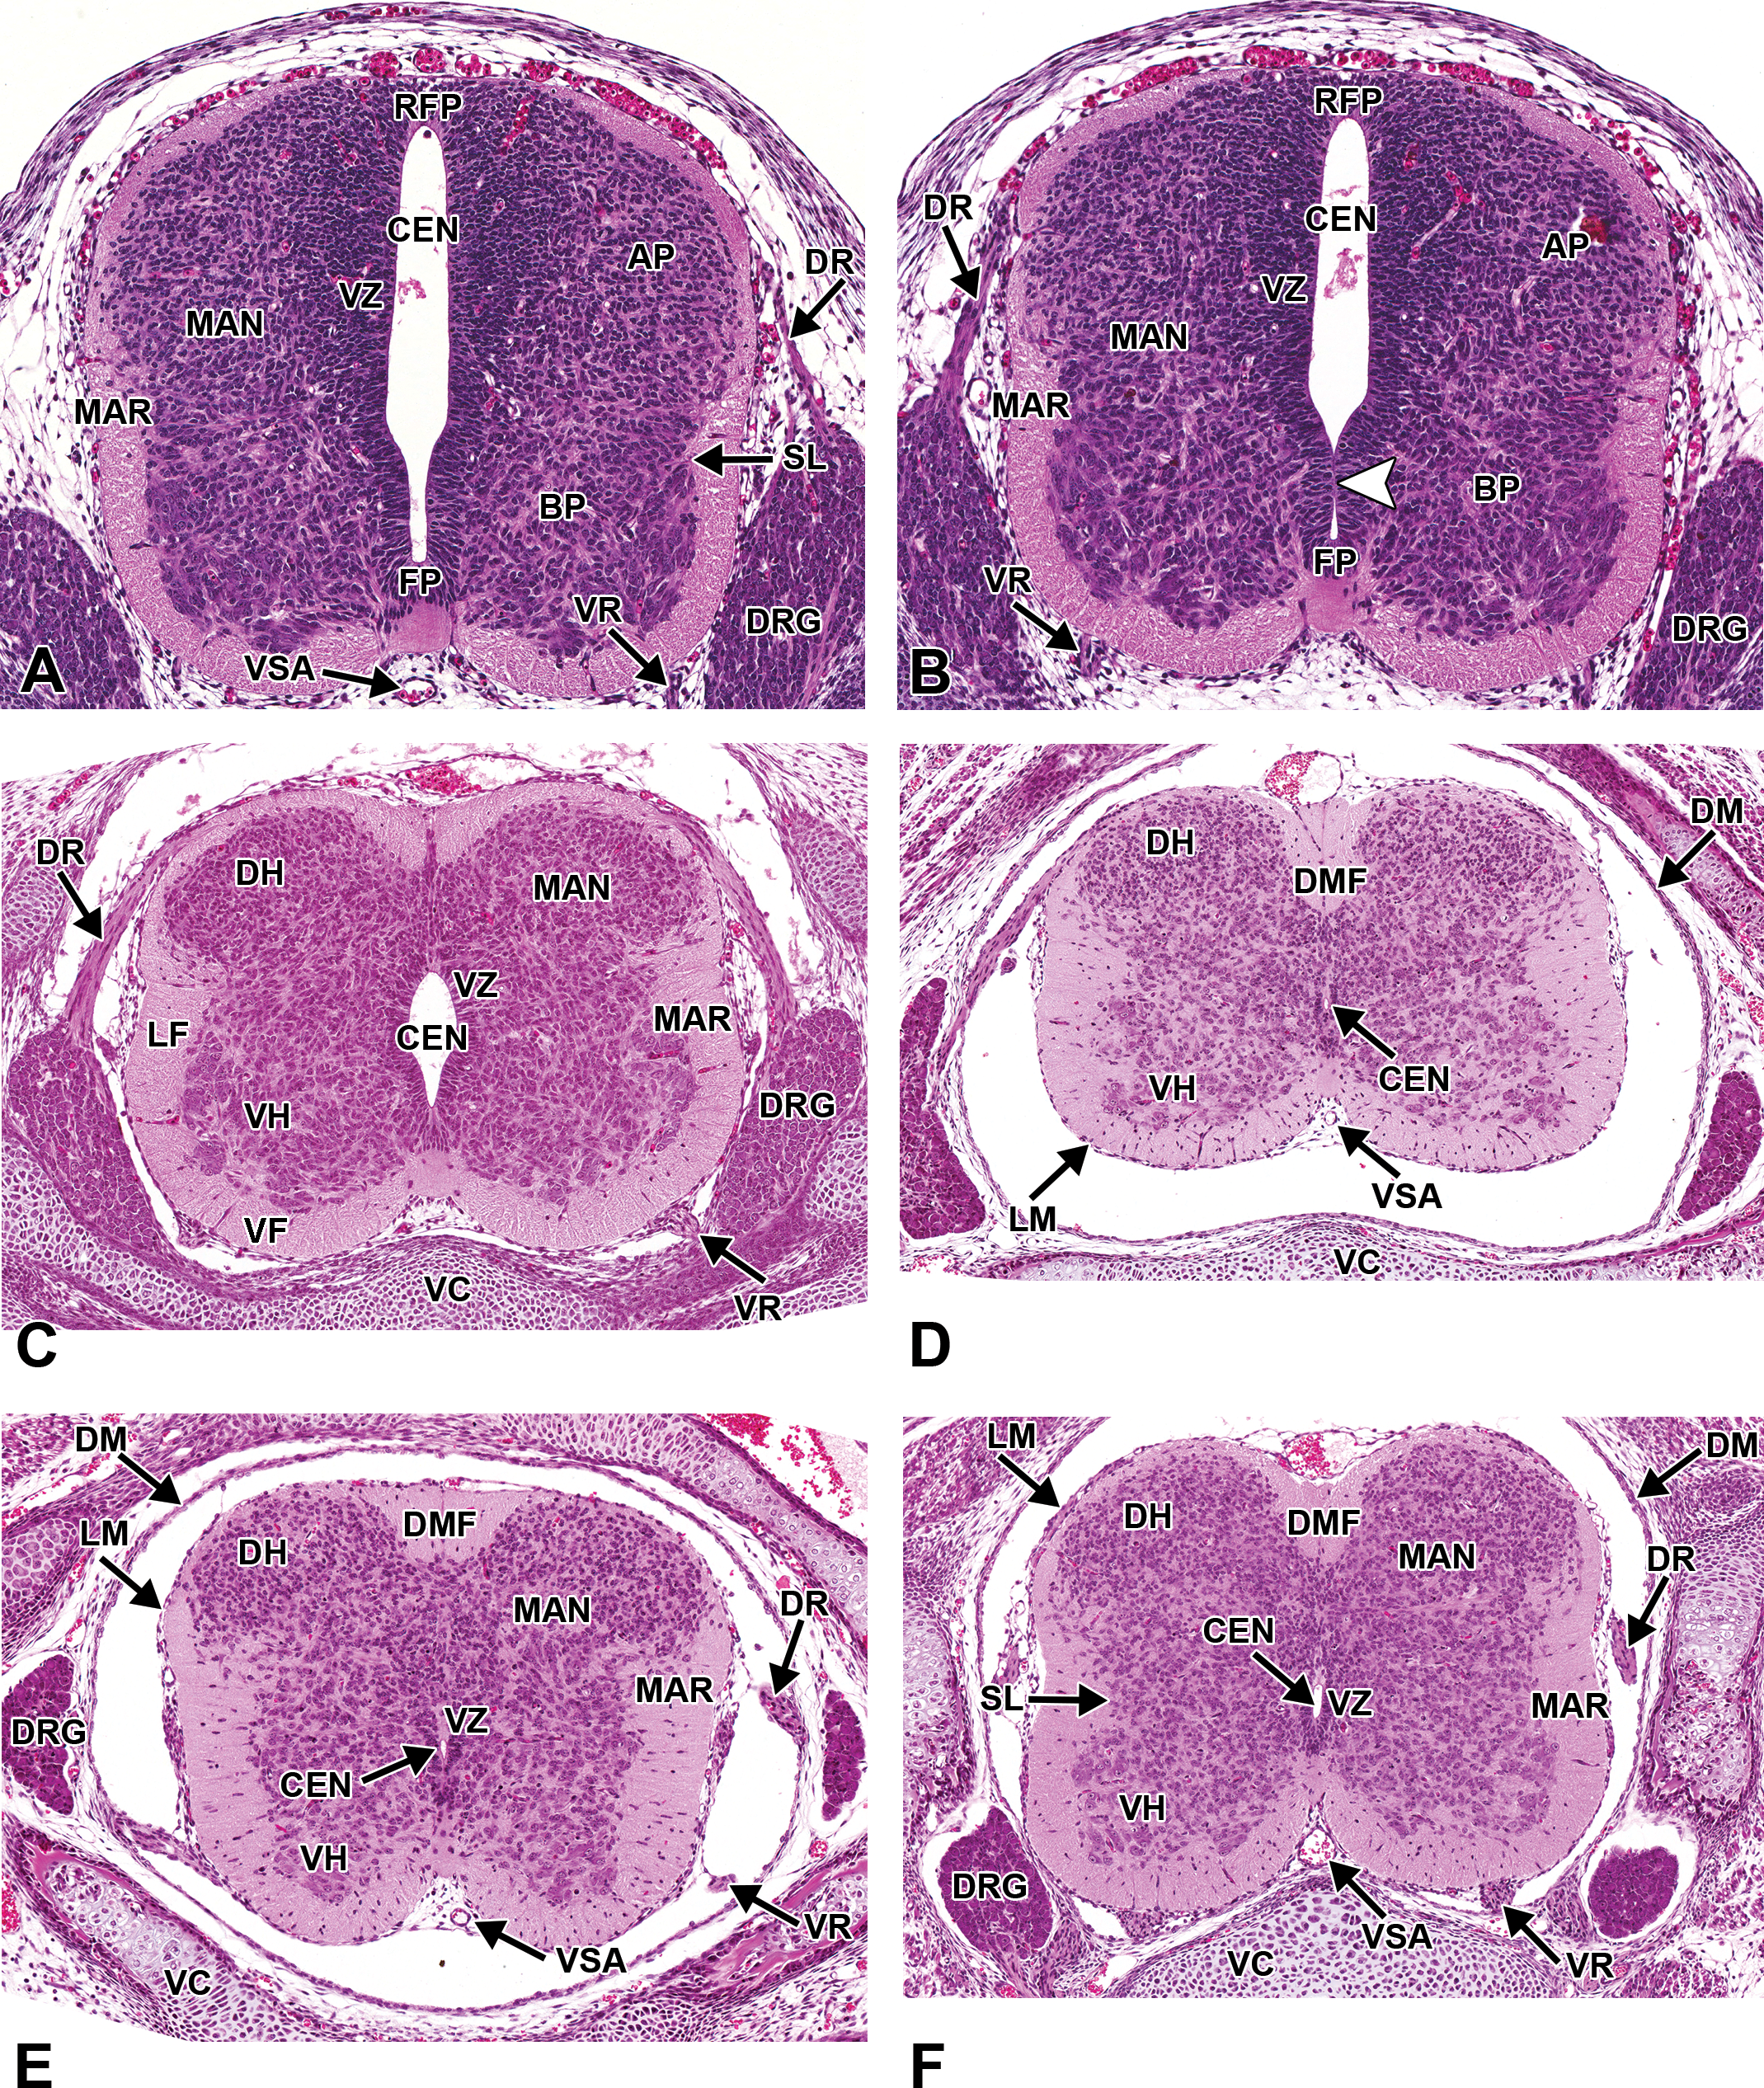
Representative images of the embryonic mouse spinal cord. Hematoxylin and eosin–stained, transverse sections. (A and B) E12.5. The mantle (MAN) and marginal (MAR) zones gradually replace a diminishing ventricular zone (VZ) of the spinal cord. Minimal regional differences in morphology exist among the cervical, thoracic, and lumbar levels of the spinal cord. The white arrowhead denotes a site of luminal occlusion. (C) E15.5. The gray column of the dorsal horn (DH) covers a larger cross-sectional area than the gray column of the ventral horn (VH), while the volume of the white matter increases steadily, especially in the ventral funiculus (VF) and lateral funiculus (LF). The dorsal root ganglia (DRG) are prominent along the entire dorsolateral length of the spinal cord. The central canal (CEN) continues to decrease in diameter. (D) E18.5, cervical spinal cord. (E) E18.5, mid-thoracic spinal cord. (F) E18.5, lumbar spinal cord. AP = alar plate; BP = basal plate; DM = dura mater; DMF = dorsal median fissure; DR = dorsal nerve root; FP = floor plate; LM = leptomeninges; RFP = roof plate; SL = sulcus limitans; VC = vertebrae, cartilage primordium; VR = ventral root; VSA = ventral spinal artery.
E13.5 to 15.5 (TS22–TS24, 56 to 60+ somites)
Forebrain
By E13.0, the wall of the telencephalic vesicles is bilaminar, composed of a VZ and overlying primitive preplate (Figure 7C). By E13.5 to E14.0, stratification of the walls of the cerebral cortex is becoming apparent as the cortical neuroectoderm undergoes the early stages of differentiation. The cortical layering results from the migration of neuroblasts from the ependymal layer (i.e., VZ and Subventricular zone [SVZ]) radially into the overlying marginal zone to form superficial layers of nucleated cells, referred to as the cortical plate and subplate (Figure 7D). These layers are separated from the residual underlying VZ and SVZ by a relatively anuclear layer, called the intermediate zone (i.e., the fiber layer), which is composed of cellular processes and transient migrating cells (Molnar et al. 2006; Rash and Grove 2006). The cortical plate progressively enlarges and becomes more densely cellular throughout the remaining period of gestation due to continued entry of migrating neuroblasts, and eventually glioblasts, that originate from the VZ and SVZ. The 6 layers of the cerebral cortex form in an “inside-out” fashion, with earlier migrating neurons forming the deepest layers and later migrating neurons forming successively more superficial layers of the cortex (Hicks and D’Amato 1968; Austin and Cepko 1990). The excitatory glutaminergic cortical projection neurons, which comprise roughly 80% of the total cortical neuronal population in the rodent (Molnar et al. 2006; Corbin, Nery, and Fishell 2001; Lodato and Arlotta 2015), originate through radial migration from the VZ as described above. However, neuroblasts from the medial ganglionic eminences migrate tangentially through the developing cerebral cortex to form an equally important population, the GABAergic inhibitory interneurons (Parnavelas 2000; Corbin, Nery, and Fishell 2001). Cortical neuronogenesis is sustained over several days in the mouse (E11–E17) as the different cerebrocortical neuronal layers are formed (Rodier 1980; Finlay and Darlington 1995). Tubulin can be a useful immunohistochemical marker to highlight neurons after they begin to differentiate (Online Supplemental Figures 9 and 10).
The mantle and marginal zones of the developing hippocampus are considerably more distinct at this stage and form a small bulge in the medial wall of the telencephalic vesicles. The characteristic granule and pyramidal cell layers of the mature hippocampus are not yet apparent (Figure 18A, B). At the rostral extent of the telencephalic vesicles, the olfactory lobes are becoming more distinct, particularly toward the end of this period (E15–15.5; Figure 19). A rostral extension of the lateral ventricles extends bilaterally into the developing olfactory bulbs and is prominent at this stage (Figure 19). This ventricular extension decreases in size until it ultimately forms only a potential space in the adult animal, yet it continues to function as a conduit along which a column of neuronal precursors (termed the “rostral migratory stream”) journey from the SVZ of the lateral ventricles to the olfactory bulbs in adult animals (Corbin, Nery, and Fishell 2001).
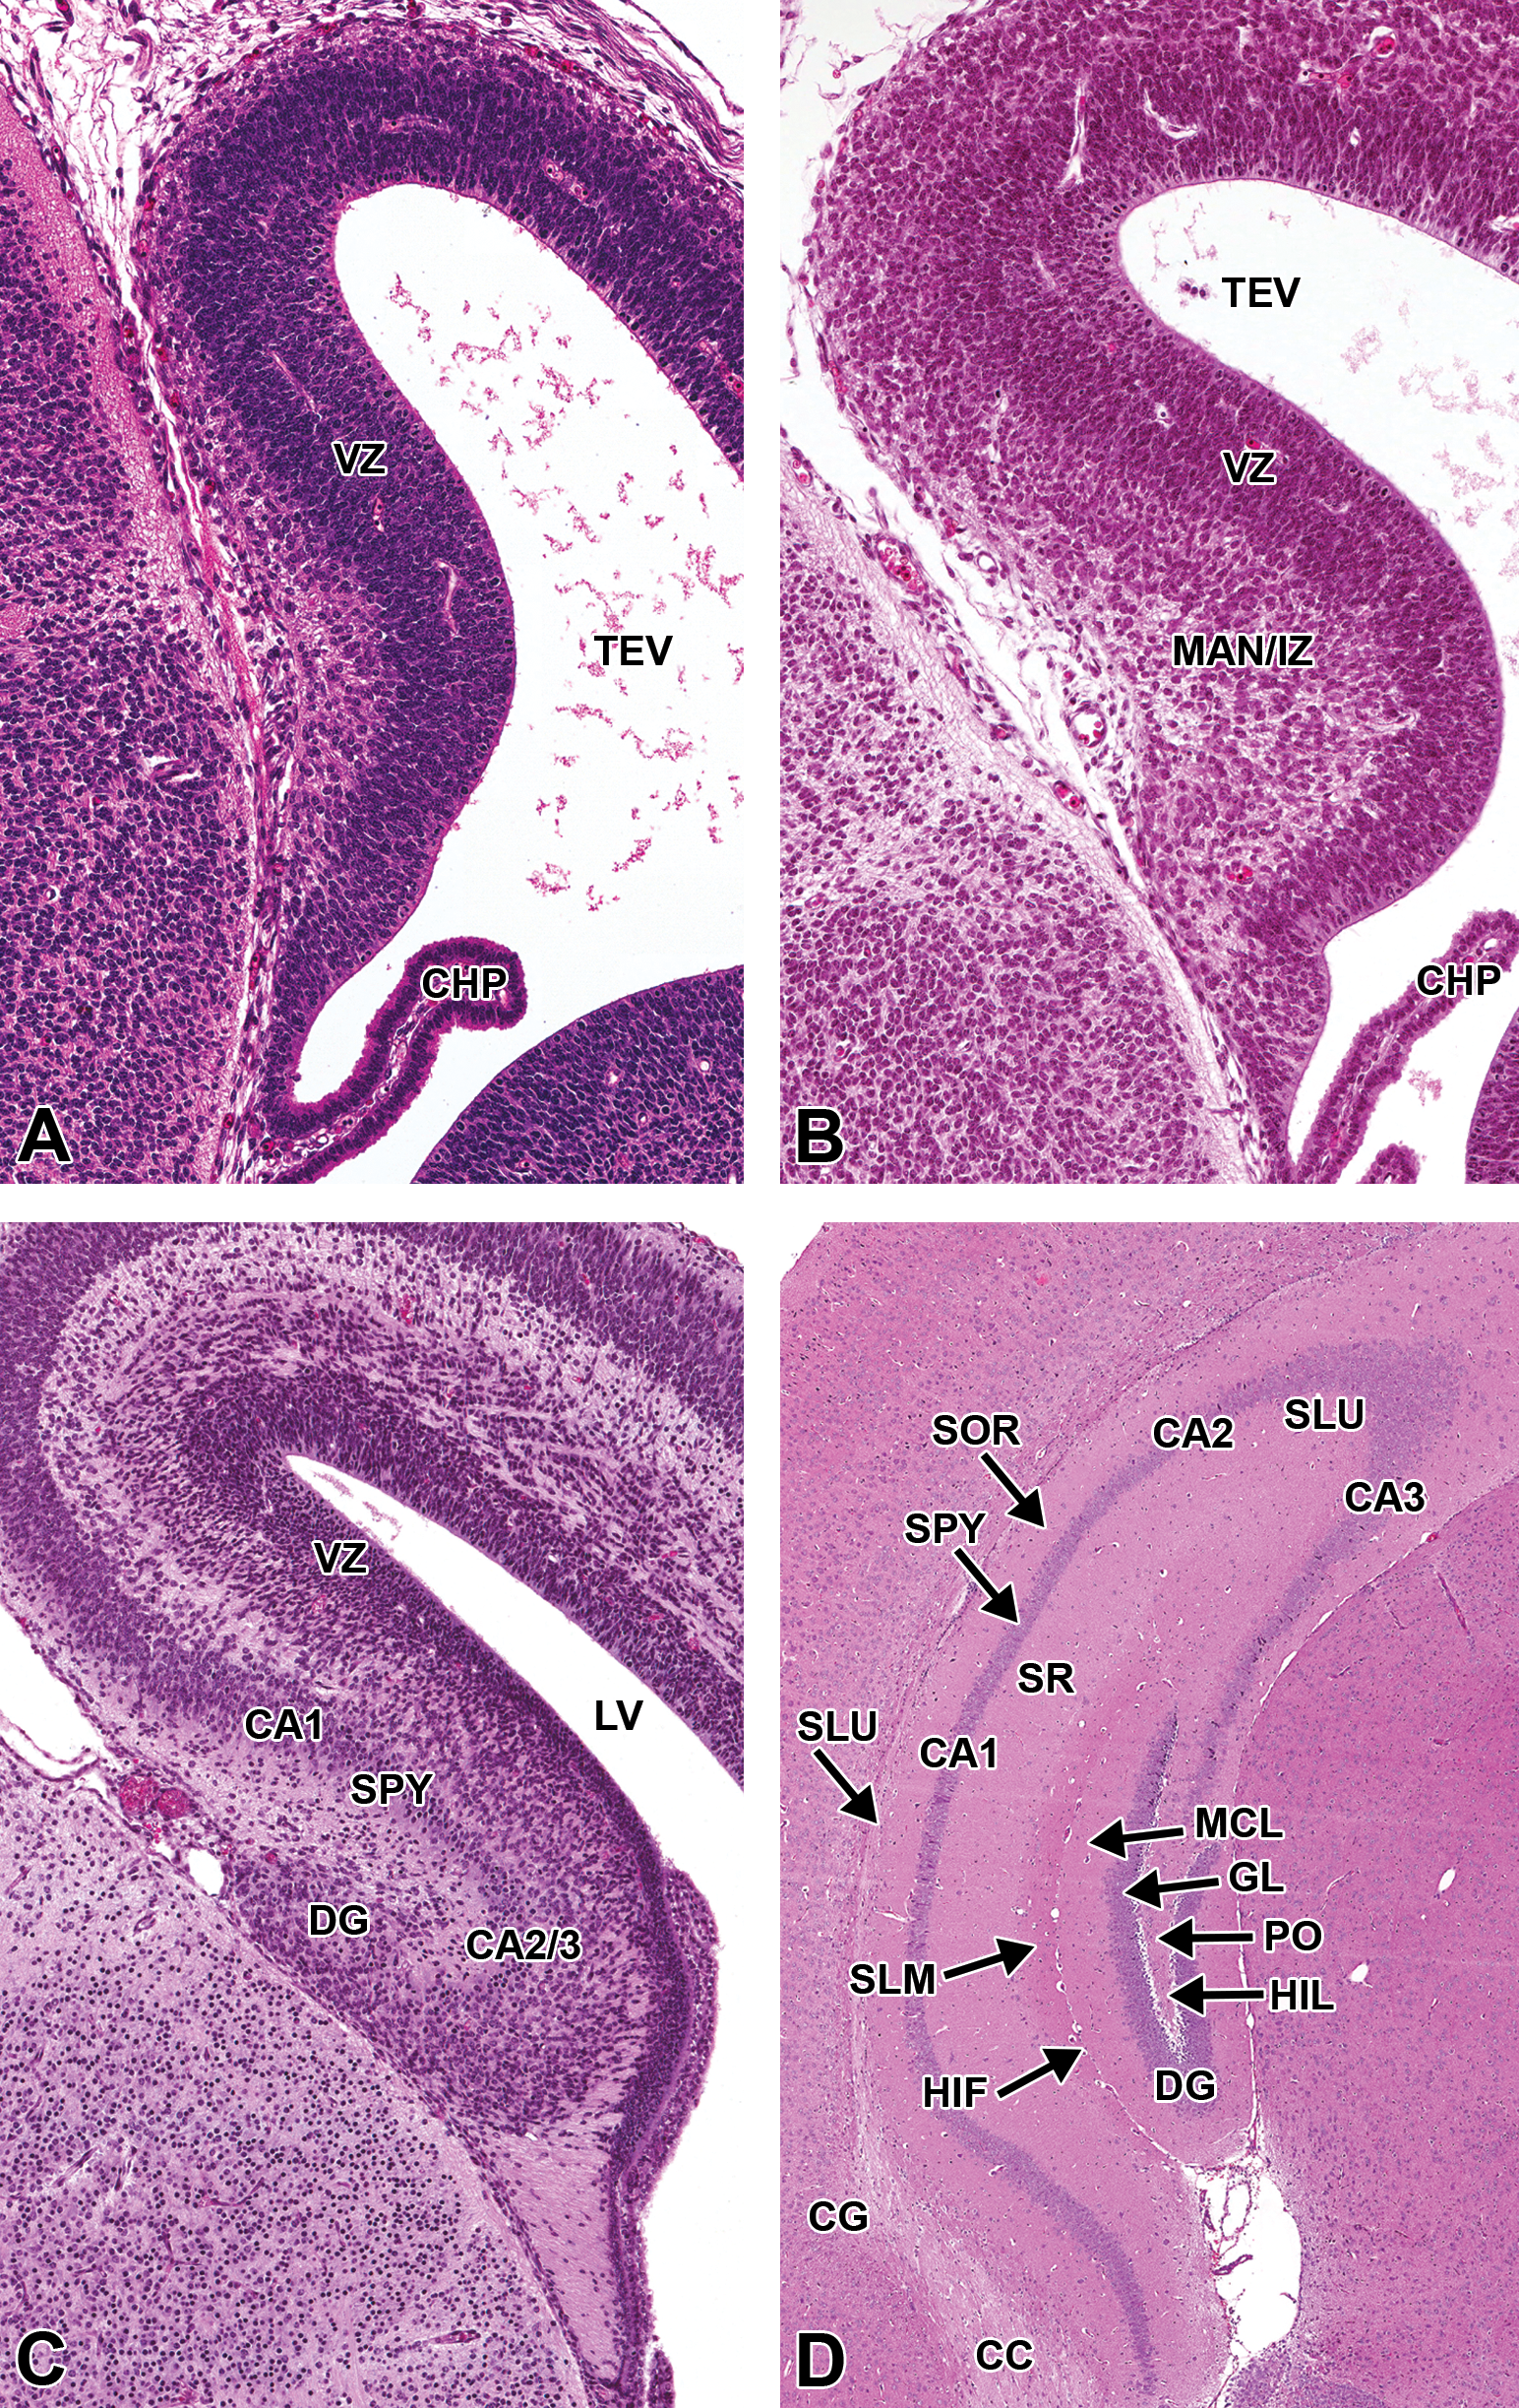
Representative images of the embryonic mouse hippocampus during brain development. Hematoxylin and eosin–stained, coronal sections. (A) E13.5. (B) E15.5. (C) E17.5. (D) P21. CA1-3 = cornu ammonis 1-3; CC = corpus callosum; CG = cingulated cortex; CHP = choroid plexus; DG = dentate gyrus; GL = granular cell layer; HIF = hippocampal fissure; HIL = hilus; LV = lateral ventricle; MAN/IZ = mantle layer/intermediate zone; MCL = molecular cell layer; PO = polymorph layer; SLM = stratum lacunosum-moleculare; SLU = stratum lucidum; SOR = stratum oriens; SPY = stratum pyramidale; SR = stratum radiatum; TEV = telencephalic vesicle; VZ = ventricular zone.
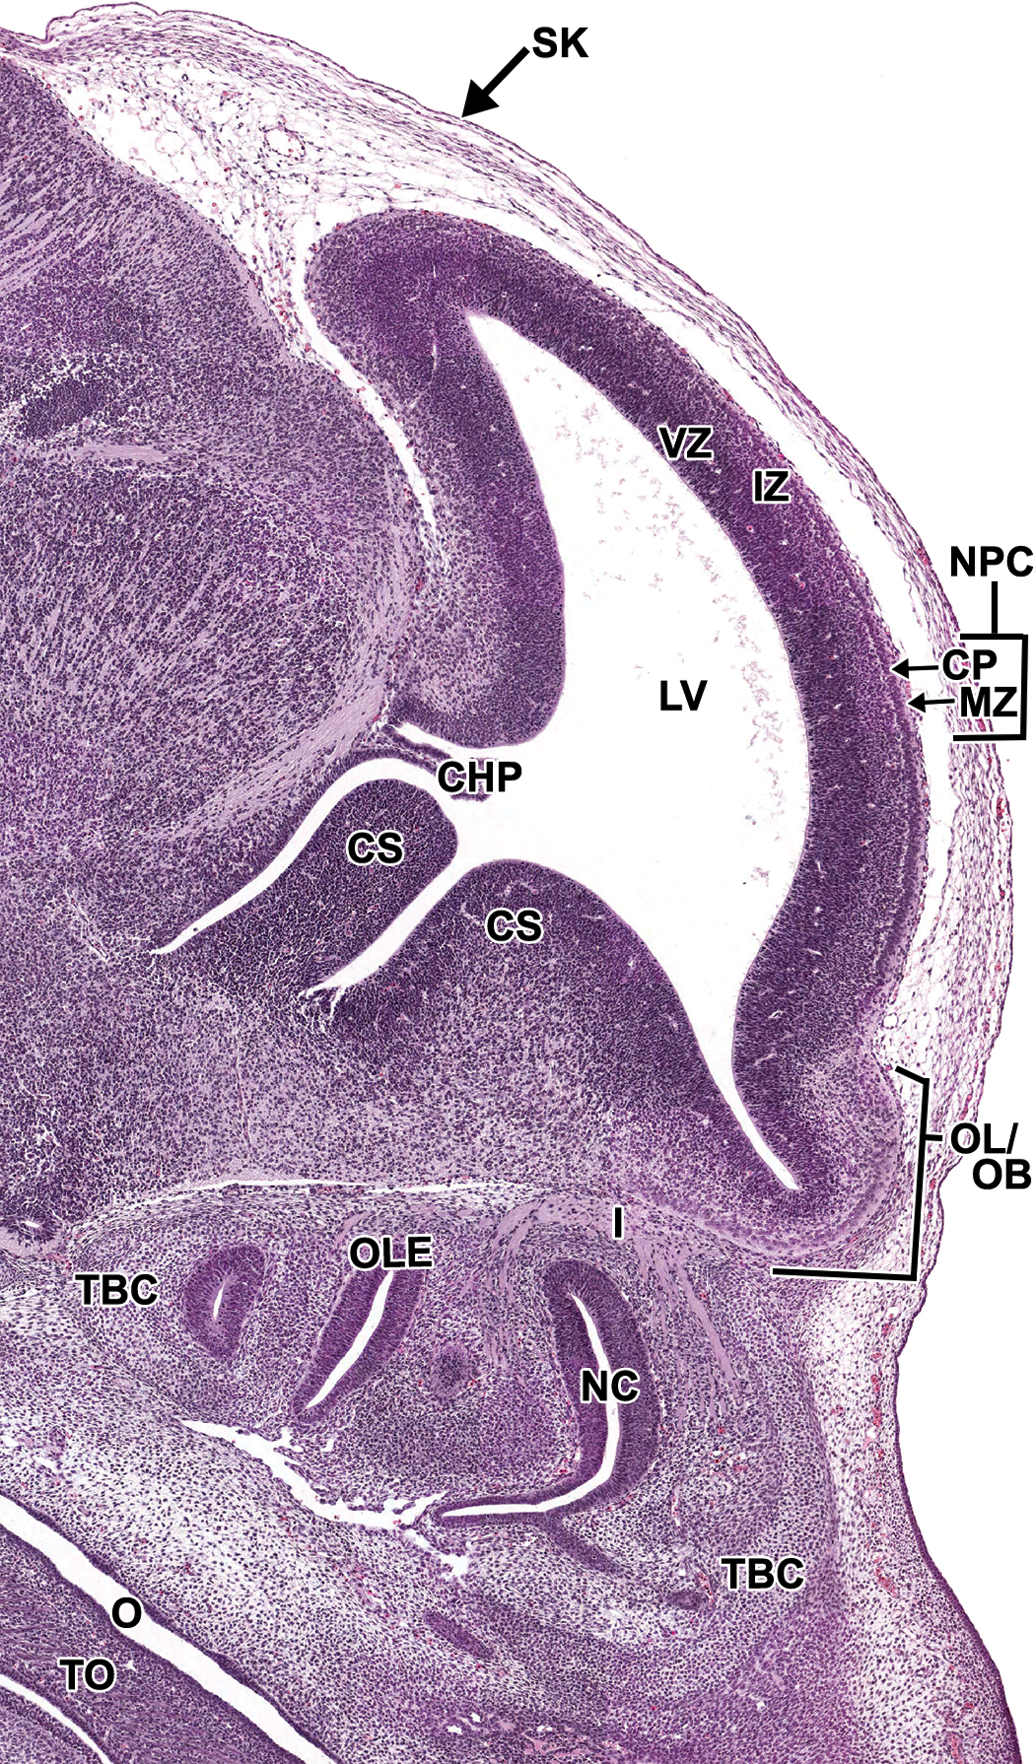
Representative image of the embryonic forebrain at E15.5. Hematoxylin and eosin–stained, sagittal section. CHP = choroid plexus; CP = cortical plate; CS = corpus striatum; I = cranial nerve I (olfactory) IZ = intermediate zone; LV = lateral ventricle; MZ = marginal zone; NC = nasal cavity; NPC = neopallial cortex; O = oropharynx; OL/OB = olfactory lobe/olfactory bulb; OLE = olfactory epithelium; TBC = turbinate bone, cartilage primordium; VZ = ventricular zone.
The choroid plexus in the lateral ventricles of the telencephalon and the fourth ventricle of the myelencephalon is extensive at this stage. The choroid plexus of the fourth ventricle is the most abundant (Figure 20; Kaufman 1992). Expansion of the plexus extends to all sites in which it is found in the adult by E16.5.
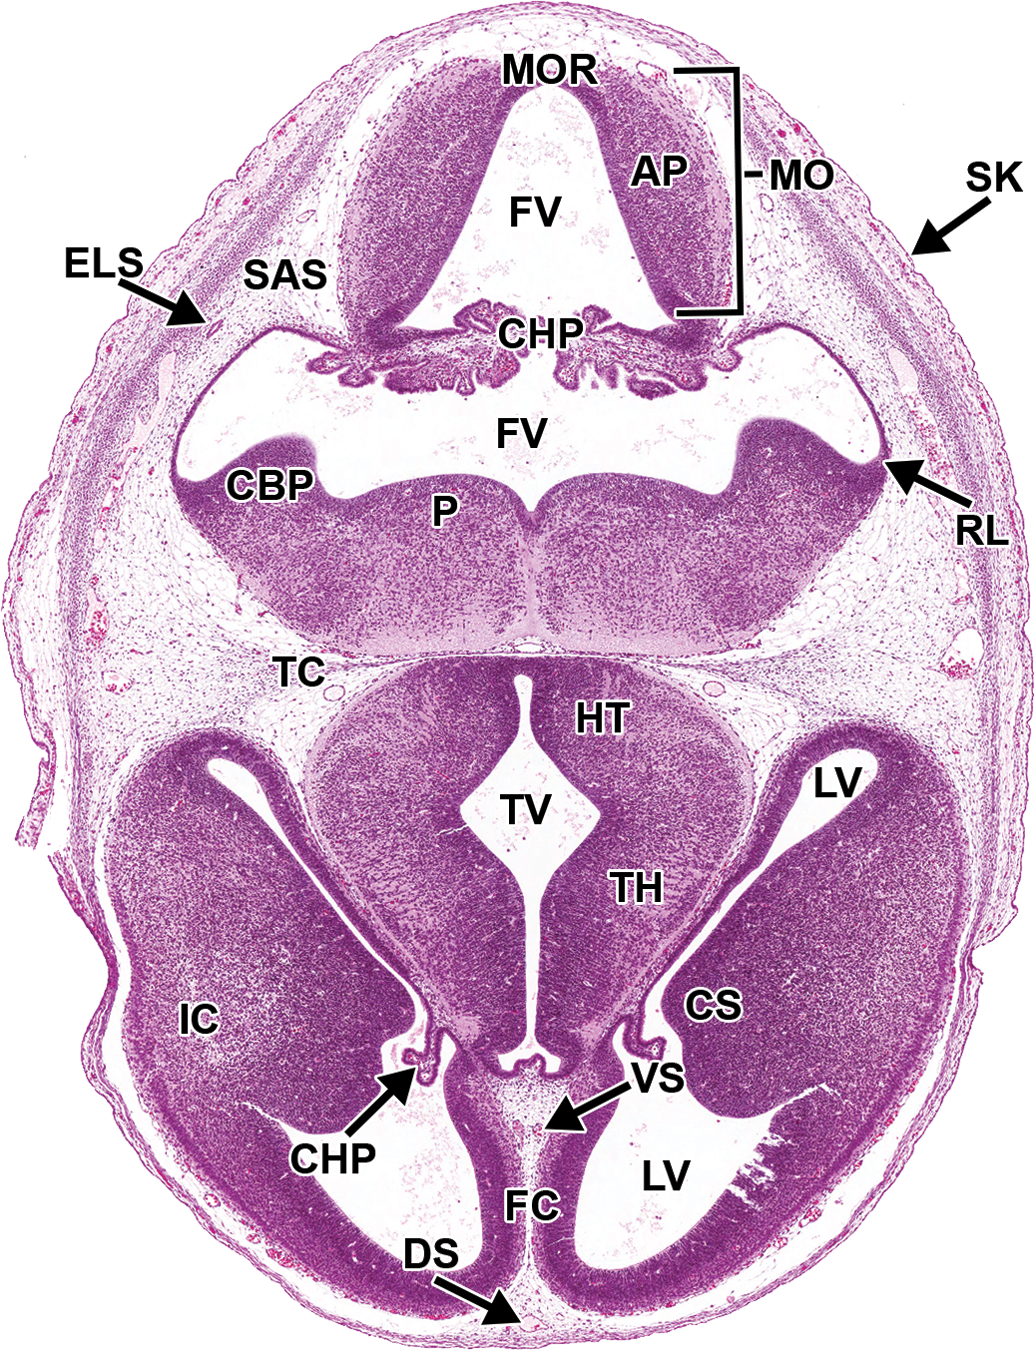
Representative image of the embryonic mouse brain at E14.5. Hematoxylin and eosin–stained, transverse section. AP = alar plate; CBP = cerebellar primordium; CHP = choroid plexus; CS = corpus striatum; ELS = endolymphatic sac; FC = falx cerebri; FV = fourth ventricle; HT = hypothalamus; IC = internal capsule; LV = lateral ventricle; MO = medulla oblongata; MOR = medulla oblongata roof; P = pons; RL = rhombic lip; SAS = subarachnoid space (future); TC = tentorium cerebelli; TH = thalamus; TV = third ventricle.
By E14.0, the pituitary gland is readily apparent. The lumen of the remnant of Rathke’s pouch is still large. The stalk connecting the pouch to the oropharynx may still be apparent early in this time period in some animals, although it begins to narrow at E13.5 and typically disappears by E14.5. Meanwhile, the opening into the infundibular recess of the third ventricle also narrows, forming the pituitary stalk and neurohypophysis (Figure 8C). By E15.5, the lumen of the neurohypophysis disappears. Moreover, the rostrolateral extensions of Rathke’s pouch have almost enveloped the pituitary stalk, forming the pars tuberalis (the narrow dorsal part of the adenohypophysis).
Hindbrain
By E15.0, the alar lamina (i.e., rhombic lip) of the metencephalon has increased dramatically in size and, as a result, impinges on the lateral recesses of the fourth ventricle (Figure 20). This region gives rise to diverse populations of neurons, including the cerebellar granule cell (GC) precursors that form the external granular cell layer (EGL) as well as the pontine and olivary neurons (Wullimann et al. 2011). The cerebellar anlage (i.e., primordium) increasingly is differentiated, with the EGL and deep cerebellar nuclei becoming apparent at this stage (Figure 21A, B). As in many other vertebrates and especially compared to other neurologic structures, cerebellar maturation is a relatively late event in rodents. The foliation pattern is fairly primitive until P2 and does not assume complete maturity until approximately P15 (Figure 21E, F; Sotelo 2004; Corrales et al. 2006; Sudarov and Joyner 2007).
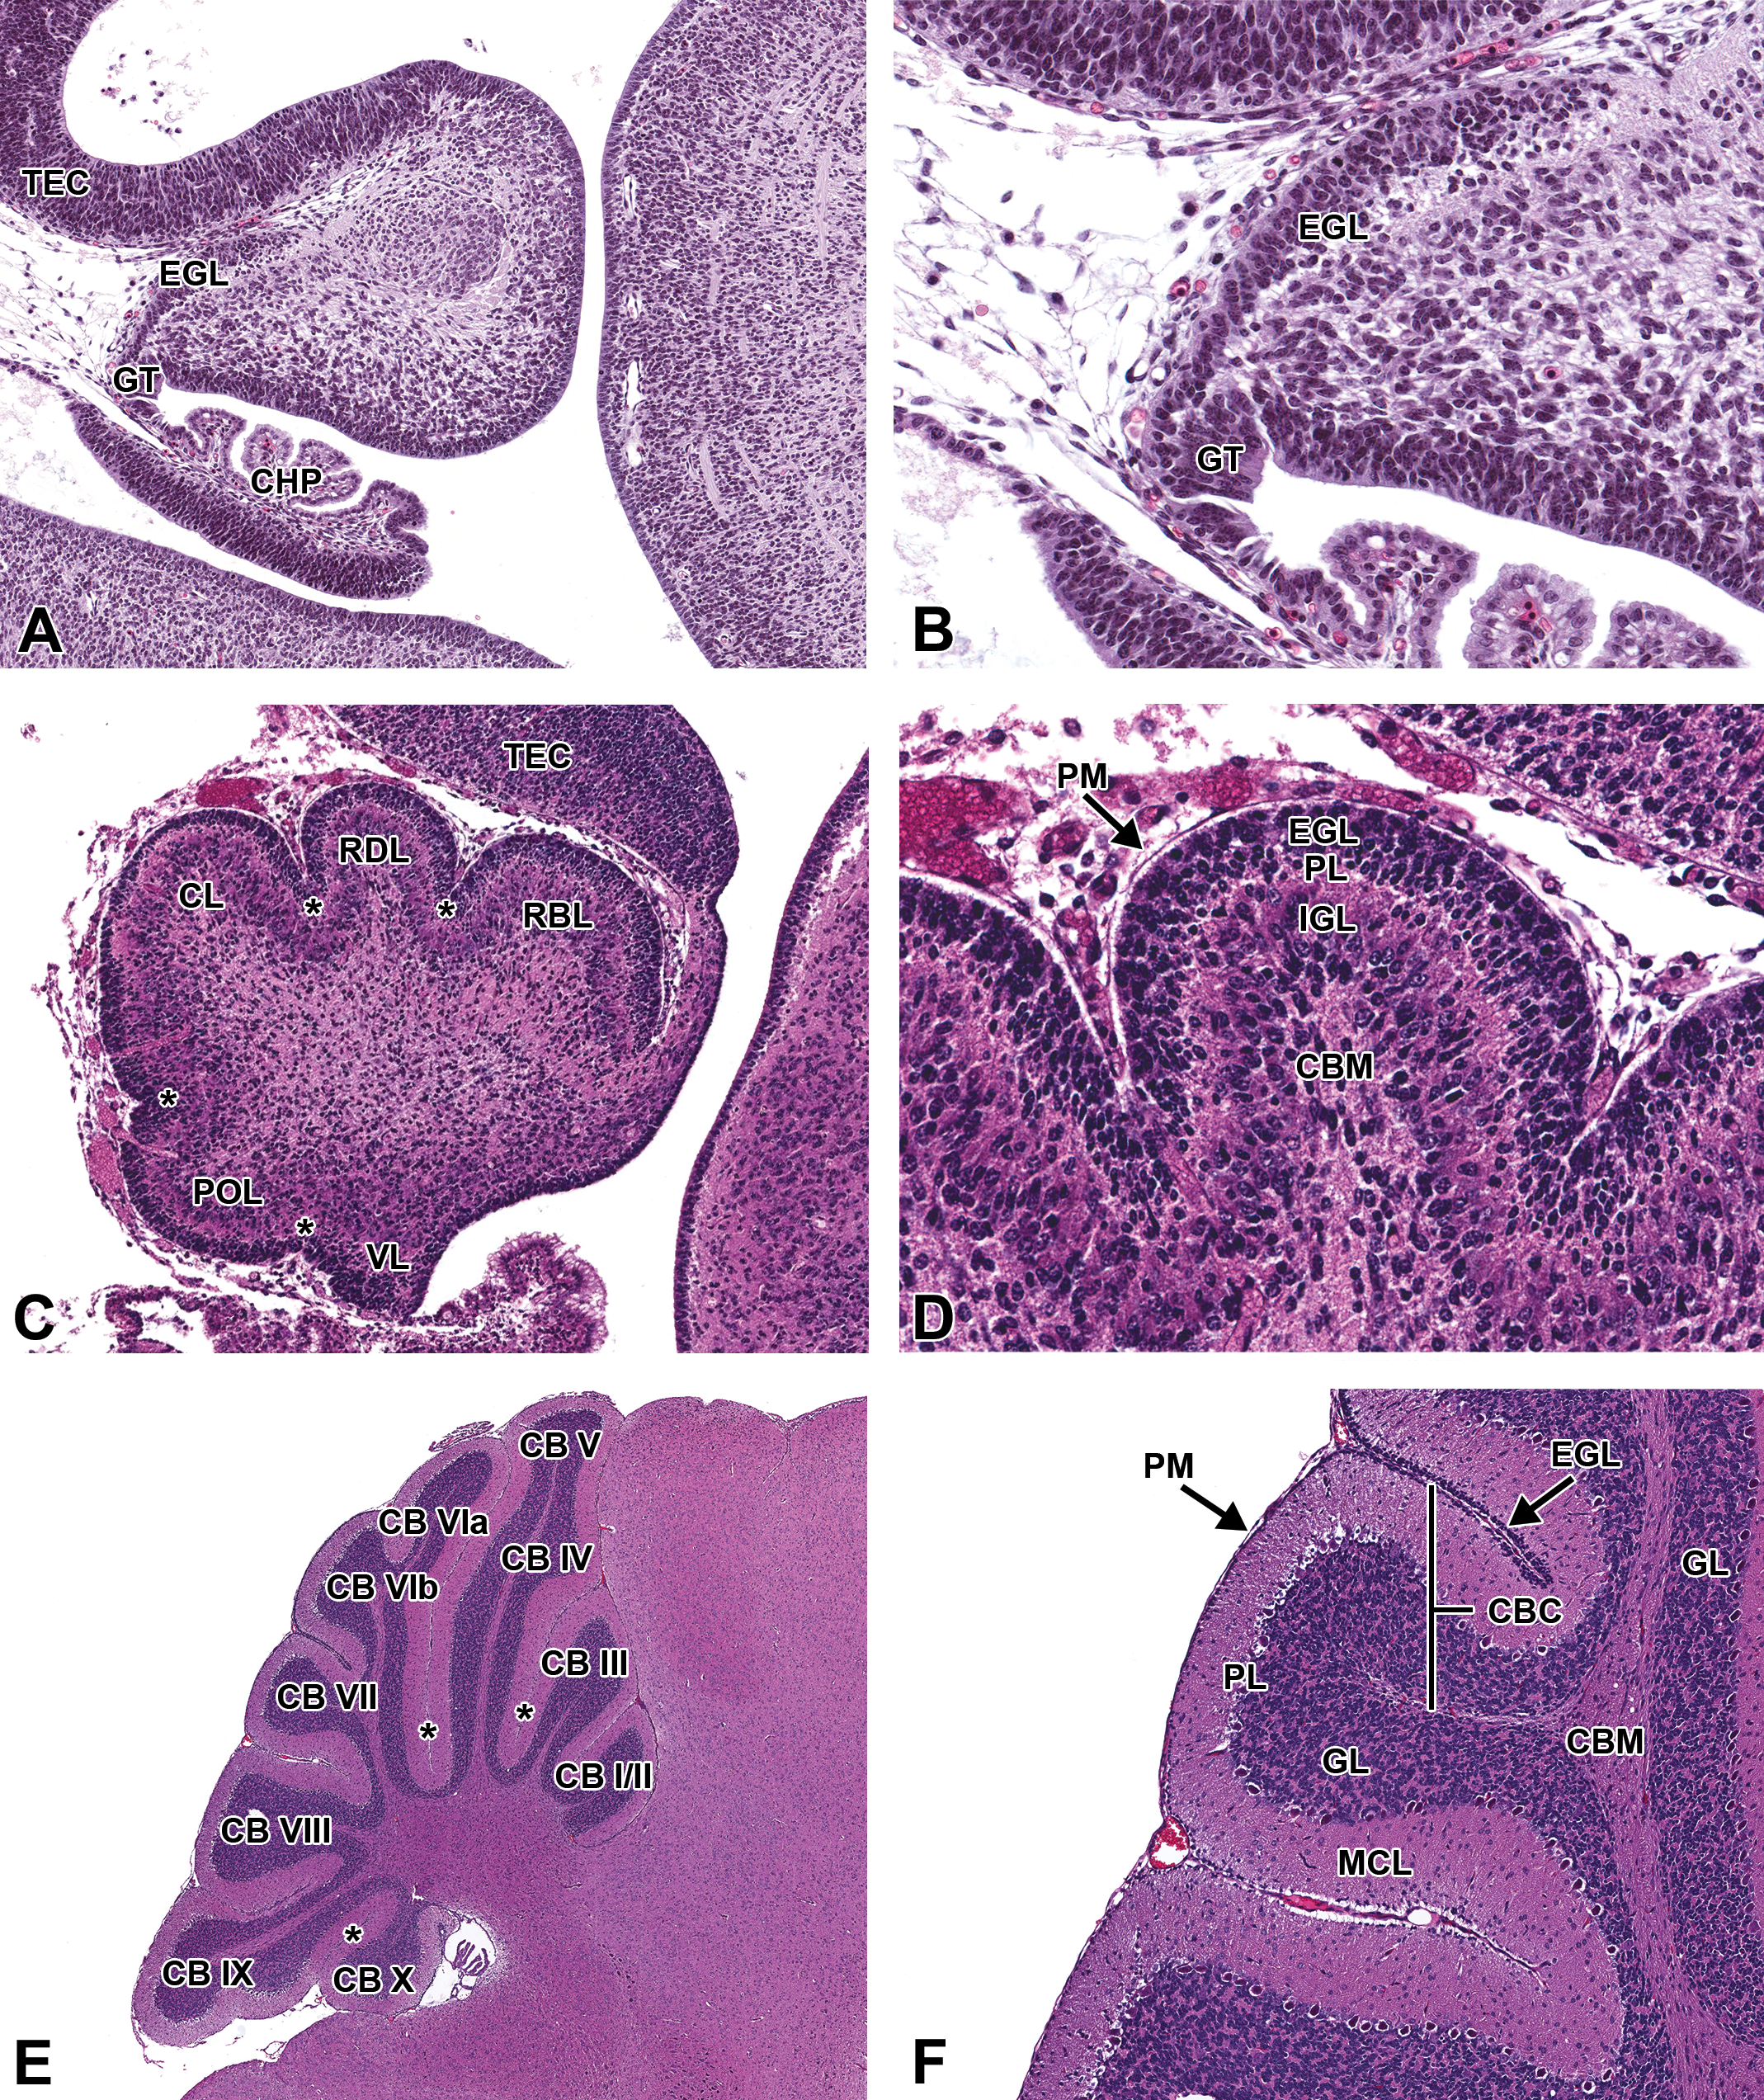
Representative images of the embryonic mouse cerebellum during brain development. Hematoxylin and eosin–stained, sagittal sections. (A and B) E15.5, low and high magnifications, respectively. (C and D) E18.5, low and high magnifications, respectively. (E and F) P21, low and high magnifications, respectively. CBC = cerebellar cortex; CB I-X = cerebellar lobe I-X; CBM = cerebellar medulla; CHP = choroid plexus; CL = central lobe; EGL = external granular cell layer; GL = granular cell layer; GT = germinal trigone; IGL = internal granular cell layer; MCL = molecular cell layer; PL = Purkinje cell layer; PM = pia mater; POL = posterior lobe; RBL = rostrobasal lobe; RDL = rostrodorsal lobe; TEC = tectum; VL = ventral lobe; * = primary fissures.
Spinal Cord
The dorsal gray (sensory) columns become increasingly prominent and generally cover a larger cross-sectional area than the ventral gray (motor) columns (Figure 17C), which is a similar pattern to that seen in the adult animal. The volume of white matter (i.e., the marginal zone) steadily increases throughout this stage, particularly in the ventral and lateral funiculi. The DRG are prominent along the entire dorsolateral length of the spinal cord. The central canal diameter continues to decrease.
At E15.0, most of the CN ganglia and CNs are readily identifiable due to their large size and location relative to other structures (Figure 22). Unlike the histologically prominent DRG, all but the largest of the peripheral nerves and autonomic nervous system components are difficult to differentiate from one another via H&E staining due to the highly cellular nature of the incompletely differentiated nerves and the mesenchymal tissues through which they pass.
Representative image of the embryonic mouse brain at E15.5. Hematoxylin and eosin–stained, transverse section. CEN = central canal; DH = dorsal horn; EB = exoccipital bone; EL = eyelid; EOM = extrinsic ocular muscle; I = cranial nerve I (olfactory); IRS = intraretinal space; IXG = cranial nerve IX (glossopharyngeal) ganglion; LN = lens; MO = medulla oblongata; NR = neural retina; OL = olfactory lobe; OLE = olfactory epithelium; PIN = pinna; RP = Rathke’s pouch; SA = saccule/utricle; SC = spinal cord; SCC = semicircular canal; TV = third ventricle; VG = cranial nerve V (trigeminal) ganglion; VH = ventral horn; VII = cranial nerve VII (facial); VIIG = cranial nerve VII (facial) ganglion; VIIIG = cranial nerve VIII (vestibulocochlear) ganglion; XI = cranial nerve XI (accessory).
E16.5 to E18.5 (TS25–TS26)
Forebrain
Throughout this stage, the cerebral cortex becomes increasingly well-laminated. Distinct layers, from superficial to deep, include the marginal zone, cortical plate, cortical subplate, intermediate zone, SVZ, and VZ (Figure 7E). Differentiation in the rodent continues until several weeks after birth when the definitive adult anatomy is realized (Figure 7F). The cortical plate is continuous, yet narrows considerably, from the neocortex into the developing hippocampus, and gives rise to the pyramidal cell layer in these regions (Figure 18C). At this time, morphological differences in the hippocampus are not apparent among the different regions of Ammon’s horn (Cornu ammonis [CA]1, CA2, and CA3), but these regions can be discerned using IHC for the markers Pou3f1 (POU class 3 homeobox 1; also known as SCIP) and Grik4 (glutamate receptor, ionotropic, kainate 4; also termed KA1) as early as E15.5 (Grove and Tole 1999). Although GC precursors are generated in the hippocampal neuroepithelium, migrate to the dentate gyrus, and eventually populate the outer GC layer, the proliferation and differentiation of this cell population largely takes place during the postnatal period.
The cerebroventricular system continues to become less prominent as cellular proliferation and differentiation proceed in the surrounding regions, particularly in the forebrain. The lumen of the lateral ventricles and their rostral extensions into the olfactory lobes continue to shrink (Figure 23A, B). The 2 halves of the thalamus join at the midline to form the inter-thalamic adhesion (Figure 23A).
Representative images of the embryonic mouse brain at E18.5. Hematoxylin and eosin–stained coronal (A) and sagittal (B) sections. CDP = caudate putamen; CHP = choroid plexus; CP = cortical plate; CS = corpus striatum; DM = dura mater; H = hippocampus; IA = interthalamic adhesion; IC = internal capsule; IZ = intermediate zone; LV = lateral ventricle; MZ = marginal zone; NPC = neopallial cortex; OL/OB = olfactory lobe/olfactory bulb; OLV = olfactory ventricle; PM = pia mater; PNG = pineal gland; RCO = rostral commissure; RON = rostral olfactory nucleus; SAS = subarachnoid space (future); SO = subcommissural organ; TH = thalamus; TV = third ventricle; VZ = ventricular zone.
The pituitary gland is well differentiated. The adenohypophysis, neurohypophysis, and the narrow intermediate zone (pars intermedia) that separates them are all clearly recognizable on H&E-stained sections (Figure 8D). The lumen of Rathke’s pouch has been largely obliterated by E17.5 and now appears as a small cleft. The caudal wall of Rathke’s pouch differentiates into the intermediate zone, while the rostral wall differentiates into the adenohypophysis. The neurohypophysis contains the axons arising from neurons in the paraventricular and supraoptic nuclei in the ventral hypothalamus. The distal portions of these axons contain large neurosecretory structures resembling swollen axons (“Herring bodies”) that contain and release peptide hormones, such as antidiuretic hormone and oxytocin, into the pituitary vasculature. Numerous pituicytes, which are modified glial cells, constitute the primary cells within the neurohypophysis. While the pituitary gland is functional at birth in the C57BL mouse, adult morphology, including postnatal development of somatotrophs and mammotrophs in the pars distalis, is not fully achieved until approximately P24 (Wilson and Christensen 1980).
The pineal gland, which is derived from the epithalamus, is well-developed at this stage. The lumen of the pineal recess, which initially developed as an outgrowth of the caudodorsal aspect of the third ventricle, has narrowed considerably by this stage due to progressive proliferation and differentiation of pinealocytes (Figures 23A, 24). Typical of other neuroendocrine organs, this circumventricular organ is richly vascularized.
Representative image of the embryonic mouse brain at E18.5. Hematoxylin and eosin–stained, sagittal section. CB = cerebellum; CDC = caudal commissure; CHP = choroid plexus; CTX = cortex; FV = fourth ventricle; FVR = fourth ventricle roof; I = cranial nerve I (olfactory); LV = lateral ventricle; LX = larynx; MBR = midbrain roof; MO = medulla oblongata; MV = mesencephalic vesicle (cerebral aqueduct); NC = nasal cavity; NPH = nasopharynx; OL = olfactory lobe; P = pons; PG = pituitary gland; PNG = pineal gland; SC = spinal cord; SP = soft palate; TH = thalamus; TO = tongue; VC= vertebrae, cartilage primordium; * = mesencephalic aqueduct.
Hindbrain
Cerebellar enlargement and differentiation rapidly continue, and the deep cerebellar nuclei (fastigial, interposed, and dentate), Purkinje cell layer, and molecular layer become increasingly apparent bilaterally. The developing Purkinje cells can be identified using IHC markers (e.g., calbindin); at this stage, they appear as multiple layers, unlike the distinct single layer in the adult animal. The EGL is increasingly prominent subjacent to the pia mater around the periphery of the cerebellum (Figure 21C, D). It is a secondary germinal zone and will continue to thicken as the precursors of the GC neurons rapidly proliferate soon after birth. Beginning perinatally, postmitotic cells from the EGL start to migrate radially inward through the molecular layer (i.e., the outer cell-poor zone) and Purkinje cell layer to form the definitive (i.e., internal) GC layer of the mature cerebellum. Foliation is not yet apparent and is not completed until approximately P15 in the mouse (Figure 21E, F; Sotelo 2004; Wullimann 2011).
Spinal Cord
The morphologic appearance is very similar to the adult by this stage (Figure 17D, E, F). The characteristic regional differences, such as the cervical and lumbar intumescences, are apparent (Rigaud et al. 2008). The lumen of the central canal is very narrow. In the thoracic region (cord segments T1 through L2), the lateral gray column, which contains the preganglionic cell bodies of the sympathetic nervous system, is first becoming apparent. The axons from these neurons leave the CNS initially through the spinal nerves but rapidly enter autonomic-specific branches to eventually synapse on ganglion cells of sympathetic ganglia either in the paravertebral region in the sympathetic chain or more distally near their target organs.
Postnatal Development of the Nervous System
Development of the nervous system continues well after birth in all mammalian species. The changes that occur from late gestation (approximately E15) through the first 7 to 10 days of postnatal neurodevelopment in rodents are considered to be approximately equivalent to those that take place in human fetuses during the third trimester of gestation (Workman et al. 2013; Bolon and Ward 2015). Key alterations at this stage reflect the production, migration, and differentiation of additional cells in some regions (both neurons and glia); selective elimination of unneeded cells (mainly neurons with axons that do not attain optimal connectivity with their targets) by programmed cell death; and the region-specific rise of intercellular communication (i.e., synaptogenesis and dendritic arborization) and nerve fiber insulation (i.e., myelination).
The vast majority of neuronogenesis occurs before birth in the mouse. However, neuronal populations in several brain regions undergo their principal development during the postnatal period (Figure 25). Two of these are localized to the forebrain: the GC neurons of the dentate gyrus in the hippocampus and the GCs of the olfactory bulbs. The third is localized to the hindbrain: the GCs of the cerebellar cortex (discussed with postnatal development in the hindbrain below). The likely evolutionary reason for the delayed development of these GC populations is that they serve as key interneurons in circuits that were specified at earlier points during development.
Chronology of neuron production in the developing mouse central nervous system. Neuron production for different brain regions takes place at distinct stages of prenatal and early postnatal life. Some regions (e.g., hippocampus and olfactory bulb) experience 2 neuronogenesis peaks, representing the critical periods for generating unique cell classes. The vertical line on day 20 represents the time of birth. Figure adapted from Rodier (1980) by permission of John Wiley.
Dentate Gyrus (Hippocampus)
Whereas most neuronal populations have a fairly short period during which they are produced, the GCs of the dentate gyrus have an unusually long period of genesis. It has been estimated that 85% of all dentate gyrus GCs arise after birth in the rodent (Altman and Bayer 1990a), even though the production of GCs reportedly begins at a very low level as early as E10 in the mouse (Angevine 1965). The GC precursors in this region originate from the dentate notch in the adjacent ventricular epithelium, which extends into the hippocampus proper to form a proliferative zone (Altman and Bayer 1990b). Production of the GCs accelerates in the perinatal period, reaching peak production in the first week of postnatal life before undergoing a gradual decline (G. Li and Pleasure 2005). The differentiating cells initially migrate to the outermost region of the developing GC layer in the dentate gyrus, and as neuronal production continues, the newest cells progressively populate the inner layers (Figure 18D). This “outside-in” pattern of formation is in contrast to the “inside-out” pattern that is followed in the cerebral cortex, including even the pyramidal cell layer of hippocampus (Angevine 1965; Hayashi et al. 2015). Although histologic evidence of continued GC production is generally unapparent after P20 in the mouse, GCs are continually produced along the inner edge of the dentate gyrus (the subgranular zone) throughout adulthood. This continued production is substantial, as morphometric studies have shown that up to 40% of dentate gyrus GCs present at 1 year of age in mice are produced after sexual maturity is reached (approximately 1 month of age; Bayer 1982, 1985).
Olfactory Bulb
As with their counterparts in the dentate gyrus, the GCs of the olfactory bulbs have a similarly long period of genesis. Their production begins late in gestation, at approximately E18.0 in the main olfactory bulbs but slightly earlier in the accessory olfactory bulbs (which is connected to the vomeronasal [Jacobson’s] organ, a sensory organ near the floor of the nasal cavity that detects minimally volatile airborne chemicals). Production of olfactory bulb GCs rapidly increases at birth, continues extensively in the first 2 postnatal weeks, and then subsides considerably by P20 (Hinds 1968a, 1968b). As in the dentate gyrus, olfactory bulb GC production continues at a lower level throughout adulthood; however, the site of GC origin in the olfactory bulbs shifts depending on the age of the mouse. Perinatally, olfactory bulb GCs are produced from neuronal precursors in the sub-ventricular zone (SVZ) that surrounds the rostral (olfactory) extensions of the lateral ventricles. After the first several weeks of life, however, neurons no longer arise from the SVZ in the olfactory bulbs, and the olfactory extension of the ventricles is reduced to a potential space. Instead, the origin of late appearing olfactory bulb GC is the SVZ surrounding the rostral margins of the lateral ventricles. The neuronal precursors in this region proliferate and migrate as the “rostral migratory stream” along the collapsed remnant of the olfactory ventricle to reach the olfactory bulbs; this migratory path is histologically prominent in the adult mouse forebrain (Figure 26; Altman 1969a, 1969b; Whitman and Greer 2009; Brann and Firestein 2014). In contrast to the dentate gyrus, production of olfactory bulb GCs after sexual maturity does not appear to yield an increase in GC numbers but rather replaces depleted GCs (Bayer 1985).
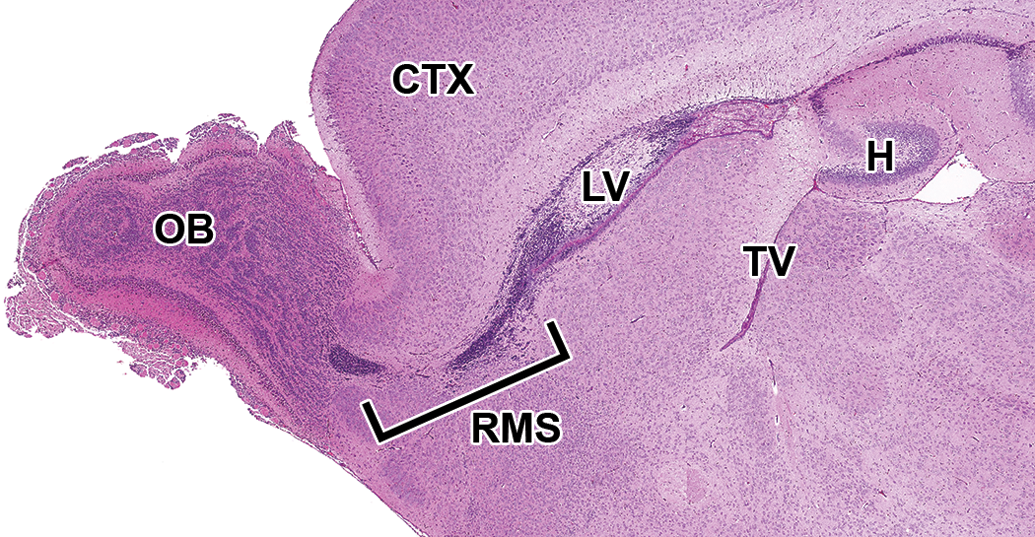
Representative image of the rostral migratory stream at P7. Late appearing olfactory bulb germinal cells originate from the subventricular zone surrounding the rostral margins of the lateral ventricles (LV) and migrate as the “rostral migratory stream” (RMS) along the collapsed remnant of the olfactory ventricle to reach the olfactory bulbs (OB). CTX = cortex; H = hippocampus; TV = third ventricle.
Hindbrain
Development of cerebellar foliation in the mouse occurs predominantly within the first 2 weeks after birth (Chizhikov and Millen 2003; Corrales et al. 2006; Sudarov and Joyner 2007; White and Sillitoe 2013; Sotelo 2004; Wullimann 2011). By E18.5, the developing cerebellar vermis (i.e., the midline region) displays the earliest evidence of foliation, with the formation of 4 large principle fissures that divide the vermis into 5 cardinal lobes (Figure 21C). By this same time, the neurons of the Purkinje cell layer and the deep cerebellar nuclei are apparent in the cerebellar anlage localized to their approximate final locations, although the Purkinje cells are organized into multiple layers at this stage rather than into the single layer that is seen in the adult (Figure 21D). These larger projection neurons, whose axons extend to more distant regions of the brain and spinal cord, originated from the cerebellar VZ (the primary site of stem cell generation) between E11 and E15 and then migrated to their final locations. However, the GC neurons, which constitute the most abundant neuronal population in the cerebellum, originate largely after birth (approximately between E18.5 and P16) from the EGL, a subpial layer of neuronal progenitor cells that covers the outer surface of the developing cerebellum (Corrales et al. 2006; Sudarov and Joyner 2007). Precursors of these cells first form in the rhombic lip (the region of the metencephalon that abuts the roof plate of the fourth ventricle) between E11 and E15 (Figure 20) before migrating to their subpial location; therefore, the GC progenitor cells that comprise the EGL represent a secondary germinal center. In response to sonic hedgehog (Shh) protein secretion from the Purkinje cells, the cells of the EGL rapidly proliferate and, beginning approximately at birth, leave the cell cycle and migrate inward along the processes of radial glia (termed “Bergmann glia” in the cerebellum) past the Purkinje cell layer to enter the GC layer, where they differentiate into GC neurons (Sotelo 2004). Foliation of the cerebellum occurs concomitantly with the formation of the GC layer and is hypothesized to provide the additional cortical volume necessary to accommodate the myriad newly formed GC neurons and to facilitate the establishment of complex cerebellar neuronal circuits needed for fine motor control (Sudarov and Joyner 2007).
The basic foliation pattern of the cerebellar vermis in adult mice consists of 10 lobules, although considerable variation has been recognized in certain inbred strains (Wahlsten and Andison 1991; Corrales et al. 2006). The lobules typically are numbered using Roman numerals with the most rostral and ventral lobule (found adjacent to the rostral medullary vellum comprising the roof of the fourth ventricle) being designated the first lobule (i.e., I; Figure 21E, F); the remaining lobules are numbered sequentially proceeding dorsally and then caudally. The degree and duration of Shh signaling by Purkinje cells and the resulting degree of GC neuron proliferation have been shown to impact the size and complexity of foliation in the mouse, with deficiencies in Shh resulting in a small cerebellum with less complex foliation, and increases in Shh signaling resulting in a larger cerebellum with more complex foliation (Corrales et al. 2006).
Key Processes during Pre- and Postnatal Development
Neuronogenesis
Neurons within the CNS are generated from the neuroepithelium of the neural tube during initial neurulation and subsequently from the neuroblasts of the VZ and SVZ later in gestation. Neuron production commences at approximately the time of final neural tube closure, as early as E9 for certain populations such as the CN motor neurons, and progresses through early postnatal life. Although the CNS as an organ system develops over a long period, generally each population of neurons has a fairly tight window during development in which they may be produced (Figure 25). Although the mouse is the focus of this article, it should be noted that the sequence of neuronal production between different regions of the CNS is highly conserved across species, even though brain size, gestational length, and maturity at birth vary considerably (Clancy et al. 2013).
The precise sequence of neuronogenesis is complex and overlapping, but the following generalizations provide useful rules of thumb when performing a neuropathologic evaluation in developing mice. The period of neuronal production for a particular brain region is surprisingly short, in many cases lasting only a few days, particularly if the heterogeneity of neuronal subtypes within the region is small. With a greater diversity of neuronal types (e.g., the cerebral cortex or the sensory [dorsal] horn of the spinal cord), the length of time during which neuron production occurs is longer. In general, the production of large neurons developmentally precedes that of small neurons (Rodier 1980). It has been hypothesized that there is a developmental advantage in generating large neurons earlier in gestation, as these cells are often projection neurons with a more distant axonal target either inside or outside of the CNS. In contrast, small neurons are more frequently involved in local circuits or serve as interneurons and consequently are generated later since the distance the axon must initially traverse to find its target is much smaller (Klausberger and Somogyi 2008; Lodato and Arlotta 2015). Although the neurons in certain evolutionarily more ancient regions, such as the caudal brainstem and the spinal cord, form earlier than in evolutionarily more recent regions, this phylogenetic–ontogenic relationship should not be applied too broadly since there are numerous exceptions such as the archicortex (hippocampus) completing its formation after the neocortex (cerebral cortex; Rodier 1980).
Although the cerebral cortex is often referred to as a single anatomic structure from a developmental perspective, regional differences are present in the onsets and peaks of neurogenesis among regions, with a general caudodorsal gradient (caudal forms first) in neurogenesis having been reported (Angevine and Sidman 1961; Rodier 1980; Rice and Barone 2000). Nestin can be a valuable immunohistochemical marker to highlight the neuronal stem cell population (Online Supplemental Figure 8) and tubulin IHC can highlight neurons after they begin to differentiate (Online Supplemental Figures 9 and 10). In rodents, the first cortical regions to initiate neurogenesis are the piriform and entorhinal cortices at approximately E12, but neurogenesis in these regions proceeds quickly and ceases at E16. More dorsal regions, such as the occipital cortex, start at a similar time, yet neurogenesis proceeds over a longer period (Angevine and Sidman 1961; Rodier 1980). As in other areas of the CNS, larger neurons are the first to form, and in the cerebral cortex, these are the neurons of the deeper cortical layers, consistent with this region’s “inside-out” developmental pattern described in detail above (Angevine and Sidman 1961).
The GC neurons of the olfactory bulb, the dentate gyrus of the hippocampus, and the cerebellum are among the last neuronal populations to form. The large pyramidal neurons in these structures (e.g., the mitral cells of the olfactory bulb, the pyramidal cell layer of the CA regions of the hippocampi, and the Purkinje cells of the cerebellum) form much earlier in gestation.
Gliogenesis
The 3 types of glial cells in the mammalian CNS are oligodendrocytes, astrocytes, and microglia. The first 2 types, oligodendrocytes and astrocytes (i.e., the macroglia), are embryologically derived from the neuroepithelium. In contrast, the last type, microglia, is derived from the yolk sac (i.e., extra-embryonic) mesoderm, more specifically from the hematopoietic lineage that gives rise to monocytes and macrophages (Kessaris, Pringle, and Richardson 2008; Saijo and Glass 2011).
The production of oligodendrocyte precursor cells (OPCs) occurs within specific subanatomical regions of the developing CNS and at tightly defined periods during development (Kessaris, Pringle, and Richardson 2008; Woodruff et al. 2001). Even though myelination occurs postnatally, OPCs are produced in mouse embryos beginning on E12.5 within the medial ganglionic eminence of the forebrain and in the ventral spinal cord adjacent to the floor plate. This stage represents the first of 3 waves of OPC specification from which cells proliferate and migrate into all regions of the developing CNS. Beginning at approximately E15, a second wave of OPC specification occurs in more dorsal regions of the forebrain, specifically the lateral ganglionic eminence, and in the spinal cord. These second-wave OPCs also proliferate and migrate to all CNS regions and, curiously, replace all the first-wave OPCs throughout the telencephalon during the postnatal period (Chong and Chan 2010). The first-wave OPCs persist in the spinal cord and mix with the more dorsally generated second-wave OPCs; the first-wave cells can constitute up to 50% of the total population of oligodendrocytes in the dorsal funiculus and a smaller proportion in other white matter regions within the cord. Beginning at approximately P0, a third round of OPC specification occurs in the cerebral cortex but not the spinal cord, and these cells migrate to the different regions of the cerebral cortex (Rowitch and Kriegstein 2010; Kessaris, Pringle, and Richardson 2008; Richardson, Kessaris, and Pringle 2006; Woodruff et al. 2001). Numerous IHC markers are available to detect OPCs and oligodendrocytes, including oligodendrocyte transcription factors 1 (Olig1) and 2 (Olig2; Online Supplemental Figures 11 to 13), platelet-derived growth factor receptor alpha (Pdgf-rα), and sex-determining region Y (SRY)-box 10 (Sox10; Liu et al. 2002; Woodruff et al. 2001). Once myelin production has begun during the postnatal period (at approximately P0 in the mouse, though as noted below the timing varies by region), other markers are also available to detect oligodendrocytes including MBP. Luxol fast blue is a common histochemical stain used to follow the course of myelin production over time in the developing CNS (Carriel et al. 2017).
Astrocyte differentiation is less well understood, partly due to the relative lack of IHC markers that can discriminate early astrocytes from their progenitor cells (Rowitch and Kreigstein 2010; Freeman 2010). Although there is some evidence of preferential domains for initial astrocyte specification similar to those for oligodendrocyte precursor specification, the sites and timing of astrocyte production are less well described (Kessaris, Pringle, and Richardson 2008). Immunopositivity for GFAP, the prototypic marker for astrocytes, is first apparent in the VZ at E12 but at very low levels. By E15, expression of GFAP has increased in the periventricular regions of the cerebrum and is also reportedly detectable in the hippocampus. Expression of GFAP during these early time points has been localized to the radial glia and not necessarily within fully differentiated astrocytes. By E18, the progression of astrogliogenesis is associated with increasing GFAP expression, and positive cells with more characteristic stellate morphology are present throughout the parenchyma, being particularly evident at the glia limitans (Online Supplemental Figure 1; Mamber et al. 2012; Liu et al. 2002). Other markers of the astrocyte lineage that have been reported in the literature are S100β, glutamate-ammonia ligase (Glul, commonly known as glutamine synthetase), glutamate and aspartate transporter (Glast), fibroblast growth factor receptor-3 (Fgfr3), and aquaporin-4 (Aqp4). Not all of the above markers are specific to astrocytes, however, and careful selection and validation of the marker battery are recommended (Kessaris, Pringle, and Richardson 2008).
Unlike astrocytes and oligodendrocytes, which are derived from neuroectoderm, microglia originate in the extra-embryonic yolk sac (i.e., mesoderm) before migrating into the CNS beginning at approximately E10.5 (Ginhoux et al. 2010; Rigato et al. 2011; Chan, Kohsaka, and Rezaie 2007; Saijo and Glass 2011). Microglia initially accumulate and actively proliferate in the mesoderm surrounding the neural tube. Colonization of the neural parenchyma then occurs progressively; this process apparently does not involve the developing vasculature but rather seems to result via direct invasion from the adjacent mesoderm (Rigato et al. 2011; Chan, Kohsaka, and Rezaie 2007). Once within the neural parenchyma, microglia migrate and proliferate to populate the entire CNS. Several IHC markers have been utilized to study microglia during development in the mouse, including the macrophage markers F4/80, CD11b, CD11c, CD68, and chemokine (C-X3-C) receptor 1 (Cx3cr1) as well as Iba-1 (Online Supplemental Figures 5 to 7; Santos et al. 2008; Chan, Kohsaka, and Rezaie 2007; Ginhoux et al. 2010; Rigato et al. 2011; Dalmau et al. 2003). Other IHC markers of macrophage/microglial activation, such as galectin-3 (formerly Mac2) and major histocompatibility complex class II (MHC II), have been also used; these markers are reported to work only sporadically and only on certain subsets of cells, which is consistent with a variable degree of activation in microglial cell populations during development (Rigato et al. 2011).
Programmed Cell Death (Apoptosis) in the Developing Nervous System
Apoptosis, also commonly referred to as “programmed cell death” in the neurodevelopment literature, is crucial for normal shaping of the cell populations and circuits of the nervous system. It occurs in a precise spatiotemporal pattern during both in utero and early postnatal life (Kuan, Flavell, and Rakic 2000; Ferrer et al. 1992; Yeo and Gautier 2004; Buss et al. 2006). In the embryo, sites containing numerous apoptotic cells are the hindbrain neural folds at E8 to E9, the lamina terminalis at E10.5 to E12.5, and the optic invagination at E11.5 to E12.5 (Kuan, Flavell, and Rakic 2000). In addition, between E12 and E18, apoptosis can be identified in the VZ, intermediate zone, and the developing cortical plate of the cerebral cortex (Yeo and Gautier 2004; Haydar et al. 2000) as well as in DRG. Histologically, the relative percentage of cells undergoing apoptosis at any point in time is very low, estimated to be between 0.14 and 0.35% per day in the developing cerebral cortex, as determined by the use of special staining techniques (e.g., IHC for anticleaved caspase 3 (CC3; Online Supplemental Figures 14 and 15) or terminal deoxynucleotidyl transferase dUTP nick end labeling; Haydar et al. 2000; de la Rosa and de Pablo 2000) to detect cells committed to apoptosis which have not yet developed the histologically detectable features of end-stage apoptotic cells (e.g., nuclear fragmentation and cell shrinkage with a clear pericellular halo). However, since the clearance time of an apoptotic cell in the developing CNS is very rapid, estimated to be only 2.5 hr in rodents (Thomaidou et al. 1997), the perceived absence of histologic evidence of apoptosis may cause one to underestimate its importance as a driving force in molding neuroanatomic organization. Studies utilizing mice with targeted deletions in the effector components (i.e., caspase 3 and caspase 9) or other proteins (e.g., apoptotic protease activating factor 1 [Apaf1]) of the apoptosis cascade result in dramatic phenotypes in the nervous systems of developing animals, such as marked forebrain enlargement with exencephaly at the macroscopic level and supernumerary neurons and prominent forebrain dysplasia by microscopic analysis (Kuan, Flavell, and Rakic 2000; Kuida et al. 1998; Yoshida et al. 1998). These findings are consistent with a critical role for apoptosis as a central process in regulating the numbers of neuronal precursors, and ultimately brain size and connectivity, during much of neurogenesis (Haydar et al. 1999; Depaepe et al. 2005).
After birth, apoptosis has long been recognized to occur in most, if not all, regions of the developing central and peripheral nervous systems, including the brain, spinal cord, and peripheral ganglia (Oppenheim 1991). The vast majority of postnatal apoptosis occurs during P0 to P14 (Verney et al. 2000; Ferrer et al. 1992), which corresponds to the period of rapid synaptogenesis in the rodent (see below), although occasional apoptotic cells still can be observed in the CNS later in development. Neuronal apoptosis has been studied extensively in the cerebral cortex, where the precise timing of the peak in apoptosis varies depending on the cortical region and layer but generally falls between P4 and P8 in mice. Histologically, as with apoptosis during embryogenesis, the numbers of cells appearing to undergo apoptosis in the postnatal brain are small ranging from approximately 0.1% to a maximum of 1%. However, despite this perceptibly low level of cell death, the overall cumulative effect is considerable, with final neuronal numbers ranging from approximately 60% to 90% (depending on the region) of the original neuronal population that was present at P0 (Verney et al. 2000).
Synaptogenesis
Synapses are specialized macromolecular structures principally occurring between individual neurons, but also between neurons and glia, that function in intercellular communication and ultimately allow for the formation of complex neural networks to control body activities. A single mouse brain is estimated to contain 8.1 × 10¹⁰ synapses, or an average of 8,200 synapses for each individual neuron, in the cerebral cortex alone (Schuz and Palm 1989). The dynamics of synapse production have been most studied in the rat and primate, but commonalities that appear to be true across all species studied permit certain extrapolations to be made with respect to the mouse (Bourgeois 1997; Semple et al. 2013).
The vast majority of synapses occur between neurons, most commonly as connections between neuronal processes (axons and dendrites). Although synapse formation occurs at a low level throughout life and is critical for both learning and memory formation, the majority of synapses develop during a critical period of brain development termed synaptogenesis (often referred to as the “brain growth spurt”; Waites, Craig, and Garner 2005). Their extensive formation during this neonatal period is a morphological manifestation of neuronal differentiation and integration into the local environment. In the mouse, this developmental period is largely limited to the first 2 weeks after birth, which is in sharp contrast to certain other species with a more complex brain and lifestyle such as primates, in which the period of synaptogenesis begins in utero in the third trimester and continues for a much longer period (e.g., for years in the human infant; Olney 2002; Rice and Barone 2000; Dobbing and Sands 1979). The rate of synaptic production during peak synaptogenesis has been estimated to reach 40,000 new synapses/second in the cerebral cortex in the nonhuman primate (Bourgeois 1997). A high rate per individual neuron is also likely in the neonatal mouse.
Even though the period of intense synaptogenesis is relatively short in rodents, it nonetheless does not occur uniformly across all regions of the brain. However, regional differences noted in the precise timing of peak synaptic formation are less pronounced in rodents than in humans (Huttenlocher and Dabholkar 1997; Semple et al. 2013). The total number of synapses produced during the period of synaptogenesis generally overshoots the final adult number by up to 50% (Semple et al. 2013). This maximum number then decreases as synapses are selectively pruned during brain maturation. The excess production, followed by the phase of “synaptic elimination,” appears to be a fundamental developmental feature in mammals. The synapses that are removed are hypothesized to be those that have made inadequate connections leading to insufficient reinforcement due to relatively infrequent nerve impulses (“activity-dependent elimination”). Loss of improperly linked synapses allows for the neural circuitry to achieve optimally efficient connectivity (Waites, Craig, and Garner 2005).
Several techniques have been described to morphologically evaluate and/or to quantitate synapses. Using light microscopy, one can make rough inferences regarding the adequacy of synaptogenesis either through close scrutiny of the dimensions of particularly synapse-rich brain regions (e.g., cerebellum, the hippocampus, or cerebral cortex; Bolon et al. 2006; Rice and Barone 2000) or by employing synapse-specific IHC stains (e.g., synaptophysin; Leclerc et al. 1989). Individual synapses are below the resolution of light microscopy, and so for a more detailed morphological review of synapse architecture or quantitation of synaptic density, transmission electron microscopy (TEM) is required. Numerous publications are available describing possible techniques and normal synaptic morphology when viewing TEM images (Schuz and Palm 1989; Huttenlocher and Dabholkar 1997; and Zecevic, Bourgeois, and Rakic 1989).
Myelination
Similar to most other vertebrates, the production of myelin by differentiated oligodendrocytes is largely a postnatal event in mice. Accordingly, the normal absence of myelin throughout gestation and in the early postnatal period is an important consideration when phenotyping the CNS of developing mice of all ages, especially if the analysis is undertaken before birth. In general, myelination begins at or shortly after the time of birth in phylogenetically more ancient regions of the CNS (e.g., the brainstem and cervical spinal cord) and then advances to the more evolutionarily recent anatomical domains (e.g., the cerebral hemispheres). Different portions of the brain and spinal cord, and even different white matter tracts within a particular region, have a characteristic timing for the initiation and progression of myelination. Such variation emphasizes the fact that comparable tissues from strain- and age-dependent control animals should be available for examination when phenotyping novel neurodevelopmental phenotypes affecting the mouse CNS. A brief summary of this process as it pertains to mice is presented below, but a detailed description of this subject is beyond the scope of this review. For more detail, the reader is directed to one of the several excellent references on this subject (Jacobson 1963; Banik and Smith 1977; Delassalle et al. 1981; Foran and Peterson 1992; Kristensson et al. 1986; Kondo et al. 1992; Downes and Mullins 2014).
Briefly, the first region of the mouse CNS to initiate myelination is the ventral cervical spinal cord, beginning at approximately E18 to P0. Myelination then proceeds dorsally and caudally throughout the spinal cord, although there are differences in the rate of myelination between white matter tracts. By P6, generation of myelin has begun in the ascending and descending tracts through the medulla oblongata, pons, and thalamus as well as deep within the cerebellar medulla. This wave of myelin production by P9 has expanded superficially throughout the caudal lobules of the cerebellum. By P9, myelination also has begun in the telencephalon, specifically the major interhemispheric connections such as the corpus callosum and fornix of the hippocampus, and also has been launched in the olfactory tracts on the ventral surface of the brain. By P12, nearly all white matter tracts within the brain have initiated myelination, including the dorsal and rostral cerebellar lobules, cerebral cortex, basal ganglia, and internal capsule. Once initiated, myelin production in each region continues until the adult myelin pattern and density are achieved. By at least 1 measure—the production of MBP, which is the most abundant protein component of myelin—production of myelin peaks in the third postnatal week (i.e., approximately at weaning) and then gradually declines until the stable, mature level of myelin is reached (Foran and Peterson 1992; Kristensson et al. 1986).
Abnormal CNS Development
NTDs, such as anencephaly/exencephaly or spina bifida, are among the most common human congenital anomalies, with a birth incidence of approximately 1 per 1,000 in North Americans of Caucasian descent (Detrait et al. 2005). Failure of normal neural tube development, or neurulation, is unique to higher vertebrates and involves inadequate folding, apposition, and/or fusion of the neural folds in early embryogenesis. These abnormalities occur at different levels of the body axis (cranial and/or spinal) that reflects the axial level in which fusion of the neural folds was incomplete. The incidence of NTDs in infants may be increased substantially in environments in which contamination by xenobiotic chemicals is rampant (Z. Li et al. 2011; Lupo et al. 2011; Ren et al. 2011), thereby demonstrating that the general vertebrate sensitivity to chemically induced NTDs is shared by Homo sapiens.
Insight into the molecular requirements of neurulation has been provided by more than 240 GEM that exhibit NTDs as a prominent developmental phenotype (Harris and Juriloff 2007). Of these mutants, approximately 90% demonstrate cranial defects (Figure 27) and another 25% demonstrate spina bifida, with some overlap between the phenotypes. Excellent reviews have been written describing the gene defects linked to NTDs and categorizing them with regard to their specific molecular functions or signaling pathways (Copp and Greene 2010; Zohn 2012; Zohn, Anderson, and Niswander 2005).
Spectrum of common cephalic axial dysraphic malformations (or neural tube defects [NTDs]) affecting the brain in near-term (E17.5) mouse embryos. Relative to normal control littermates (N), cranial NTDs form a continuum. Encephalocoele (E) presents as a small protuberance of meninges-covered cerebral cortex on the forehead or crown. Exencephaly (X) exhibits complete exposure of the cerebrum and midbrain. Anencephaly (A) is shown by a complete absence of the brain (± a portion of the brainstem). Holoprosencephaly (H) arises from failure of the primary forebrain vesicle (prosencephalon) to differentiate into paired secondary (telencephalic) vesicles. The latter 3 severe NTDs usually are accompanied by craniofacial defects such as hypoplasia or aplasia of the eyes and jaws (as seen in here for H). In this case, NTDs were induced by maternal inhalation of methanol at 15,000 ppm for 6 hr daily during the period of neural fold formation and neural tube closure (E7–E9). Figure reproduced from Bolon, Welsch, and Morgan (1994) with permission.
Exencephaly and anencephaly are the most common cranial NTDs in mice with induced (i.e., GEM) and spontaneous mutations or following teratogen exposure, and they result from the failure of the cranial neural folds to close and fuse. In mice, cranial NTDs typically result from failure at either closure site 2 or closure site 3, or subsequently as a defect in zippering over the future brain region (Harris and Juriloff 2007). In rare instances, exencephaly in rodents may follow rupture of a neural tube that successfully closed, albeit with a thin dorsal wall that was a risk for rupture (Padmanabhan 1984). Exencephaly occurs when neuroectoderm protrudes from the developing brain, which can be seen readily at E13 (Harris and Juriloff 2007) and as early as E10.5 (Bolon, Welsch, and Morgan 1994). Failure of the calvaria to develop over the protruding neural tissue results in its exposure to the amniotic environment and eventual degeneration of the neuroepithelium (Wood and Smith 1984). The common cranial NTD lesion in mice is exencephaly, while that of human infants is anencephaly, suggesting that corrosion of the delicate neural tissue usually requires extended contact with amniotic fluid. A number of specific developmental pathways have been identified that, when perturbed, result in a high incidence of exencephaly, including disturbance of the actin cytoskeleton (Shroom, Vinculin, Marcks, RhoGAP p190), cell cycle and neurogenesis (Jumonji, Neurofibromin1, Pax3, Hes1/Hes3 double mutant), cell death (AP2α, Casp3), cell surface and extracellular matrix proteins (Laminin-α 5, Integrins-α 3 and Integrins-α 6, EphrinA5), transcriptional regulation and chromatin dynamics (Cart1, Smurf1/2), and specific signaling pathways (Shh, Bmp; reviewed in Copp, Greene, and Murdoch 2003). The incidence of exencephaly in mice is influenced considerably by the background strain (Harris and Juriloff 2007), even when identical mutations are present or the same teratogen is used, so care should be exercised in selecting the genetic background when seeking to develop NTD models in mice, and particularly in the inclusion of appropriate experimental controls when assessing GEM.
Nonfusion of the neural tube may occur over only a short distance, resulting in a small midline protrusion of CNS tissue. In the head, the defect manifests as encephalocoele (if brain [usually cerebral cortex] is included) or meningocele (if the bulge contains only meninges). In the torso, small NTDs of the caudal axis present as myelomeningocele (if spinal cord is included) and meningocele. In mice, these NTDs may occur together with exencephaly in teratogen-exposed litters, suggesting that they represent related manifestations of a common neural tube closure defect.
Craniorachischisis is the most severe NTD phenotype. It is characterized by nonclosure of the entire neural tube from the midbrain to the lower spine. It is also the rarest NTD manifestation in both mice and humans, occurring in approximately 5% of mouse strains with NTDs (Harris and Juriloff 2007, 2010). Studies from mutant mice that have defects in noncanonical Wnt signaling (i.e., the planar cell polarity pathway) suggest that the principal defect in craniorachischisis is failure of closure 1 at the hindbrain–cervical boundary, which normally occurs at approximately E8.0 (Zohn, Chesnutt, and Niswander 2003; Copp, Greene, and Murdoch 2003) in the absence of this initial fusion site, closure does not begin at all except in those regions served by the more rostral closure sites. Mutation of the lipid phosphate phosphohydrolase type 1 (Lpp1; alternative designations Ltap and Vangl2) gene in the loop-tail (Lp) mouse was one of the first genes to be identified as a cause of craniorachischisis (Murdoch et al. 2001a; Kibar et al. 2001), but several other mutants have now been identified, including mice with null mutations in spin cycle (Cadherin, EGF LAG seven-pass G-type receptor 1 [Celsr1]), crash [a separate Celsr1 defect]), circletail (Crc) and also animals with double null mutations in disheveled (Dvl)-1 and Dvl-2 (Murdoch et al. 2003, Murdoch et al. 2001b; Hamblet et al. 2002; Curtin et al. 2003).
Holoprosencephaly (HPE) is defined as an incomplete separation of the forebrain. The defect can manifest as a single cerebral hemisphere, but in the most severe manifestations, facial structures are also affected, producing the malformation referred to as “cyclopia.” The genesis of HPE is associated with many environmental and genetic factors, many of which have been studied in GEM. Aberrant Shh signaling was among the first genetic factors demonstrated to contribute to human HPE (Belloni et al. 1996; Roessler et al. 1996). Secreted Shh protein is expressed in the prechordal plate and notochord during early embryogenesis and is required for ventral midline induction of the floor plate and motor neurons in the neuroectoderm (Marti et al. 1995a; Marti et al. 1995b; Roelink et al. 1995). Genetic ablation of Shh in mice induces HPE, cyclopia, and defective axial patterning (Chiang et al. 1996; Geng and Oliver 2009). Other GEM that exhibit HPE carry mutations in the Nodal signaling pathway, Six3, Zic2, Tgif, Megalin, Cdc42, or various Bmp inhibitors (reviewed in Schachter and Krauss 2008).
In addition to overt NTDs, other abnormal neural phenotypes that can be readily identified in the CNS of developing mice are characterized by anomalies in shape and size that are detected during a detailed histomorphologic evaluation. Common examples of such defects include macroencephaly due to aberrant apoptosis (Yoshida et al. 1998) or neuronal dysplasia (Backman et al. 2001), microencephaly resulting from early toxicant-induced neuronal loss (Inouye and Murakami 1978), and the presence of incompletely migrated cells (i.e., ectopias [also called heterotopias]; Bolon et al. 2013). These changes typically develop from insults encountered prior to birth or in the early postnatal period, but aberrant brain structure due to altered neurodevelopment may not become evident until many weeks after birth (Backman et al. 2001). As with any phenotyping effort, the key to success in recognizing such lesions is that the person evaluating the CNS has sufficient training and experience to be able to discriminate normal from abnormal patterns of neuroanatomic development. In the ideal setting, such individuals will be experienced comparative pathologists, as such researchers are capable not only of evaluating the neural phenotype but also of recognizing phenotypes in other organs and tissues.
Footnotes
Authors’ Note
Vivian S. Chen and James P. Morrison are co-first authors.
Acknowledgments
The authors wish to acknowledge Dr. Patricia Jensen (NIEHS) and Dr. Gregory Krane (NIEHS) for their article review and helpful comments and Beth Mahler (Experimental Pathology Laboratories, Inc.) and Elizabeth Ney (NIEHS) for their image scanning and photographic assistance.
Author Contribution
Authors contributed to conception or design (VC, JM, MS, JF, BB, SE); data acquisition, analysis, or interpretation (VC, JM, MS, JF, BB, SE); drafting the manuscript (VC, JM, MS, BB, SE); and critically revising the manuscript (VC, JM, JF, BB, SE). All authors gave final approval and agreed to be accountable for all aspects of work in ensuring that questions relating to the accuracy or integrity of any part of the work are appropriately investigated and resolved.
Declaration of Conflicting Interests
The author(s) declared no potential conflicts of interest with respect to the research, authorship, and/or publication of this article.
Funding
The author(s) disclosed receipt of the following financial support for the research, authorship, and/or publication of this article: This research was supported [in part] by the Intramural Research Program of the National Institutes of Health, National Institute of Environmental Health Sciences (NIEHS).
Supplemental Material
Supplementary material for this article is available online.
Notes
References
Supplementary Material
Please find the following supplemental material available below.
For Open Access articles published under a Creative Commons License, all supplemental material carries the same license as the article it is associated with.
For non-Open Access articles published, all supplemental material carries a non-exclusive license, and permission requests for re-use of supplemental material or any part of supplemental material shall be sent directly to the copyright owner as specified in the copyright notice associated with the article.