
Abstract
Terminal body weights (TBWs), thymus weight parameters, and thymus morphology were retrospectively evaluated in 453 cynomolgus monkeys assigned to control groups on nonclinical toxicity studies. Morphology of bone, ovary, and testis/epididymis were used to determine maturity status of individual animals. There was no correlation between TBW and thymus weight (absolute and/or relative to TBW or brain weight). Thymus weight parameters and grades of decreased lymphocytes in the thymus were highly variable in immature animals compared to mature animals. There was also high (up to 11-fold) variability of thymus weight parameters within a given control group on the same study (generally 3 or 4 animals per sex). Several parameters evaluated had more pronounced age-related changes in males when compared to females. Our results demonstrate the inherent variability of thymus weight parameters and morphologic observations for cynomolgus monkeys on toxicology studies. Changes in thymus parameters in cynomolgus monkeys are unreliable indicators of immunomodulation or immunotoxicity in the absence of other relevant findings. Therefore, the thymus parameters commonly evaluated in preclinical safety assessments should not be the primary data set used to determine the presence of a direct test article–related effect on the immune system.
Introduction
The thymus is a primary lymphoid organ with an essential role in development of adaptive immunity, recognition of self-antigens, and development and differentiation of T lymphocytes (Dzhagalov and Phee 2012; Murphy 2011; Rothenberg and Yui 2008). Progenitor T lymphocytes from bone marrow enter the thymus at the corticomedullary junction (CMJ) and undergo dramatic expansion as double negative cells (CD4− CD8−). Lymphocytes migrate from the region of the CMJ to the outer cortex and develop into double positive cells (CD4+ CD8+), which comprise the majority of cortical lymphocytes throughout life. After positive selection, double positive cortical T lymphocytes migrate to the medulla, become single positive cells (CD4+ or CD8+), and undergo negative selection. Only 1 to 5% (106–108 cells) of all thymus lymphocytes survive to exit the thymus and enter circulation.
The light microscopic appearance of the thymus in the cynomolgus monkey follows an age-related pattern consistent with other mammalian species including humans (Buse 2005; Buse, Habermann, and Vogel 2006; Hendrickx, Makori, and Peterson 2002; Makori et al. 2003; Spoor, Radi, and Dunstan 2008; Shanley et al. 2009; Chapman and Allen 1971). At approximately gestation day 60, the cynomolgus thymus is fully developed and functionally mature, with a morphologically distinct cortex and medulla with Hassall’s corpuscles. Maximal cynomolgus thymus weight relative to body weight occurs at birth, and maximal absolute thymus weight occurs near sexual maturity. For male cynomolgus monkeys, sexual maturity has been estimated to occur between 3½ and 4½ years (Steiner and Bremner 1981; Dang and Meusy-Dessolle 1984; Smedley et al. 2002; Luetjens and Weinbauer 2012), but the peripubertal period may last from 2.5 to 5.5 years of age (Irfan, Schlatt, and Weinbauer 2011; Luetjens and Weinbauer 2012). For females, sexual maturity is estimated to occur at 2 to 4 years (Weinbauer et al. 2008; Van Esch et al. 2008). In both the human and cynomolgus monkey, the beginning of thymus involution (variably called physiologic or age-related involution) coincides with the onset of sexual maturity.
Age-related involution in the thymus is associated with similar morphologic features in all mammalian species. During involution, the thymus progressively decreases in size and weight, and the cortex and medullary regions become indistinct due to a dramatic decrease in the number of cortical lymphocytes. The remaining lymphocytes have been shown in mice to have a decreased proliferative capacity and an increased apoptotic rate (Bar-Dayan et al. 1999). Interlobular fat increases as lymphocyte numbers decrease; the thymus is partially (younger animals) or fully (older animals) circumscribed by adipose connective tissue. Age-related involution is influenced by growth hormone, sex steroids, and hormones involved in the hypothalamus–pituitary–adrenal axis (Calder et al. 2011; Chinn et al. 2012). The female thymus involutes over a longer period of time compared to that of males (Spoor, Radi, and Dunstan 2008; Gui et al. 2012; Chinn et al. 2012; Sato et al. 2012; Pido-Lopez, Imami, and Aspinall 2001; Ackman et al. 2013; Araki et al. 2016). In mice, genetics has a significant role in thymus size and rate of involution; however, the role of genetics on thymus parameters in cynomolgus monkeys has not been evaluated (Peleg and Nesbitt 1984; Hsu et al. 2003; Wang et al. 2006). In toxicology studies, variables such as stress can affect thymus weight and morphology and add to the difficulty in interpretation of the significance of thymus changes (Everds et al. 2013; Pearse 2006; Elmore 2006; Haley 2003; Haley 2013).
In toxicology studies, the thymus is often weighed and examined by light microscopy to assess test article–related effects. Changes in thymus weight and morphology are specifically listed as signs of immunotoxic potential in the ICH Harmonized Tripartite Guideline “Immunotoxicity Studies for Human Pharmaceuticals” (2005). In addition, thymus weights have been reported as especially sensitive to immunomodulatory agents (Schuurman et al. 1992; Kuper et al. 2000; Kuper et al. 2007; Germolec et al. 2004; Elmore 2006; Basketter et al. 1995; Haley 2013). For rodents, thymus weights and morphology are relatively consistent within a given set of control animals due to the narrow range of chronological ages and general uniformity of animal characteristics; this consistency, plus the large number of animals per group, leads to greater confidence in assessing whether changes are due to the test article (Sellers et al. 2007). In contrast to rodents, thymus weight and light microscopic observations in the cynomolgus monkey can be quite variable even among control animals. Factors that contribute to this variability are the typically wider range of chronological age and maturation stage, body weight, and the inherent intersubject variability in techniques used for collection of the thymus. Cynomolgus monkeys on toxicology studies are often peripubertal, a stage at which rapid changes occur in thymus weight and morphology across species (Calder et al. 2011; Montecino-Rodriquez, Min, and Dorshkind 2005). These variables, combined with the low number of animals per group in toxicology studies (generally 3 or 4/sex/group), compound the challenges of evaluating and interpreting thymus changes in the cynomolgus monkey.
The objectives of this study were to assess and describe the range of light microscopic observations in the thymus from cynomolgus monkeys, to determine maturity status, and to determine the relationship between the light microscopic observations in the thymus and clinical and anatomical pathology parameters (e.g., peripheral blood lymphocyte count, sexual and skeletal maturity, and body and thymus weight). This study extends and refines previously published observations of incidental findings in the thymus (Chamanza et al. 2010; Ito et al. 1992; Okazaki et al. 1996; Kaspareit et al. 2006; Spoor, Radi, and Dunstan 2008) by providing a detailed evaluation of the range of light microscopic observations correlated with thymus weight and maturity stage. We also conducted a review of selected immunomodulators to determine the relative sensitivity of thymus and spleen parameters. To our knowledge, this is the first time that a retrospective study was conducted to determine whether there is any correlation between thymus weight and light microscopic features of sexual and skeletal maturity parameters. These results provide objective criteria for assessing whether thymus weight data and microscopic observations in the thymus add value to study interpretation and highlight variables that could result in misinterpretation.
Materials and Methods
Study Design
All studies were conducted in accordance with institutional and governmental guiding principles in the use of animals. Care and use of animals were conducted as specified by U.S. Department of Agriculture Animal Welfare Act (9 Code of Federal Regulations [CFR], parts 1, 2, and 3) and as described in the Guide for the Care and Use of Laboratory Animals (Institute for Laboratory Animal Research [ILAR]) publication that was current at the time of study conduct and/or the Canadian Council on Animal Care. Animals were housed at Canadian Council on Animal Care and/or Association for Assessment and Accreditation of Laboratory Animal Care–accredited facilities in species-specific housing. All research protocols were approved by the Institutional Animal Care and Use Committees of the Testing Facilities prior to dose administration.
All cynomolgus macaques (Macaca fascicularis) assigned to control groups on nonclinical toxicology studies from 2002 to 2009 were considered for inclusion in this study (n = 509; 255 male and 254 females; 53 studies). All animals were reported as seronegative for simian immunodeficiency virus, simian retroviruses, simian T-lymphotropic virus, and herpes B virus, and skin-tested negative for tuberculosis prior to being relocated to testing sites. When study records were unclear as to geographic origin of animals, peripheral blood mean cell volume data (Butterfield 1997) were used to confirm or to assign origin. Most monkeys (86%) originated from China or Southeast Asia, and the remainder originated from Mauritius. Animals were only included if they had thymus weight data 1 and histologic sections of thymus, distal femoral growth plate, testes and epididymides (males; n = 232), and ovaries (female; n = 221). Terminal body weight (TBW) was available for all animals, but 2 males and 1 female were lacking brain weight (BRN). Most (81%) of the animals had hematology data available at the approximate time of necropsy.
Control animals were administered vehicle by the intravenous (31%), subcutaneous (38%), nasogastric (3%), or oral gavage route (27%). Study duration ranged from 2 weeks to 9 months (mean length of 3 months, median length of 2 months), and recovery phases ranged from 1 week to 1 year (mean length of 3 months, median length of 1 month). Approximately 23% of the animals were assigned to recovery phases. Studies were conducted at 3 geographically distinct contract research organization (CRO) facilities: site A (45 studies), site B (2 studies), and site C (4 studies).
Glass slides of tissue sections stained with hematoxylin and eosin (thymus, testes, epididymides, ovary, and femur) were retrieved from archives. Individual animal data were retrieved from an internal database or from study reports.
Light Microscopic Evaluation of Tissues
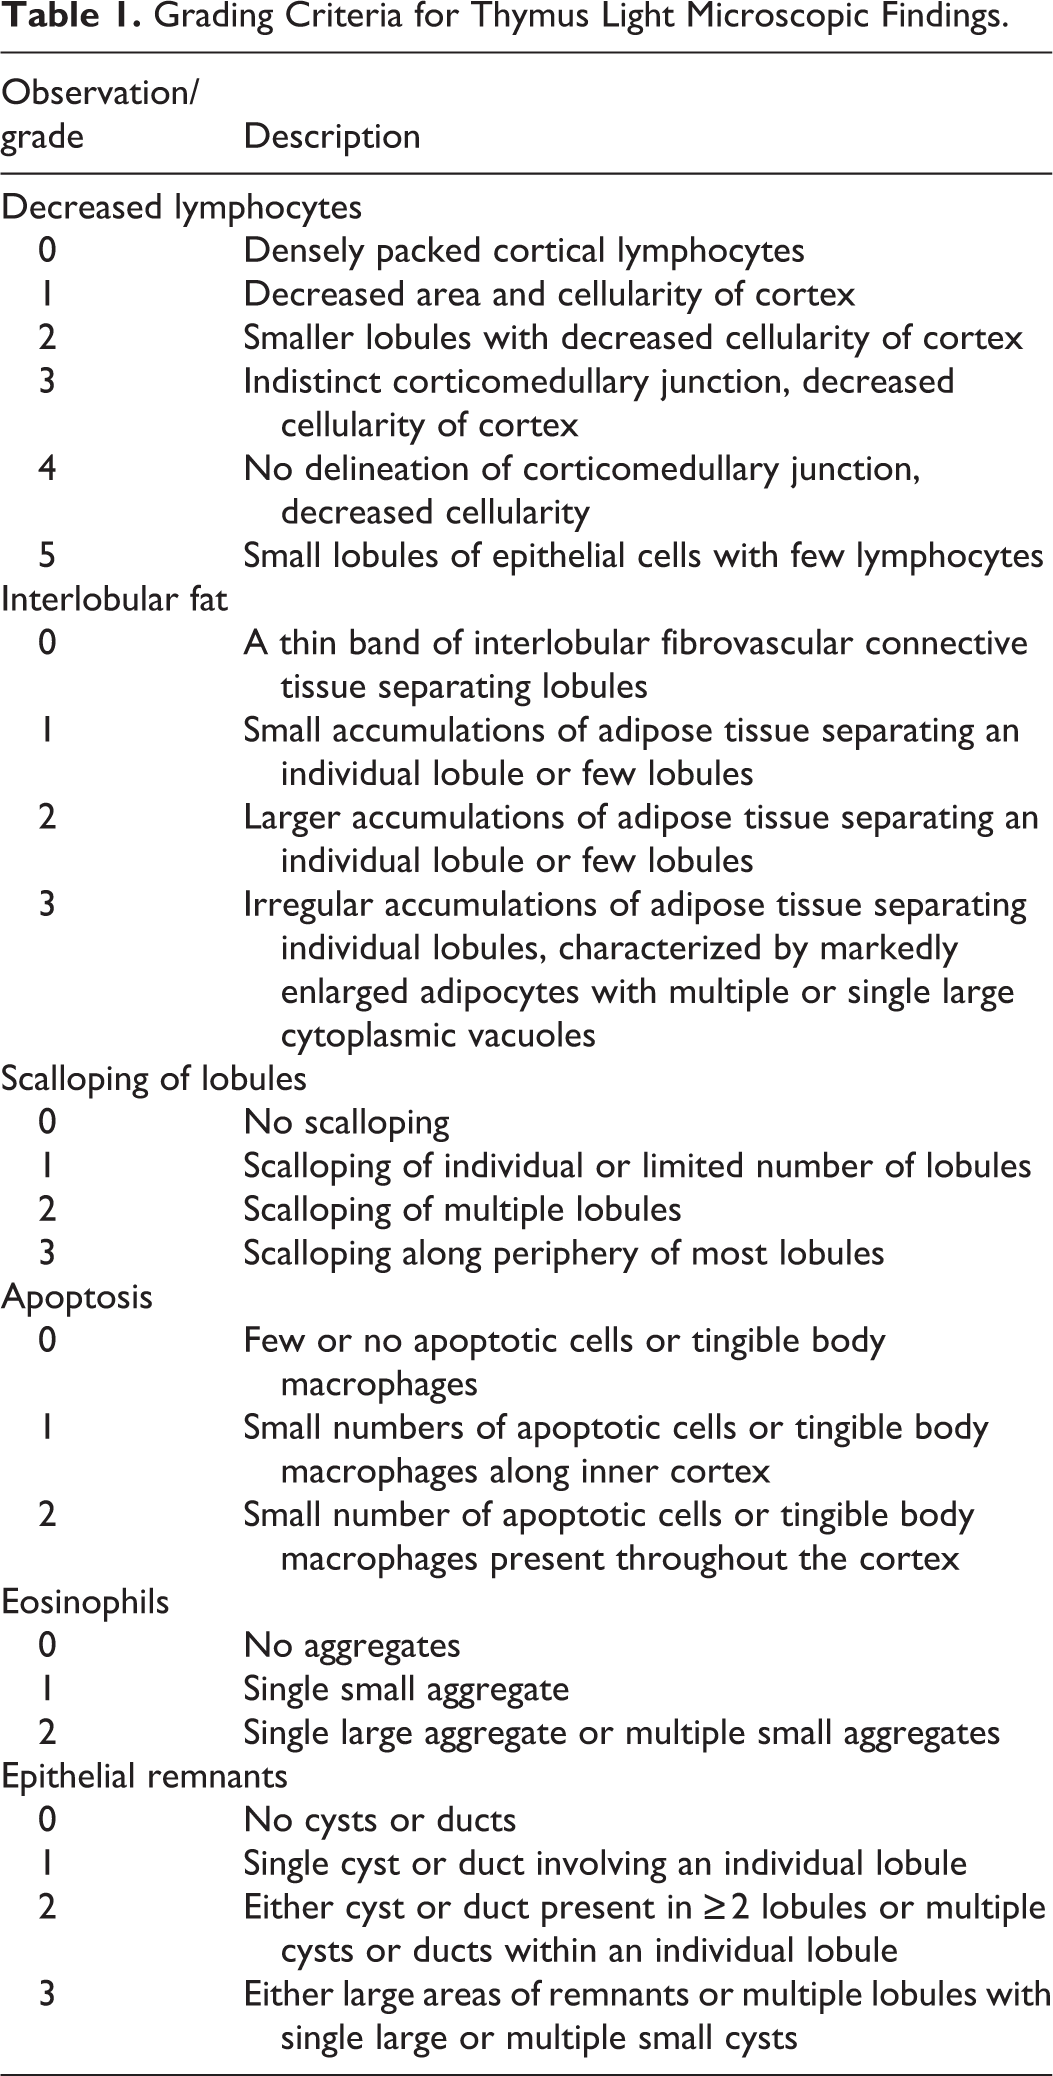
Histologic sections of thymus were evaluated by a board-certified veterinary anatomic pathologist (P.W.S.) for quality, overall microscopic anatomy, and specific observations. Six thymus observations (decreased lymphocytes, interlobular fat, scalloping of lobules, apoptosis of lymphocytes, eosinophils, and epithelial remnants) were subjectively graded (Table 1 and Figure 1). Additional light microscopic observations (foamy macrophages, mineralization, microabscesses, acute inflammation, hemorrhage, and thrombus) were also recorded when present. All thymus light microscopic evaluations were done prior to knowledge of sex, sexual or skeletal maturity, or body weight. Grading criteria and representative sections were reviewed for consensus by 12 board-certified veterinary pathologists, including authors P.W.S., N.E., S.T.G., J.W., and R.G. After the consensus discussion, slides were reviewed a second time by P.W.S., and assignment of grades was confirmed or modified. A separate peer review was then conducted by a board-certified veterinary anatomic pathologist (J.W.) to assure quality and accuracy of the light microscopic data. Approximately 10% of the slides were graded for decreased lymphocytes in a blinded manner, including at least 8 slides of each severity score (0–5). The majority of peer review results agreed with the original grade, with the remainder split equally between 1 grade higher and lower than the original result. Based on these results, none of the original scores was changed. Grades for histologic observations were analyzed with respect to stages of maturity, TBW, and thymus weight parameter values.
Grading Criteria for Thymus Light Microscopic Findings.
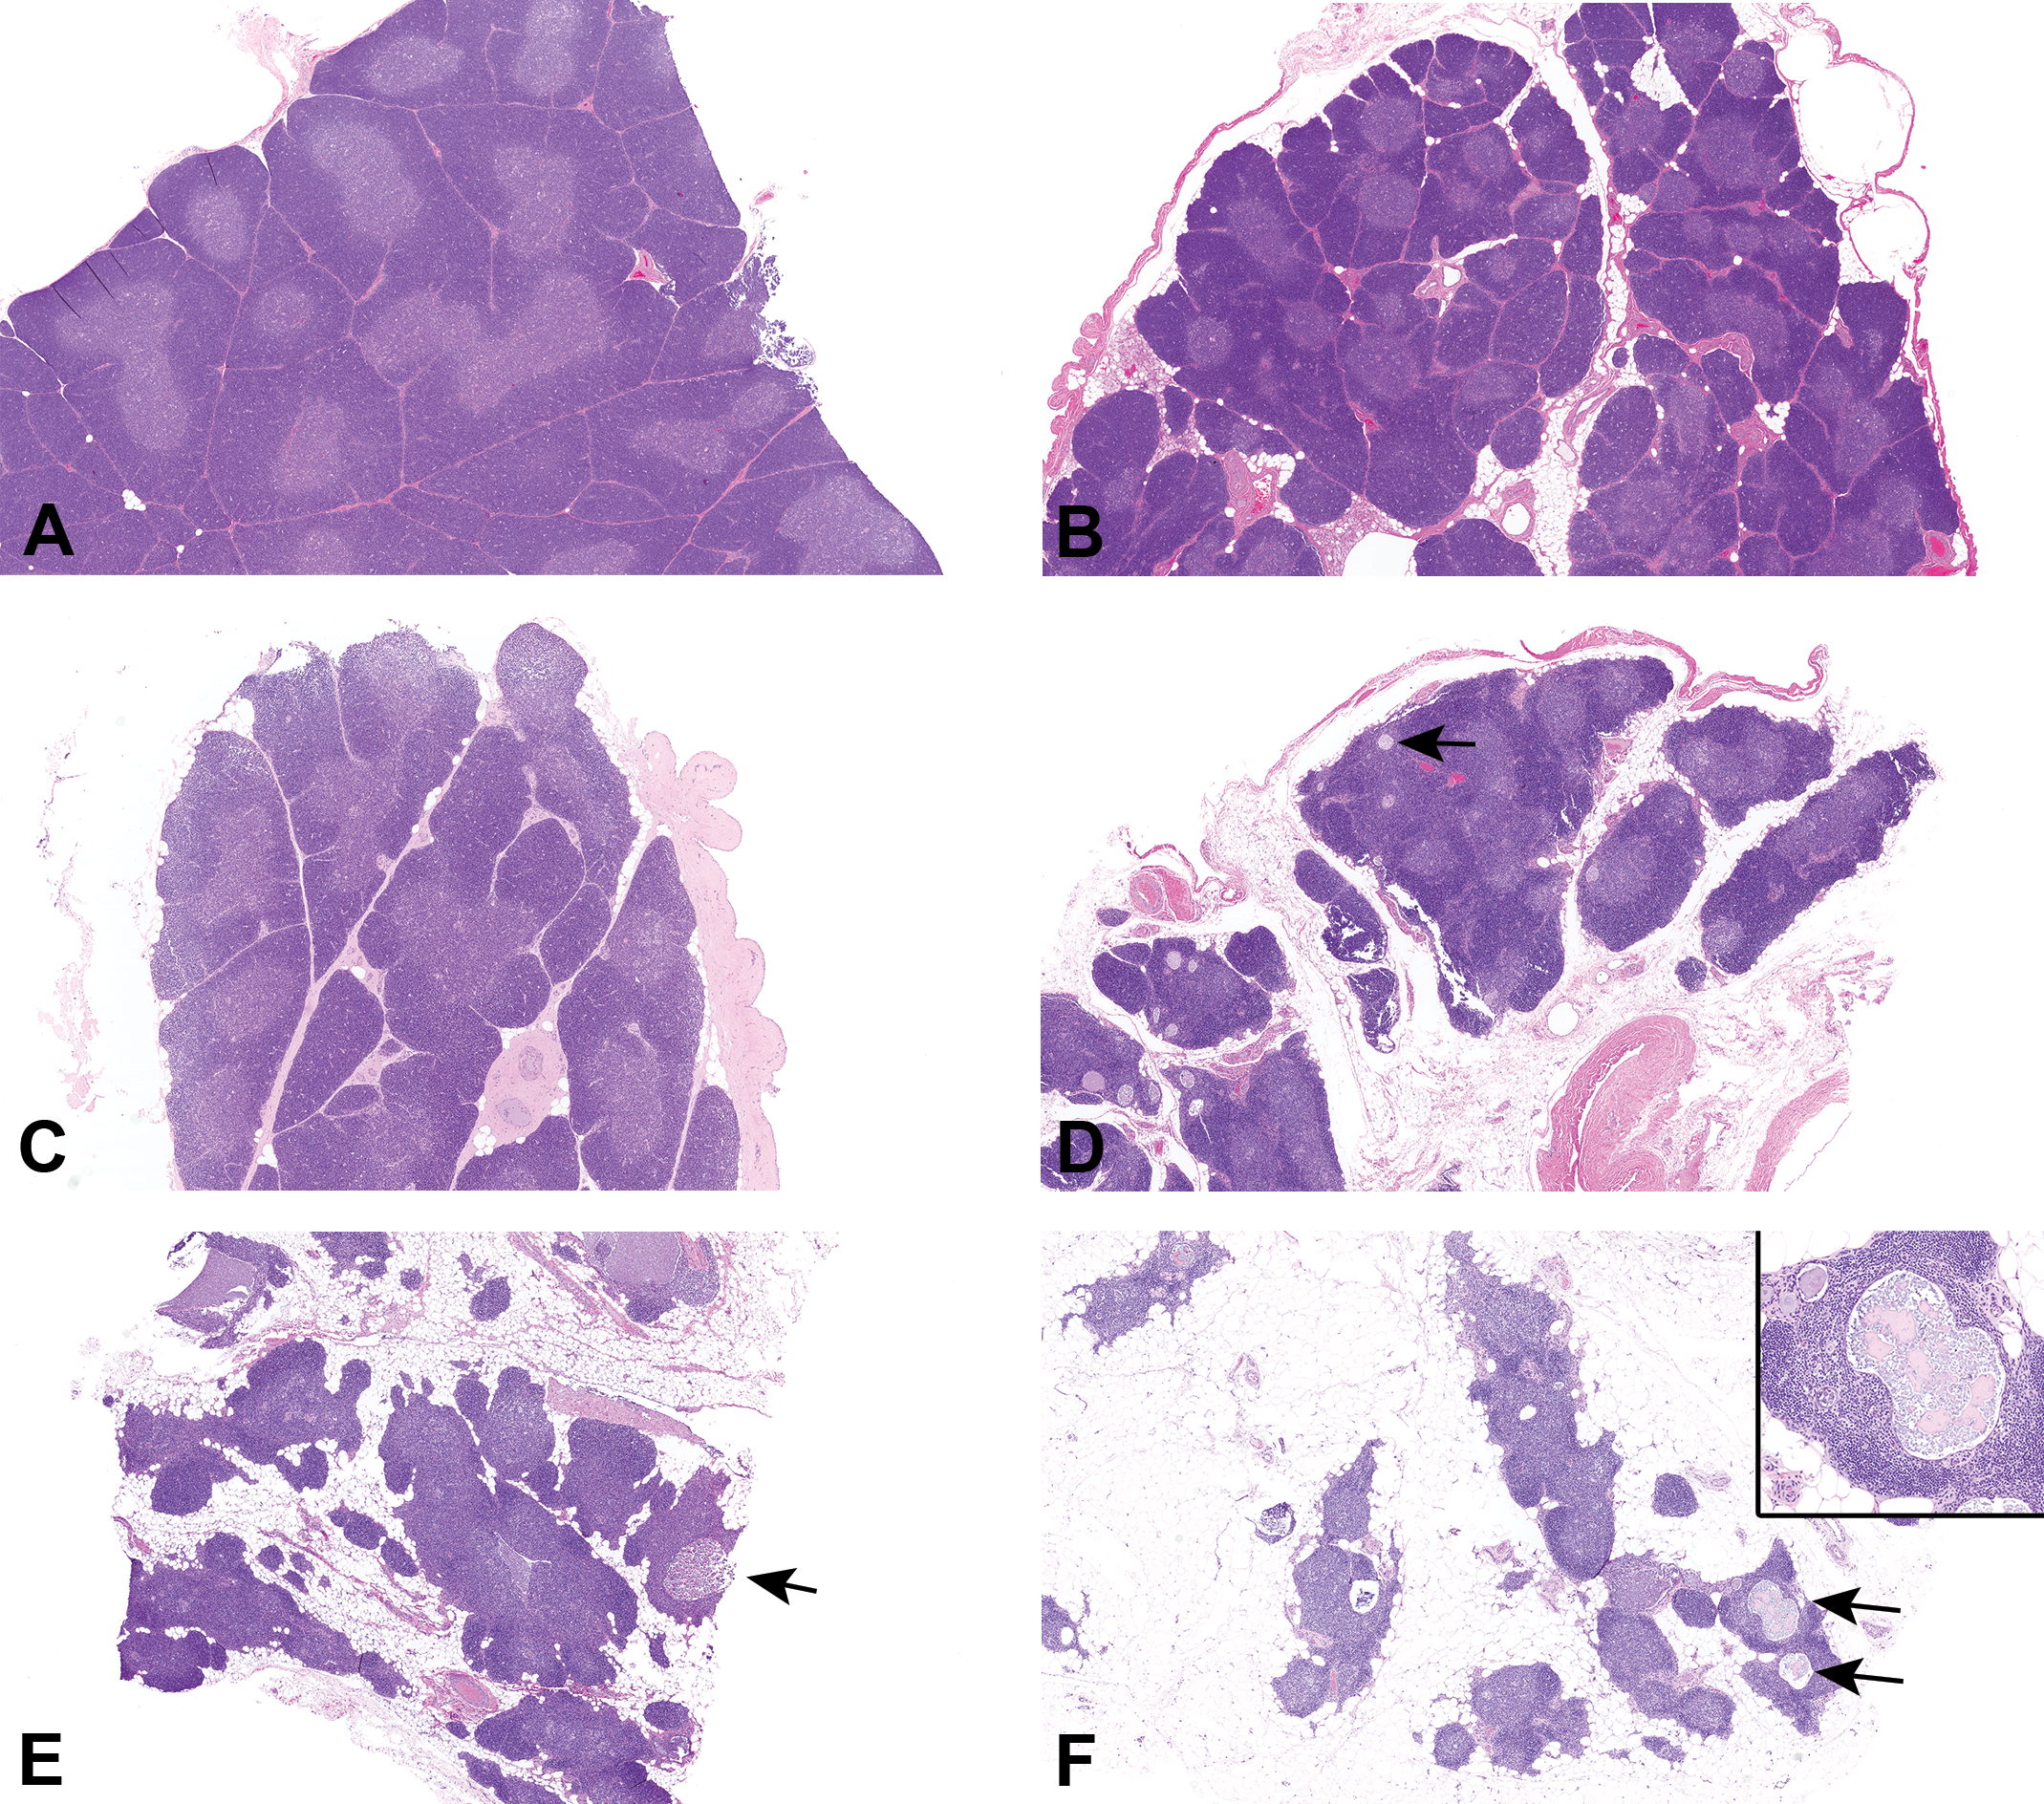
Representative photomicrographs of control cynomolgus monkey thymus sections stained with hematoxylin and eosin. Images demonstrate grading scheme for decreased lymphocytes. (A) Grade 0 (no decrease in lymphocytes), (B) grade 1 (minimal), (C) grade 2 (slight), (D) grade 3 (moderate), (E) grade 4 (marked), and (F) grade 5 (severe). With increasing grade, demarcation of the cortex and medullary regions becomes progressively less distinct. At grade 0, the cortex contains densely packed lymphocytes and a clear corticomedullary demarcation. At grade 3, there is coalescing of medullary regions. By grade 5, some lobules are comprised only of medullary regions. Epithelial remnants, often with a cystic appearance (arrows), are more apparent as the severity of decreased lymphocytes increases (inset, F). Interlobular fat and scalloping at the periphery of lobules also increase with decreased lymphocytes.
Sections of testes/epididymides, ovaries, and femur were independently evaluated by board-certified veterinary anatomic pathologists (R.G., J.W., and S.T.G., respectively) to estimate the stage of sexual and skeletal maturity of the monkeys. Other data commonly used to evaluate maturity (testes volume, semen or vaginal smear analysis, hormone analysis) were not available in this retrospective study.
Male reproductive tissues (testis and epididymis) were classified as immature, peripubertal, or mature based on a combination of light microscopic criteria. Sexually immature testes were densely cellular and compact, with seminiferous tubules lined by Sertoli cells and spermatogonia with occasional spermatocytes. Spermatids were not present, and epididymides did not contain sperm. Peripubertal testes had seminiferous tubules lined by spermatogonia, spermatocytes, and occasional spermatids. Epididymides contained no or low numbers of spermatozoa. Seminiferous tubules and epididymal ducts sometimes contained sloughed cells, degenerate spermatocytes, and cell debris. Sexually mature testes had well-defined seminiferous tubules lined by Sertoli cells and various stages of fully differentiated and synchronous spermatogenesis, with late stage spermatids present near the luminal surface, and epididymides containing luminal sperm. The light microscopic characteristics of the testes/epididymides in these monkeys were consistent with published light microscopic descriptions of cynomolgus testis/epididymis (Luetjens and Weinbauer 2012; Smedley et al. 2002; Ku et al. 2010; Marty et al. 2003).
Ovaries were classified as immature by the absence of a corpora lutea (CL) in both ovaries (CL absent) and as peripubertal or mature by the presence of CL or their remnants in at least 1 of 2 ovaries (CL present). Limited sampling (1 section/ovary) may have resulted in underestimation of the number of peripubertal/mature ovaries. The light microscopic characteristics of CL in these monkeys were consistent with published light microscopic descriptions (Buse 2008).
Distal femoral growth plates were classified as open (complete physis), segmentally closed (any portion of the physis closed), or closed (no remnant of the physis; Figure 2).
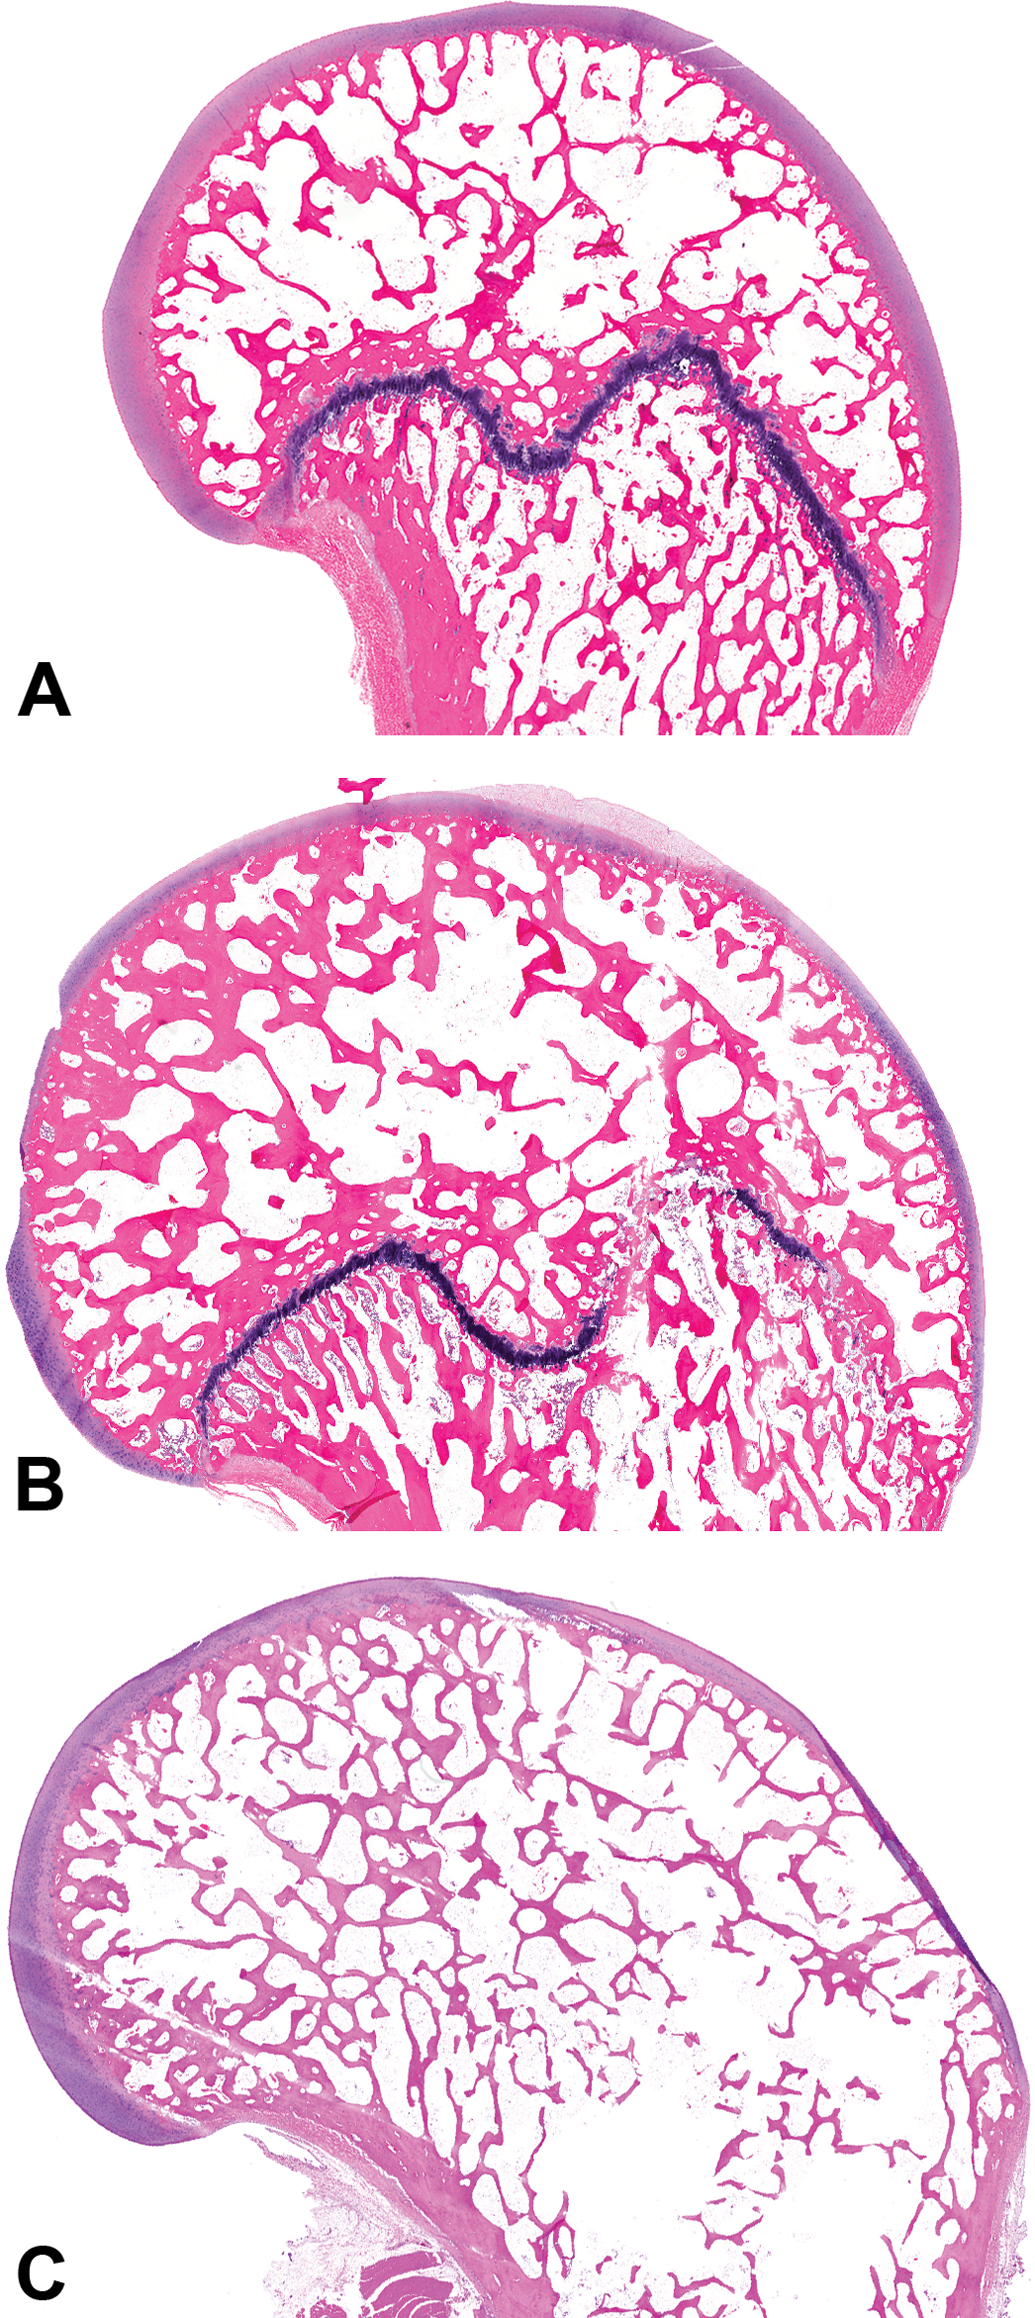
Representative decalcified distal femur sections from control cynomolgus monkeys. Photomicrographs show representative growth plates that are open (A), segmentally closed (B), or closed (C). Hematoxylin and eosin stain.
The testis/epididymis, ovarian, and growth plate evaluations were used to assign animals to maturity stages based on the combination of sexual and skeletal maturity (Table 2). There were 4 maturity stages assigned in male monkeys. Male maturity stages 1 to 3 were characterized by open distal femoral growth plates and immature (stage 1), peripubertal (stage 2), or mature (stage 3) testis and epididymis. Male maturity stage 4 had segmental or complete physis closure and mature testis and epididymis.
Classification of Animals by Maturity Stage.
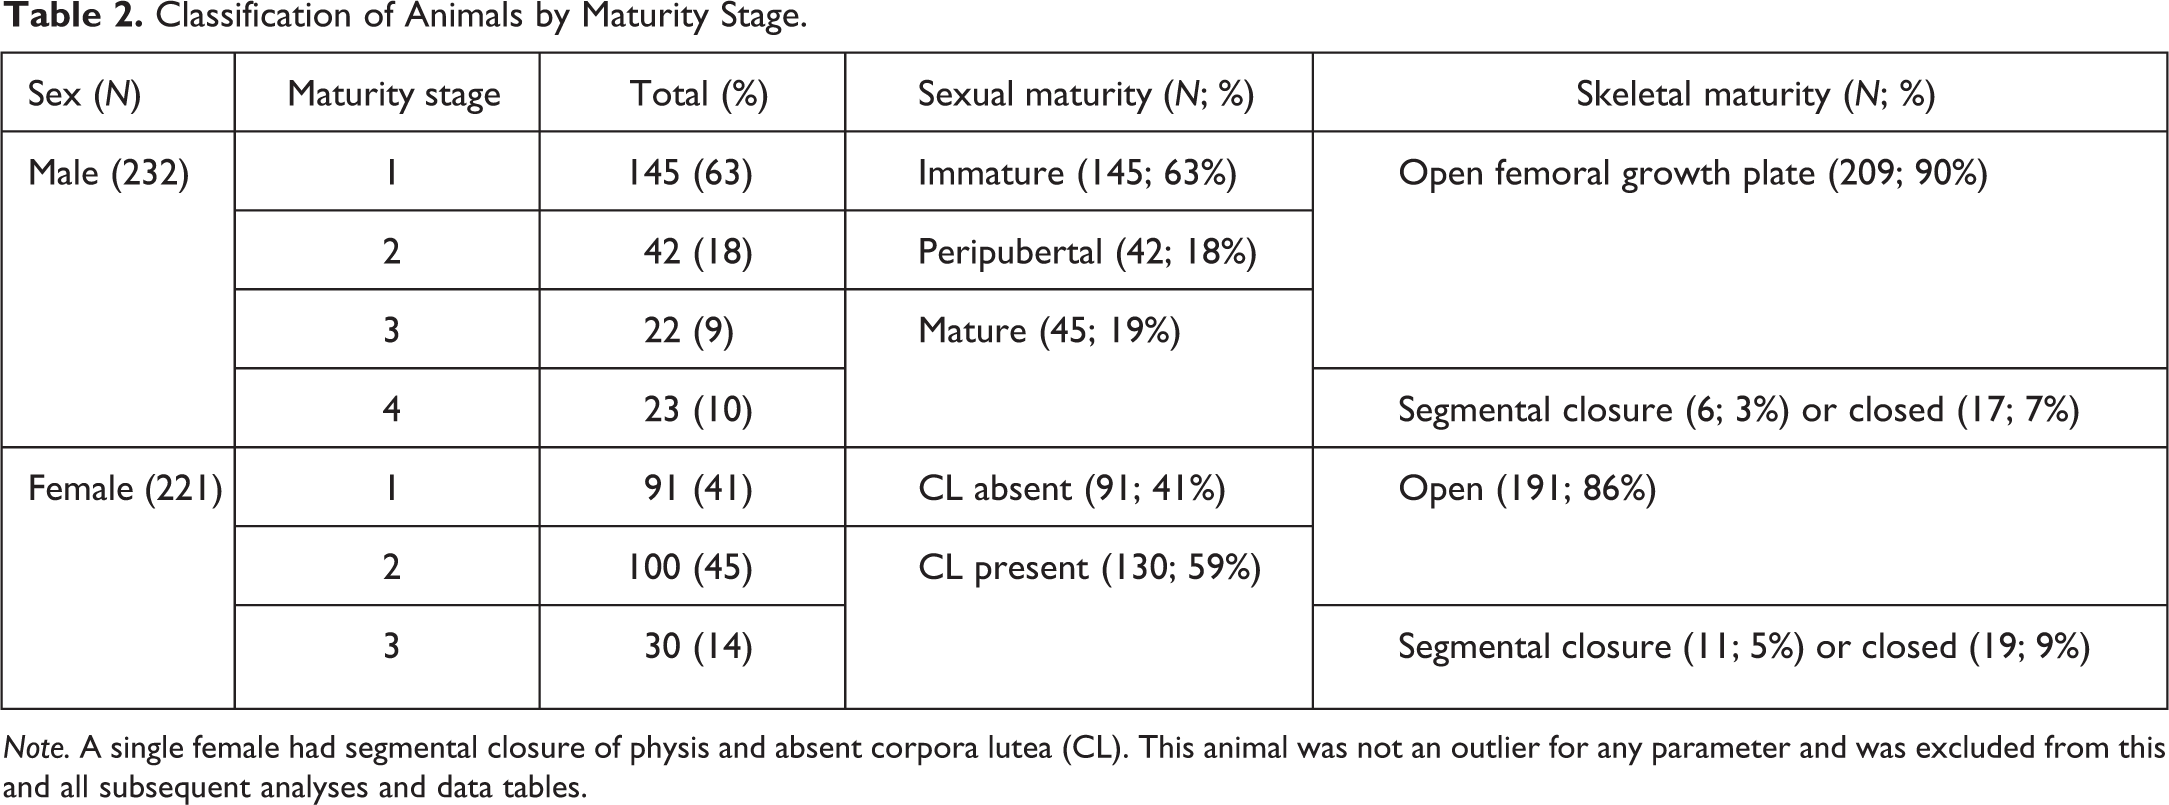
Note. A single female had segmental closure of physis and absent corpora lutea (CL). This animal was not an outlier for any parameter and was excluded from this and all subsequent analyses and data tables.
There were 3 maturity stages assigned to female monkeys. Female maturity stages 1 and 2 had open femoral physes, and either no ovarian CL (stage 1) or at least 1 CL (stage 2). Female maturity stage 3 had segmental or complete physis closure and a CL present. One female had segmental closure of the femoral physis but no CL. This animal was not an outlier for any other parameter (e.g., TBW, thymus weight parameters, histology of thymus) and was not included in this study.
Analysis of TBW, Thymus Weight Parameters, and Peripheral Leukocyte Counts
TBW and thymus weight parameter data were compared to CRO site, route of administration, age, sex, indicators of sexual and skeletal maturity, and thymus histologic observations using Spotfire™ graphical visualizations and descriptive statistics including mean, median, minimum, maximum, and standard deviation. The range of TBW and thymus weight parameter values was determined by calculating the ratio of (max/min) and the difference between (max − min) the highest and lowest TBW and thymus weight parameter value by sex, maturity stage, and grade of decreased lymphocytes. Max/min was a measurement of the fold change between the highest and lowest value in a given cohort, and max − min calculated the range of values for that same cohort of animals. Peripheral blood lymphocyte counts were compared to maturity stage and grade of decreased lymphocyte counts.
The variability within a single-study control group (e.g., control males from 1 study at termination of dosing) was evaluated in 2 different ways. Similar to the analysis above, calculations were performed on TBW and thymus weight parameters to characterize the variability in values observed within a single-study control group. For this analysis, the ratio of (max/min) and the difference between (max − min) the highest and lowest TBW and thymus weight parameter value were calculated per sex for each single-study control group. Ten groups consisted of only 1 animal and were eliminated from this calculation. In 2 control groups (1 group of 2 animals and 1 group of 3 animals), all animals had the same TBWs, which resulted in the lowest TBW ratio being 1 and the lowest TBW difference being 0 for within-group calculations. There were no groups containing animals with identical thymus weight parameter values.
In order to evaluate the variability in maturation and morphology within single-study control groups, the number of different stages of maturation and grades of decreased lymphocytes was determined for each control group.
Statistical Analysis
A simple least squares model was applied using the programming language and software environment “R” (R Foundation for Statistical Computing, Vienna, Austria. Accessed August 14, 2015, https://www.R-project.org/, version 3.2.2) to identify any significant factors predicting the observed values of the dependent variables (e.g., TBW, thymus weight parameters [absolute, relative to TBW, and relative to BRN], thymus microscopic observations) as a function of any individually independent variables (sex, location [of study], study length, route of administration, study phase [dosing or recovery], skeletal maturity, sexual maturity [ovary or testes/epididymis], geographic origin, and the combined maturity stage). Correlation coefficient (R2) values were calculated on the assumption that numeric calls for microscopic findings are treated as real-valued dependent variables, while the body and thymus weights were naturally real valued. The linear regression function of Spotfire was used to evaluate the relationship for each sex between TBW and absolute thymus weights and between TBW, thymus weight parameters, and peripheral lymphocyte counts.
Data Review of Selected Immunomodulators
To evaluate the relevance of the thymus for the determination of immunomodulation on toxicology studies, a limited review of regulatory documents and published literature was performed for rats and monkeys. For rats, PubMed (http://www.ncbi.nlm.nih.gov/pubmed) was searched for literature describing immunotoxicology studies conducted on well-known compounds that reported organ weight data with or without light microscopic data. For cynomolgus monkeys, marketed immunomodulatory drugs were selected if data could be located for either organ weights and/or light microscopic findings. For these compounds, information was gathered using the Drugs@FDA (https://www.accessdata.fda.gov/scripts/cder/drugsatfda/) and PubMed websites. One marketed immunomodulatory drug, Mylotarg (gemtuzumab ozogamicin), had organ weight and light microscopic data that were generated in rats rather than cynomolgus monkeys, and data from this study were also included in this analysis. An arbitrary limit of 14 studies was chosen as sufficient for this evaluation.
Results
Statistical Modeling
The single best prediction for the single factor statistical models was for TBW predicted by the maturity stage, with an R2 value of 72%. For comparison, the TBW predicted by sex had a correlation of 19%. For the thymus, decreased lymphocytes were predicted by the maturity stage, thymus scalloping of lobules, and thymus interlobular fat at R2 values of 44, 39, and 27%, respectively. The highest correlation for the other thymus findings was 13% for thymus apoptosis predicted by maturity stage (Supplemental Table 1).
Geographic Origin, Study Characteristics, and Maturity Stages
None of the data presented in this study differed based on route of administration, CRO site, geographic origin of the monkeys, length of study, or phase of study (Supplemental Table 1).
Each study group was examined, per sex, to determine the number of stages of maturity within a group. Single-study control groups were not uniform in that they were often composed of animals representing 2 different maturity stages, with a few groups composed of 3 different stages per sex (e.g., in males, 9% of the single-study control groups had 3 stages of maturity represented; Table 3). Some single-study control groups were also composed of animals at both ends of the spectrum for maturity stage, that is, some animals were classified as stage 1 while others were classified as stage 4 (males) or 3 (females).
Distribution of Total Number of Maturity Stages and Grades of Decreased Lymphocytes in the Thymus for Single-study Control Groups.
Note. Values in the table represent the percentage of control groups that had the indicated number of stages or grades.
TBW, Thymus Weight Parameters, and Peripheral Blood Lymphocytes
There was no correlation between TBWs and absolute thymus weights. Correlation coefficients (R2) for these parameters were very low (males, .0137; females, .000; Supplemental Figure 1). The slope of the linear regression line was slightly negative for males (slope = −.29) and horizontal for females (slope = .01).
Descriptive statistics for TBW and thymus weight parameters for males and females are listed in Table 4. Males had higher mean values for TBW and thymus weight parameters than that of females.
Terminal Body Weight and Thymus Weight Parameter Values.
Note. Table excludes TBW and thymus weight parameters for 1 female with a thymus weight of 0.002 g (stage of maturity = 2, grade of decreased lymphocytes = 1) and thymus (% BRN) for 2 males and 1 female with no brain weights available for calculations. Avg. = average; BRN = brain weight; TBW = terminal body weight; Thy = thymus weight (g); Std dev. = standard deviation; min = minimum value; max = maximum value; max/min = maximum value divided by minimum value.
TBW and thymus weight parameters compared to maturity stage
TBW, thymus weight (Thy), and thymus-to-body (Thy%TBW) and BRN (Thy%BRN) ratio data were compared to sex and maturity stage (Figure 3A–D and Supplemental Table 2). TBW increased with increasing maturity stage (Figure 3A). TBW for males increased more than for females, and mean and median weights were higher in males than in females at each maturity stage. Variability in TBW was higher in males than in females at all maturity stages and increased with increasing maturity stage for both sexes.
Terminal body weight (TBW; A) and thymus weight parameters (B–D) for cynomolgus monkeys grouped by sex and maturity stage. Each marker represents one animal. Fill color is based on grade of decreased lymphocytes (0 = clear and 5 = black). Horizontal marks indicate approximate mean values. Descriptive statistics are located in Supplemental Table 2. The dotted line in Figure 3A indicates the cutoff weight (5.5 kg) proposed by Ku et al. (2010) to assure male sexual maturity. TBW increased with increasing maturity stage (Figure A). TBW for males increased more than for females, and mean and median weights were higher in males than in females at each maturity stage. Variability in TBW was higher in males than in females at all maturity stages and increased with increasing maturity stage for both sexes. Thymus weights decreased with increasing maturity, and variability decreased with increasing maturity (Figures B–D).
Thymus weight parameter values decreased with increasing maturity stage, due to lower numbers at the high end of the range, rather than a decrease in the minimum values (Figure 3B–D). Mean and median thymus weight parameter values were generally higher in males than in females in more immature animals (stages 1 and 2), and lower for males than in females for more mature animals (males at stages 3 and 4 compared to females in stage 3). Variability in thymus weight parameter values decreased with increasing maturity stage, especially in males.
The ratios of the highest to the lowest TBW and thymus weight parameter values (max/min or fold change) were calculated for each sex (Table 4) and for each stage of maturity (Supplemental Table 2). For each parameter, the max/min ratio was higher for males than for females and was generally higher for less mature animals compared to more mature animals. Mean max/min ratios for TBW were 5.6 for males and 2.6 for females. Mean max/min ratios for thymus weight parameters (thymus weight [g], Thy%TBW, and Thy%BRN) including animals of all maturity stages were very high (39.2, 115.4, and 48.1 for males and 17.6, 22.1, and 16.5 for females, respectively). When segregated by maturity stage, max/min ratios were up to 2.9 and 2.6 for TBW and up to 24 and 18.3 for thymus weight parameters for males and females, respectively.
Variability within single-study control groups
To understand the distribution of TBW and thymus weight parameters within each study, similar max/min ratios were performed on data from single-study control groups (Figure 4 and Supplemental Table 3). In addition, the difference max − min between the highest and lowest weight within a group was calculated. Within a single-study control group, ratios and differences for TBWs were smaller than those for thymus weight parameter values. Single-study control group max/min for TBW ranged from 1.00 to 2.65 for males and 1.00 to 1.64 for females, with means of 1.43 and 1.26, respectively. Single-study group max/min ratios for thymus weight parameter values within a single-study control group were similar in males and females and for the 3 thymus weight parameters and ranged from 1.00 to 11.28, with means of approximately 2 to 3. Notably, the highest max/min ratio of 11.28 for thymus weight did not occur in a unique group; it was generated from a group of males with only 2 different grades for decreased lymphocytes. Of the next 8 highest max/min ratios for thymus weight in males, 4 were from groups containing only 1 grade of decreased lymphocytes and the other 4 contained only 2 grades of decreased lymphocytes. The max/min ratios for these 8 groups ranged from 4.89 to 8.78. The difference in absolute thymus weights between the heaviest and lightest thymus within a single study group was as high as 7.164 g for males and 6.380 g in females.
Ratio of the highest to lowest terminal body weight (A) and thymus weight parameters (B–D) for cynomolgus monkeys within a single-study control group and sex. Each marker represents a ratio for a single control group. For each parameter, the max/min ratio was higher for males than for females and was generally higher for less-mature animals compared to more-mature animals. Horizontal marks indicate approximate mean values. Descriptive statistics are located in Supplemental Table 3.
Peripheral blood lymphocyte counts
There was no correlation between TBW or thymus weight parameters and peripheral lymphocyte counts (R2 ranged from 0.00 to 0.15). The range of lymphocyte counts tended to be wider (both higher and lower) in animals classified as stage 1 for maturity or with grade 0 for decreased lymphocytes (Supplemental Figure 2).
Thymus Light Microscopic Observations
All thymuses were adequate for light microscopic evaluation, although there were inconsistencies in the amount of perithymic fat, the cross-sectional area of thymus, and the plane of section in histologic sections of thymus. The following characteristics were graded for severity: decreased lymphocytes, interlobular fat, scalloping of lobules, apoptosis of lymphocytes, eosinophils, and epithelial remnants (Table 5). Additional observations were recorded at low incidences, showed no correlation with other observations, and included foamy macrophages (n = 5), mineralization (n = 4), microabscesses (n = 1), acute inflammation (n = 1), hemorrhage (n = 3), and thrombus (n = 1).
Thymus Light Microscopic Observations in Cynomolgus Monkeys Tabulated by Maturity Stage for Males and Females.
Decreased lymphocytes
Decreased lymphocytes were present in 26% (118/453) of animals (27% [62/232] of males and 25% [56/221] of females), with grades of 1 to 5 for males and 1 to 4 for females (Figure 5). TBW increased with increasing grade of decreased lymphocytes, especially for males. Thymuses without decreased lymphocytes (grade of 0) had the highest and most variable thymus weight parameter values, with males having slightly higher mean and median thymus weight parameter values compared to females. Increasing grades of decreased lymphocytes were generally associated with lower thymus weight parameter values; however, the thymus weight parameters of the majority (∼75% for males and ∼97% for females) of animals with decreased lymphocytes of any grade fell within the weight range for animals without decreased lymphocytes. Weight parameters for thymuses with decreased lymphocytes (with the exception of 1 male and 1 female) were less than 4.043 g, 0.112, and 6.241 for males and 3.349 g, 0.100, and 6.142 for females for Thy, Thy%TBW, and Thy%BRN, respectively. In contrast, for thymuses without decreased lymphocytes, weight parameter values ranged from 0.897 to 12.177 g, 0.017 to 0.577, and 1.257 to 20.245 for males and 0.533 to 7.911 g, 0.023 to 0.420, and 0.868 to 12.582 for females, respectively.
Terminal body weight (TBW; A) and thymus weight parameters (B–D) for cynomolgus monkeys grouped by sex and grade of decreased lymphocytes. Each marker represents one animal. Fill color is based on maturity stage. Lighter colors (blue for males and pink for females) indicate lower maturity stage, and darker colors indicate higher maturity stage. Horizontal marks indicate approximate mean values. Descriptive statistics are located in Supplemental Table 4. TBW increased with increasing grade of decreased lymphocytes, especially for males. Thymuses without decreased lymphocytes (grade of 0) had the highest and most variable thymus weight parameter values, with males having slightly higher mean and median thymus weight parameter values compared to females.
For a given grade of decreased lymphocytes, the ratio of highest to lowest value was as much as a 3.1× and 33.9× (max/min) for TBW and thymus weight parameters, respectively. The more variable thymus weight parameter values were generally in animals without decreased lymphocytes, with max/min ratios ranging from 13.6× to 33.9× (Supplemental Table 4).
Each study group was examined, per sex, to determine the number of grades (0–5) of thymic decreased lymphocytes recorded within that group, similar to the analysis conducted for maturity stage (Table 3). Approximately half of the single-study control groups (56% and 44% of the groups for males and females, respectively) were composed of animals with the same grade for decreased lymphocytes. However, some groups had up to 4 different grades of decreased lymphocytes in males and up to 3 different grades in females. Remarkably, some single-study control groups had at least 1 animal with no decreased lymphocytes and at least 1 with grade 5.
As the stage of maturity increased, the incidence (percentage of total animals) and grade of decreased lymphocytes increased (Figure 6). At maturity stages 1 to 3, the percentage of animals with any grade of decreased lymphocytes was generally comparable between sexes, although stage 3 males had higher microscopic grades than stage 3 females. At male stage 4, greater than 95% of the thymuses had decreased lymphocytes and histologic grades of 4 and 5 predominated.
Incidence of thymus microscopic observations with respect to sex and maturity stage. Each column represents all animals of a given maturity stage. Each color indicates the percentage of cynomolgus monkeys with the corresponding grade for an observation. Incidence graphs are presented for decreased lymphocytes (A), interlobular fat (B), scalloping of lobules (C), apoptosis of lymphocytes (D), eosinophils (E), and epithelial remnants (F). Compared to females, males had more pronounced changes in several parameters when results were compared between early and late maturity stages. The more pronounced changes in males occurred for TBW, thymus weight parameters, decreased lymphocytes, interlobular fat, and scalloping of lobules.
Interlobular fat and scalloping of lobules (Table 5 and Figure 6)
Changes in these observations generally paralleled those of decreased lymphocytes. Increasing grades were associated with increased TBW. For males, increasing grades were also associated with progressively decreased thymus weight parameter values and decreasing variability (Supplemental Figure 3). For females, increasing grades were associated with no change or only minimal decreases in thymus weight parameter values. The incidence and grade of these observations generally increased as maturity stage increased, with more pronounced changes in males compared to females. There was a direct relationship for incidence and degree of decreased lymphocytes and increased interlobular fat or increased scalloping.
Apoptosis, eosinophils, and embryonic epithelial remnants (Table 5 and Figure 6)
Apoptosis was observed in 220 of 453 thymuses, with grades of 1 to 2 (only 6 males and 4 females with a grade of 2). Eosinophils were observed in 152 of 453 thymuses, with grades of 1 to 2 (only 1 male with a grade of 2). Epithelial remnants were observed in 126 of 453 thymuses, with grades of 1 to 3 (only 1 male and 1 female with grades of 3). Observations of apoptosis and eosinophils were observed more frequently in animals with lower maturity stage and without decreased lymphocytes. Apoptosis was also more frequent in animals with lower TBW. There was no correlation between epithelial remnants and other parameters.
Literature Review of Selected Immunomodulators
To determine if the thymus of cynomolgus monkeys was more sensitive than spleen to immunomodulatory agents, a review of regulatory documents and published literature was conducted for 14 immunomodulatory test articles (small molecules and biotherapeutics, targeting B and/or T cells; Supplemental Table 5). This review demonstrated that in rodents and cynomolgus monkeys, neither thymus nor spleen was consistently more sensitive to immunomodulation.
Discussion
This retrospective study evaluated TBW, thymus weight parameters, and light microscopic observations in the thymus of cynomolgus monkeys with respect to maturity stage. To the authors’ knowledge, this is the largest retrospective review of thymus parameters in this species. The 453 monkeys included in this study fulfilled criteria of having histologic sections of thymus, testis/epididymis, ovary, distal femur, and thymus and body weight data.
In this retrospective study, thymuses were evaluated by light microscopy for several findings relevant to thymic development and function. The most relevant morphologic assessment in the thymus for the purposes of toxicology studies is the grading for decreased lymphocytes (Figure 1). Previous morphologic studies of the cynomolgus monkey thymus had graded morphologic changes as “involution” on a 4-point scale (Spoor, Radi, and Dunstan 2008). The grading scheme and criteria used in the current study was effective and reproducible at documenting inherent variability of thymus morphology in control cynomolgus monkeys and could be implemented as a routine practice in laboratories, so that their historical data will reflect the actual variability in their animal colony. A site-specific historical data set in combination with the data presented in this study will prove useful in assessing and interpreting the relevance of changes in animals administered a test article.
Sexual and Skeletal Assessments of Maturity Confirmed That Sexual Maturity Occurs Prior to Skeletal Maturity
The combination of skeletal and sexual maturity measures was used to assign individual animals to a maturity stage, so that TBW, thymus weight parameters, and light microscopic observations could be assessed with respect to this assessment of maturity. Skeletal maturity was assessed by evaluation of the distal femoral physis. In this study, most of the animals had growth plates that were open or segmentally closed; only 36 of 453 animals (17 males and 19 females) had closed physes. Growth plate closure in the cynomolgus monkey occurs at approximately 57 and 63 months of age, in males and females, respectively (Jayo et al. 1994; Fukuda, Cho, and Honjo 1978; Kilborn, Trudel, and Uhthoff 2002).
Sexual maturity was assessed by light microscopic evaluation of testis and epididymis (males) or ovaries (females). Testis and epididymis were categorized as immature, peripubertal, and mature. Similar to previous work (Ku et al. 2010; Meyer et al. 2006), testis maturity generally correlated with testis weights, although testis weight was quite variable (data not shown). For females, the presence of a corpus luteum was used to assess puberty or sexual maturity. To the authors’ knowledge, there are no published papers in any primate species correlating the presence or absence of a CL with vaginal cytologic assessments, which is a common in vivo method used to assess female cynomolgus sexual maturity. However, the presence of a CL positively indicates prior ovulation, and thus is similar to, or a more definitive indicator of sexual maturity compared to vaginal smears. Because only 1 section/ovary was evaluated microscopically, it is possible that a CL may have been present in an ovary but was not included in the section.
Sexual maturity occurred prior to partial or complete closure of physes for both males and females, with the exception of a single female with segmental closure and no CL present (the lack of a CL may be due to limited sectioning of the ovary; this female was subsequently removed from all analysis, and is not one of the 221 females included in this study). These results are consistent with literature in humans and other animals showing that sexual maturity occurs prior to complete skeletal maturity (Lai et al. 2008; O’Connor et al. 2014; Kilborn, Trudel, and Uhthoff 2002; Cameron 2015; Porcu et al. 1994).
Thymus Light Microscopic Observations Were Consistent with What Was Previously Reported in the Cynomolgus Monkey
Previous publications on the monkey thymus focusing on normal morphology (Pearse 2006), incidental and background observations (Sato et al. 2012; Kaspareit et al. 2006; Spoor, Radi, and Dunstan 2008; Chamanza et al. 2010), immunotoxicity (Kuper et al. 2000), and age-related changes in lymphocyte subsets (W. W. Lee et al. 2003; Nam et al. 1998) have been valuable for the interpretation of thymus observations. We not only confirmed the light microscopic results previously reported for the normal monkey thymus but also correlated these observations to sexual and skeletal maturity parameters to characterize inherent variability in thymus parameters of cynomolgus monkeys related to maturation.
The thymus light microscopic observations recorded during this study were generally consistent with those reported previously (Spoor, Radi, and Dunstan 2008; Pearse 2006; Kuper et al. 2000). Decreased lymphocytes, as well as changes in interlobular fat, scalloping of lobules, cysts, eosinophils, and apoptosis have been reported to occur as part of maturation. Previous reports have identified ectopic parathyroid tissue, ectopic muscle, and lymphoid follicles, but these structures were not identified in any of the thymuses evaluated in this retrospective study.
The amount of apoptosis in the cynomolgus thymus has not been previously reported. Apoptosis is an integral process of T-lymphocyte development related to death by neglect or negative selection mediated by caspase activation and is characterized by efficient removal of apoptotic lymphocytes by thymic macrophages (Surh and Sprent 1994; Bai et al. 2013; Wack et al. 1996). This efficient removal is the reason for limited light microscopic evidence of apoptosis in the normal thymus and is consistent with the 0 to 2 grading of apoptosis on this study. In our study, apoptotic lymphocytes and macrophages containing engulfed apoptotic bodies were observed in the thymus cortex and occurred at a higher incidence and grade in immature animals. Thymuses of 7-month old (adult) mice were shown by TUNEL to have more apoptosis than 1-month old mice (Bar-Dayan, 1999). The differences in maturity-related apoptosis in our study compared to the mouse study by Bar-Dayan et al may be due to the number of animals evaluated (453 vs. 20) and the increased range of maturities evaluated (3 to 4, vs. 2), as apoptosis results from TUNEL and hematoxylin and eosin-stained thymuses may be quantitatively similar (Koroglu 2006).
In our study, thymic eosinophils were present at a higher incidence and grade in less mature animals. Clusters of eosinophils were observed primarily in the medulla and consisted of well-granulated cells ranging from eosinophil precursors with nonlobed nuclei to mature eosinophils with more lobulated nuclei. Clusters of eosinophils have previously been identified in the thymus, sometimes associated with Hassall’s corpuscles, by light microscopy or specialized staining techniques (Bodey et al. 1998; I. Lee et al. 1995; Muller 1977). The thymus may be a site for eosinophilopoiesis (I. Lee et al. 1995), in part because Il-6, a prime regulator of eosinophilopoiesis, is produced by T lymphocytes. Eosinophils may also play an immunomodulatory role in the thymus (Throsby et al. 2000).
TBWs and Thymus Weight Parameters Were Variable, Especially in Immature Animals and in Animals with Low Grades of Decreased Lymphocytes
Overall correlation
In the cynomolgus monkey, correlation of absolute thymus weights to TBWs was poor, as has been reported previously (Spoor, Radi, and Dunstan 2008). This is consistent with human data. There was no correlation between wet thymus weight and body weight or chronological age in a series of 574 human coroner cases (Kendall, Johnson, and Singh 1980) and a poor correlation in humans between computed tomography assessments of thymus volume and density with chronological age (Simanovsky et al. 2012).
In our study, the ranges of thymus weight parameter values were large for males and females and were similar to historical control cynomolgus thymus weight parameter data that were obtained independently from sites A and B (unpublished) and published literature (Spoor, Radi, and Dunstan 2008).
The thymus weight of cynomolgus monkeys is not recommended for routine collection in toxicology studies, because results are variable due to physiologic involution (Sellers et al. 2007). The experience and technique used by individual prosectors to differentiate thymus tissue from adjacent tissues are generally thought to contribute to the variability, as unfixed thymus tissue can be difficult to delineate from surrounding adipose and fibrous connective tissues (authors’ personal observations). Best practice and reference documents state that animals in a group should be randomized across prosectors, so that any prosector bias is minimized (Michael et al. 2007; Sellers et al. 2007; Frame, Mann, and Caverly Rae 2014). The contribution of prosector technique to thymus weight variability in this study cannot be quantified but is expected to be similar in animals regardless of assignment to group (control or treated).
Stage of maturity compared to TBW and thymus weight parameters
In our cohort of cynomolgus monkeys, there was a large range of body weights for a given maturity stage. Previous studies in male cynomolgus monkeys have also shown that there is a wide range in indicators of sexual maturity compared to body weight as well as chronological age and that skeletal maturity occurs over several years (Ku et al. 2010; Luetjens and Weinbauer 2012; Weinbauer et al. 2008). In peripubertal humans, maturity parameters including body weight, skeletal imaging, secondary sex characteristics, and dentition show a lack of correlation among body size, maturity parameters, and chronological age (Cameron 2015; Lai et al. 2008). Our data for cynomolgus monkeys are consistent with published literature in that maturity stage and body weight are poorly correlated.
TBW and thymus weight parameter values were assessed in animals divided by maturity stages (stages 1–4 in males and 1–3 in females). TBWs were higher in more mature animals, especially in males. However, there was considerable overlap in the range of TBWs for each maturity stage. Cutoffs of 5.5-kg body weight have been proposed to give 90% assurance of sexually mature males on toxicology studies (Ku et al. 2010). In the current study, the 42 males with TBW greater than 5.5 kg were peripubertal (1 monkey) or mature (41 monkeys), confirming the validity of the cutoff proposed by Ku et al. In addition to confirming the results reported by Ku et al, we have shown approximately half of the sexually mature males (15/22 stage 3 and 2/23 stage 4 males) weighed less than the 5.5-kg cutoff. A lack of correlation between age and sexual maturity has also been observed in female cynomolgus monkeys (Weinbauer et al. 2008).
Thymus weight parameters decreased with increasing stage of maturity. For example, the Thy%TBW of almost all animals of maturity stages 2 to 4 were less than 0.15. However, low thymus weight parameters did not discriminate immature from mature animals, as about half of the animals of maturity stage 1 also had Thy%TBW less than 0.15. In contrast, higher thymus weight parameter values (e.g., Thy%TBW above 0.15) were associated with immaturity, as almost all animals with these values were categorized as maturity stage 1 animals. The variability of thymus weight parameters, especially in immature or peripubertal animals, limits their value in assessment of test article–related effects.
Decreased lymphocytes compared to TBW and thymus weight parameters
In our cohort of cynomolgus monkeys, there was a large range of TBW and thymus weight parameters for a given grade of decreased lymphocytes, similar to what was observed when TBW and thymus weight parameters were compared to maturity stage.
TBWs were higher in animals with higher grades of decreased lymphocytes, especially in males. However, there was considerable overlap in the range of TBWs for each grade. Our data indicate that weight-matched cynomolgus monkeys can vary widely in their grade of decreased lymphocytes.
Thymus weight parameters decreased with increasing grades of decreased lymphocytes. For example, the Thy%TBW of almost all animals with grades 1 to 5 decreased lymphocytes were less than 0.15. However, low thymus weight parameters did not discriminate thymuses without decreased lymphocytes from those with higher grades, as about 80% of the animals with grade 0 also had Thy%TBW less than 0.15. All animals with higher thymus weight parameter values (e.g., Thy%TBW above 0.15) had grade 0 decreased lymphocytes. The variability of thymus weight parameters, especially in animals without decreased lymphocytes, limits their value in assessment of test article–related effects. The variability in thymus weight parameters in animals with grade 0 decreased lymphocytes is analogous to that observed in immature animals.
There Was High Variability for TBW, Thymus Weight Parameters, and Light Microscopic Observations Even within a Single Control Group
For accurate assessment and interpretation of thymus data from animals administered test articles, it is important to recognize the inherent and significant variability of these parameters, even within a single control group. In documenting this variability, calculations were performed for each sex on animals from a control group on a single study. For this analysis, variability was expressed as the ratio of and the difference between the maximum and minimum value in a group of animals. As expected, ratios and differences were lower for TBW than for thymus weight parameter values, and ratios for all 3 thymus weight parameters were similar. Within single-study control groups, the ratio of highest to lowest thymus weights was generally 2× to 3× but ranged up to 11×. The variability in thymus weight parameters for single-study control groups is understandable because within each group, there were animals with up to 3 different maturity stages and 4 different grades of decreased lymphocytes. Previous publications reported reference intervals including all animals in all studies, rather than by study. These new data are expected to be informative when assessing data for test article–related effects, as it is clear that, even within control groups, variability in thymus weight parameters can be quite large.
Group size in cynomolgus monkey toxicology studies is small, generally 3 to 4 animals/group for each sex. The data presented above clearly demonstrate the variability of thymus weights and morphology, even within a study. Because of these limitations, thymic parameters should be used to support assessment of immune modulation only in conjunction with other relevant parameters.
Thymus Parameters for Males Changed More Dramatically Compared to Females
Compared to females, males had more pronounced changes in several parameters when results were compared between early and late maturity stages. The more pronounced changes in males occurred for TBW, thymus weight parameters, decreased lymphocytes, interlobular fat, and scalloping of lobules. For some parameters, females at maturity stage 1 also had more mature characteristics compared to males at maturity stage 1 (thymus weight parameters and decreased lymphocytes). The more gradual change in female thymuses has been reported for cynomolgus monkeys and humans (Spoor, Radi, and Dunstan 2008; Smith and Ossa-Gomez 1981). The thymus of female humans attenuates slower than that of males after puberty. At 20 to 30 years of age, the thymus of male humans is replaced by fat at a faster rate than in females (Ackman et al. 2013). This difference persists even in much older humans, as the thymus of females does not attenuate to the degree in males until the seventh decade (Araki et al. 2016).
Data Is Relevant for Cynomolgus Monkeys of Non-Chinese Origin
The data in this study were generated from a cohort of monkeys that were mostly of Chinese or Southeast Asian origin. There were no differences in any of the data evaluated based on geographic origin. Cynomolgus monkeys used in biomedical research are usually sourced from China, Vietnam, Cambodia, the Philippines, or Mauritius. Several recent publications have illustrated physiologic and immunologic differences among these geographically distinct populations (Kozlosky et al. 2015; Zuehlke 2006). Of relevance to this publication, sexual maturation in male Mauritian cynomolgus monkeys occurs 2 years earlier than in Chinese or Asian cynomolgus monkeys (Luetjens and Weinbauer 2012). Maturation in females also occurs earlier in animals of Mauritius origin compared to those of Asian origin (Luetjens and Weinbauer 2013). In a population of Mauritius cynomolgus monkeys, body weights of a given maturation stage may be slightly higher than those of Asian monkeys. To the authors’ knowledge, there are no published comparisons of thymus weights between cynomolgus monkeys of different geographic origins. In addition, the data reported here are similar to a publication evaluating data generated in Mauritius cynomolgus monkeys (Spoor, Radi, and Dunstan 2008).
Normal Variability of Thymus Parameters Differs from Changes Associated with Stress or Immunomodulation
We have shown that the normal cynomolgus monkey thymus can be quite variable in weight and in light microscopic morphology. However, treatment-related changes in thymus weights and morphology can be observed under conditions that occur during toxicology studies. The most frequent causes of thymus changes include the effects of physiologic stress and immunomodulation on T lymphocytes by direct or indirect drug-related mechanisms. Although advanced aging also has an effect on thymus morphology, those changes are beyond the scope of this article and are not relevant for typical toxicology studies.
The effects of physiologic stress (due to procedures or secondary to test article effects) on the thymus include decreased thymus weights, and increased apoptosis and decreased numbers of cortical lymphocytes. These changes are attributed to stress using a weight-of-evidence approach; they generally occur in conjunction with changes such as decreased body weight or body weight gain, decreased peripheral blood lymphocytes and/or eosinophils, or clinical signs of distress (Everds et al. 2013).
The effects of immunomodulation and/or immunotoxicity on the thymus have been reviewed extensively (Germolec et al. 2004; Schuurman et al. 1992; Kuper et al. 2000). Enhanced immune reactions (primarily manifested as hypersensitivity reactions and autoimmunity) can be associated with variable effects on the thymus and generally result in immune effects that extend beyond the thymus (Burns-Naas, Meade, and Munson 2001). The most consistent thymus effects of immunomodulation associated with immunosuppression include decreased thymus weights and decreased lymphocytes. Similar to the effects of stress on the thymus, these changes with immunomodulatory agents generally occur in conjunction with changes in other lymphoid tissues such as spleen and lymph nodes and in peripheral blood lymphocyte counts. Observations in the thymus always need to be interpreted within the context of changes in other lymphoid tissues (Germolec et al. 2004; Basketter et al. 1995; Kuper et al. 2000).
The Thymus of the Cynomolgus Monkey Is Not Uniquely Sensitive to Immunomodulators and/or Immunotoxicants
Assertions that the thymus is uniquely sensitive to immunomodulators are found in numerous articles that discuss rodent studies (Schuurman et al. 1992; Kuper et al. 2000; Kuper et al. 2007; Germolec et al. 2004; Elmore 2006; Basketter et al. 1995; Haley 2013). Most of these articles refer to Schuurman as the basis for the assertion that the thymus is more sensitive than spleen, although Schuurman never makes this comparison (Schuurman et al. 1992). Kuper et al. states that, although the thymus may be most sensitive lymphoid tissue for immunotoxicants, concurrent changes are generally observed in other lymphoid organs such as spleen and lymph node (2000). Basketter et al. (1995), discussing rodent studies, propose that inconsistent exsanguination of rodent spleens is the reason for the higher sensitivity of thymus weights compared to spleen for immunotoxicant effects.
Published reviews about immunotoxic effects in cynomolgus monkeys are limited and refer to rodent-specific literature discussed above when suggesting that the thymus potentially may be more sensitive than the spleen for immunotoxicity (Brennan et al. 2010). Our review of data for 14 immunomodulatory test articles (small molecules and biotherapeutics, targeting B and/or T cells) demonstrated that in both rodents and cynomolgus monkeys, neither thymus nor spleen was consistently more sensitive to immunomodulation (Supplemental Table 5). This result is not surprising based on the variety of mechanisms by which test articles target the immune system. Test articles that impact immune cells located in the spleen, for example, will likely affect splenic weights and morphology more than those of the thymus. The observations in this study demonstrate the normal physiologic changes in the thymus that occur from prepubertal ages to the period after skeletal maturation. It is well established that these changes are recognized by evaluation of routine parameters such as organ weight and light microscopic evaluation. Such dramatic maturity-related changes are not reported to occur for other lymphoid organs (spleen, lymph nodes). It is important to understand the normal variability in order to put test article–related changes in context. While normal age-related changes in the thymus occur without concurrent changes in other lymphoid tissues, thymus alterations related to stress or immunomodulation can occur in conjunction with changes in other lymphoid organs, and with concurrent functional or morphologic observations. Although we have demonstrated a large variability in thymus weights and light microscopy from control cynomolgus monkeys, there are clearly situations and studies in which thymus weight and/or light microscopic observations are test article–related. Thymus parameters, as well as changes in other immune parameters, need to be interpreted in the context of other study observations.
Implications of This Retrospective Analysis for Toxicology Studies
This retrospective analysis of the routine parameters evaluated in the cynomolgus monkey thymus provides useful context for routine toxicologic testing. Thymus weights may be highly variable within a control group. Moreover, thymus weight variability may also be observed in groups of animals with the same histologic findings or stage of maturity. Previous publications have alluded to the variability in thymus weights in cynomolgus monkeys (Spoor, Radi, and Dunstan 2008). Numerous regulatory guidelines require or recommend the collection of thymus weights (Michael et al. 2007; ICH 2005). In a survey of industry scientists, thymus weights, along with spleen weights, were considered to be sensitive indicators of immunotoxicity, but 1/4 to 1/3 of respondents felt that thymus weights had little value because of variability due to dissection technique, age-related involution, and stress-related effects (Michael et al. 2007). The opinion of the respondents was that thymus weights were less sensitive than and did not often correlate with histopathologic observations. Results of our retrospective analysis support this opinion that the normal variability in these thymus parameters limits their usefulness as indicators of potential immunotoxicity in the absence of other relevant findings.
Published recommendations of the Society of Toxicologic Pathology (STP) are to weigh thymuses for cynomolgus monkeys, when the cynomolgus monkey is the only test species. Even in these cases, the STP recommends thymus weights only on 1 short-term study (Sellers et al. 2007). Given the data in the current publication, it is clear that thymus weights do not correlate with stage of maturity or light microscopic observations. This lack of correlation plus the wide variability in groups of animals delineated by maturity stages, grade of decreased lymphocytes, or within a control group on a single study, provide further evidence that thymus weights need to be interpreted conservatively and with knowledge of the wide range of values observed even in control animals of similar body weights.
Conclusions
In this study, thymus weight parameters of naive cynomolgus monkeys were variable and correlated poorly with TBW. The variability was higher in less mature animals or animals with no decrease in thymus lymphocytes as determined by light microscopy. Individual animals assigned to a control group on a single study can have thymus weight parameters varying as much as 11-fold. In the cohort of animals we evaluated, ranging from immature to mature in terms of sexual and skeletal characteristics, males showed more rapid progression toward a mature phenotype; for females, the differences in TBW, thymus weight parameter values, and grades of decreased lymphocytes were not as pronounced, when immature animals were compared to mature animals. Due to the inherent variability in thymus weight parameter values among control cynomolgus monkeys in routine nonclinical toxicology studies, these thymus parameters are unreliable indicators of immunomodulation or immunotoxicity in the absence of other relevant findings. These thymus end points should not be the primary data used to determine the presence of a test article–related effect.
Footnotes
Author Contributions
Authors contributed to conception or design (PS, NE, JW, ST, RG); data acquisition, analysis, or interpretation (PS, NE, WC, JW, STP, RG); drafting the manuscript (PS, NE, WC, JW, STP, RG); and critically revising the manuscript (PS, NE, WC, JW, STP, RG). All authors gave final approval and agreed to be accountable for all aspects of work in ensuring that questions relating to the accuracy or integrity of any part of the work are appropriately investigated and resolved.
Authors’ Note
Paul W. Snyder and Nancy E. Everds contributed equally to this document.
Acknowledgments
The authors thank Christopher Holmes for retrieval and management of archival information; Siyka Partova for on-site management of archival specimens; Gregory Woo for creating and conducting custom searches and queries of a data warehouse; and Thomas Monticello, Hervé Lebrec, and other colleagues for scientific insights and for contributions to lively discussions about the meaning of the data presented in this manuscript.
Declaration of Conflicting Interests
The author(s) declared no potential conflicts of interest with respect to the research, authorship, and/or publication of this article.
Funding
The author(s) received no financial support for the research, authorship, and/or publication of this article.
Note
References
Supplementary Material
Please find the following supplemental material available below.
For Open Access articles published under a Creative Commons License, all supplemental material carries the same license as the article it is associated with.
For non-Open Access articles published, all supplemental material carries a non-exclusive license, and permission requests for re-use of supplemental material or any part of supplemental material shall be sent directly to the copyright owner as specified in the copyright notice associated with the article.