
Abstract
Modulation of the cell cycle may underlie the toxicologic or pharmacologic responses of a potential therapeutic agent and contributes to decisions on its preclinical and clinical safety and efficacy. The descriptive and quantitative assessment of normal, aberrant, and degenerate mitotic figures in tissue sections is an important end point characterizing the effect of xenobiotics on the cell cycle. Historically, pathologists used manual counting and special staining visualization techniques such as immunohistochemistry for quantification of normal, aberrant, and degenerate mitotic figures. We designed an automated image analysis algorithm for measuring these mitotic figures in hematoxylin and eosin (H&E)-stained sections. Algorithm validation methods used data generated from a subcutaneous human transitional cell carcinoma xenograft model in nude rats treated with the cell cycle inhibitor Eg5. In these studies, we scanned and digitized H&E-stained xenografts and applied a complex ruleset of sequential mathematical filters and shape discriminators for classification of cell populations demonstrating normal, aberrant, or degenerate mitotic figures. The resultant classification system enabled the representations of three identifiable degrees of morphological change associated with tumor differentiation and compound effects. The numbers of mitotic figure variants and mitotic indices data generated corresponded to a manual assessment by a pathologist and supported automated algorithm verification and application for both efficacy and toxicity studies.
Keywords
Introduction
In drug development, there is a continual need for the identification of key histologic end points with utility for quantitative pharmacodynamic and toxicodynamic assessments preclinically and clinically. Cell proliferation is an important end point for the pathologist as part of the human risk assessment for xenobiotic-induced toxicity and carcinogenicity as well as a pharmacodynamic preclinical and clinical end point for therapeutic targets mainly in regenerative medicine or oncology (Wood et al. 2015; Shinde et al. 2014). A manual count of mitoses/field of view or the mitotic index was the original in situ measure for proliferating cells in formalin-fixed paraffin-embedded sections. The development of immunohistochemical-based methodologies facilitated measurement of cell proliferation and mitoses. These methodologies include 5-Bromo-2-Deoxyuridine (BrdU) in prospective study designs and Ki67, proliferating cell nuclear antigen, or phosphohistone H3 in retrospective investigations for cell proliferation and mitoses (Muskhelishvili et al. 2003; Hendzel et al. 1997; Tetzlaff et al. 2013). However, while immunohistochemistry procedures have advanced the art of normal mitosis and cell proliferation assessments, an automated algorithm that would simultaneously measure normal, aberrant, and degenerate mitotic forms in standard hematoxylin and eosin (H&E) sections would be an outstanding quantitative tool for the pathologist in their evaluation of large, complex, preclinical and clinical tissue sets.
Manual counting of mitotic forms is laborious for the pathologist and developing automated algorithms for characterization of mitotic features in absolute or even relative terms is difficult in a standard H&E section. Mitotic figures present as condensed, darkly stained, and irregularly shaped textured structures. These features may challenge differentiation from lymphoid/inflammatory cells, apoptotic cells, and pleomorphic tumor cells that can display similar structural characteristics. Imaging algorithms do not easily classify and detect aberrant mitotic forms because they develop morphologic features characteristic of apoptosis or necrosis. Additionally, stochastic effects from tissue preservation, processing and staining, plane/depth of section, cell orientation, and cell damage may interfere with the presentation and accurate identification of relative cell components in the tissue section.
Few papers describe mitotic figure analysis in H&E-stained tissue sections, and to our knowledge, none assess normal, aberrant, and degenerate forms simultaneously. Two major technical competitions recently advanced the development and implementation of algorithms for mitotic figure detection and analysis. First, in a contest sponsored by the International Conference on Pattern Recognition, investigators used mitoses (MITOS) data sets in the analysis of mitotic figures in H&E-stained breast cancer sections (http://ipal.cnrs.fr/ICPR2012/, Malon and Cosatto 2013; Irshad 2013; Khan, Eldaly, and Rajpoot 2013). The approaches to the mitotic count challenge were varied and included a wide range of image preprocessing, segmentation methods, morphological operators, feature detections, classifiers, and computational models, where the test accuracy (F score) was .78 (Roux et al. 2013). Here, the investigators agreed that the diversity in mitotic figure feature presentation and overlapping of morphological characteristics created important challenges but that significant improvements in detection and quantification were requisite. Second, the Assessment of Mitosis Detection Algorithms 2013 challenge evaluated the performance of algorithms to detect mitosis in breast tumors (Veta et al. 2013) compared to an expert pathologist, where the overall outcome demonstrated a matching degree of accuracy in analysis between computer-based and manual scores.
We hypothesized that an automated image analysis algorithm could be developed for H&E-stained sections that would improve the pathologist’s effectiveness in measuring normal, aberrant, and degenerate mitosis end points. Using a pharmacologic modulator of the cell cycle (Eg5 inhibition) in an in vivo proliferative model system (urinary bladder tumor xenograft), we evaluated normal, aberrant, and degenerate mitoses simultaneously. We then compared the performance of the automated approach to manual pathology assessment and showed that an automated system for mitoses quantitation is feasible and useful for assessing toxicodynamic or pharmacodynamic effects of xenobiotic in preclinical toxicology or efficacy models.
Methods
The human transitional cell carcinoma (TCC) cell line MGH-U3 (Lin, Lin, and Prout 1985) obtained from Dr. M. A. Knowles, University of Leeds, was implanted orthotopically into the bladder wall of nude rats. Cells from one of the resulting tumors were reestablished in culture following digestion with 2 mg/ml of collagenase type I for 1 hr at 37°C and implanted into the bladder wall. This process was repeated twice generating MGHU3-X3 cells which displayed a more consistent take and growth rate in nude rats when implanted in both subcutaneous and orthotopic sites. For drug treatment studies, these cells were implanted subcutaneously in the left flank of nude rats that were treated with a specific kinesin-5 inhibitor (Human Eg5 Ki = 1.7 nM) or vehicle (50% dimethyl sulfoxide [DMSO], 40% glycofurol, 10% deionized water in study 1, and 50% DMSO, 60% captisol in study 2). Study 1 animals (5/group) were injected intraperitoneally with a single dose (5 mg/kg) of the Eg5 inhibitor, and animals were sacrificed after 24, 48, 72, and 96 hr. Study 2 animals (5/group) were continuously dosed with the Eg5 inhibitor using a subcutaneous minipump (Alzet). They received either 1.375 mg/kg/day, 2.75 mg/kg/day, or 4.6 mg/kg/day and were sacrificed after 24, 48, or 72 hr.
At necropsy, the subcutaneous TCC xenografts were removed and fixed in 10% buffered formalin for 24 hr, followed by trimming and processing to paraffin blocks. H&E-stained sections (4 µm) were scanned on an Aperio AT scanner (Leica Biosystems GmbH, Germany), at 40× objective lens magnification (0.75 numerical aperture, 0.25 µm/pixel resolution), for subsequent image analysis. Six randomly selected fields, 1,000 × 1,500 pixels in size, were evaluated from each digital scan, which equated to approximately 2,000 cells per sample being analyzed over an area of 0.5 mm2. An image analysis program was developed in-house using the Definiens Developer XD version 2.0.4 (Definiens AG, Germany).
All animal procedures were carried out under Project License in accordance with the Animals (Scientific Procedures) Act 1986 and with the oversight and approval of the Animal Welfare and Ethical Review Body at Alderley Park, UK.
Image Analysis
Establishing preanalytical morphological criteria
Morphological features of over 270 mitotic figure annotations were characterized by a veterinary pathologist (S.K.) as regular, aberrant, or degenerate mitotic cells in the H&E-stained tumor sections (Figure 1) and were utilized as a guide to defining feature parameters for detection, evaluation, and classification.
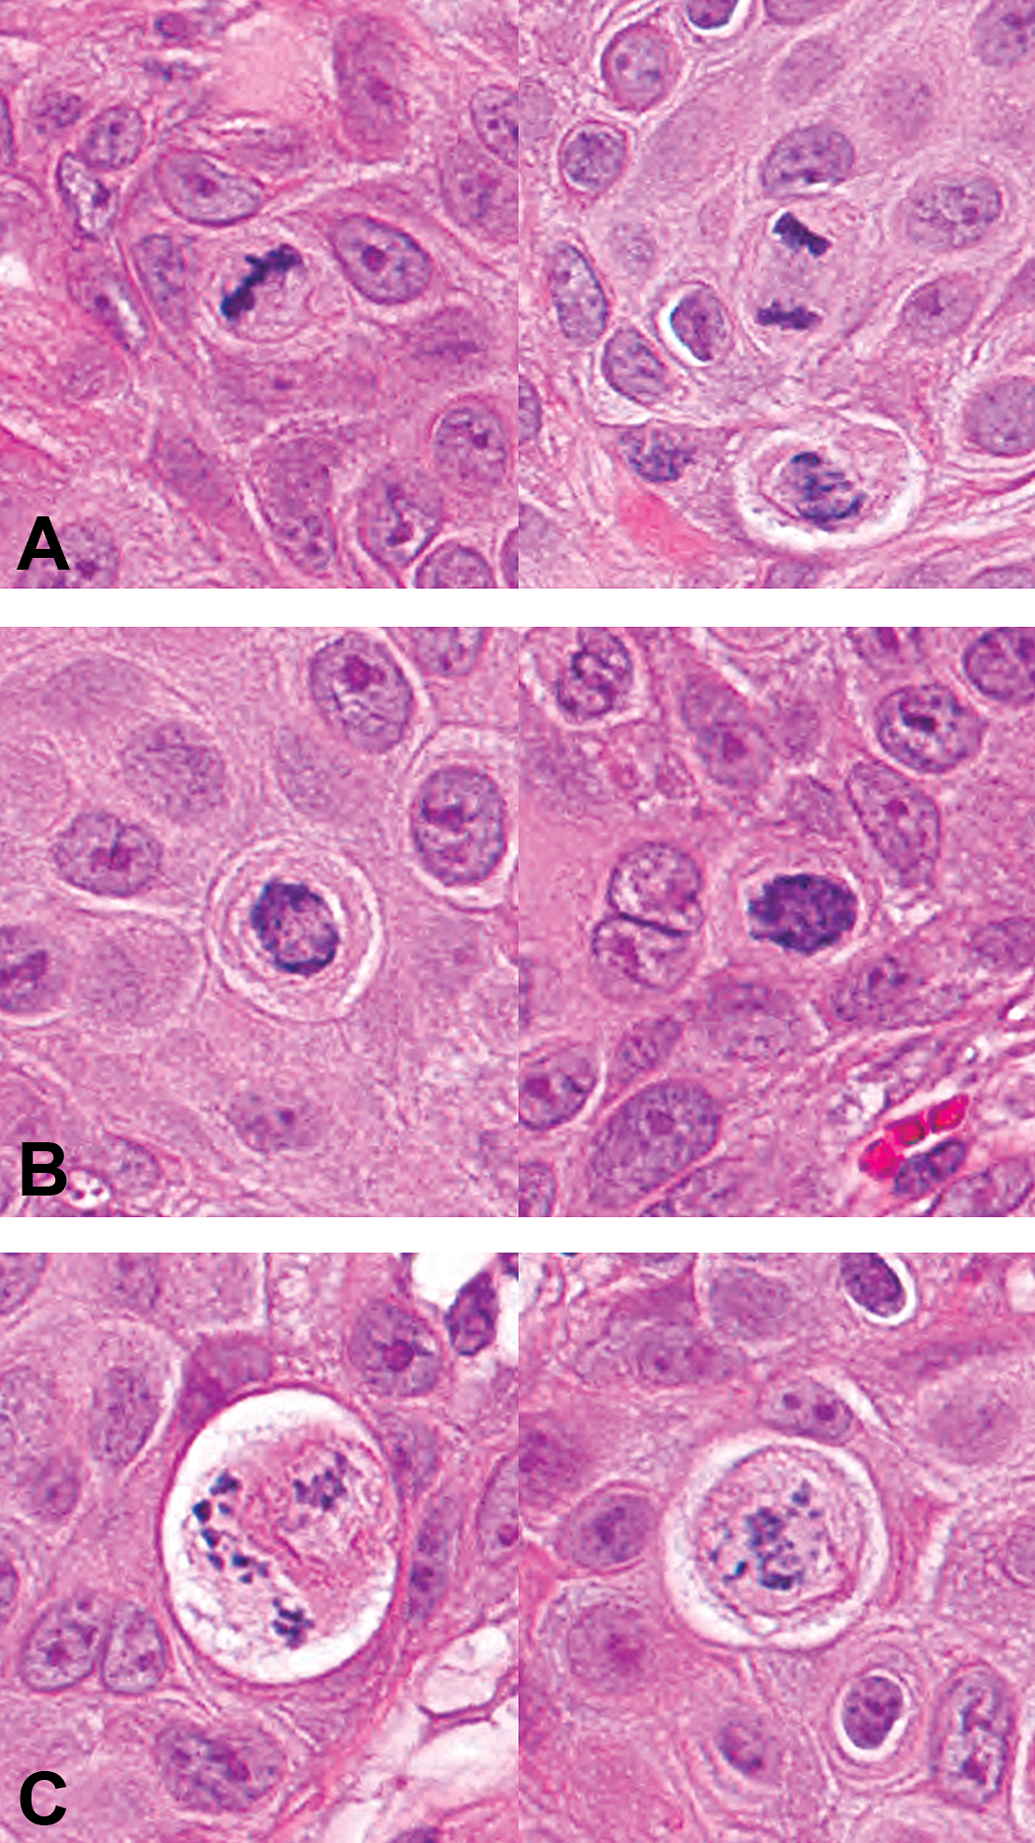
Example range of hematoxylin and eosin–stained mitotic figures. (A) Regular mitotic figures, (B) aberrant mitotic figures (monoasters), and (C) degenerative mitotic figures.
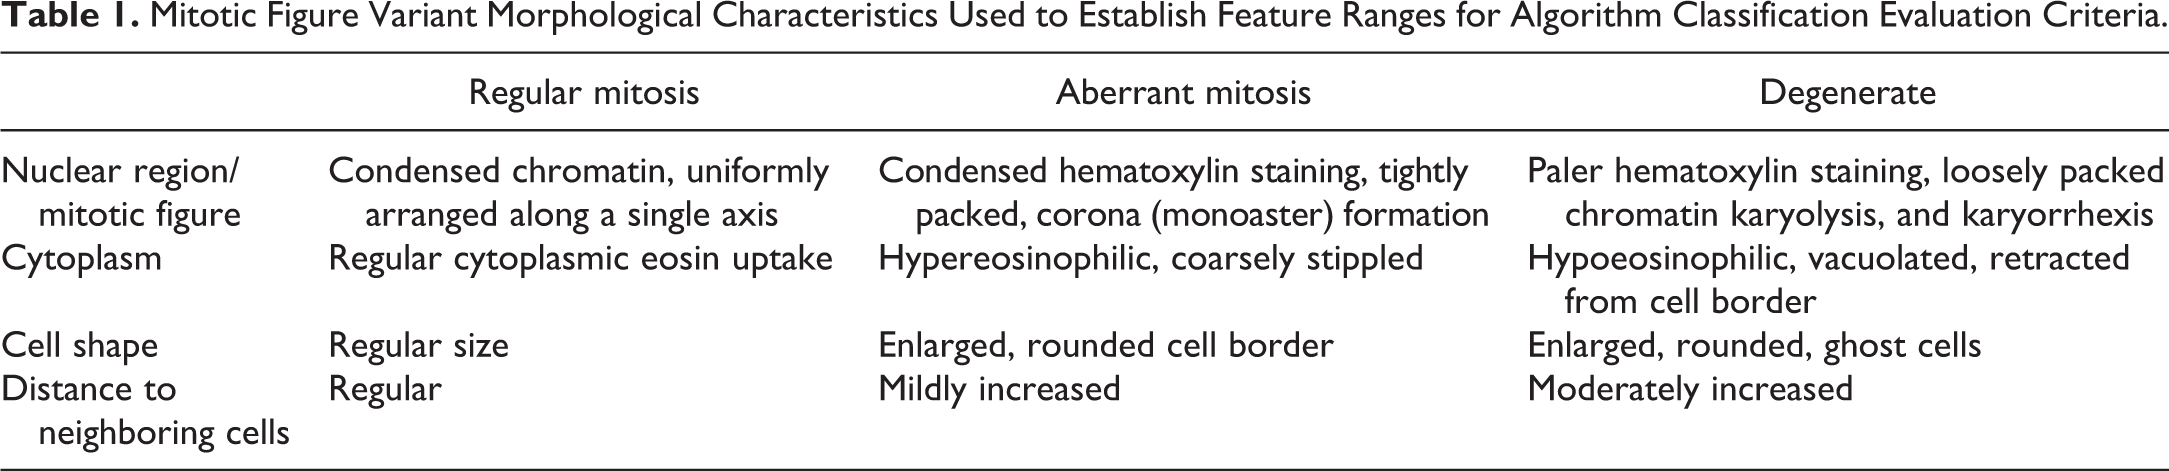
Tumor cells undergoing regular mitosis showed condensed chromatin arranged uniformly along a single axis, with a regular cytoplasmic eosin uptake and a spatial uniformity to neighboring cells, defined by distance between nuclei. Tumor cells undergoing aberrant mitosis displayed condensed hematoxylin staining and tightly packed figures arranged in a corona (monoaster) formation. The rounded cell borders encircled a coarsely stippled, slightly hypoeosinophilic cytoplasm. Degenerate tumor cells (postaberrant mitosis) exhibited nuclear fragmentation with karyolysis or karyorrhexis. The cells were moderately swollen, with pale eosinophilic cytoplasm that was often vacuolated and retracted from the cell borders. These morphological characteristics were used as differential criteria for the developed algorithm (Table 1).
Mitotic Figure Variant Morphological Characteristics Used to Establish Feature Ranges for Algorithm Classification Evaluation Criteria.
The processes defined the primary cell populations (step 1), evaluated cell features in the determination of potential mitotic cells (step 2), and extracted and classified the variations in regular, aberrant, and degenerate mitotic figures (step 3; Figure 2).
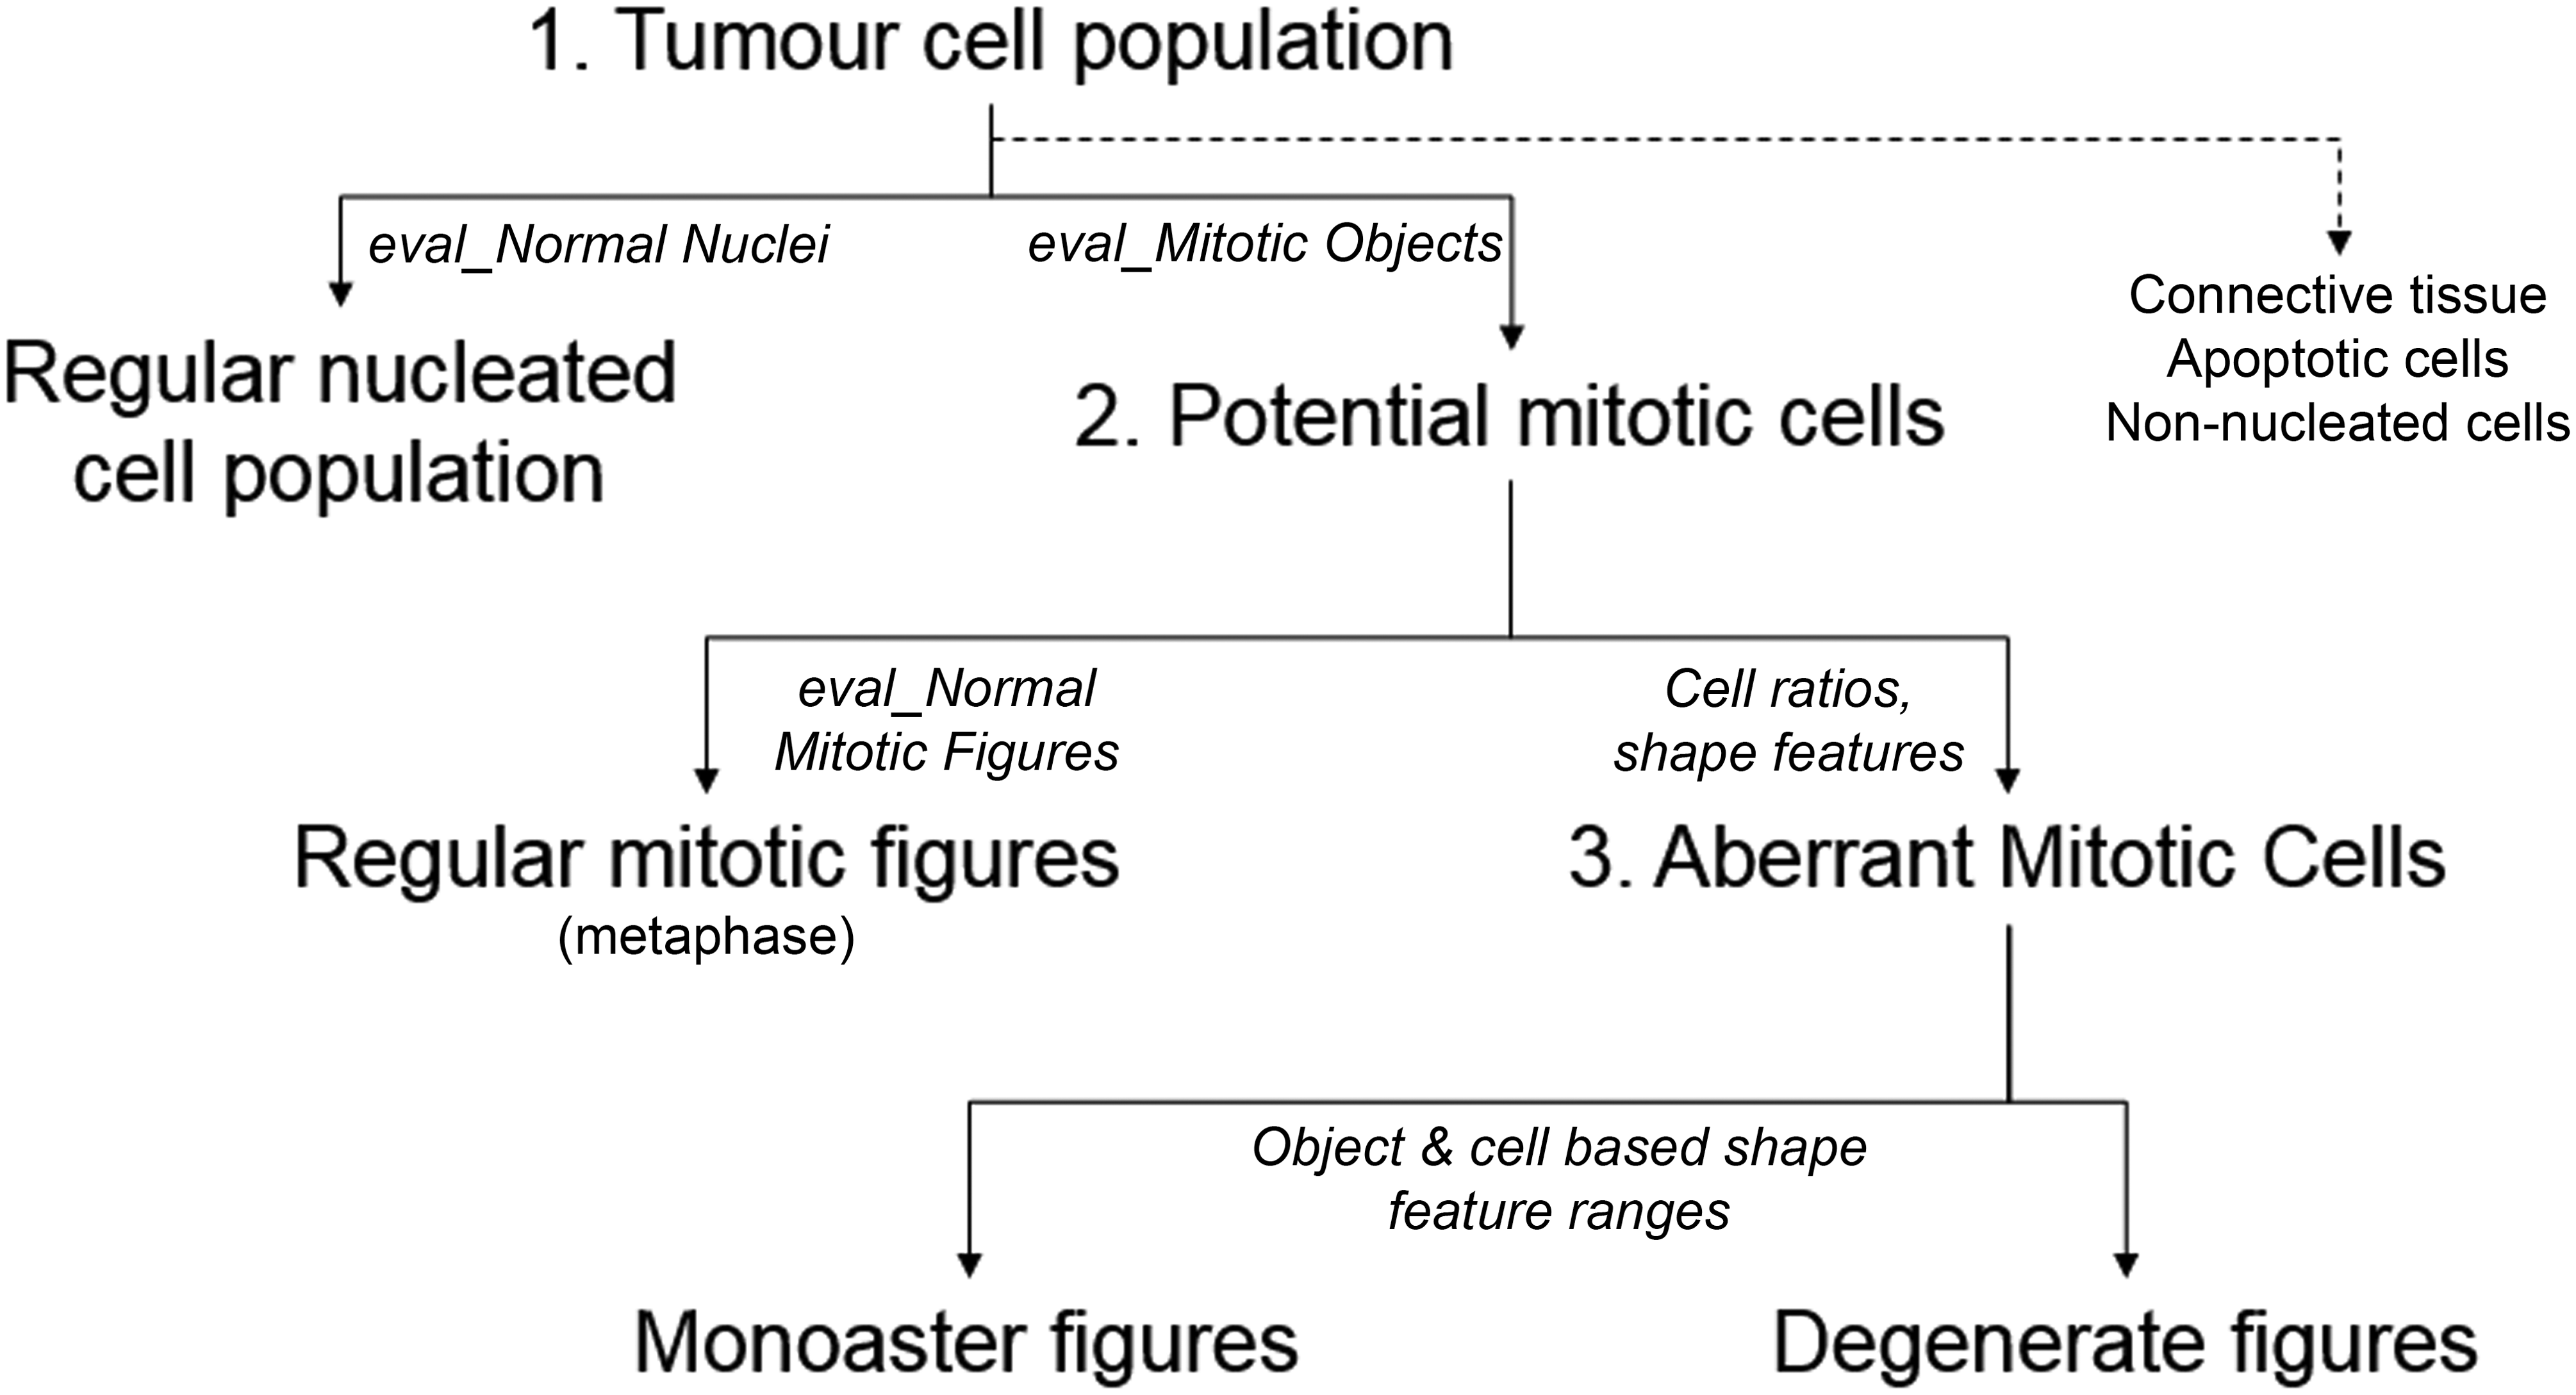
The in-house developed algorithm included 3 fundamental concomitant processes. These were to define primary cell populations (step 1) to evaluate cell features in the determination of potential mitotic cells (step 2) and to extract and classify the variations in regular, aberrant, and degenerate mitotic figures (step 3).
Prior to the actuation of these steps, image preprocessing generated supplementary layers that facilitated subsequent cell and mitotic feature definition and characterization.
Image preprocessing
Image preprocessing firstly involved the creation of stain isolation layers for cell contextual associations from the red–green–blue (RGB) gray levels of the H&E image using a hue-saturation-density model in cx, cy space (van der Laak et al. 2000). This step produced 3 additional gray scale layers for blue stain (nuclei), pink/red stain (cytoplasm), and optical density values. Next a 15 × 15 kernel Gaussian filtered layer was formed from the green channel (G) gray level of the original RGB image to smooth out background feature noise prior to primary cell border detection. Finally, for enhancement of intensity peaks for potential mitotic cell feature discrimination, a Laplacian of Gaussian (LofG) layer was derived from the deconvolved blue stain layer, using a 21 × 21 kernel Gaussian blur convolution filter followed by a customized stringently weighted 3 × 3 kernel Laplacian high-pass filter.
Cell and nucleus detection
Initial cell border outlines were derived from the Gaussian smoothed gray-level image of the green channel by applying a watershed segmentation starting with a defined minimum area of connected pixels of a specified intensity for seed-based object fusion. This was followed by local adaptive segmentation of the individual cells that identified potential nuclear features. These processes using the deconvolved blue nuclear layer divided an individual cell into nuclear and cytoplasm classes using a histogram-based automatic threshold centered on pixel intensities and homogeneity of texture (Marpu et al. 2008). Postprocessing removed potential nonnuclear fragments based on size and shape index (elliptical fitting). Normal nuclear shape definition was refined, and object boundaries smoothed by applying a series of minor closing and opening processes using defined surface tension factors and feature connectivity. The nuclear shape improvements ensured that adjacent nuclear objects were not connected erroneously during postprocessing. Apoptotic cells and nonnucleated cell objects were excluded automatically from the tumor cell population, using a range of geometric shape parameters and a ratio of intense blue staining to cytoplasmic pink/red staining. This ensured that their feature values were not incorporated into membership function ranges for subsequent potential mitotic cell classification decision processes.
Cell feature evaluations for potential mitotic cells
Nucleated and mitotic cells were classified using cell object feature evaluation criteria, on the LofG layer derived from the deconvolved blue stain layer, applying weighted class membership values, based on Haralick texture (homogeneity, dissimilarity), shape factors, an upper quantile (98) of the mean LofG intensity, and defined nuclear/cytoplasmic “staining” ratios. These criteria, applied in sequence (Figure 3), defined regular nuclei and potential mitotic figures by facilitating the utilization of potential object features values to fit conditions for a membership function between 0 and 1, that is, fuzzy logic for classifying features displaying uncertain characteristics (Table 2). Cell boundary definition of classified potential mitotic cells was improved by using pixel-based object resizing with form factor restrictions and stringent surface tension controls that confined the extent of remodeling. Finally, remnant equivocal nuclear and mitotic fragments were reclassified based on feature cell ratios, shape features, and Clark/Evans aggregation index per cell (Clark 1954).
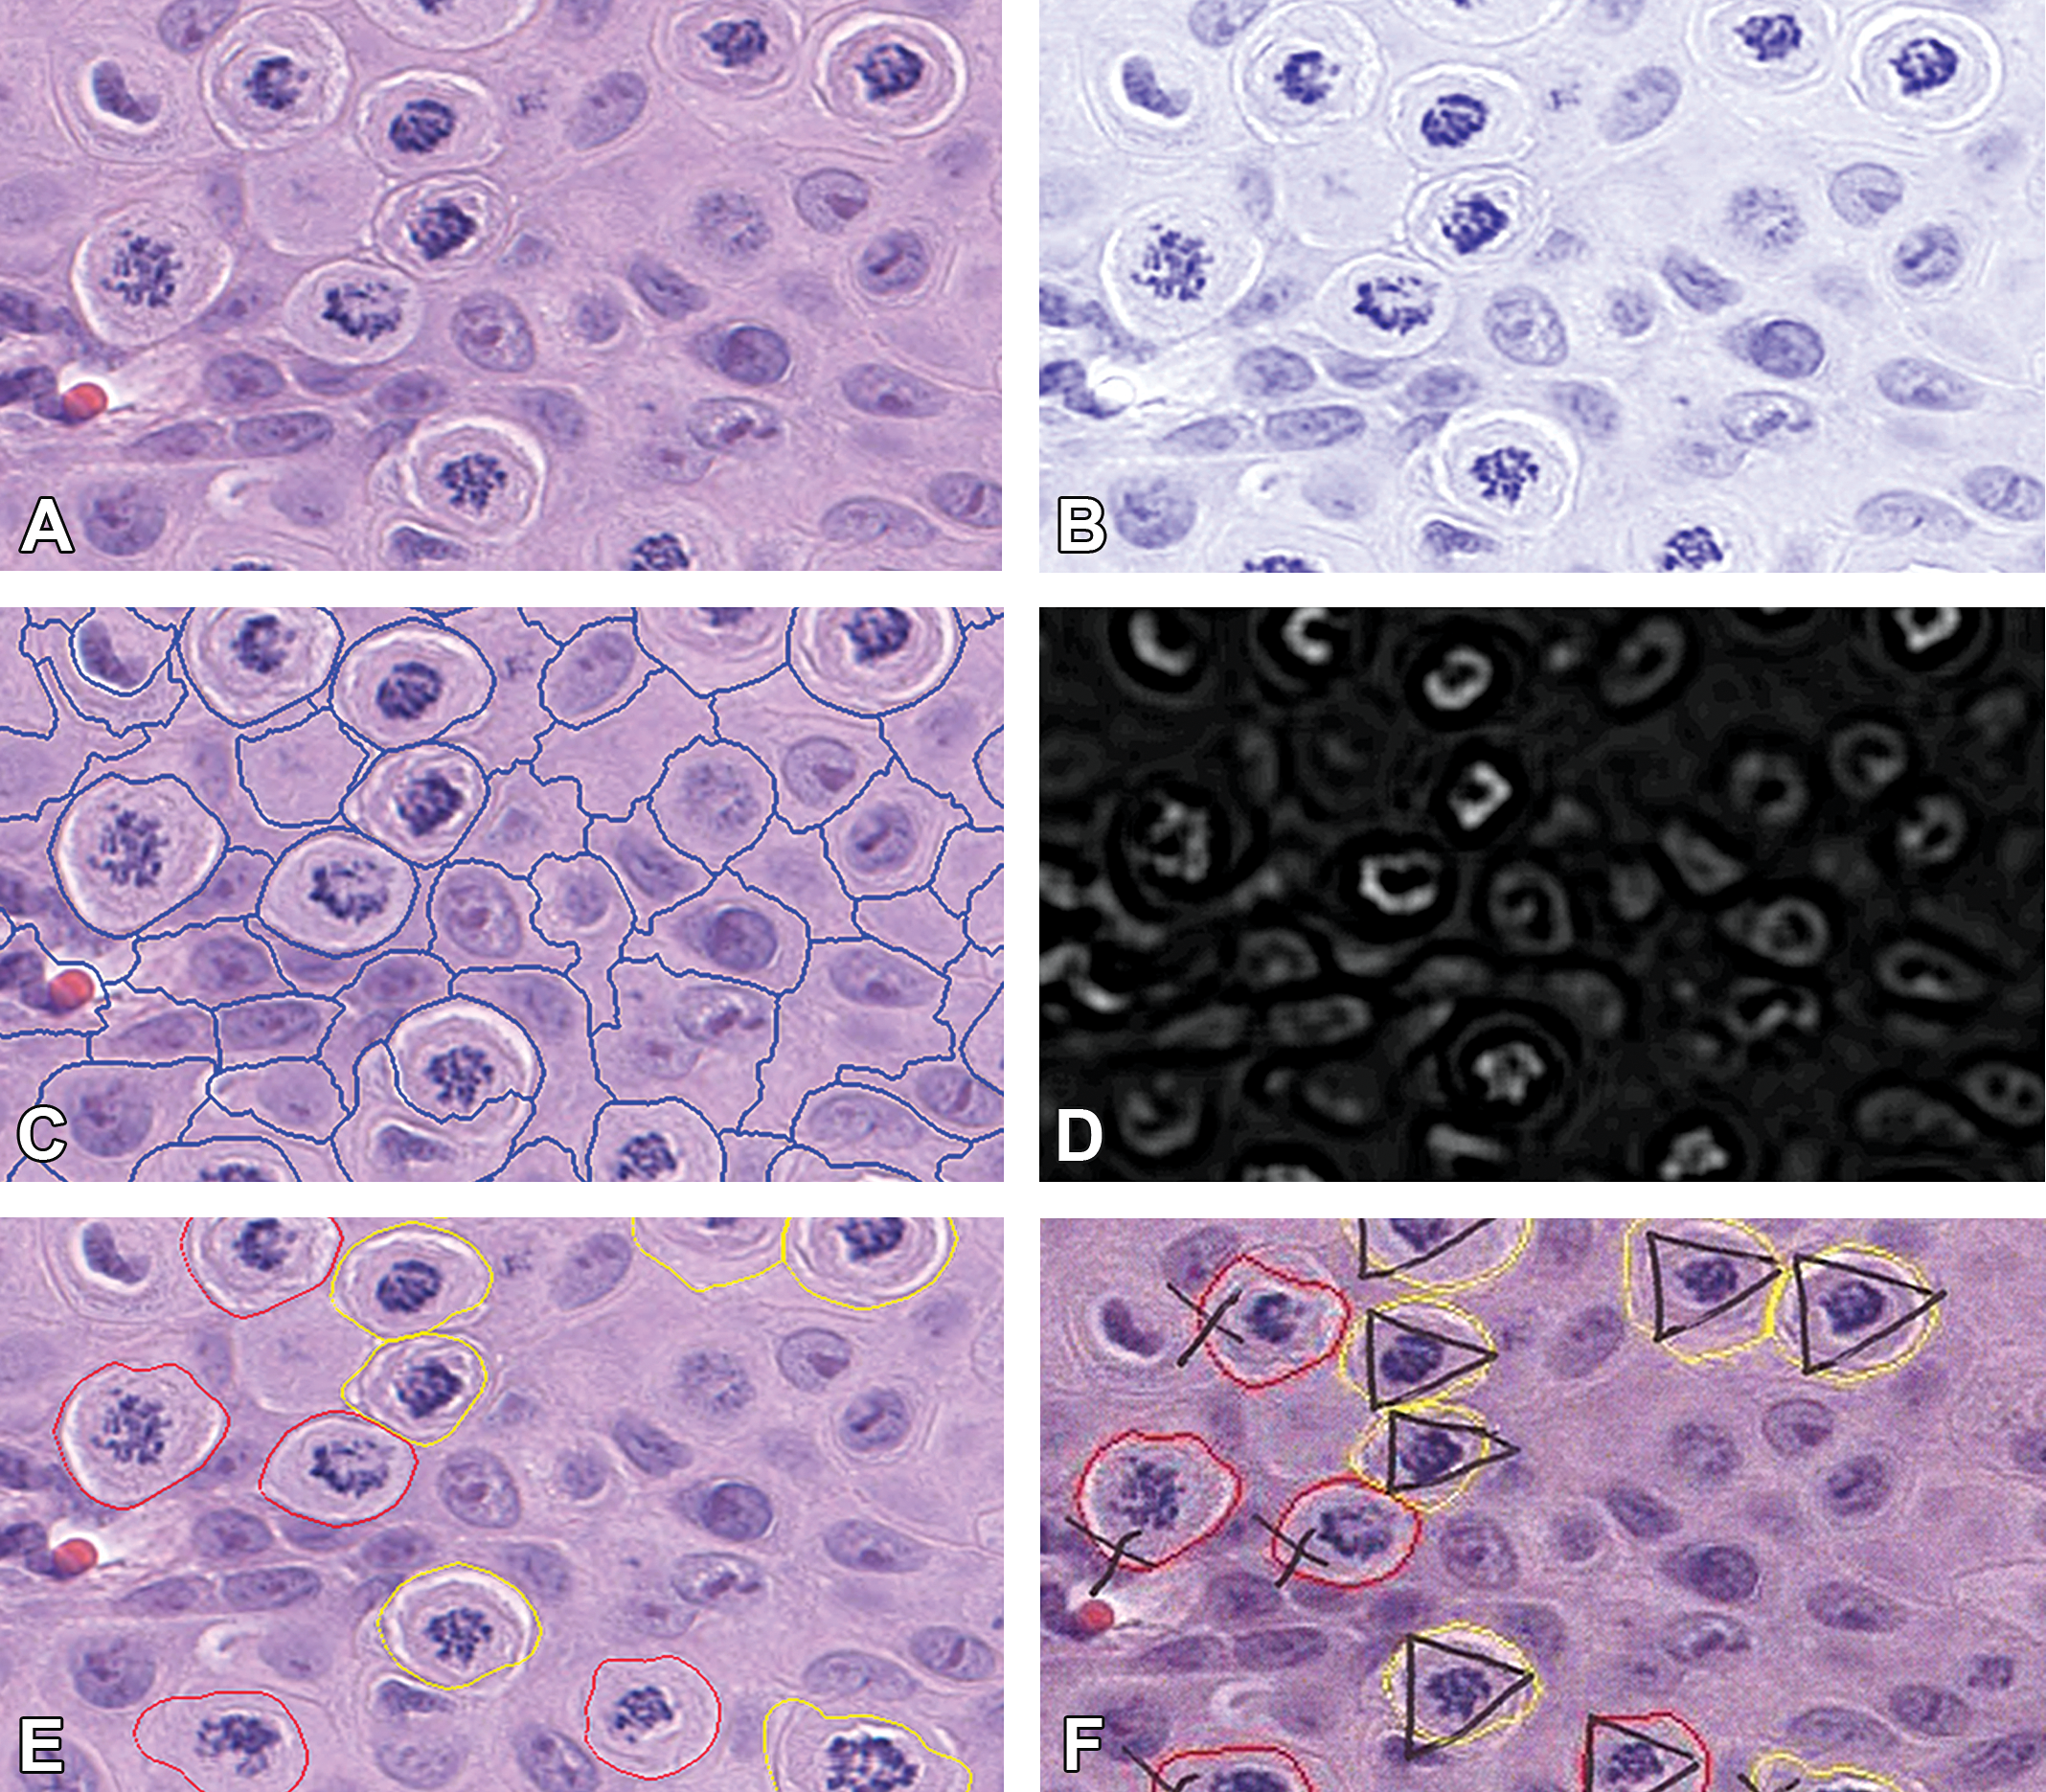
Cell and mitotic object detections as part of the algorithm work flow. (A) Original hematoxylin and eosin-stained image at ×40 objective lens magnification, (B) color deconvolved image for blue (nuclei) detection, (C) cell border mask (blue outline), (D) Laplacian of Gaussian intensity peaks for mitotic object discrimination, (E) classified aberrant mitotic cells (yellow outline) and degenerate mitotic cells (red outline), and (F) pathologists annotated image for mitotic cell classification—aberrant triangle (ρ) and degenerate cross (X).
Range of Staining, Texture, and Shape Features, for Normal Nuclei (_eval_normalNuclei), Mitotic Objects (_eval_MitoticObjects), and Regular Mitotic Figure (_eval_NormalMF) Evaluation Classifications, with Associated Class Membership Functions Values Used to Define the Normal Cell Populations and Variations in Mitotic Figures. The Geometric Mean Weighting Indicates the Merit Placed on a Typical Feature Value, Where 1 for All Features Specifies Equal Properties.
Note. GLCM = Gray-level co-occurrence matrix; LofG = Laplacian of Gaussian.
Classifying the variations in mitotic, aberrant and degenerate mitotic forms
Regular mitotic figures were defined automatically by the fit of object level of compactness, border index, and length/width of a single mitotic figure of high-mean LofG within a cell. Potential mitotic cells containing single connected objects with a high LofG intensity and fitting a defined form factor >0.47 were classified as aberrant, where form factor = (4 × π × [area])/([perimeter]2). Prior to defining the remaining potential mitotic cells as degenerate, the objects within these cells were also gauged so that additional features were conformed to, including all objects fitting within a defined distance from the main mitotic figure (i.e., within 14 pixels and of a neighboring object of area greater than 20 pixels). Finally, a range of “cleanup” operations removed potential endogenous objects by incorporating a number of cell, nuclear, or mitotic object relational features.
Measure and ground truth annotations
Mitotic cell measures included mitotic index, number of classified cells (regular—nucleated and nonnucleated, mitotic), and numbers of classified mitotic figures (regular, aberrant, and degenerate). Area measures of all classified features and tissue were also generated. Images were annotated by a pathologist for “by eye” correlation of analysis and for determining test accuracy using the F measure or F1 scores (Powers 2011). The F1 score, true positivity rate (sensitivity), and positive predictive value (precision), based on the range of mitotic figure changes only, were defined as follows: F1 score (F measure) = 2 × ((PPV × TPR)/(PPV + TPR)) OR 2TP/(2TP + FP + FN) where the recall or true positive rate/sensitivity (TPR) = TP/TP + FN and the positive predictive value/precision (PPV) = TP/TP + FP. TP = true positive, FP = false positive, TN = true negative, and FN = false negative.
Statistical Analysis
Statistical analysis was performed using Microsoft Excel (Office 2013; Microsoft Corp., Redmond, USA). The Student’s t-test, using a 2-tailed distribution and 2-sample unequal variance, was applied to determine differences between vehicle and treatment groups of tumor samples, where p values of <.05 were considered to indicate a statistical significance.
Results
Mitotic Figure Imaging, Algorithm Generation, and Verification
The in-house generated image analysis algorithm produced cell classifications enabling the automated distinction of quiescent and mitotic tumor cells identified in H&E-stained xenograft sections from two independent studies. There was an excellent discrimination of cells demonstrating regular mitotic, aberrant, or degenerate mitotic forms.
The manual assessment from the pathologist aligned well with the image analysis prediction. In study 1, the data generated by the primary algorithm were compared to the pathologist’s manual annotations and by eye scores to establish relationships for “ground truth” levels. The F measure (F1 score), of observed and expected results for this evaluation was 0.77, indicating a strong agreement between algorithm prediction and pathologist’s observations.
Study 2 was run with a slightly modified program to improve discrimination between the aberrant and degenerate figures based on a higher weighting on mitotic figure fragmentation. For the altered program, the pathologist and analyst confirmed by reviewing studies 1 and 2 images that the new algorithm performed comparably in all other aspects (data not shown). The F measure for the second study was 0.82 demonstrating an improved classification of the mitotic figures. The sensitivity (true positivity rate) for this second study was 0.89 with the precision (positive predictive rate) at 0.77. For both studies, when comparing the overall counts for the 3 combined mitotic classifications, the Pearson product moment correlation coefficient was r 2 > .87, demonstrating that the generated data were highly correlated with the final scores by the pathologist for algorithm verification purposes. The pathologist semiquantitatively assessed both studies. Although a statistical analysis of the scores was not performed, the distribution of the differentiated mitotic figures followed exactly the time course generated by the algorithm.
Several difficulties encountered in object presentation between the 2 studies had the potential for interfering with successful detection by the algorithm. These differences probably occurred because of suboptimal sample preparation impacting tissue preservation and staining. Extensive vacuolation of ostensibly aberrant cell cytoplasm (Figure 4), although identified as a feature of degenerate monoasters, may in part be artificial due to preparation, and therefore may account for potential discrepancies between these classes. Typically, clear differentials in staining intensity permitted the delineation of mitotic figures; however, in occasional samples from study 2, there was an increased background cytoplasmic hematoxylin staining that imparted a blue hue with a concomitant impact on spectral and textural properties (Figure 4). For this reason, study 2 intensity-level thresholds on the blue deconvolved nuclear features and LofG mean for potential mitotic forms were increased to address the differences. Potentially, a stain normalization algorithm could be incorporated into the process to control for discrepancies in feature staining at this point.
Differentials in hematoxylin and eosin (H&E) staining between some samples of both studies. Study 1: (A) typical H&E tumor staining and (B) deconvolved nuclear layer. Study 2: (C) H&E monoasters with more extensive cytoplasmic vacuolation and (D) associated deconvolved nuclear layer displaying intense blue exacerbating structural features.
Automated Measurement of Eg5-mediated Modulation of Mitoses
Application of the algorithm to the two Eg5 pharmacology studies quantified significant time and dose-dependent differences in numbers of aberrant mitotic figures between vehicle- and Eg5-treated TCC xenografts. In study 1, a single dose (5 mg/kg ip) of the Eg5 inhibitor produced a 6-fold increase in the mean number of aberrant mitotic figures at 24 hr (Figure 5A; ***p < .0001, unpaired Student’s t-test), while there were no changes in the number of regular and degenerative mitotic figures over time. This latter observation suggested that despite evidence of a pharmacodynamic response in this single-dose study (formation of aberrant mitotic figures), the progression of the cells from an aberrant mitotic phenotype to a degenerate mitotic phenotype event was insufficient for a significant increase in the expected degenerate forms.
Mean number of regular, aberrant, and degenerative mitotic figures was measured in subcutaneous xenografts of human transitional cell carcinoma. In study 1 (A), a single dose (5 mg/kg ip) of the Eg5 inhibitor produced a 6-fold increase in the mean number of aberrant mitotic figures at 24 hr (***p < .0001, unpaired Student’s t-test) without changes in number of regular and degenerative mitotic figures over time. In study 2 (B and C), continuous dosing produced a significant dose-dependent increase (3 to 9-fold) in both the mean number of aberrant and degenerative mitotic figures at 24 hr as compared to controls (B; ***p < .0001, **p < .001, unpaired Student’s t-test). The increase in mean number of aberrant and degenerative mitotic figures was roughly proportional to the increase in dose administered. When examining the middle dose (2.75 mg/kg) over a time course of 24, 48, and 72 hr, a 7-fold/4-fold increase in aberrant/degenerated mitotic figures was seen after 24 hr (C). Continuous dosing led to a steady 4.5-fold increase in aberrant and degenerated mitotic figures during the time course as compared to vehicle animals (***p < .0001, **p < .001, unpaired Student’s t-test).
The second study used a continuous dosing approach at pharmacologically active doses from the single-dose study with the goal of evaluating a time–dose relationship for formation of the aberrant and degenerate forms. This study demonstrated a significant dose dependent increase (3 to 9-fold) in both the mean number of aberrant and degenerative mitotic figures at 24 hr as compared to controls (Figure 5B; ***p < .0001, **p < .001, unpaired Student’s t-test). The increase in mean number of aberrant and degenerative mitotic figures was roughly proportional to the increase in the dose administered. When examining the middle dose (2.75 mg/kg) over a time course of 24, 48, and 72 hr, a 7-fold/4-fold increase in aberrant/degenerated mitotic figures was seen after 24 hr. Continuous dosing led to a steady 4.5-fold increase in aberrant and degenerated mitotic figures during the time course as compared to vehicle animals (Figure 5C; ***p < .0001, **p < .001, unpaired Student’s t-test). While the statistical significance was strong, there was interanimal variability between aberrant and degenerative mitotic figure numbers over the time course (Figure 5). This variability was inherent to the biology of the Eg5 xenograft pharmacologic model and did not represent uncertainty produced by the image algorithm or manual pathology procedures. Verification of algorithm counts for aberrant and degenerative figures with those of the pathologist was confirmed by applying a Pearson product–moment correlation coefficient to data generated from the ground truth images, where r = .9791 and .8672, respectively, demonstrating a good relationship between the 2 evaluations (Figure 6).
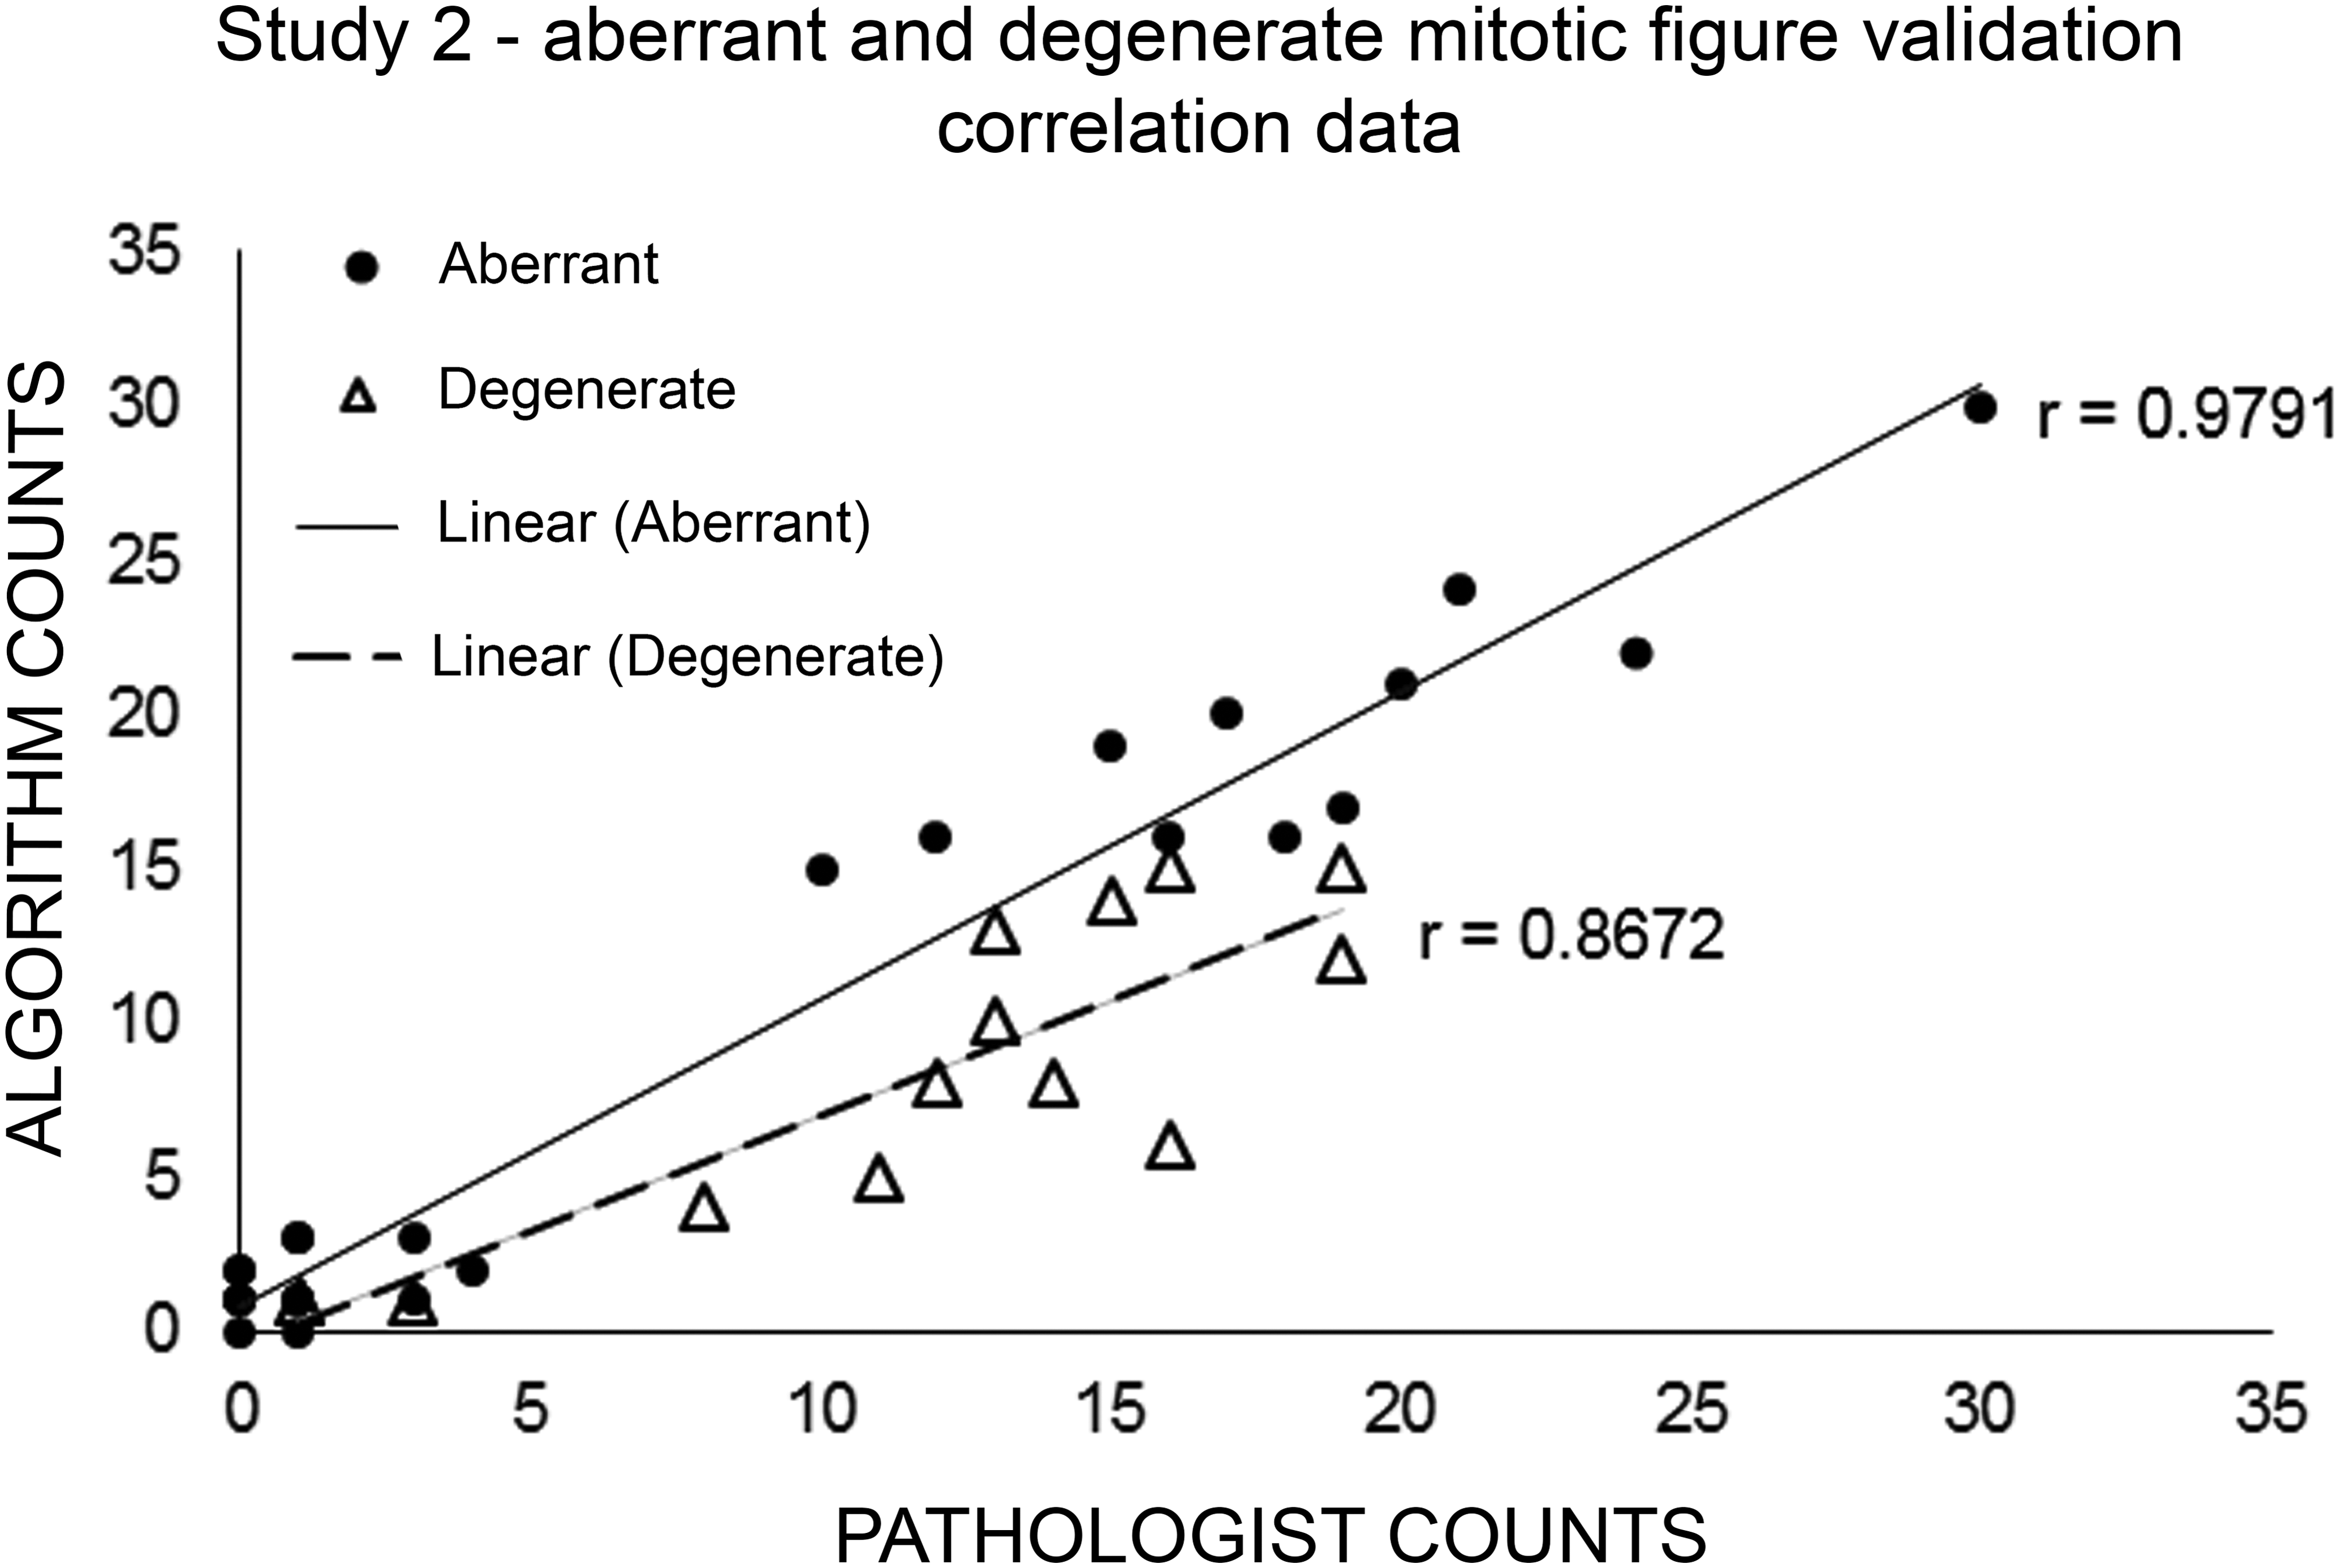
Aberrant and degenerate mitotic figure “ground truth” level verifications, a graphical comparison of pathologist evaluation with that of the algorithm displaying associated linear correlation values for each classification.
Discussion
Using a Definiens-based in-house developed algorithm, we simultaneously quantified normal, aberrant, and degenerate mitotic figures in H&E-stained sections from tumor xenografts in rats treated with an Eg5 inhibitor. The results of the algorithm demonstrated an excellent concordance with the manual evaluation by the pathologist, saved considerable processing time (days), and produced numerical data sets that can be used for modeling-based predictions of pharmacologic and toxicologic responses. To our knowledge, this is the first report of automated and simultaneous analysis of normal, aberrant, and degenerate mitotic figures in an H&E-stained model system for which, historically, a manual by eye approach has been taken (Toudjarska et al. 2009; Sinnott et al. 2014; Slattery et al. 2012; Sonntag et al. 2014).
The cell cycle is a key pharmacologic target in regenerative medicine and oncology as well as a potential off-target physiologic process affected in drug toxicity. Therefore, the measurement of the classes of mitotic figures described in our work accounts for an important potential end point of a drug’s efficacy or toxicity. Specifically, in this pharmacologic model, treatment with the Eg5 inhibitor arrested the mitotic cycle at metaphase resulting in the formation of aberrant mitotic figures. The aberrant mitotic figures are a direct measure of the pharmacodynamic effect of this inhibitor in rapidly dividing cell populations in tumors or of toxicity in tissues like the gastrointestinal tract or bone marrow. The degenerate form is the end-stage phenotype of the disrupted cell and in the tumor would be a measurement of efficacy or in normal tissues, toxicity.
The greatest challenge for developing automated algorithms for mitotic forms is that routine H&E tinctorial methods lack the precision of feature specificity; therefore, the detection and classification of normal or atypical mitotic figures is dependent upon defining an array of morphological features using mathematical shape parameters and neighborhood feature relationships. In the present work, the range of morphological characteristics apparent in the transition of normal–aberrant–degenerate mitotic figures was complex resulting in detection and analysis difficulties, not only because of biological variations but also because of preanalytical variation. The latter was a result of preanalytical variability due to differences in fixation, processing, sectioning, and/or staining between the two studies and subsequent effects on feature orientation in 2-dimensional space. The effects of preanalytical variability cannot be underestimated in designing and executing image analysis studies. The pathologist’s experience and training are crucial for ensuring excellent preanalytical quality throughout the process. Therefore, the pathologist must work closely with laboratories and staff conducting the necropsy and postnecropsy activities.
Our model system (TCC tumor environment) contained cells presenting similar staining and shape characteristics to those of the mitotic figures determined during classification, particularly pleomorphic nuclei and apoptotic bodies or cell fragments. This presented an additional challenge for algorithm development and, while less of an issue in nontumor samples, highlights the need for algorithm adjustments based on the tissue or organ evaluated. In an attempt to circumvent the preanalytical and model system–related issues, primary watershed segmentation followed by local adaptive feature detection was utilized, similar to processes adopted by Held et al. (2010) for cell and nuclear detection. The application of a series of weighted object-based fuzzy logic memberships further strengthened the classification procedures. While these steps improved the output, the achievement of the optimal final classification procedure required a number of additional feature-specific processes and object-level hierarchical relationships during program implementation. These successfully lessened potential stochastic influences on mitotic form identification. For example, prior work had shown that deeply eosinophilic-stained cytoplasm surrounding a potential mitotic figure reflects an apoptotic figure (Thunnissen et al. 2001). Therefore, a percentile-level threshold on the deconvolved eosin layer was included that determined the relationship of localized high-level pink/red staining per cell to global levels across the image. This process step easily reclassified these cells accordingly and avoided any overlap with degenerate figures.
Principal workflows have been described that assist in the detection of general nuclear populations and classification of mitotic and nonmitotic cells (Veta et al. 2013; Irshad 2013). An analogous sequential process taken here firstly identified and grouped nondividing and potential mitotic tumor cell populations and ensured that extended ranges or high volumes of feature data did not hinder later hierarchical classification. The utilization of a LofG to detect peaks in color deconvolved images allowed effective primary determination of the salient features of mitotic objects (Irshad et al. 2014; Chang, Loss, and Parvin 2012). This was especially true, where it was difficult to define a central spindle in the H&E-stained cells for establishing distance transformations or base misalignment parameters in the identification of aberrant monoaster figures. In establishing ground truth, the largest disparity between the pathologist’s by eye mitosis counts stemmed from the need for continual focus through the stained section during evaluation for generation of a greater perspective of mitotic objects deep to the initial field of view (Veta et al. 2013). In a single 2-D scanned image, this depth of focus was not present and therefore added to the complexity of resolving spatial relationships of fragmented objects in the determination and classification of the mitotic cells. A further exacerbation of characterizing 2-D profile cells was the inclusion of mitosis-like objects that were occasionally erroneously classified as mitotic figures; however, this occurrence was found to be relatively low and did not impact on the final outcome (Al-Janabi et al. 2013).
It was important that the mitotic cell numbers, for each mitotic variant, calculated in relation to total tumor cell volume only, discriminated these cell populations from other nontumor cells. To this end, Definiens Tissue Studio software was utilized prior to the implementation of the in-house developed ruleset enabling tumor region recognition and selection. This additional step reduced possible erroneous inclusion of nontumor related cells (data not shown). As with verifying any algorithm utilization for analysis of tissue sections, changes in data sets used for training or development impact on the final program format. The analyst and pathologist must update the algorithm as more data are made available. In this study, we found it necessary to incorporate minor modifications to the algorithm, between studies, which was not just a matter of threshold adjustments but also required some feature detection changes. This highlights the importance of a strategy that improves algorithm performance based on high quality and larger experimental data sets accompanied by a pathologist’s annotation verification and review (Giusti et al. 2014).
The algorithm data across the two in vivo studies indicated a time- and dose-dependent relationship between primary pharmacology (formation of abnormal mitoses) and efficacy (enumeration of degenerate forms; Figure 5). The Eg5 inhibitor used in our work is a specific and potent (Ki = 1.7 nM) reversible inhibitor with an intravenous half-life of approximately 4.4 hr (data not shown). The lack of efficacy (no degenerate mitotic forms) in the single bolus intraperitoneal (ip) study is likely explained by insufficient target inhibition over the 24-hr period of the target. Using a continuous infusion technique in study 2 resulted in steady state exposures (estimated at 5 half-lives or 22 hr after dosing begins) and efficacy as reflected by a dose-dependent increase in degenerate forms. Tumor-free drug concentrations were at or above the Ki at all time points examined (24, 48, and 72 hr) in rats given the mid-dose (2.75 mg/kg/day; data not shown). Although the primary output from the algorithm was the numbers of classified mitotic figures, the algorithm detected and counted apoptotic cells (data not shown). For Eg5 inhibition, apoptosis is an additional potential end point of biological activity and therefore useful for pharmacodynamic and toxicodynamic studies of this target as well as other targets that modulate the cell cycle leading to an apoptotic event.
Any tissue image analysis solution is a significant investment in time and money. The payback for the investment in developing these solutions is 2-fold: (1) it allows for rapid assessment of complex end points in a drug discovery or development environment and frees the pathologist from difficult and tedious manual efforts, in this case the counting of three different mitotic forms; and (2) the big data nature of the output and partnership between the analyst and pathologist results in novel observations and data manipulation which may result in entirely new discoveries and hypotheses. For optimal value, the partnership between the pathologist and the analyst is critical for the continuous improvement and appropriate application of any algorithm in the image analysis laboratory. This is especially important, as the analyst and pathologist assess the algorithm performance in a new tissue or model system. While some rework is expected for different experimental designs, this is minimized by the quality of the initial algorithm design which is an outcome of these collaborative interactions between the pathologist and analyst. For our algorithm, the analyst and pathologists are investigating future improvements including the use of a greater range of object detections on a series of resolutions for extraction and mapping of pertinent features. After defining basic characteristics of organ, tissue, or tumor-specific cell morphology (e.g., cell size), this type of algorithm enables the efficient and simultaneous evaluation of normal, aberrant, and degenerate mitotic forms in any organ, tissue, or tumor sample. As demonstrated in our work, the pharmaco- and toxicodynamic applications for this type of algorithm are powerful in studying the perturbation of cell cycle physiology. However, this type of algorithm is useful retrospectively in target validation studies and prospectively in clinical diagnostic medicine as well as patient selection for clinical cancer trials. It is clear that the scientific discoveries and applications gained from quantifying the multivariant data and patterns discovered by the pathologist is an exciting, evolving field that will advance preclinical and clinical medicine for years to come.
Footnotes
Authors' Contribution
Authors contributed to conception or design (DR, SK, AB, BD, and LW); data acquisition, analysis, or interpretation (DR, SK, AB, BD, and LW); drafting the manuscript (DR, SK, and AB); and critically revising the manuscript (DR, SK, AB, BD, and LW). All authors gave final approval and agreed to be accountable for all aspects of work in ensuring that questions relating to the accuracy or integrity of any part of the work are appropriately investigated and resolved.
Authors’ Note
The authors wish to acknowledge Rebecca Ellston, Helen Jones for study setup and histology and Thomas Mrowiec at Definiens for his guidance on Definiens ruleset processes.
Declaration of Conflicting Interests
The author(s) declared no potential conflicts of interest with respect to the research, authorship, and/or publication of this article.
Funding
The author(s) received no financial support for the research, authorship, and/or publication of this article.