
Abstract
Hepcidin was originally detected as a liver peptide with antimicrobial activity and it functions as a central regulator in the systemic iron metabolism. Consequently suppression of hepcidin leads to iron accumulation in the liver. AbbVie developed a monoclonal antibody ([mAb]; repulsive guidance molecule [RGMa/c] mAb) that downregulates hepcidin expression by influencing the RGMc/bone morphogenetic protein (BMP)/neogenin receptor complex and causes iron deposition in the liver. In a dose range finding study with RGMa/c mAb, rats were treated with different dose levels for a total of 4 weekly doses. The results of this morphometric analysis in the liver showed that iron accumulation is not homogenous between liver lobes and the left lateral lobe was the most responsive lobe in the rat. Quantitative hepcidin messenger RNA analysis showed that the left lateral lobe was the most responsive lobe showing hepcidin downregulation with increasing antibody dose. In addition, the morphometric analysis had higher sensitivity than the chemical iron extraction and quantification using a colorimetric assay. In conclusion, the Prussian blue stain in combination with semi-quantitative and quantitative morphometric analysis is the most reliable method to demonstrate iron accumulation in the liver compared to direct measurement of iron in unfixed tissue using a colorimetric assay.
Introduction
Iron is extremely important to mammals as this metal plays a vital role in almost all biochemical processes including immune response for defense. Since microbes require iron for their survival, a host could control the proliferation and pathogenicity caused by the microbes’ invasion by limiting iron availability (Nairz et al. 2010). Since the human body is unable to actively eliminate iron, maintenance of iron homeostasis takes place by regulation of iron uptake, metabolism, and recycling in the body (Anderson et al. 2012).
The major player in systemic iron regulation is hepcidin, a 25 amino acid antimicrobial protein produced mainly in the liver, which was first discovered in the early 1990s. Hepcidin is regulated by hemojuvelin (HJV), a membrane-bound protein that is involved in the bone morphogenetic protein (BMP)/SMAD pathway, and mutations in this gene result in juvenile hemochromatosis, a disease which causes a severe decrease in hepcidin levels and iron overload. Conversely increases in serum hepcidin levels are generally associated with anemia of chronic disease in disorders such as cancer and kidney diseases.
A monoclonal antibody ([mAb]; repulsive guidance molecule [RGMa/c] mAb) developed at Abbvie is able to regulate iron content in diseases with high hepcidin levels via the HJV-BMPs-hepcidin cascade. RGMa/c mAb binds to HJV, which in response downregulates hepcidin expression in the liver, which correlates with the reduction of the serum hepcidin levels, and this consequently enables ferroportin (iron efflux protein) to transport free iron into the plasma (Boser et al. 2015).
In a study aimed to investigate the response to the antibody when dosed in rats, a non-uniform iron distribution was discovered between liver lobes through Perls’ Prussian Blue (PPB) staining. It was decided to further investigate this finding through quantifying the stained regions (Hall et al. 2013) and morphometric analysis was carried out on all liver tissue sections. This analysis revealed that certain lobes are more responsive with regard to iron accumulation following RGMa/c mAb application. A colorimetric analysis was also done to quantify the total iron content on each liver lobe. Analysis of the hepcidin messenger RNA (mRNA) levels also supported our observation that iron is not homogenously distributed between the liver lobes.
Materials and Methods
Animal Husbandry
Twelve-week-old female Sprague-Dawley (SD) rats weighing approximately 300 g (Charles River Laboratories, Sulzfeld, Germany) were acclimated for 8 days upon arrival. All rats were housed individually (1 rat/cage) in U-TempTM Type III cages under 12-hr light/12-hr dark cycles with temperatures between 20°C and 24°C and the humidity was maintained between 40% and 70%. The rats had access to pelleted food (V1534; ssniff Spezialdiäten GmbH) and water ad libitum (tap water). The pelleted food contained 8.37 mg/kg of iron according to the manufacturer’s data sheet. All the animals received the same diet throughout the entire study. Tap water was provided to the rats through bottles with stainless steel nipples. Twenty-five rats were selected for the study based on their general health and acceptable body weight. The animal facilities were accredited by the Association for Assessment and Accreditation of Laboratory Animal Care (AAALAC) and the study was conducted in accordance with the regulations from the International Committee of Harmonization (ICH), the Committee for Medicinal Products for Human Use (CHMP), and the European and German Federal Animal Welfare Act.
Study Design
Female SD rats were dosed intravenously using the tail veins once weekly with 0.02, 0.2, 2, and 20 mg/kg/week of RGMa/c mAb for a total of 4 doses. The control animals received buffer formulation (vehicle control). Before necropsy, the animals were euthanized by exsanguination under isoflurane (Abbott Laboratories, USA) deep inhalation anesthesia. Tissue from each liver lobe was fixed in 10% buffered formalin and unfixed tissues were snap frozen in liquid nitrogen (Boser et al. 2015; Hall et al. 2013). Female animals were used in this study because male and female SD rats showed differences in serum iron levels (Kong et al. 2014; Boser et al. 2015) and many groups have already carried out studies related to iron metabolism in female SD rats (Li et al. 2013; Wojciak 2014).
PPB
PPB staining method for detection of iron was carried out on 4 µm liver paraffin tissue sections using adapted protocols (Bancroft 2008).
Morphometrics
Liver sections were first scanned with 20× magnification using a ScanScope XT (Aperio ePathology, Germany), and Aperio ImageScope viewer (Aperio ePathology) was used to generate Figure 1. For the morphometric analysis, the slides were first imported into the Definiens Architect software (Definiens, Germany) and analyzed at 1× magnification to exclude nontissue data and to identify single tissue sections on the slides. The image segmentation into tissue sections was carried out using contrast level as a threshold. The resulting image, representing a single tissue slice, is denoted as the region of interest (ROI) for the actual analysis. Because of the large image sizes, each single ROI was analyzed using a tiling-and-stitching procedure. The ROI were fragmented into smaller tiles (4,000 × 4,000 pixels) and a comprehensive analysis was performed on each tile using a higher magnification (5×) to detect the local tissue staining. For the PPB staining, the acquired color images consist of 3 gray value layers. The first layer mainly contains information on the Prussian blue staining and the layer 2 image represents the tissue. Tissue artifacts, such as wrinkles, were detected using the third layer image and user-defined settings. After analysis, the tiles were stitched back together in order to generate a total result for the entire tissue section. For each ROI, the total tissue area as well as the relative area covered by Prussian blue was counted and exported.
Iron detection using Prussian blue staining in liver. The amount of iron detected in the liver increased from the animals which were given vehicle to animals which were dosed with RGMa/c mAb at different doses. (A) In the left lateral lobe, a clear iron accumulation was seen at 0.2 mg/kg/week dose and (B) in the right lobe a mild accumulation was only seen in the liver of animals dosed with 2 mg/kg/week of RGMa/c mAb. Iron saturation was seen in both the lobes at a dose of 20 mg/kg/week. mAb = monoclonal antibody; RGM = repulsive guidance molecule.
Liver Iron Content
Total iron content in unfixed liver tissue was determined using the Iron Assay kit (Sigma Aldrich, MO). The tissue (10 mg) was diluted 1:6 using the iron assay buffer, homogenized by sonication, and the final reaction was incubated for 15 min at room temperature in the dark before its absorbance was measured at 593 nm. The remaining procedures were done according to the manufacturer’s protocol.
RNA Isolation and Reverse Transcriptase Polymerase Chain Reaction (RT-PCR)
RNA was extracted from approximately 30 mg of nitrogen-frozen tissue. After determining the concentration and the quality of the RNA, 2 µg of RNA was reverse transcribed with oligo dT15 (Roche, Mannheim, Germany) at 65°C for 5 min. The mix was added to 5× reaction buffer (Roche), 10 mM deoxyribonucleotide triphosphates (dNTP)-mix (Roche), and RNase inhibitor (Roche) and further incubated for 30 min at 55°C. For the RT-PCR analysis, the reverse transcribed complementary DNA was diluted with Universal PCR Master Mix (Applied Biosystems, CA) and TaqMan Gene Expression Assay (Applied Biosystems) to a final concentration of 50 ng/mL. Triplicate analysis was carried out for each run. The TaqMan Gene Expression Assays used were hepcidin and beta-glucoronidase custom-made FAM-labeled probe-detection assays (Rn00584987_m1 and Rn00566655_m1; Applied Biosystems; Boser et al. 2015).
Statistics
Experimental data were analyzed using one-way analysis of variance (ANOVA) and two-way ANOVA with post hoc tests presuming normal or lognormal underlying distribution. To explore the underlying distribution of the data, a Shapiro-Wilk test for the assessment of normality was performed and data were transformed into logarithm scale as needed. One-way analyses were followed by Dunnett’s post hoc test and for two-way ANOVA, the pairwise comparisons were made by slicing and by Tukey’s honest significant difference for honest significant difference. Statistical analyses were carried out with Graph Pad Prism (version 5) and JMP 10.0 Software (SAS Institute).
Results
Liver Iron Deposition Is Dose and Liver Lobe Dependent
No treatment-related effects were observed on the body weight and the liver weight of the animals. Iron in liver tissue from all animals was detected using the PPB staining method. Qualitative histopathological analysis revealed a dose-related difference in iron accumulation in the liver. In Boser et al. (2015), it was demonstrated that the iron accumulation in the liver was mostly found in the periportal region between each lobule and increases in iron load in the liver were correlated to total iron reduction in the spleen. Closer review of all liver lobes showed variability in lobular distribution and in the intensity between liver lobes within a single animal (Figure 1).
In order to better understand this finding, morphometric analysis on all the PPB-stained liver lobes was carried out. The PPB-stained region (aka ROI) was detected by determining the ratio of the positively stained iron-rich (blue) area and the entire tissue area. The ROI was represented in percentage (%). For all the liver lobes, the total iron content increased with higher application dose starting from 0.2 mg/kg/week. However, variations in iron content between the liver lobes (at 0.2, 2, and 20 mg/kg/week dosage) were detectable throughout this analysis (Figure 2).
Iron detection using morphometric analysis of 6 liver lobes tissue sections stained with PPB staining. The bar chart represents the means of ROI (%) for each liver lobe in each dosage group. Liver iron deposition on average increases with dose, but a pronounced variation can be seen within the different liver lobes. Data were analyzed using a mixed model and the mean for each group is displayed. This analysis shows that the left lateral lobe was the most responsive lobe and the right lobe was the least responsive lobe to show iron accumulation with increasing RGMa/c mAb dose. mAb = monoclonal antibody; PPB = Perls’ Prussian Blue; RGM = repulsive guidance molecule; ROI = region of interest.
It was of interest to investigate if liver lobes show different properties in iron content in relationship to the antibody dose. In order to determine the most responsive (toward iron content changes) liver lobes, two-way ANOVA followed by post hoc analyses were assessed. Based on this analysis, the investigated liver lobes were ranked from the most responsive to the least responsive lobe for analysis. For this investigation, the amount of iron on one lobe was compared to the amount of iron on all other lobes.
Left Lateral Lobe Is the Most Responsive Liver Lobe
At 0 and 0.02 mg/kg/week dose, no effects (iron deposition) were seen in all lobes. PPB-positive cells were seen in the left lateral and medial lobes in higher levels at lower antibody doses (0.2 mg/kg/week) in comparison to the other lobes (Supplementary Table 1). The morphometric analysis (with absolute values) confirmed this finding, where the percentage of PPB-stained region (ROI) was higher in these lobes at 0.2 mg/kg/week dose. Comparisons were carried out between each lobe independently. Based on this analysis, the left lateral lobe and the medial lobe were identified as the most responsive liver lobes toward iron accumulation. At the maximum dose of 20 mg/kg/week, saturation of iron in the liver took place, that is, equilibrium of iron content took place between liver lobes.
P Values of the ROI (%) of the PPB-stained and Morphometrically Analyzed Left Lateral Lobe and Medial Lobe Compared to Other Lobes at Each Dose Level.
Note: PPB = Perls’ Prussian Blue; ROI = region of interest.
Table 1 shows the two selected candidates left lateral lobe and medial lobe with higher sensitivity (ROI expression) in comparison to other liver lobes. The left lateral lobe showed the most promising result followed by the medial lobe. In the left lateral lobe, a trend for iron deposition was already seen at a dose of 0.2 mg/kg/week (marginally significant result) and was significant for the 2 mg/kg/week dose, whereas in the medial lobe this trend was only observed at a dose of 2 mg/kg/week (analysis shows marginally significant difference). The results suggest that iron accumulates in different liver lobes in an ordered way, until at high dose where saturation occurs.
Based on the comparison of the ROI expression level for both lateral and medial lobes for each dosage group with other lobes in the same dosage group (using two-way ANOVA with interaction followed by post hoc test with contrast), the significance was confirmed only in the case of the left lateral lobe at 2 mg/kg/week (p = .0006) and for both the left lateral lobe at 0.2 mg/kg/week and the medial lobe at 2 mg/kg/week, which were marginally significant (p = .0571 and p = .0593).
However, the lateral lobe showed the most promising result followed by the medial lobe. In the left lateral lobe, a trend for iron deposition was already seen at a dose of 0.2 mg/kg/week. The results suggest that different liver lobes are filled up in an ordered way, until at high dose where saturation occurs. At an antibody dose of 20 mg/kg/week, saturation of iron occurs in all lobes and analysis of liver lobe response toward antibody dose could not be carried out.
Right Lobe Is the Least Responsive Liver Lobe
The right lobe had the lowest percentage of PPB-stained area (ROI) when compared to all other liver lobes at h5F9-AM8 antibody doses of 0.2, 2, and 20 mg/kg/week (Supplementary Table 1).
A post hoc test was first carried out on all possible pairs of liver lobes over all dose groups. This analysis revealed that the right liver lobe showed significantly weaker staining compared to all other lobes. Therefore, right lobe is considered unsuitable for iron-related histopathological analysis (Table 2).
Overall Testing of PPB Stained Liver Lobes Compared to the Right Lobe.
Note: PPB = Perls’ Prussian Blue, CL = Confidence Level.
Liver Iron Content
The colorimetric analysis using snap frozen liver was evaluated to determine if these results could also be achieved using this technique. The liver iron content in vehicle animals was approximately 7 ng/µL and an increased level was seen in animals dosed with 2 and 20 mg/kg/week RGMa/c mAb. However, due to the high variability, statistical significance could not be shown here. Despite the increase in iron concentration in the liver, no specific lobe was identified as more responsive than the other (Figure 3).
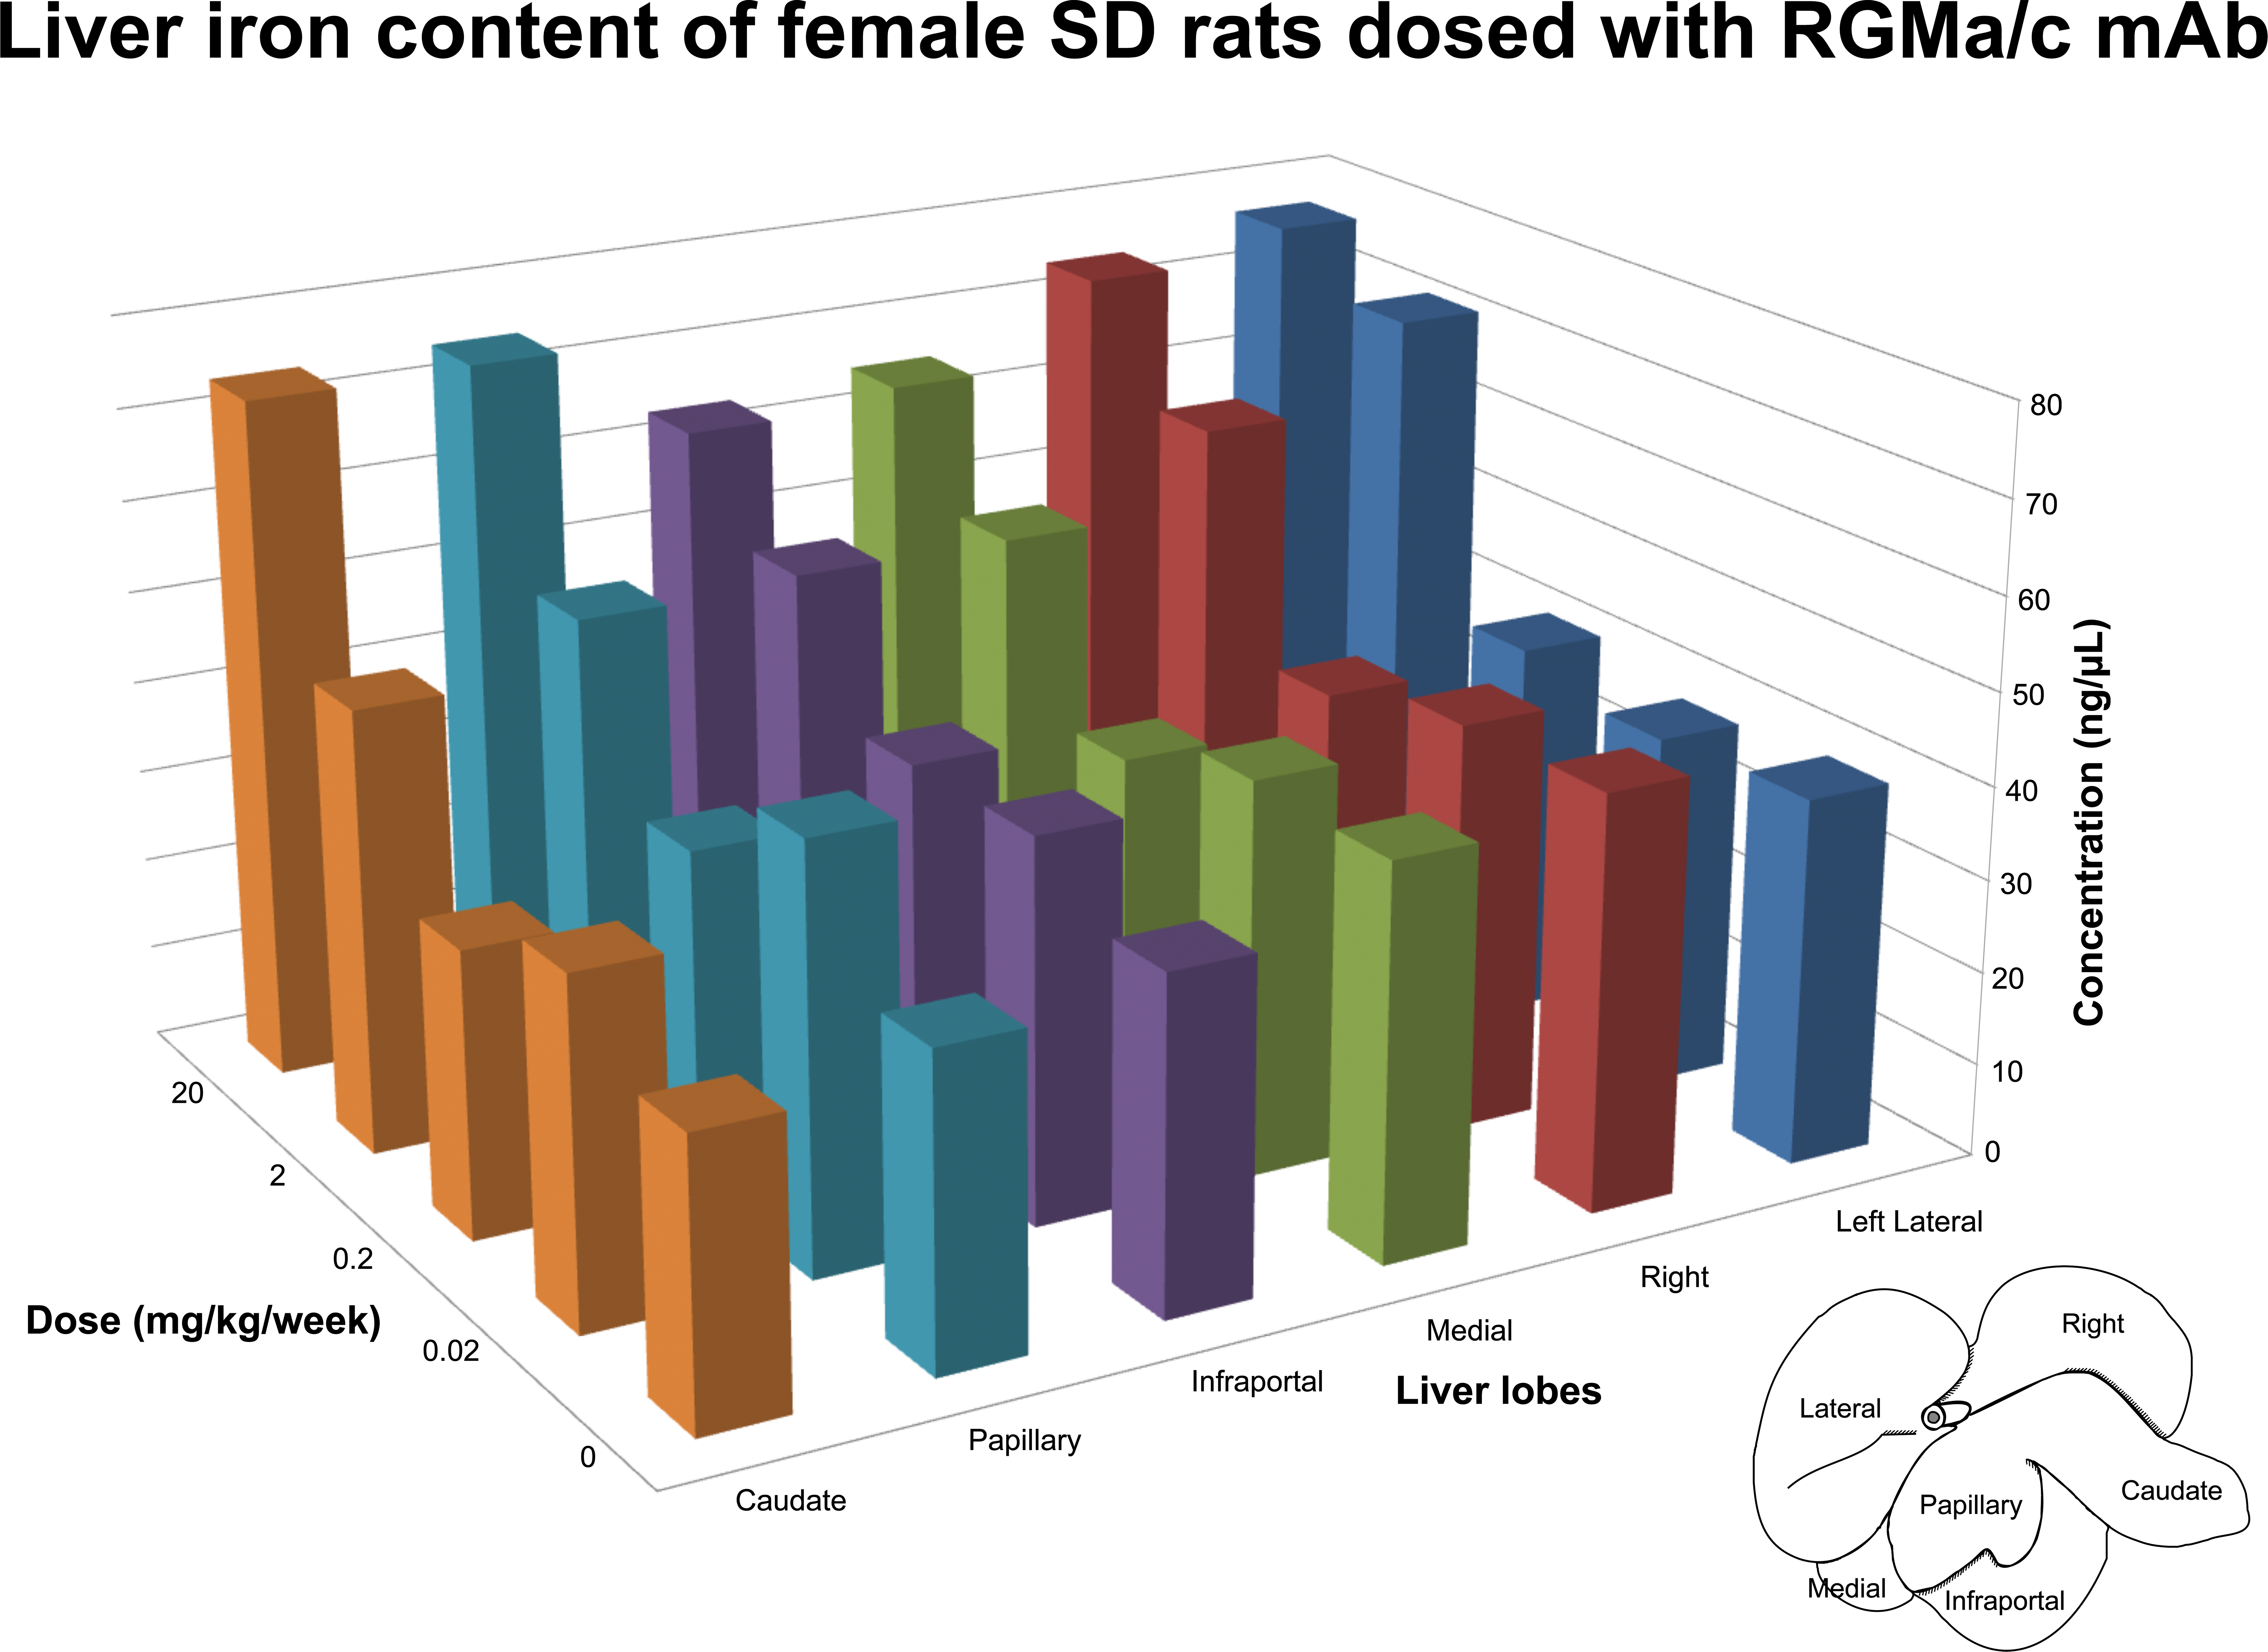
Iron concentration in liver of rats injected with RGMa/c mAb. Iron concentration in vehicle, 0.02, and 0.2 RGMa/c mAb-dosed animals were on the same range. Animals dosed with 2.0 and 20 mg/kg/week antibody showed significantly increased liver iron levels. ANOVA was unable to demonstrate a more responsive or unresponsive lobe representing liver iron content for this analysis. ANOVA = analysis of variance; mAb = monoclonal antibody; RGM = repulsive guidance molecule.
Nonuniform Hepcidin Expression in Liver Lobes
Hepcidin expression analysis based on unfixed tissue from all liver lobes shows variations in the expression profile (Figure 4): Hepcidin expression in liver lobes is different in RGMa/c mAb-treated animals. Hepcidin expression varies between liver lobes and the total expression decreases with increasing antibody dose. No significant difference was seen between the liver lobes belonging to the vehicle group and the group that was dosed with 0.02 mg/kg/week RGMa/c mAb. Significant decrease (p < .05) was obtained at 0.2, 2, and 20 mg/kg/week dose using the two-way ANOVA followed by post hoc test analysis at each dose level. Based on this analysis, it was concluded that the left lateral lobe followed by the caudate lobe were more responsive compared to the other lobes in demonstrating hepcidin downregulation with increasing antibody dose (Supplementary Tables 3 and 4).
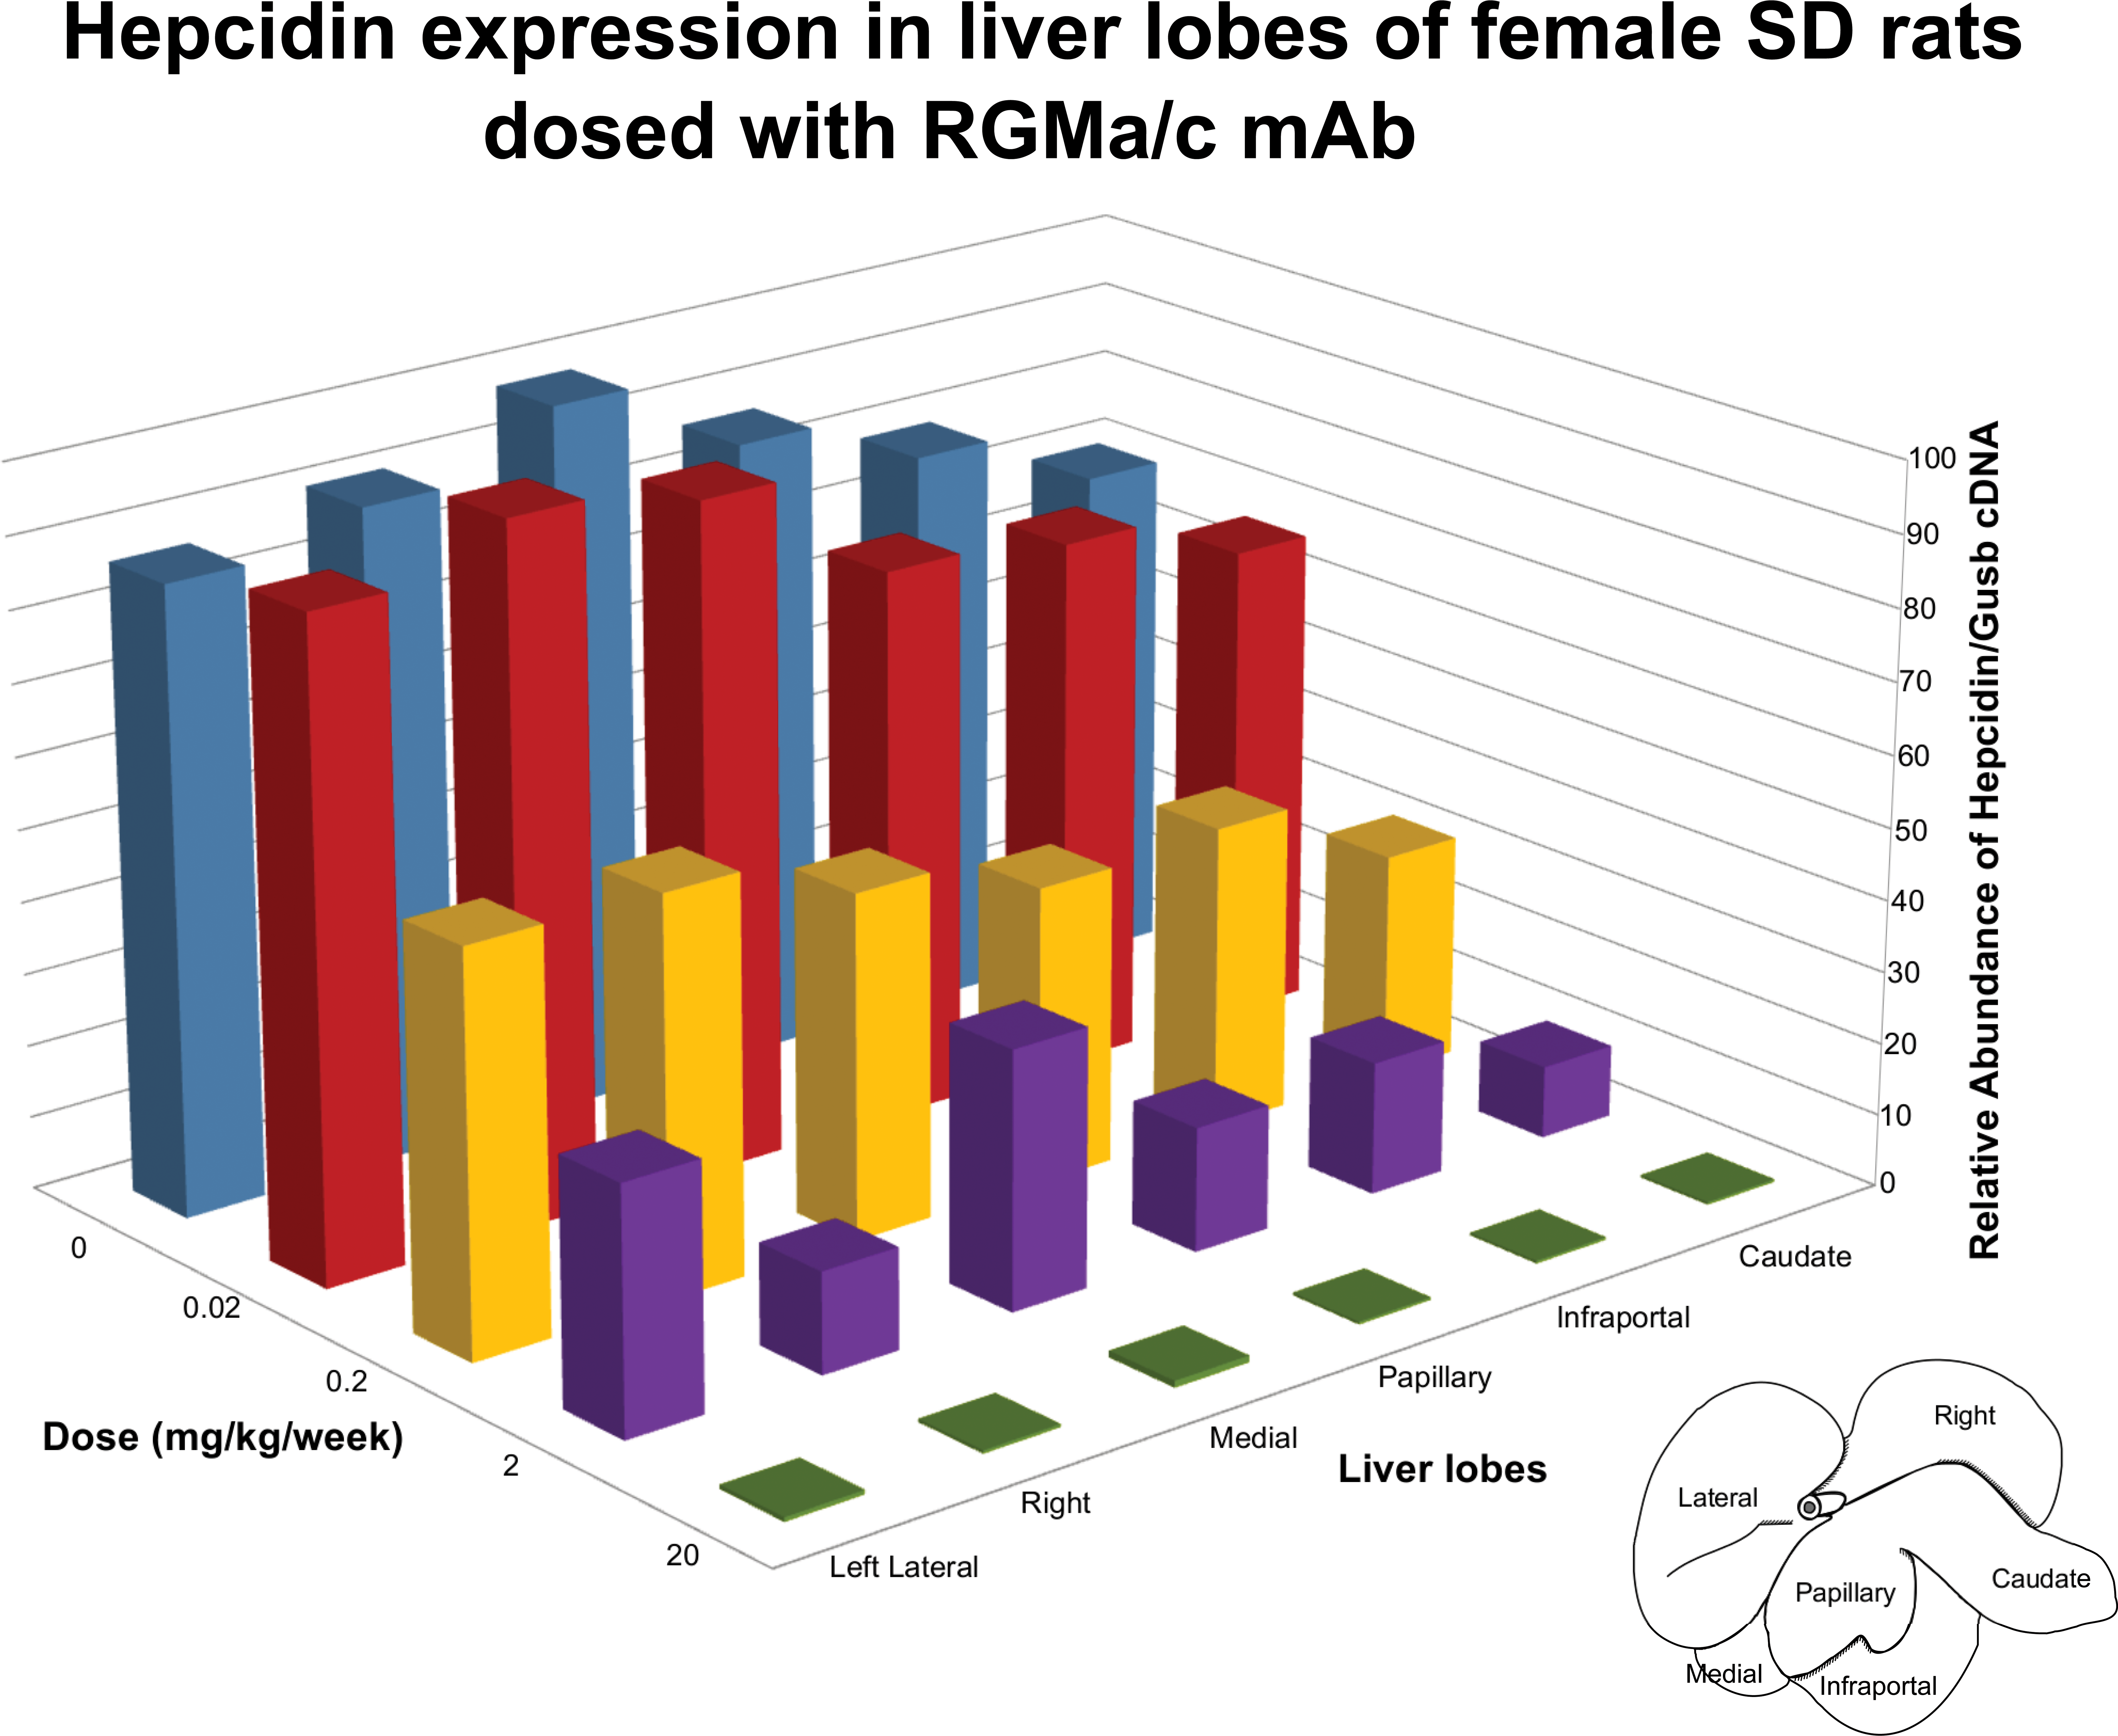
Hepcidin expression in liver lobes at different RGMa/c mAb doses. The bar chart represents the mean of hepcidin expression for each liver lobe in each dosage group. Hepcidin expression varies between liver lobes and the total expression decreases with increasing antibody dose (analysis shows significant decrease in the level of hepcidin expression from 0 to 20 mg/kg/week dosage). Data were analyzed using mixed models and the left lobe was the most responsive lobe to show downregulation of hepcidin with increasing antibody dose and caudate was the least responsive lobe. mAb = monoclonal antibody; RGM = repulsive guidance molecule.
Discussion
Iron is essential in almost all biological processes such as erythropoiesis, as a central atom of cytochromes, hemoglobin, and other enzymes and during oxidative stress. This metal is present in reduced (Fe2+), oxidized (Fe3+), and in heme forms. A conversion between the reduced and oxidized stages results in the release of radicals which in consequence ruptures cell organelles (Dixon et al. 2014). Research relating to iron pathways and its role in diseases have not yet been fully explored despite a lot of research/hypothesis hinting iron to be the trigger of the diseases pathogenesis (Finazzi et al. 2014). In addition, it is suspected that evolutionary adaptations to the iron content and availability in the natural diet determine a species’ susceptibility to iron storage disorders (Clauss et al. 2012).
We developed an mAb, RGMa/c mAb which is able to downregulate hepcidin at different stages (Boser et al. 2015). Hepcidin is the main iron regulator of the systemic iron metabolism and the iron content in the body can be regulated by controlling the hepcidin expression. In order to explore the effect and its dose response, a 3-week dose-range finding study with RGMa/c mAb in rats at doses of 0.02, 0.2, 2, and 20 mg/kg/week was carried out.
Evaluation of H&E-stained tissue slices revealed no pathological changes in the liver morphology of all animals except changes in pigment load. In order to further evaluate the pigment load, PPB staining was conducted and revealed that RGMa/c mAb caused dose-dependent iron deposition in the liver. The iron was deposited in the hepatocytes close to the periportal area of the liver and reduced in the spleen macrophages in accordance with pathogenesis of hemochromatosis in humans (Boser et al. 2015).
Morphometric analysis carried out on PPB-stained liver and spleen sections verified the observation of iron increase with dose. In addition, this analysis also led to the observation that iron deposition varied within the liver lobes. In addition to the standard diagnostic procedures carried out by pathologists, image analysis was used to quantitatively support the findings. Despite the thresholds and the upper cutoffs for determination which require manual entries, this technique has its own advantages, for example, high throughput and unbiased analysis due to standardized parameters (Hall et al. 2013). Statistical analysis on all the liver lobes revealed that the left lateral lobe was the most responsive lobe as iron accumulation was already visible at much lower doses. Furthermore, the right lobe was the least responsive lobe compared to all others and a higher dose of RGMa/c mAb was needed to see iron accumulation.
It was then desired to determine if a simple iron concentration measurement with an iron assay kit could also be used for this purpose. Despite obtaining an increase in the liver iron, a level of significance could not be reached. It was also not possible to get a clear difference between liver lobes because 10 mg of unfixed tissue used for this analysis does not represent the entire liver lobe. Teutsch et al. evaluated the three-dimensional microarchitecture of the rat liver and concluded that the volume of liver lobes in rat was highly variable (between 0.094 and 0.621 mm3; Teutsch, Schuerfeld, and Groezinger 1999). This high variability in the volume of individual liver lobules contributes to the high variability of results in the colorimetric assay. The tissue samples used in the colorimetric assays were randomly taken from large or small lobules (from portal or nonportal area), in which the iron was not evenly distributed, whereas PPB-stained slides represented a cross section through the whole liver lobe. Therefore, iron determinations using Prussian blue staining followed by semiquantitative assessment by the pathologist followed by quantitative examination through morphometric analysis are the most reliable methods in the diagnosis of test item related to iron accumulation in the liver. The colorimetric assay will be more representative to quantitatively show iron increase in the liver when the sample size could be increased.
The hepcidin mRNA expression in all liver lobes was analyzed using the TaqMan RT-PCR method. Investigation of the hepcidin downregulation of animals that received the same antibody dose showed that the left lateral lobe and the medial lobes were responding better in demonstrating hepcidin downregulation at the antibody dose of 2 mg/kg/week when compared to all other lobes. These results correspond well to the morphometric results.
In summary, these findings are important and should be taken into consideration for human diagnostics. It is possible that iron analysis from liver biopsies of patients with iron imbalances shows variations in iron content because iron levels vary between liver lobes This information is important in human clinical diagnostics. Based on our investigation, the left lateral lobe was the most responsive lobe toward iron accumulation. Due to the variation in iron content that is present between the liver lobes, it is important that tissue samples for analysis are always taken from the same lobe for better comparison.
Footnotes
Author Contributions
Authors contributed to conception or design (PB, YM, MM, IT, HL, MH, DS, BM, AP); data acquisition, analysis, or interpretation (PB, YM, MM, IT, HL, MH, DS, BM, AP); drafting the manuscript (PB, BM, AP); and critically revising the manuscript (PB, YM, MM, IT, HL, MH, DS, BM, AP). All authors gave final approval and agreed to be accountable for all aspects of work in ensuring that questions relating to the accuracy or integrity of any part of the work are appropriately investigated and resolved.
Authors’ Note
All authors were involved in the discussion, reviewing, and the final version of the manuscript was approved by all authors.
Declaration of Conflicting Interests
The author(s) declared no potential conflicts of interest with respect to the research, authorship, and/or publication of this article.
Funding
The author(s) disclosed receipt of the following financial support for the research, authorship, and/or publication of this article: These studies were sponsored by AbbVie. PB, YM, IT, HL, DS, BKM, and AP are employees of Abbvie. PB designed research, performed research studies, analyzed results, made figures and wrote the manuscript. YM analyzed results and made figures. MM analyzed results. IT performed research studies and analyzed results. HL performed research studies. MH provided intellectual contribution and technical advice. DS provided intellectual contribution and technical advice. BKM was involved in the designing of research, analysis of results, and wrote the manuscript. AP was involved in the designing of research, pathology analysis, analysis of results, and wrote the manuscript. MM and MH have not received any personal compensation from AbbVie.