
Abstract
Image analysis is now routinely employed as a tool in toxicologic pathology to help quantitate end points of efficacy and safety. It is regarded as a proficient and a sensitive technique to generate numerical data that can be easily interrogated for statistical evaluation. Traditional semiquantitative pathology scoring on the other hand is sometimes regarded as less accurate due to the limitations of the scoring systems employed and the day-to-day variations often noted between pathologists. We therefore decided to generate an optimized histochemical staining and image analysis protocol to compare the accuracy of semiquantitative scoring with computerized image analysis. In order to achieve this, we describe a standardized protocol for staining and image analysis that eliminates or minimizes as many sources of error as possible. The results of this experiment demonstrate that despite consistent variations in scoring between two independent pathologists, correlation with image analysis data of 0.91 to 0.95 (Spearman’s Rho test) was achieved. These data indicate that either image analysis or traditional semiquantitative scoring can generate accurate data. As a result of this, it appears that it is equally safe to employ either method dependent upon the complexity and the practicality of the task at hand provided that the experimental conditions are rigorously optimized and rigidly adhered to.
Introduction
The histological assessment of iron in toxicologic pathology is routinely made using traditional semiquantitative scoring systems in hematoxylin and eosin (H&E)-stained slides. Additional special stains such as Perls’ Prussian Blue (PPB) (1867) (Churukian 2008) can be performed to highlight the presence of iron and enable a more sensitive assessment of iron deposition. In the medical profession, several scoring systems have been developed to semiquantitatively assess the pattern and severity of iron distribution in human patients and correlated with clinical outcome (Deugnier et al. 1993; Brunt et al. 2000) and/or biochemical measurement of hepatic iron (Deugnier et al. 1993). Quantitative biochemical measurements of iron deposition have also been correlated with computerized image analysis (IA; Olynyk et al. 1990; Chua-anusorn et al. 1999; Ortega et al. 2005; Brown et al. 2011). In the past decades, this process has been laborious and time-consuming, usually requiring the operator to capture multiple representative nonoverlapping areas for analysis (Olynyk et al. 1990; Chua-anusorn et al. 1999; Ortega et al. 2005; Brown et al. 2011). In the case of human biopsy material, a relatively small fraction of the total liver is usually assessed. However, despite these limitations, good correlations have been reported between IA and true biochemical measurements of hepatic iron index.
Now, recent advances in digital whole-slide scanning hardware coupled with user-friendly IA software have greatly accelerated the introduction of these techniques into the research area. The pharmaceutical industry has not been slow to take advantage of this, so much so that it is now routine for toxicologic pathologists to request IA to help define and quantify histological end points of efficacy and toxicity. However, despite its widespread use, as far as the authors are aware there are relatively few reports that compare the accuracy or otherwise of semiquantitative scoring for histochemical staining with computerized automated systems within the pharmaceutical industry. Furthermore, where reports are available, at least for the assessment of liver fibrosis in man, the results appear to be at odds with some authors (Pilette et al. 1998; Masseroli et al. 2000) suggesting that quantitative IA shows good correlation with semiquantitative scoring systems whereas others (Wright et al. 2003) indicate that semiquantiative scoring is more robust. Despite these differences of opinion, it is widely believed that computerized IA represents a more proficient approach (Farris and Colvin 2012). This assumption may partly be based on the output format since computerized IA readily generates large quantities of numerical data that can be easily interrogated by statistical means. In addition, IA provides a more reproducible means of quantification, smaller changes might be detected, and the variance in the output raw data is not compressed into the relatively rigid scoring range that is typical of the 0 to 4 scoring systems in use by most toxicologic pathologists.
The process of IA relies on the rapid scanning and digitization of glass slides. The captured red-blue-green (RGB) images are usually converted to a gray scale and analyzed by an algorithm that essentially enables selection and scoring of positively stained pixels (Ruifrok and Johnston 2001). These are defined by a manual process of interactive thresholding where the operator adjusts the stained regions lower and upper cutoff (segmentation) limits and selects appropriate regions of interest (to help avoid artifacts). With training and discussion between the IA expert and a pathologist, consistent results are possible. However, this is heavily dependent upon eliminating or reducing as many sources of (principally staining) variation as possible. Even so, small differences between institutions are likely to be expected due to differences in operator judgments when selecting regions of interest and threshold levels.
In a recent safety assessment study where the toxicity of a glycogen synthase kinase 3 beta (GSK3β) inhibitor was assessed in a 28-day toxicity study in rats, we noted the presence of iron deposition within the liver. The reversal of this toxicity was anticipated to be minimal even after a recovery period of 28 days since passive removal of iron is only possible through menstrual blood loss (in primates) and enterocyte exfoliation (Harrison-Findik 2010). We therefore decided to take advantage of the inherent sensitivity generated by IA in order to more accurately investigate the dose response and determine whether there was indeed a small reversal of the effect.
In this report, we have correlated the results of IA with the results derived by semiquantitative assessment of PPB staining from two independent pathologists to determine the accuracy of quantitative versus semiquantitative methods of assessment. We have also developed an IA routine for the histochemical assessment of PPB (iron) staining within the livers of rats treated with a GSK3β inhibitor. In order to reduce the variance in the data set and generate robust IA data, we have generated a protocol that minimizes as many sources of variability as possible.
Materials and Method
Test Material
For the in vivo studies, test compound (purity 100.1%) was supplied by the formulation and analytical support group, AstraZeneca, Alderley Park. It was formulated as a solution in 0.5% w/v hydroxypropyl methylcellulose and 0.1% w/v polysorbate 80 in 0.01 M phosphate buffer. The pH of the control and test formulations was between 7.4 and 7.5 pH units.
Animals and Treatment
The 1-month study from which tissue was derived was conducted in accordance with the standards of animal care and ethics described in “Guidance on the Operations of the Animals (Scientific Procedures) Act 1986” issued by the U.K. Home Office. It was conducted so that any clinical expression of toxicity remained within a moderate severity limit as described in guidelines agreed with the U.K. Home Office inspector.
Four groups of Wistar Hannover rats (HsdHan:WIST), each consisting of 10 males and 10 females, were given compound orally, once daily, at dose levels of 0, 10, 30, and 50 mg/kg/day for 28 or 29 days (with the exception of 3 males at the high dose which were killed early for welfare reasons after either 22 days [M62] or 26 days [M61 and M63] of dosing). Additional groups (5 males and 5 females) were included to assess recovery at 4 weeks after cessation of dosing. Two recovery females (F96 and F97) were killed early for welfare reasons during the recovery period (day 33). Animals were killed by the administration of halothane (for main test animals, this occurred 1 day after the last dose).
The rats were approximately 11 weeks at the start of dosing. They were obtained from Harlan Laboratories UK Ltd (Blackthorn, Bicester, Oxfordshire, OX25 1TP). They were group housed up to 5 per cage in transparent plastic cages and placed in racks. Temperature and relative humidity ranges were maintained at 19 to 23°C and 40 to 70%, respectively. The animal room was illuminated by artificial light from fluorescent tubes on a 12 hr light–dark cycle.
Slide Preparation
At the end of the study period, animals were killed by the administration of halothane and necropsied. The liver was weighed and fixed in 10% neutral buffered formalin. Tissues were then trimmed and the left lateral, right median, and caudate lobes were processed to wax blocks. Sections were cut at 4 µm thickness by a single technician on the same day in order to minimize variations in section thickness and stained with H&E to good laboratory practice (GLP).
Automated Method for PPB Staining
Liver sections were cut and stained with PPB to GLP. Staining was adapted from the method described by Churukian (2008) in the Theory and Practice of Histological Techniques, 4th edition, by programming exact timings into an automated stainer (Leica Jung Autostainer XL; Leica Microsystems, Milton Keynes, Buckinghamshire, UK). In total, four racks of 25 slides were stained in one run of the autostainer. Fifteen minutes prior to staining, the solution for PPB stain was made as described by Churukian (2008). This solution consisted of equal quantities of 2% hydrochloric acid (v/v) and 2% potassium ferrocyanide (w/v). Sections were deparaffinized and rehydrated through graded alcohols to water. The sections were then stained with PPB for 10 min, washed in running water for 1 min, counterstained with 0.5% aqueous neutral red solution (Polysciences Inc.,Warrington, PA) for 1 min. Subsequent dehydration steps used exact timings in order to maintain consistent counterstain intensity and distribution. PPB has a limited staining life; therefore, a positive control (serial section of spleen) and a negative staining control (serial section of adrenal) were used for each staining rack to monitor any reduction or variation in staining.
Histological Evaluation
Histological evaluation was performed by FRCPath qualified pathologists, each with over 10 years of toxicologic pathology experience (hereafter referred to as pathologist 1 and pathologist 2). All H&E-stained slides were evaluated by pathologist 1 and semiquantitatively scored on a 0 to 4 scale where 0 = no staining/background staining, 1 = minimal staining, 2 = mild staining, 3 = moderate staining, and 4 = severe staining. Minimal staining was defined as the least increase in brown pigment staining that could be clearly distinguished from background staining whereas severe staining was defined as a significant increase in the amount and intensity of staining that covered a large area of the liver lobule. Mild and moderate staining were defined as levels of staining that could be clearly distinguished from each other and intermediate between minimal and severe.
All PPB-stained slides were evaluated independently by two pathologists. Pathologist 1 performed a routine evaluation of the slides (with knowledge of the treatment groups) whereas pathologist 2 “blind” read the slides without knowledge of the treatment groups. Both pathologists read/reported their data without the knowledge of the IA data to avoid operator bias. All PPB slides were scored semiquantitatively according to the following scale: 0 = no staining, 1 = minimal staining, 2 = mild staining, 3 = moderate staining, and 4 = severe staining (Figure 1). No staining was defined as a level of staining where no or very little hepatocyte staining was visible using a 10 to 20× objective; minimal was defined as a level of staining just visible in periportal hepatocytes using a 10 to 20× objective; severe was defined as a level of staining easily visible using a 2.5× objective extending centrilobularly to involve most/all hepatocytes. Mild and moderate were defined as a level of staining intermediate between minimal or severe where staining was readily visible in periportal hepatocytes (mild) or appeared to extend partly toward the centrilobular region (moderate). The data produced by pathologist 1 were later compared to IA data and used to generate reference images (Figure 1) to define the scoring levels for pathologist 2. All data were recorded in a GLP compliant manner using an electronic data capture system (Pathdata V6.2d).
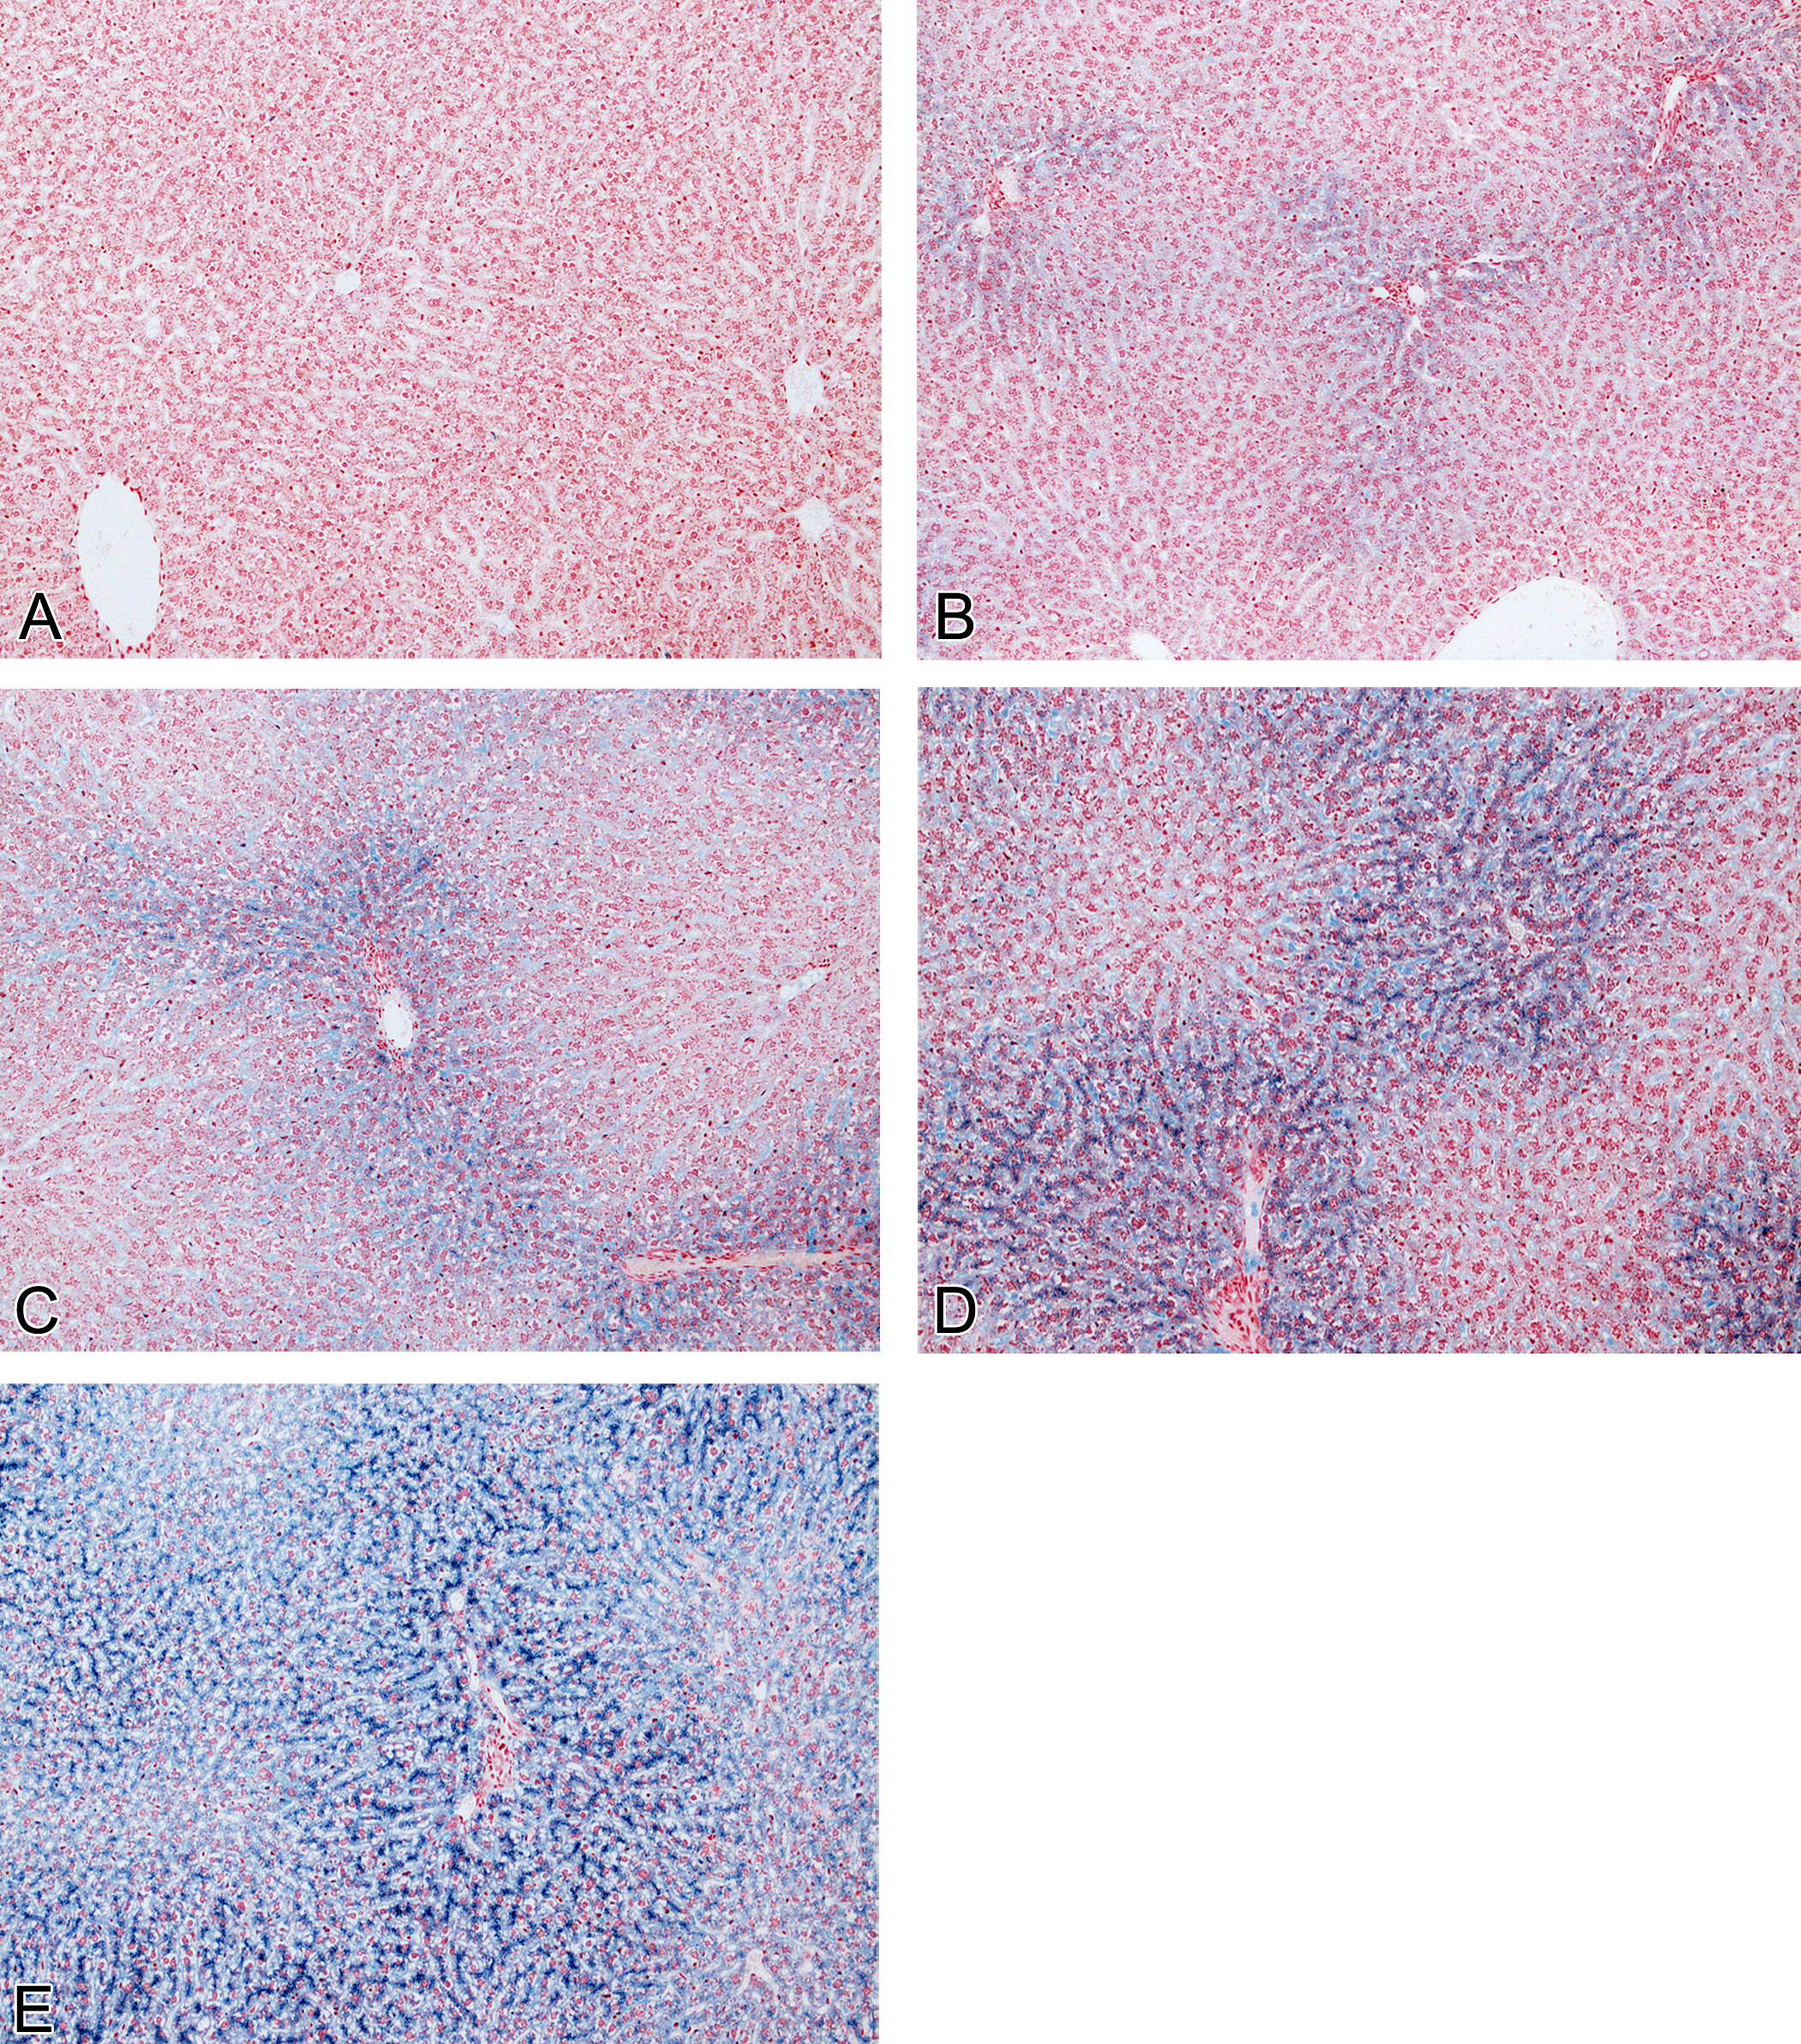
PPB-stained liver sections (original objective magnification 10×) showing PPB grading system. (A) No staining (score 0); (B) minimal staining (score 1); (C) mild staining (score 2); (D) moderate staining (score 3); and (E) severe staining (score 4).
Image Analysis
In order to validate the PPB IA algorithm, a validation experiment was performed where the percentage of positive PPB staining relative to areas was determined by IA and then correlated with percentage scores using reference control material. The results of this analysis revealed a Pearson product moment correlation coefficient of r = 0.99 indicating a good correlation and suitability of the method for future experiments (results not shown).
Perls’ stained liver sections from all animals were then scanned on the Aperio Scanscope XT system (Aperio Technologies, Inc.) at 20× objective lens magnification. IA was performed on all liver sections using the color deconvolution algorithm (version 9.1, Aperio) with study-specific validated threshold settings for the identification of the PPB-stained iron component and neutral red nuclear counterstain. The RGB-based color image optical density (OD) levels for both stains were set: color 1 (C1 = PPB) red OD 0.765, green OD 0.54, and blue OD 0.345; and color 2 (C2 = neutral red) red OD 0.19, green OD 0.74, and blue OD 0.65. The third color component, C3 OD, was set to zero to ensure interdependency only for the analysis between the two required colors, as no other stain colors were present in the tissue sections.
All PPB color intensity threshold levels were set to <192 (intensity range 0–255) to ensure that only blue staining of intensity levels darker than this were counted as positive and to avoid the inclusion of any nonspecific background levels in the analysis. The slide scanning and analysis procedure was calibrated against a linear gray level step density gradient (Edmund Scientific) to ensure consistent light intensity levels were obtained throughout the experiment. These readings were then used to calculate a relative control OD scale for comparison with the derived OD levels for the color deconvolution. PPB staining threshold levels were established using control tissues with variable amounts and distribution of iron. Specific areas of staining were agreed with pathologist 1 in order to define the detection range used in the IA routine, which were then validated using comparative percentage scores. Controls were run on separate occasions to ensure reproducibility of data. A negative staining control section (adrenal) was also included in the analysis to ensure color deconvolution provided accurate detection and separation of the two stain colors. The four known PPB positive tissue control slides were also run at different stages, approximately 25 slides apart, during the study analysis to confirm threshold settings and check for consistency during the evaluation. Before IA was performed on the liver samples, good staining consistency was confirmed by determining the maximum percentage staining deviation in the positive control samples by measurement of the OD (−log10 T where T = stain intensity/clear glass intensity) and positive intensity of transmitted light (see Supplementary Table S1). Once low-staining variability was confirmed (3.5 and 2.5% maximum percentage deviation, respectively) IA of the liver samples progressed.
All samples of liver for each animal were interactively drawn around to avoid any inclusion of edge effects or nonspecific artifacts which consisted principally of minimal lifting at edge sections and nonspecific debris. Study data were generated by the color deconvolution algorithm which produces pixel counts based on the color of stains applied, in this case the blue and red of the stained iron and nuclei, respectively. The total Perls’ stained (TPS) area was calculated according to equation (1) and the qualified percentage of Perls’ staining relative to tissue area in regions of interest was determined according to equation (2).


where
TSA = total stained area;
PTP = percent total positive;
TAA = total analysis area.
Statistics
The strength of the association between the IA data (on a log scale) and the pathology grades (on an ordinal scale) was calculated using two common nonparametric correlation coefficients—Kendall’s Tau and Spearman’s Rho.
Results
Pathology Observations
Gross Findings and Organ Weights
No gross changes were seen in the liver at necropsy. A dose-related decrease in body weight (10% and 13%) was noted in male rats treated at 30 and 50 mg/kg/day. A dose-related increase in relative liver organ weight was noted in male animals (17–34%) and female animals (18–40%) treated at 30 and 50 mg/kg/day, respectively.
H&E Histopathology Findings
H&E analysis (Table 1) showed a treatment-related increase in the amount of brown pigment (later confirmed as PPB positive hemosiderin) in male and female rats dosed with a GSK3β inhibitor at 30 to 50 mg/kg/day and female animals dosed at 10 mg/kg/day. Female animals appeared to be more severely affected than male animals, although there was no clear difference in exposure between the sexes. No reversal was apparent after the end of the 28-day recovery period. Pigmented hepatocytes were predominantly periportal in location and were characterized by a minimal level of fine granular inclusions within the hepatocyte cytoplasm (Figure 2).
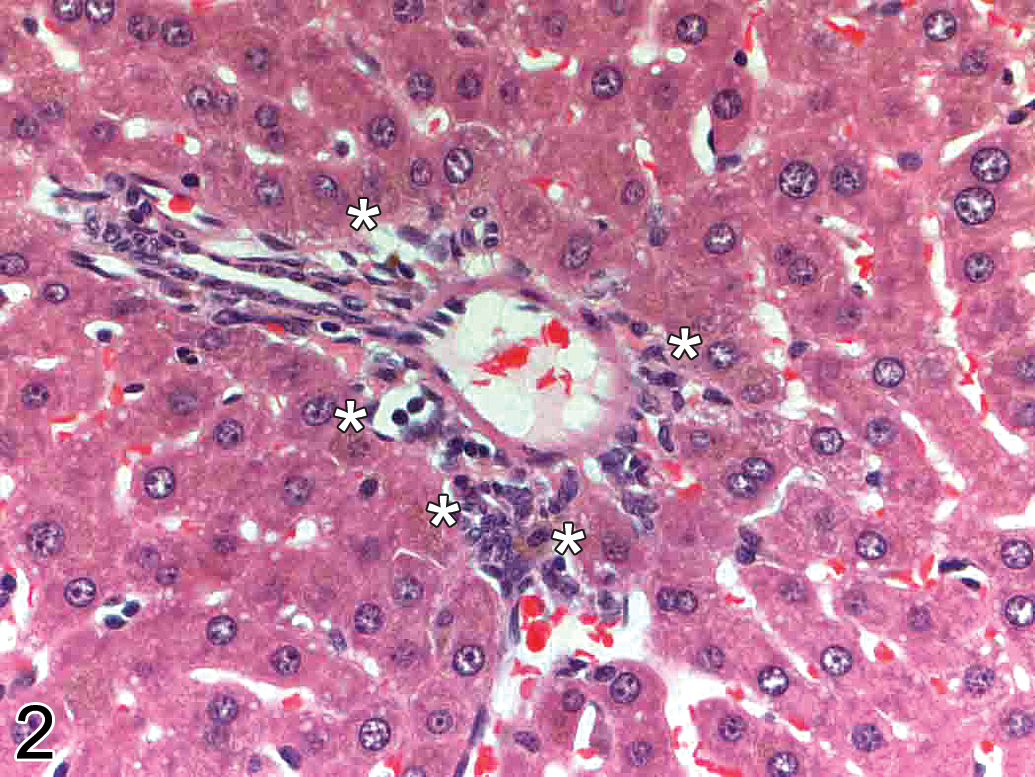
High power H&E-stained liver section (periportal region; original objective magnification 40×) demonstrating minimal granular brown pigment staining in hepatocytes (asterisks) in an animal treated with a GSK3β inhibitor.
Summary data showing pathologist 1 evaluation of the incidence of brown pigment in H&E-stained livers of animals treated with vehicle versus GSK3β inhibitor for 28 days and after a recovery period of 28 days.
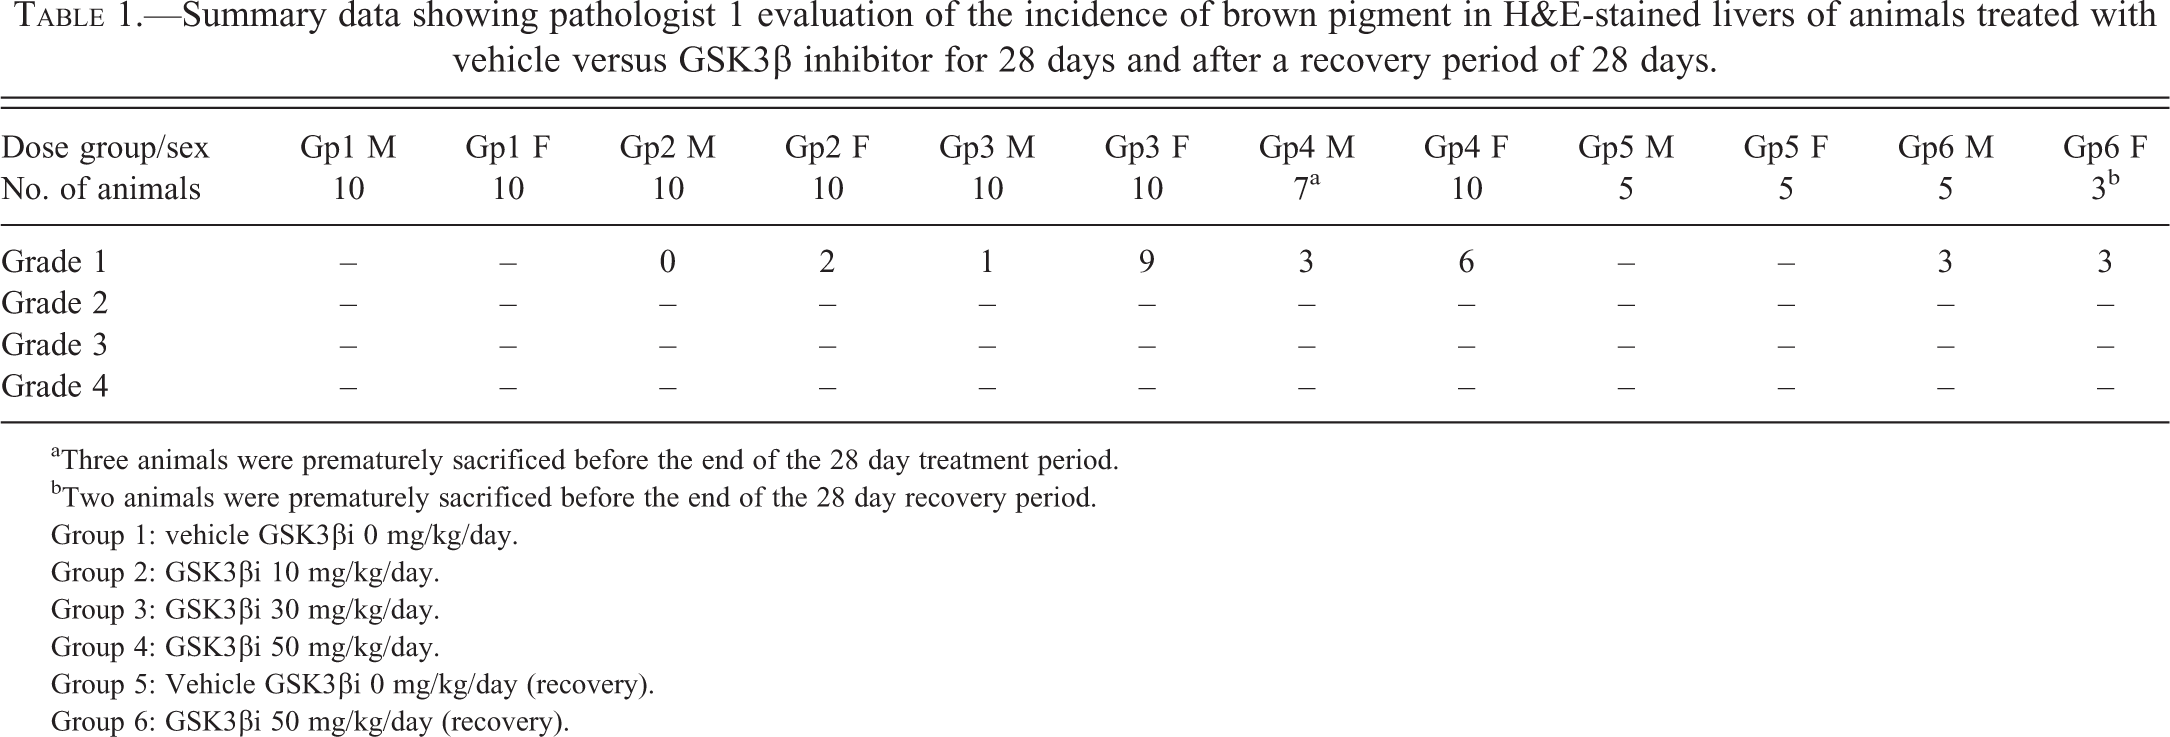
aThree animals were prematurely sacrificed before the end of the 28 day treatment period.
bTwo animals were prematurely sacrificed before the end of the 28 day recovery period.
Group 1: vehicle GSK3βi 0 mg/kg/day.
Group 2: GSK3βi 10 mg/kg/day.
Group 3: GSK3βi 30 mg/kg/day.
Group 4: GSK3βi 50 mg/kg/day.
Group 5: Vehicle GSK3βi 0 mg/kg/day (recovery).
Group 6: GSK3βi 50 mg/kg/day (recovery).
Other changes noted at histological examination included a treatment-related slight increase in hepatocellular glycogenation noted in male animals dosed at 30 and 50 mg/kg/day and a treatment-related increase in the number of mitotic figures visible in both male and female animals dosed at 30 and 50 mg/kg/day. These latter changes had recovered at the end of the treatment free period.
PPB Histopathology Findings
PPB staining (Table 2) demonstrated a minimal to severe treatment and dose-related increase in PPB staining in male and female animals dosed with a GSK3β inhibitor at all dose levels (10–50 mg/kg/day). Almost all the stored iron were present within hepatocytes with minimal or no PPB staining within Kupffer cells. Control animals showed uniformly low levels of PPB staining. Both treated and control female animals were more severely affected than male animals. No recovery was apparent at the end of the treatment-free period. PPB staining confirmed that iron accumulation was predominantly periportal and also showed that in more severely affected animals, iron staining extended into the midzonal and centrilobular areas (i.e., panlobular staining; Figure 1). High power examination revealed that PPB positive granules were distributed in a finely granular, pericanalicular pattern (Figure 3).
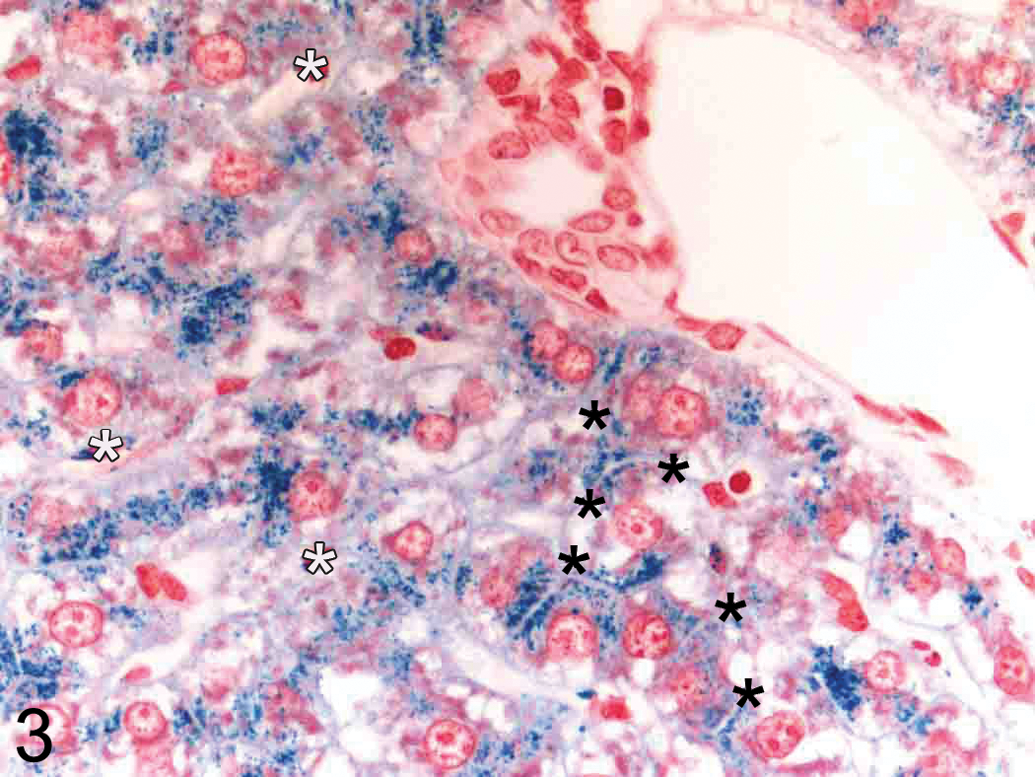
High-power PPB-stained liver section (periportal region; original objective magnification 63×) demonstrating PPB positive granules within hepatocytes arranged around bile canaliculi (black asterisks). Only very minimal PPB staining is present within sinusoidal (Kupffer) cells (white asterisks).
Summary data showing pathologist 1 evaluation of the incidence of Perls’ Prussian Blue Staining in the livers of animals treated with vehicle versus GSK3β inhibitor for 28 days and after a recovery period of 28 days.
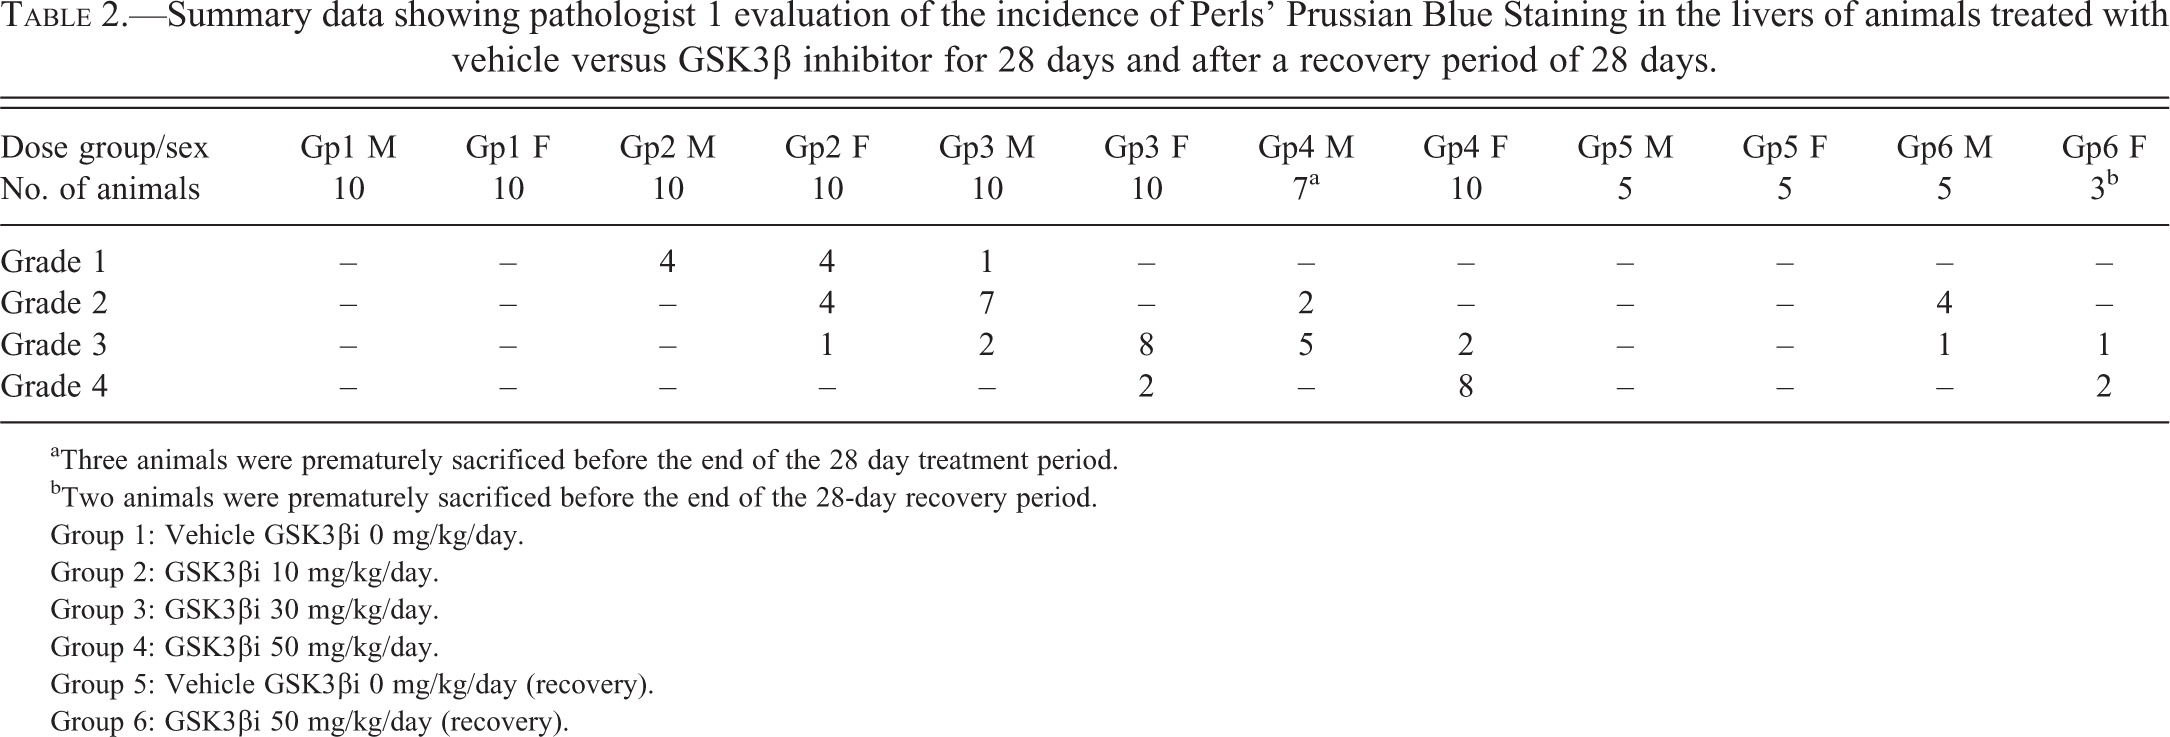
aThree animals were prematurely sacrificed before the end of the 28 day treatment period.
bTwo animals were prematurely sacrificed before the end of the 28-day recovery period.
Group 1: Vehicle GSK3βi 0 mg/kg/day.
Group 2: GSK3βi 10 mg/kg/day.
Group 3: GSK3βi 30 mg/kg/day.
Group 4: GSK3βi 50 mg/kg/day.
Group 5: Vehicle GSK3βi 0 mg/kg/day (recovery).
Group 6: GSK3βi 50 mg/kg/day (recovery).
Image Analysis
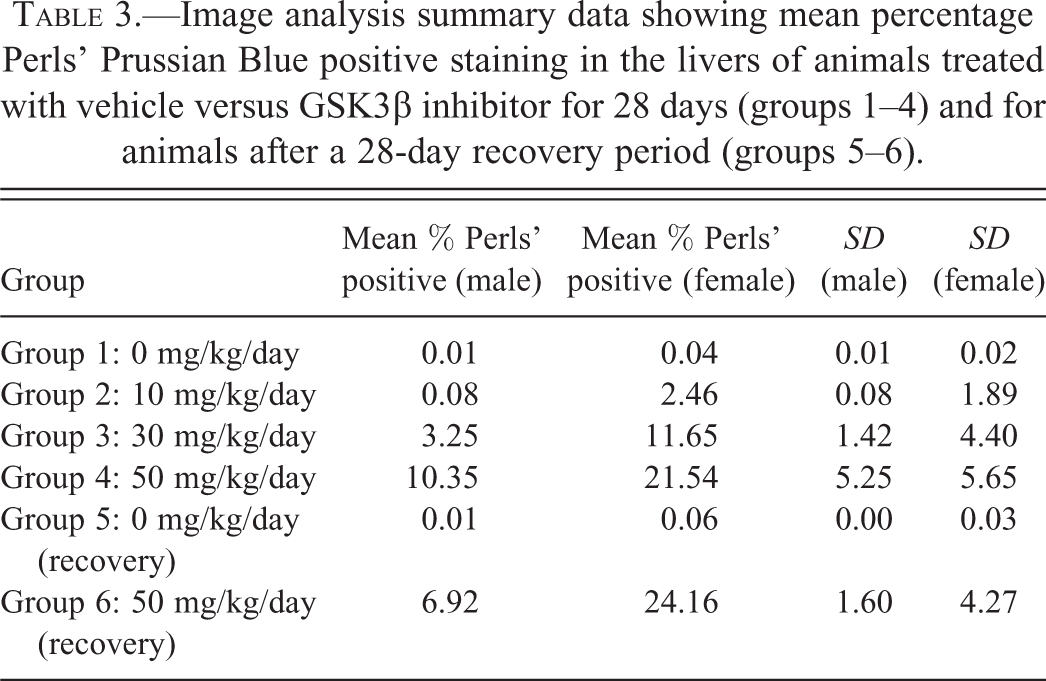
IA data expressed as mean percentage PPB positive scores are presented in Table 3. However, to produce a “best-fit” curve, raw IA data were log-transformed and plotted against semiquantiatively derived pathology scores. This served to reduce the variance present in the IA raw data (a 10-fold range in scores are present in control group 1 and low dose-treated group 2 data) as well as deemphasize insignificant differences between animals within the same treatment group (Figure 4). The results of this analysis (Table 3 and Figure 4) both show that treatment with our GSK3β inhibitor results in (1) a treatment and dose-related increase in PPB staining for all treatment groups, (2) increased staining in female animals compared to male animals, (3) a lack of a no observed effect level (NOEL), (4) a lack of clear reversal after the end of the treatment-free period, and (5) that the level of background PPB staining was uniformly low across all control groups, with control female animals showing more PPB staining than male animals.
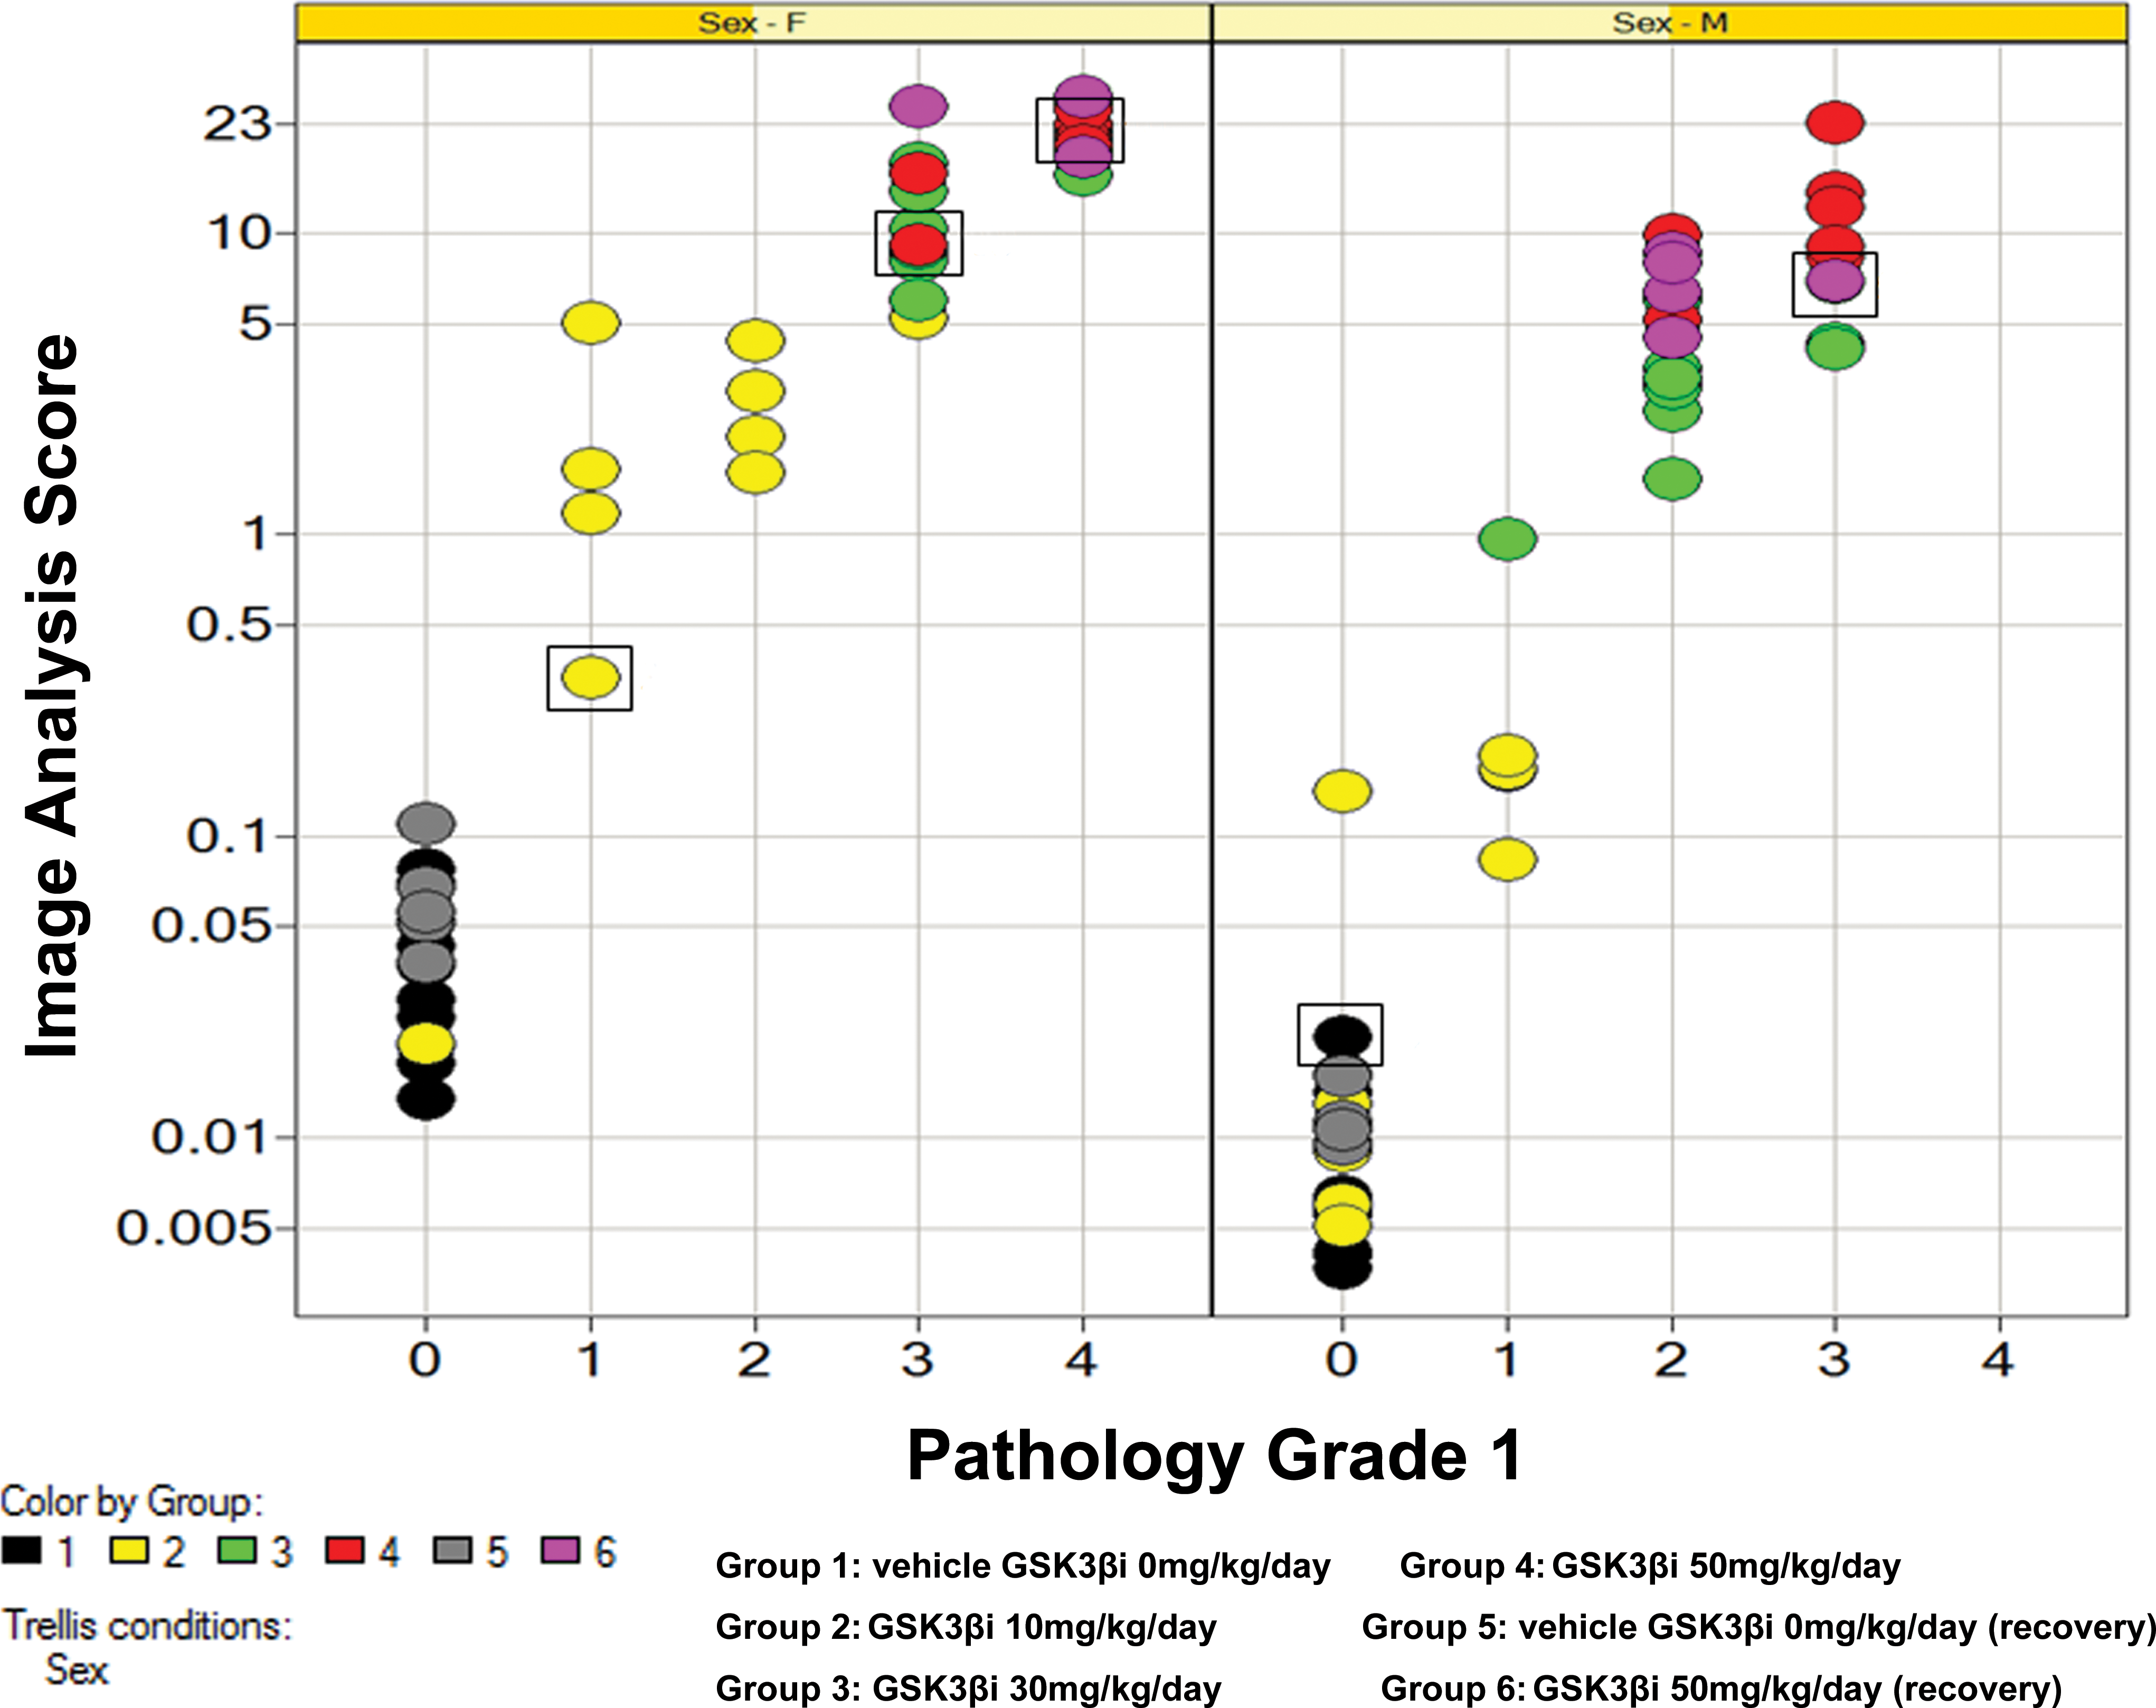
Plot showing relationship between log-transformed image analysis data and pathology score for pathologist 1 separated by sex. Each plot represents a single data point colored by treatment group. Squares indicate the data points/animals used to generate reference images for Figure 1. Early decedent animals 62, 96, and 97 excluded from data set. Plot diagram indicates that computerized image analysis scores track closely with semiquantiative pathology scores (correlation coefficients of 0.84, 0.79, and 0.83 for females, males, and males plus females combined, respectively [Kendall’s Tau test] and 0.95, 0.91, and 0.94, respectively [Spearman’s Rho test]).
Image analysis summary data showing mean percentage Perls’ Prussian Blue positive staining in the livers of animals treated with vehicle versus GSK3β inhibitor for 28 days (groups 1–4) and for animals after a 28-day recovery period (groups 5–6).
Correlation of Image Analysis and Histological Assessment
The results of the pathology analysis showed that there was a strong correlation between computer-generated IA data and semiquantitative visual assessment (Figure 4; correlation coefficients of 0.84, 0.79, and 0.83 for females, males, and males plus females combined, respectively [Kendall’s Tau test] and 0.95, 0.91, and 0.94, respectively [Spearman’s Rho test]).
Comparison with a Second Pathologist
In order to determine how robust these results were, the same analysis was performed with a second independent pathologist. The results of this analysis (Figure 5) showed that a second pathologist had a tendency to consistently assign a lower grade to the PPB-stained sections compared to the first pathologist. However, despite these differences in grading between pathologists, the second pathologist data set still showed a remarkably good correlation with the IA data (correlation coefficients of 0.85, 0.83, and 0.85 [Kendall’s Tau test] and 0.95, 0.94, and 0.95 [Spearman’s Rho test] for pathology grade vs. log response for females, males, and all, respectively). Therefore, despite differences in grading between pathologists, both pathologists generated data that correlated well with the IA data and arrived at the same overall conclusions that is, that there was no NOEL or reversal for this study.
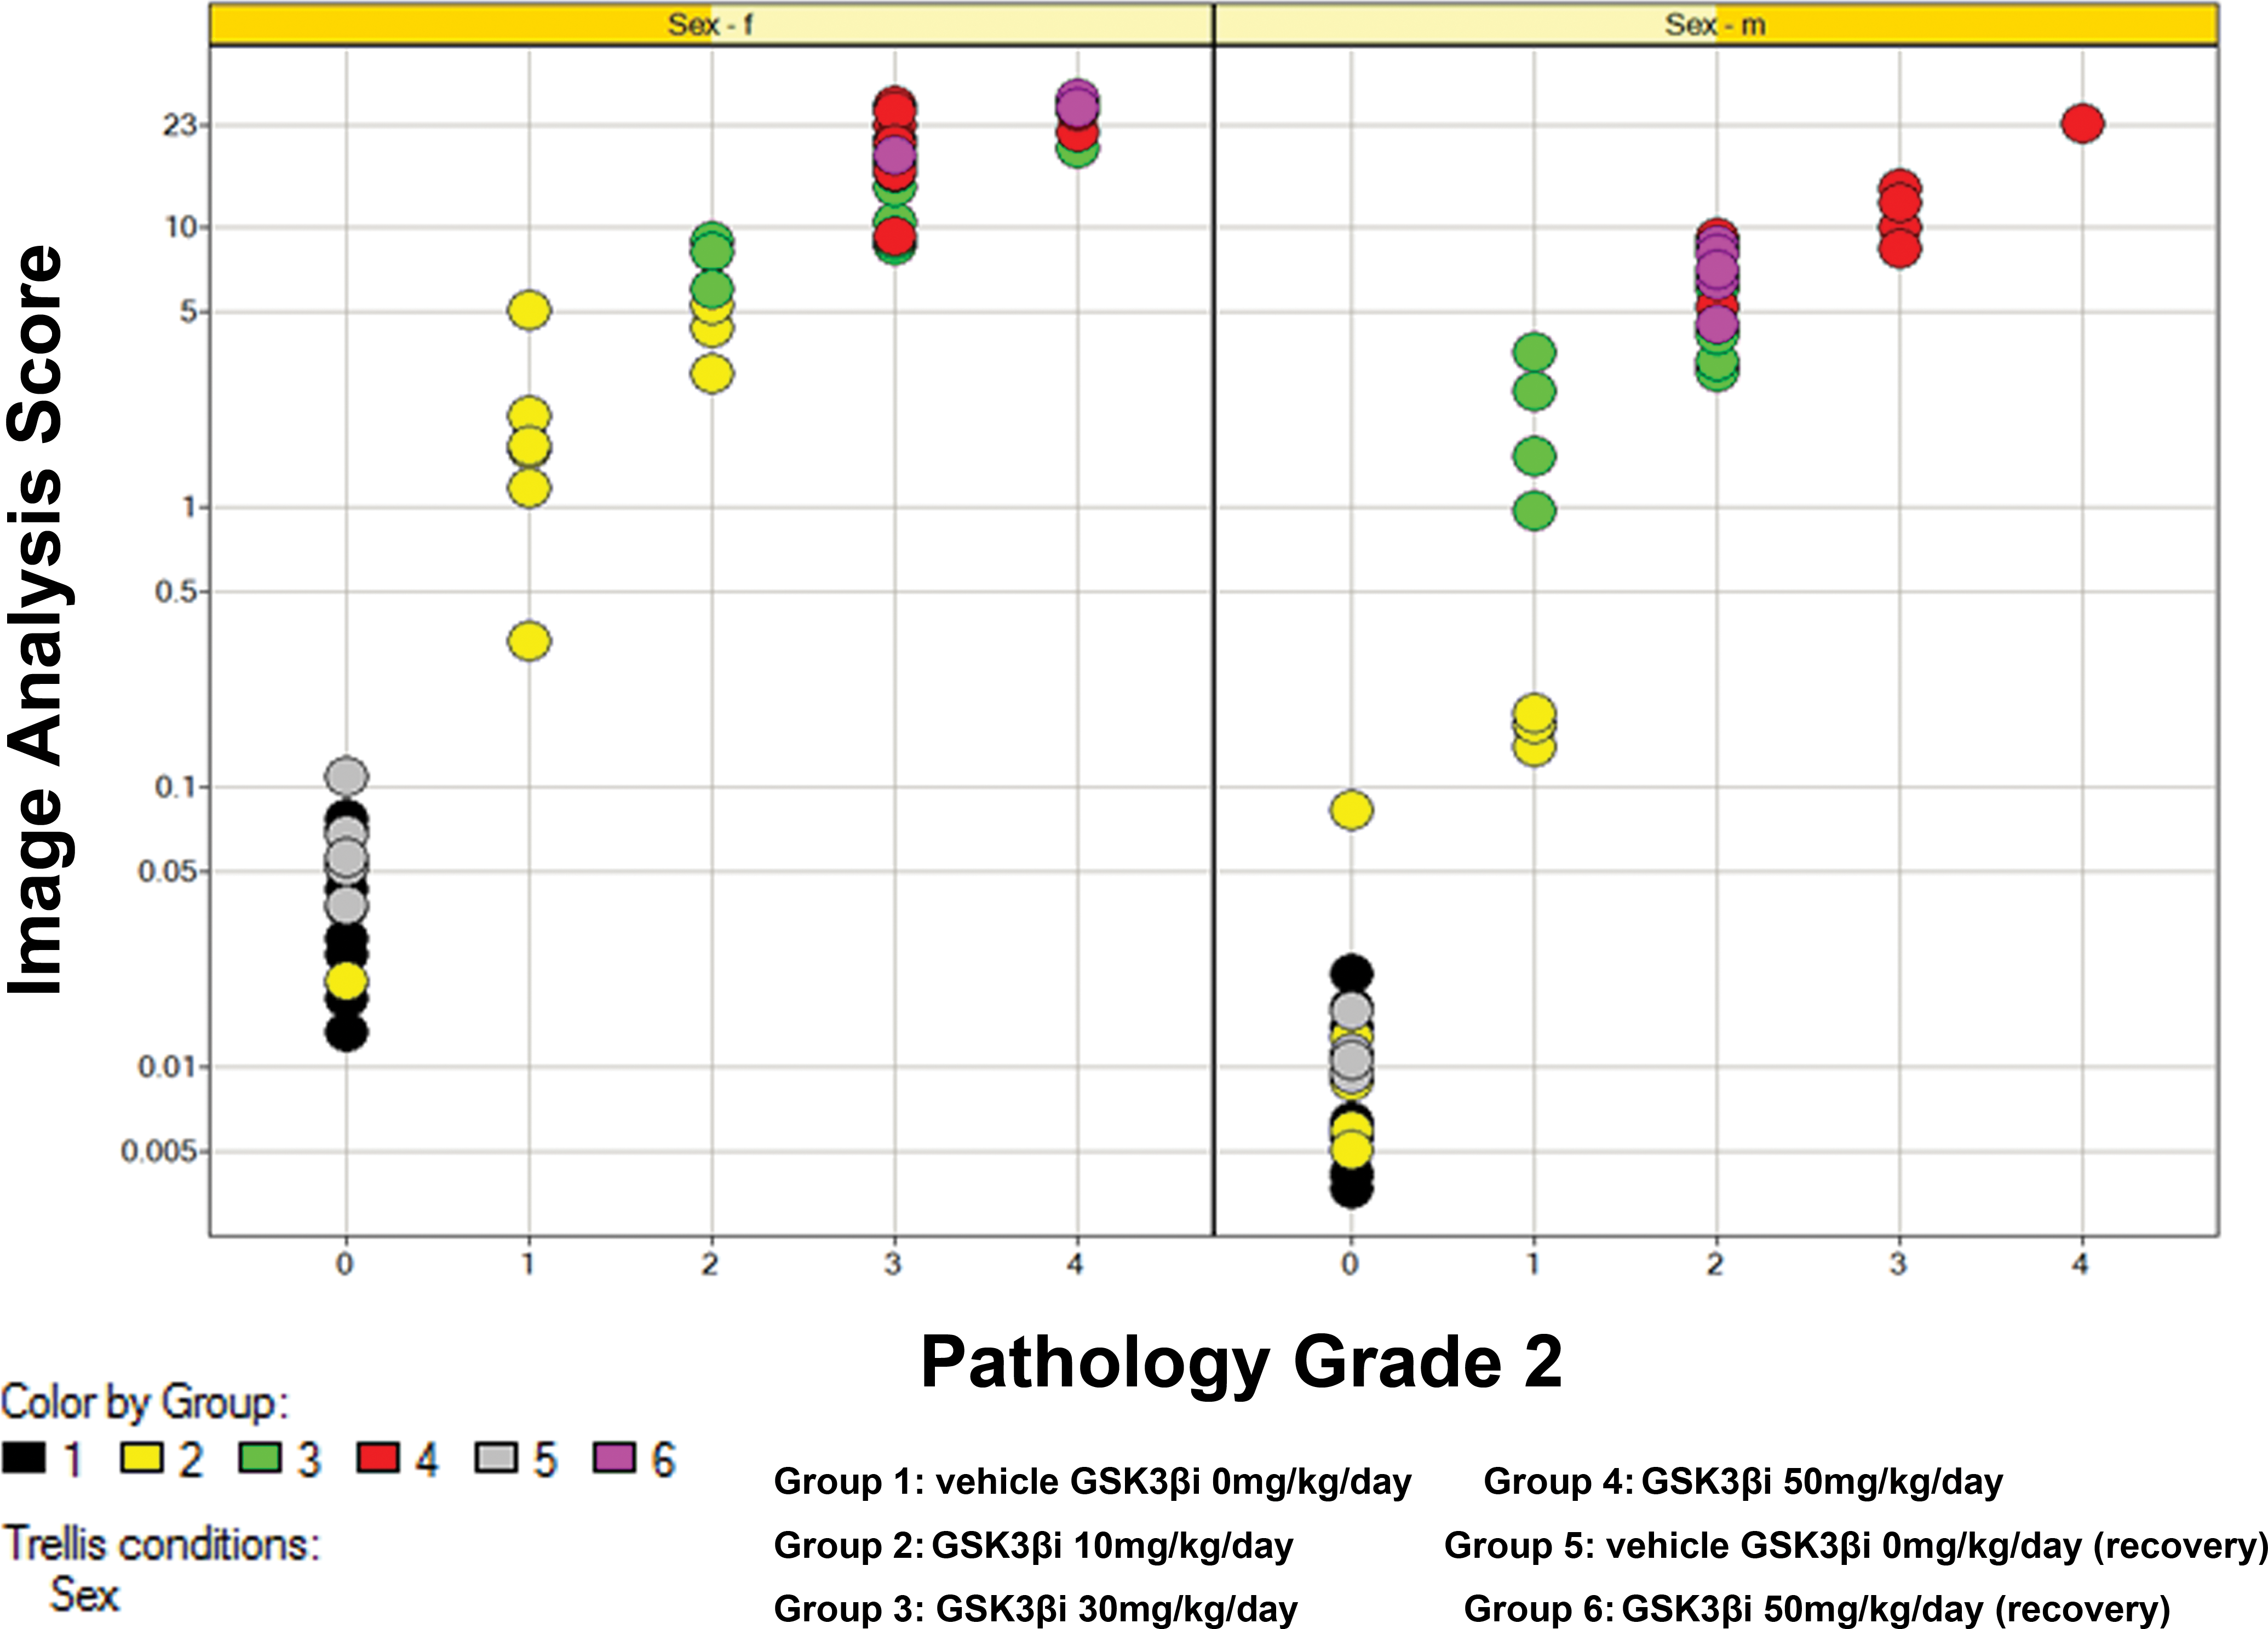
Plot showing relationship between log-transformed image analysis data and pathology score for pathologist 2 separated by sex. Despite a tendency to assign lower scores, pathologist 2 produces remarkably consistent data to pathologist 1 with good correlation to image analysis.
Discussion
The use of immunohistochemistry to image biomarkers, to determine mechanisms of action of new chemical entities, and to understand toxicity is in widespread use within the drug discovery industry. It is also common practice to score these slides by automated IA, usually with the input of a pathologist. Here, we clearly demonstrate that the same principles of automated IA can be used to score automated histochemically stained sections provided that precautions are taken to minimize staining inconsistencies, and in consultation with a pathologist, ensure robust thresholds are used for IA. We also show that despite consistent variations between pathologists in their scoring, the semiquantitative data that are generated show a remarkable degree of correlation to computerized IA. This process illustrates the overall importance of ensuring a standardized validated workflow is established and adhered to in order to provide robust numerical and statistical data in support of histochemical-based pathology investigations.
In this study, a dose-related increase in liver weight was noted at necropsy in male and female animals despite a reduction in relative body weight in male animals. This is likely to be a result of the combined effects of proliferation, glycogen accumulation, and to a lesser extent, iron loading which were noted as treatment related changes in this study.
The pattern of iron accumulation noted in this study was very similar to that observed in primary iron overload (genetic hemochromatosis) seen in humans (Deugnier and Turlin 2011) characterized by a periportal distribution of intracytoplasmic inclusions around bile canaliculi. Higher dose levels demonstrated increased iron staining with spread toward the centrilobular region but with only minimal staining within sinusoidal cells (principally Kupffer cells) similar to the picture seen in more advanced cases of human hemochromatosis (Deugnier and Turlin 2011) and iron loading models in rodents (Chua-anusorn et al. 1999).
Several scoring systems are in clinical use by the medical profession (Scheuer, Williams, and Muir 1962; Brissot et al. 1981; Deugnier et al. 1993; Brunt et al. 2000). The methods of Deugnier et al. (1993) and Brunt et al. (2000) appear to be the most widely cited. Both are complex and require the integration of several scoring steps in order to capture and quantitate the pattern of staining in several cell types within the liver. In routine toxicologic pathology, however, it is often not practical to “split” scoring into multiple steps and so it therefore becomes important to understand what information, if any, will be lost by a reductive (lumping) process. In this study, it was clear from the pattern of PPB staining that the overwhelming majority of iron accumulation was present within hepatocyte cytoplasm. It was therefore reasonable to use a scoring system that did not split scoring between cell types and thus increase the speed and practicality of reading (essentially equivalent to Scheuer, Williams, and Muir 1962). In more complex systems, where pigment or staining is present in multiple cell types or within multiple compartments within the same cell type and which vary independently of each other, a separate assessment must be made by the pathologist to determine a scoring system that best fits the histological pattern of staining.
In order to perform robust IA, it is imperative that as many sources of variation as possible are minimized since the counting algorithm employed is limited in its ability to exclude artifacts or distinguish between nonspecific and specific staining. To this end, steps were taken to standardize section/staining variation by ensuring that (1) all slides were cut by the same microtomist to produce slides of a standard thickness, (2) all PPB staining was performed on the same day, and (3) an automated staining machine was used with exact staining timings. To this effect, automated staining machines are ideally suited to this task. Our results indicate that once these precautions have been taken, maximum percentage variability in OD (effectively average PPB staining intensity) can be minimized to very low levels that have little or no significant effect on the overall data set.
In addition to decreasing sources of staining variation, it is important to validate the IA algorithm to define the upper and lower thresholds of detection as well as ensure consistent scoring between batches of slides. To establish the detection thresholds, it is important for the pathologist and IA expert to define a priori what staining is considered to be background or artifact and exclude this from the analysis.
In this study, the initial PPB scoring was performed routinely as part of a standard safety assessment study to help determine recovery, dose responsiveness, and a NOEL. A standard set of images was produced to help define the scoring system for a second pathologist in their semiquantitative assessment. It is interesting to note that while both pathologists generated remarkably accurate data compared to IA, there were consistent scoring differences between the two pathologists. These differences in scoring may sometimes be a cause for concern when semiquantitative assessments are made (Farris and Colvin 2012). However, it appears that if differences are consistent and the analysis is performed carefully across groups, then the overall outcome is unaffected indicating that semiquantitative scoring is a robust and accurate way to score histochemically and by corollary, immunohistochemically stained sections.
Our results indicate that in a simplified system in which there is minimal or no background staining, there is an excellent correlation between semiquantitative assessment and automated IA. Both of these methods have advantages and disadvantages. In a study of this size in which 100 slides were analyzed (the typical dimensions of a regulatory 1-month toxicity study) semiquantitative histological scoring is rapid and remarkably accurate compared to IA. Data can be generated in a few hours compared to a few days by automated means. However, the process is tedious and probably not well suited to routine analyses involving large numbers of slides. For studies involving several hundred slides, IA using well-validated staining and IA protocols may prove to be the more practicable approach. IA also has the additional advantage of generating numerical data that can be statistically interrogated. However, caution must be reserved in applying statistical significance to data sets that are based on loosely validated protocols, or where significant background staining makes threshold selection of positively stained areas problematic. One must also consider that in order to produce best results, foresight is required to ensure that a consistent method of staining is achieved together with careful collaboration between the IA expert and pathologist in order to successfully select regions of interest and exclude areas of artifact. Therefore, for complex histological tasks where some judgment is required to determine areas of artifact or background staining, or where complex regions of interest need to be interactively selected by hand, IA may be less suitable.
Footnotes
The author(s) declared no potential conflicts of interest with respect to the research, authorship, and/or publication of this article.
The author(s) received no financial support for the research, authorship, and/or publication of this article.
Abbreviations
Supplemental Material
Supplementary Table S1. Supplementary table showing maximum percentage deviation for PPB-stained positive control spleen samples derived from average optical density and average positive intensity measurements.
Acknowledgments
The authors would like to acknowledge John Foster and Johannes Harleman for help in the preparation of this article, as well as Jayne Harris who was the original study pathologist and Tom Holland.
References
Supplementary Material
Please find the following supplemental material available below.
For Open Access articles published under a Creative Commons License, all supplemental material carries the same license as the article it is associated with.
For non-Open Access articles published, all supplemental material carries a non-exclusive license, and permission requests for re-use of supplemental material or any part of supplemental material shall be sent directly to the copyright owner as specified in the copyright notice associated with the article.