
Abstract
Arsenic is carcinogenic in human beings, and environmental exposure to arsenic is a public health issue that affects large populations worldwide. Thus, studies are needed to determine the mode of action of arsenic and prevent harmful effects arising from arsenic intake. The present study assessed the influence of sodium arsenite (As3+) on potentially carcinogenic processes that are either pre-existing or concomitant with chronic intake of water containing As3+. Experiments using
Introduction
Inorganic arsenic is a common component of the Earth's crust that is typically found on the surface of rocks or in complex with metals. Given the wide environmental distribution of inorganic arsenic, exposure of living organisms is inevitable but does vary according to local geochemical characteristics as well as the level of anthropogenic activity. The transport and distribution of arsenic in the environment is complex due to the chemical forms in which it occurs, with a continuous cycling of different forms of arsenic through water, soil, and air (Chilvers and Peterson 1987).
In certain geographical areas with arsenic-rich layers, high levels of arsenic are found in water (U.S. Environment Protection Agency [EPA] 1988; Pfeifer et al. 2002). Natural oxidation leaching of arsenic is dependent on the mineral composition of the environment, acidity of the medium, and availability of O2 (Méndez and Armienta 2003; Zhu et al. 2003).
Several studies have documented the potential for bioaccumulation of arsenic in tissues in animals, particularly fish and other seafood (Prieto-Garcia et al. 2006), as well as in vegetables from sites that are naturally enriched with arsenic (Prieto-Garcia et al. 2005, 2007; Zhang et al. 2009).
Humans are primarily exposed to inorganic trivalent (arsenites, As3+) and pentavalent arsenicals (arsenates, As5+), with the major route of entry being drinking water intake.
The main health problems associated with excess arsenic intake are hydroarsenicism or arsenicosis as has been recorded in the southeast coast of Taiwan, China (Xinjiang and Inner Mongolia), India (West Bengal), southern Thailand, Vietnam, Japan, northern Chile, northwestern and central Argentina, Bolivia, Peru, northern Mexico, Canada, and the United States, as well as on the border between Hungary and Romania, Germany, Greece, Spain, Ghana, Tanzania, and Zimbabwe (Tseng et al. 1968; Cebrian et al. 1983; Hopenhayn-Rich, Biggs, and Smith 1998; Smith et al. 1998; NRC 2000; Guha Mazumder 2003; Ferreccio and Sancha 2006; Lindberg et al. 2006).
The correlation between prolonged ingestion of arsenic and cutaneous and visceral damage has been documented in several human and animal studies (National Academy of Sciences 1977; Dutkiewicz 1977; Charbonneau et al. 1979; Fowler and Woods 1979; Tam et al. 1979).
Chronic arsenic exposure in humans is manifested by the evolution of clinical signs in the skin, such as hyperhidrosis, hyperkeratosis, and arsenical melanodermia, with the degree of severity depending on the time of exposure (Chen et al. 1997). Peripheral vascular disturbances, dark abrasions on the feet (black foot disease), (Tseng et al. 1968; Tseng 1977; Simeonova and Luster 2004), peripheral nervous system effects (Yamashita et al. 1972; Dakeishi, Murata, and Grandjean 2006), diffuse pulmonary fibrosis, and bronchopulmonary lesions (Rosenberg 1974; Borgoño et al. 1977; von Ehrenstein et al. 2005) can also be diagnosed.
An increased incidence of skin carcinoma is widely documented in areas where the water is naturally enriched with arsenic (Tseng et al. 1968; Besuschio, Pérez, Desanzo, and Croci 1980; Astolfi et al. 1981; Rossman, Uddin, and Burns 2004), with the most common form being squamous cell carcinoma (Yu, Liao, and Chai 2006; Martínez et al. 2011).
Most medicinal uses of arsenic compounds were based on their toxic nature. At present, arsenic is used for the treatment of trypanosomiasis (sleeping sickness) (Harrison, Harris, and Bales 1997; Médecins Sans Frontières 2006), and recently emerged as an effective treatment for acute promyelocytic leukemia (Zhang et al. 2010) as well as other types of human neoplasia (Miller et al. 2002; Han et al. 2004; Hu et al. 2005; Shao et al. 2005; Cheng, Chang, and Tsou 2006; Luo et al. 2006; Ai, Lu, and Qin 2006; Cheung, Chu, and Kwong 2007).
Sodium arsenite (As3+) is the most extensively studied arsenic compound. Various studies in cell culture and in animals confirmed that arsenic causes oxidative stress through the generation of reactive oxygen species (Flora 1999; Wu et al. 2001; Pi et al. 2002, 2003) and is also associated both with chromosomal abnormalities arising from oxidative DNA damage (Matsui et al. 1999, Yamanaka and Okada 1994) and carcinogenesis (Lee et al. 1988; Mahata et al. 2003).
Experimental studies to demonstrate the carcinogenicity of arsenic in animals are hampered because arsenic has a long latency period for the development of neoplasia that usually exceeds the average animal’s life span. Early in vivo work on rats, mice, and dogs was performed with As3+ supplementation of the diet or water supply in the range of 2 to 250 mg As3+/L (Byron et al. 1967; Kanisawa and Schroeder 1967, 1969; Schrauzer and Ishmael 1974; Schrauzer et al. 1978; Shirachi et al. 1983; Blakeley 1987).
Models for chemical-induced carcinogenesis in skin have been valuable in formulating the basic principles involved in tumor: initiation, promotion, and progression (Yuspa and Morgan 1981; Nesnow, Triplett, and Slaga 1983; Yuspa 1998). These events can be replicated experimentally, such that tumor formation can be traced from initiation to malignant tumor progression (Hennings et al. 1985; Aldaz et al. 1987; Yamasaki and Mironov 2000). Tumors do not develop immediately following exposure to a carcinogen, as is the case for the mutated ras oncogene, which remains dormant in epidermal cells and requires additional events for a tumor to progress to malignancy (Balmain et al. 1984; Kumar, Sukumar, and Barbacid 1990). Moreover, protein kinase C (PKC) has been implicated in the early stages of development and/or progression of carcinogenesis (Marks and Gschwendt 1995; Gopalakrishna and Jaken 2000). Thus, the process of carcinogenesis can involve chemically induced tumor development that is modulated by external agents.
The aim of this work was to characterize and analyze the development of tumors formed during a 2-stage carcinogenesis process in the skin of SENsitivity to CARcinogenesis (
Materials and Methods
Chemicals
Sodium arsenite (As3+), 7,12-dimethylbenz(a)anthracene (DMBA), and 12-O-tetradecanoylphorbol-13-acetate (TPA) were purchased from Sigma Chemical Co. (St. Louis, MO).
Animals
Female
Chemical Tumorigenesis in a 2-stage Skin Carcinogenesis Model
Mouse skin tumors were induced by an initiation–promotion regimen (Nesnow, Triplett, and Slaga 1983; Hennings et al. 1985). The dorsal area of the mice was shaved carefully to avoid introducing cuts and bruises. Two days later, these animals were initiated with a single topical application of DMBA (25.65 µg/ml acetone; 200 µl/mouse) made on the dorsal epilated area. The promotion stage started 10 days later. The animals received biweekly topical applications of TPA (10 µg/ml acetone; 200 µl/application) on the shaved dorsal area over the course of 9 months.
Experimental Designs in Vivo
Four groups of 20 As3+0 (As0): control group, 0 mg As3+/L As3+2 (As2): 2 mg As3+/L As3+20 (As20): 20 mg As3+/L As3+200 (As200): 200 mg As3+/L
Four groups of 20 mice each were used. Two groups were given 20 mg As3+/L in the drinking water (As20) and 2 groups received water without As3+ (W
Four months later, the skin carcinogenesis protocol was initiated and the mice continued to receive (or not) the same type of water as was previously assigned.
The treatment groups were as follows: Water–Water (W-W): animals received W Water–As3+ (W-As20): received As3+ only during the carcinogenesis protocol (mixed 1); As3+–Water (As20-W): received As3+ only before initiation of the carcinogenesis protocol (mixed 2); As3+–As3+ (As20-As20): received As3+ before and during the carcinogenesis protocol.
Drinking water was prepared every 48 hr from As3+ stock solutions (2 g/L, 4°C).
The body weight, number of tumors, and morphometric tumor changes were recorded weekly for each mouse in both experiments. Tumor multiplicity in surviving animals was also calculated.
Histology
After the animals were euthanized, the skin tumors were excised and immediately fixed in 10% buffered formalin. As tumor geometry is compatible with ellipsoids, the minor (a), major (b), and vertical (c) axes of each tumor were measured to estimate tumor volume (π/6 × a × b × c).
Paraffin sections were routinely processed for H&S. Each tumor was diagnosed as papilloma or carcinoma according to previous descriptions (Klein-Szanto 1989).
The conversion index was calculated as the ratio between the numbers of carcinomas/papillomas for each mouse.
Statistical Analysis
Analysis of variance (ANOVA) and Tukey's test (p < .05) were used for the analysis of average weight and average tumor volume data.
The log rank Mantel–Cox test between controls and each experimental condition was used to analyze the probability of survival.
The Gompertz model adjustment was used to analyze the number of tumors per animal. The increasing number of tumors for each animal as a function of time is well fitted by this model. The mathematical function is
Estimation of the parameters was obtained for each animal. The least-squares method (Nelder and Mead 1965) and Levenberg Marquardt iteration algorithm (Press, Flannery, and Vetterling 1986) were used for this estimation.
The alpha (α) parameter or load capacity and gamma (γ) parameter or the rate of tumor number increase were compared for all experimental conditions. These parameters define 2 different portions of the curve, that is, the exponential and plateau portions.
Calculations and statistical analyses were performed using Infostat v. 2010 (University of Córdoba, Argentina). Data are presented as mean ± SE. The means of all data were compared by ANOVA with Tukey’s test. p < .05 was considered statistically significant.
Results
A series of experiments was designed to evaluate the effect of As3+ on the process of experimental carcinogenesis. The data concerning tumor development were used to elucidate the potential role of As3+ in the process of carcinogenesis.
End points related to clinical status, such as body weight and water consumption, were also examined. The number and volume of tumors that developed per animal during the carcinogenesis process were monitored weekly (Figure 1A).
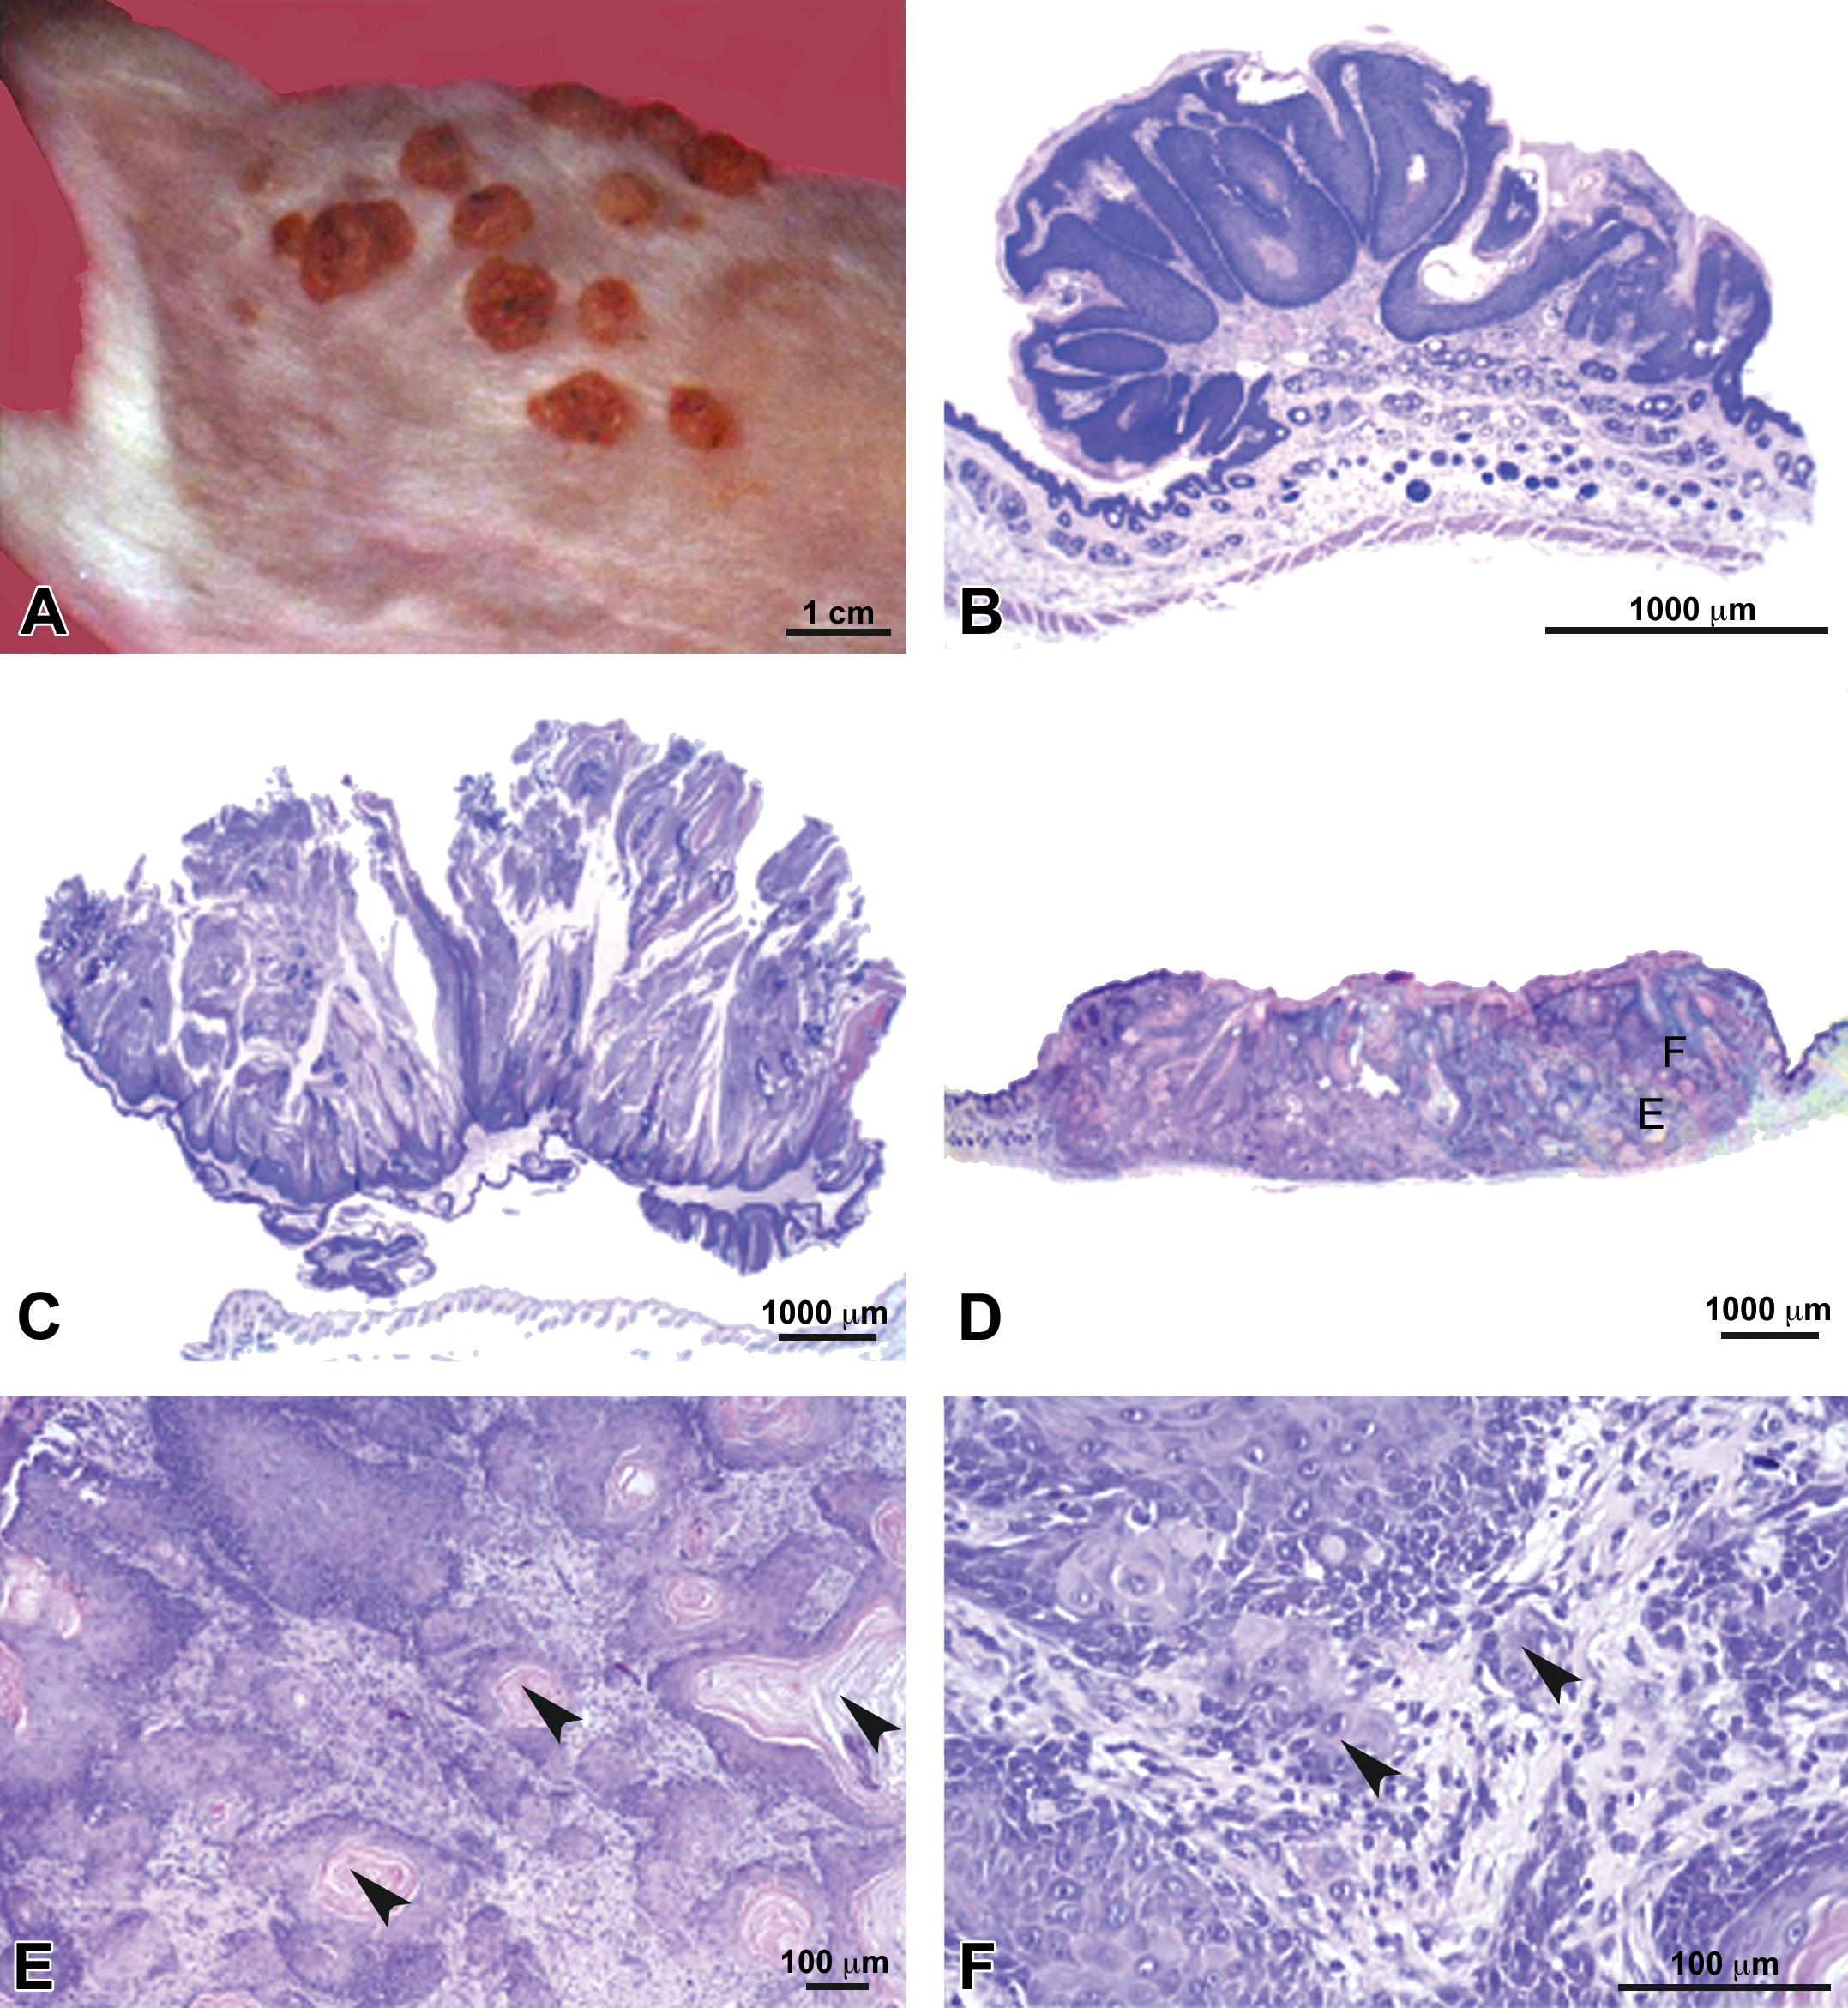
Photographs of tumors. (A) Dorsal area of mice 16 weeks after the initiation of the carcinogenesis protocol showing tumors growing in the treated area. (B–F) Microphotographs at the end of the experimental period; (B) and (C) Typical papillomas; (D) Moderately differentiated squamous cell carcinoma showing: Inset E: horny pearls (arrowheads), Inset F: infiltrative growth (arrowheads).
Two different experimental designs were assayed as described in the Materials and Methods section. At the end of the experimental protocol, the animals were euthanized and tissue samples were processed for histopathological evaluation (Figure 1B–F).
Experimental Design 1
As200 animals showed significantly lower body weight than the As2 and As20 animals, but no experimental condition produced significant differences compared to control animals (Figure 2).
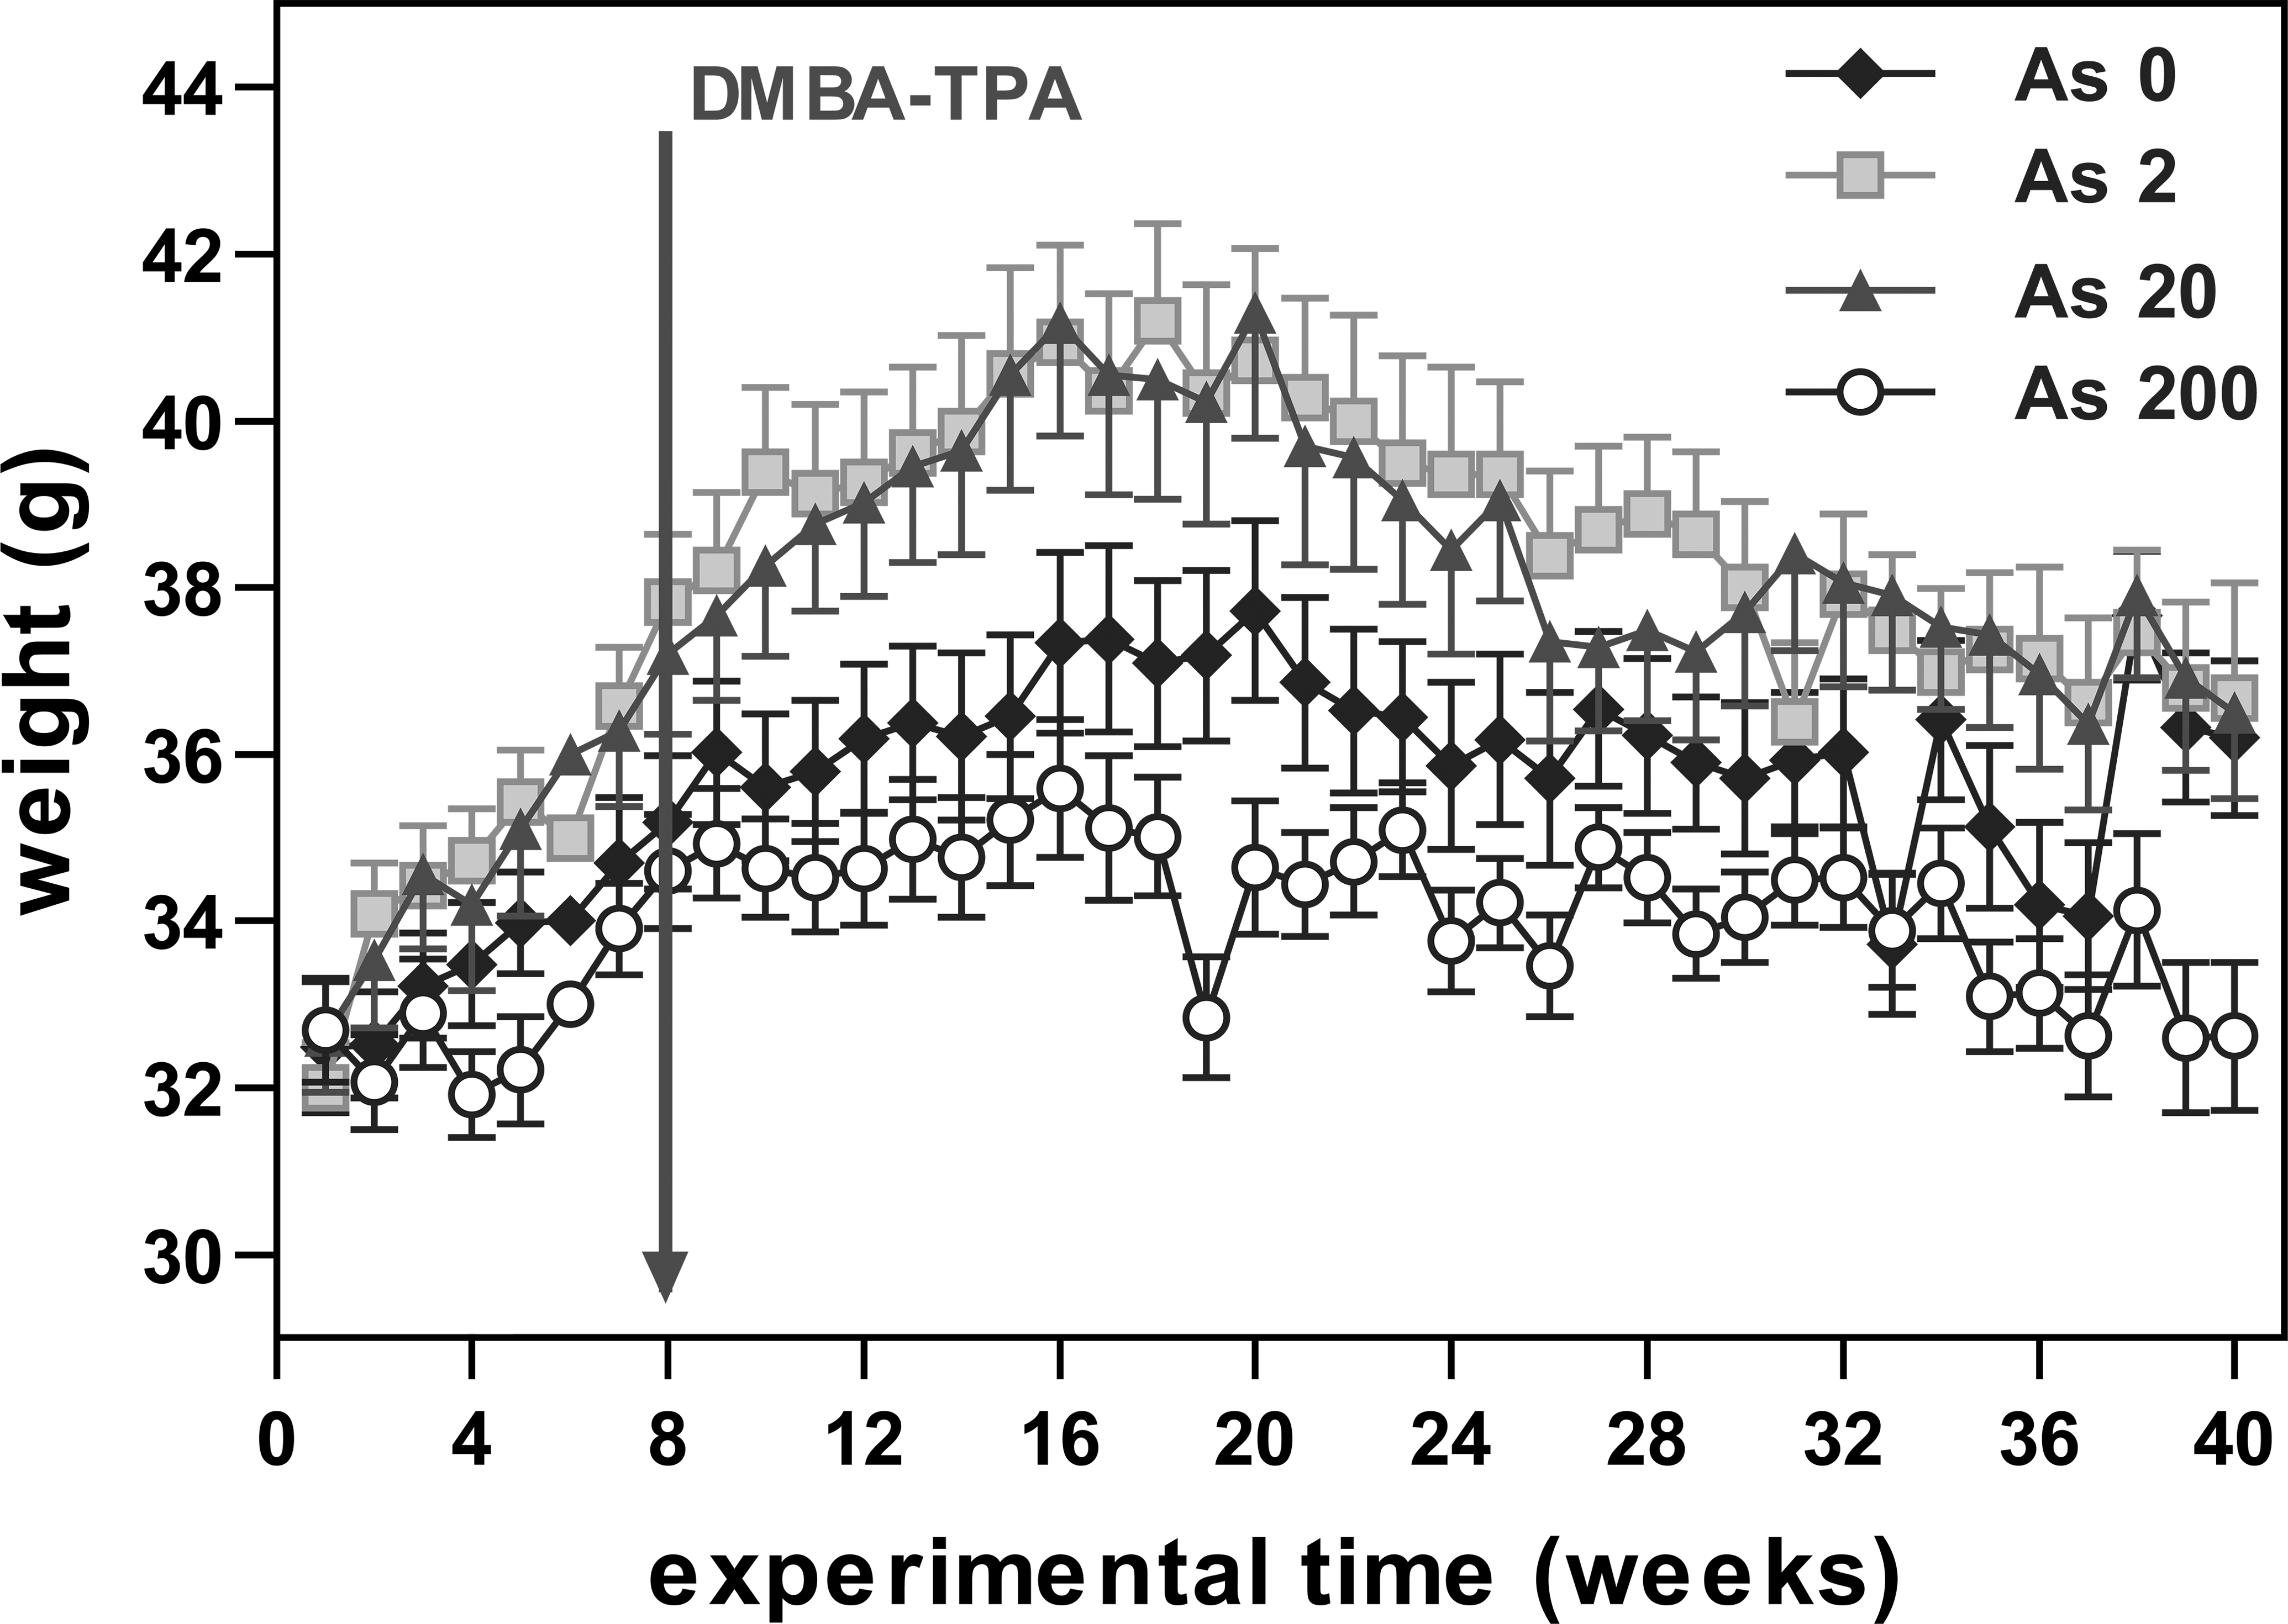
Average weight of mice (experiment 1). Each point represents the average weight of the mice (g ± SE) during each week of the experimental period. The arrow indicates the initiation of the carcinogenesis protocol.
Water intake varied among the animals treated with different experimental conditions from the beginning of the experiment. The intake of As2 and As20 animals was within 20 to 25% of the control animals, while As200 animals consumed 50 to 70% less water than the control group (Figure 3).
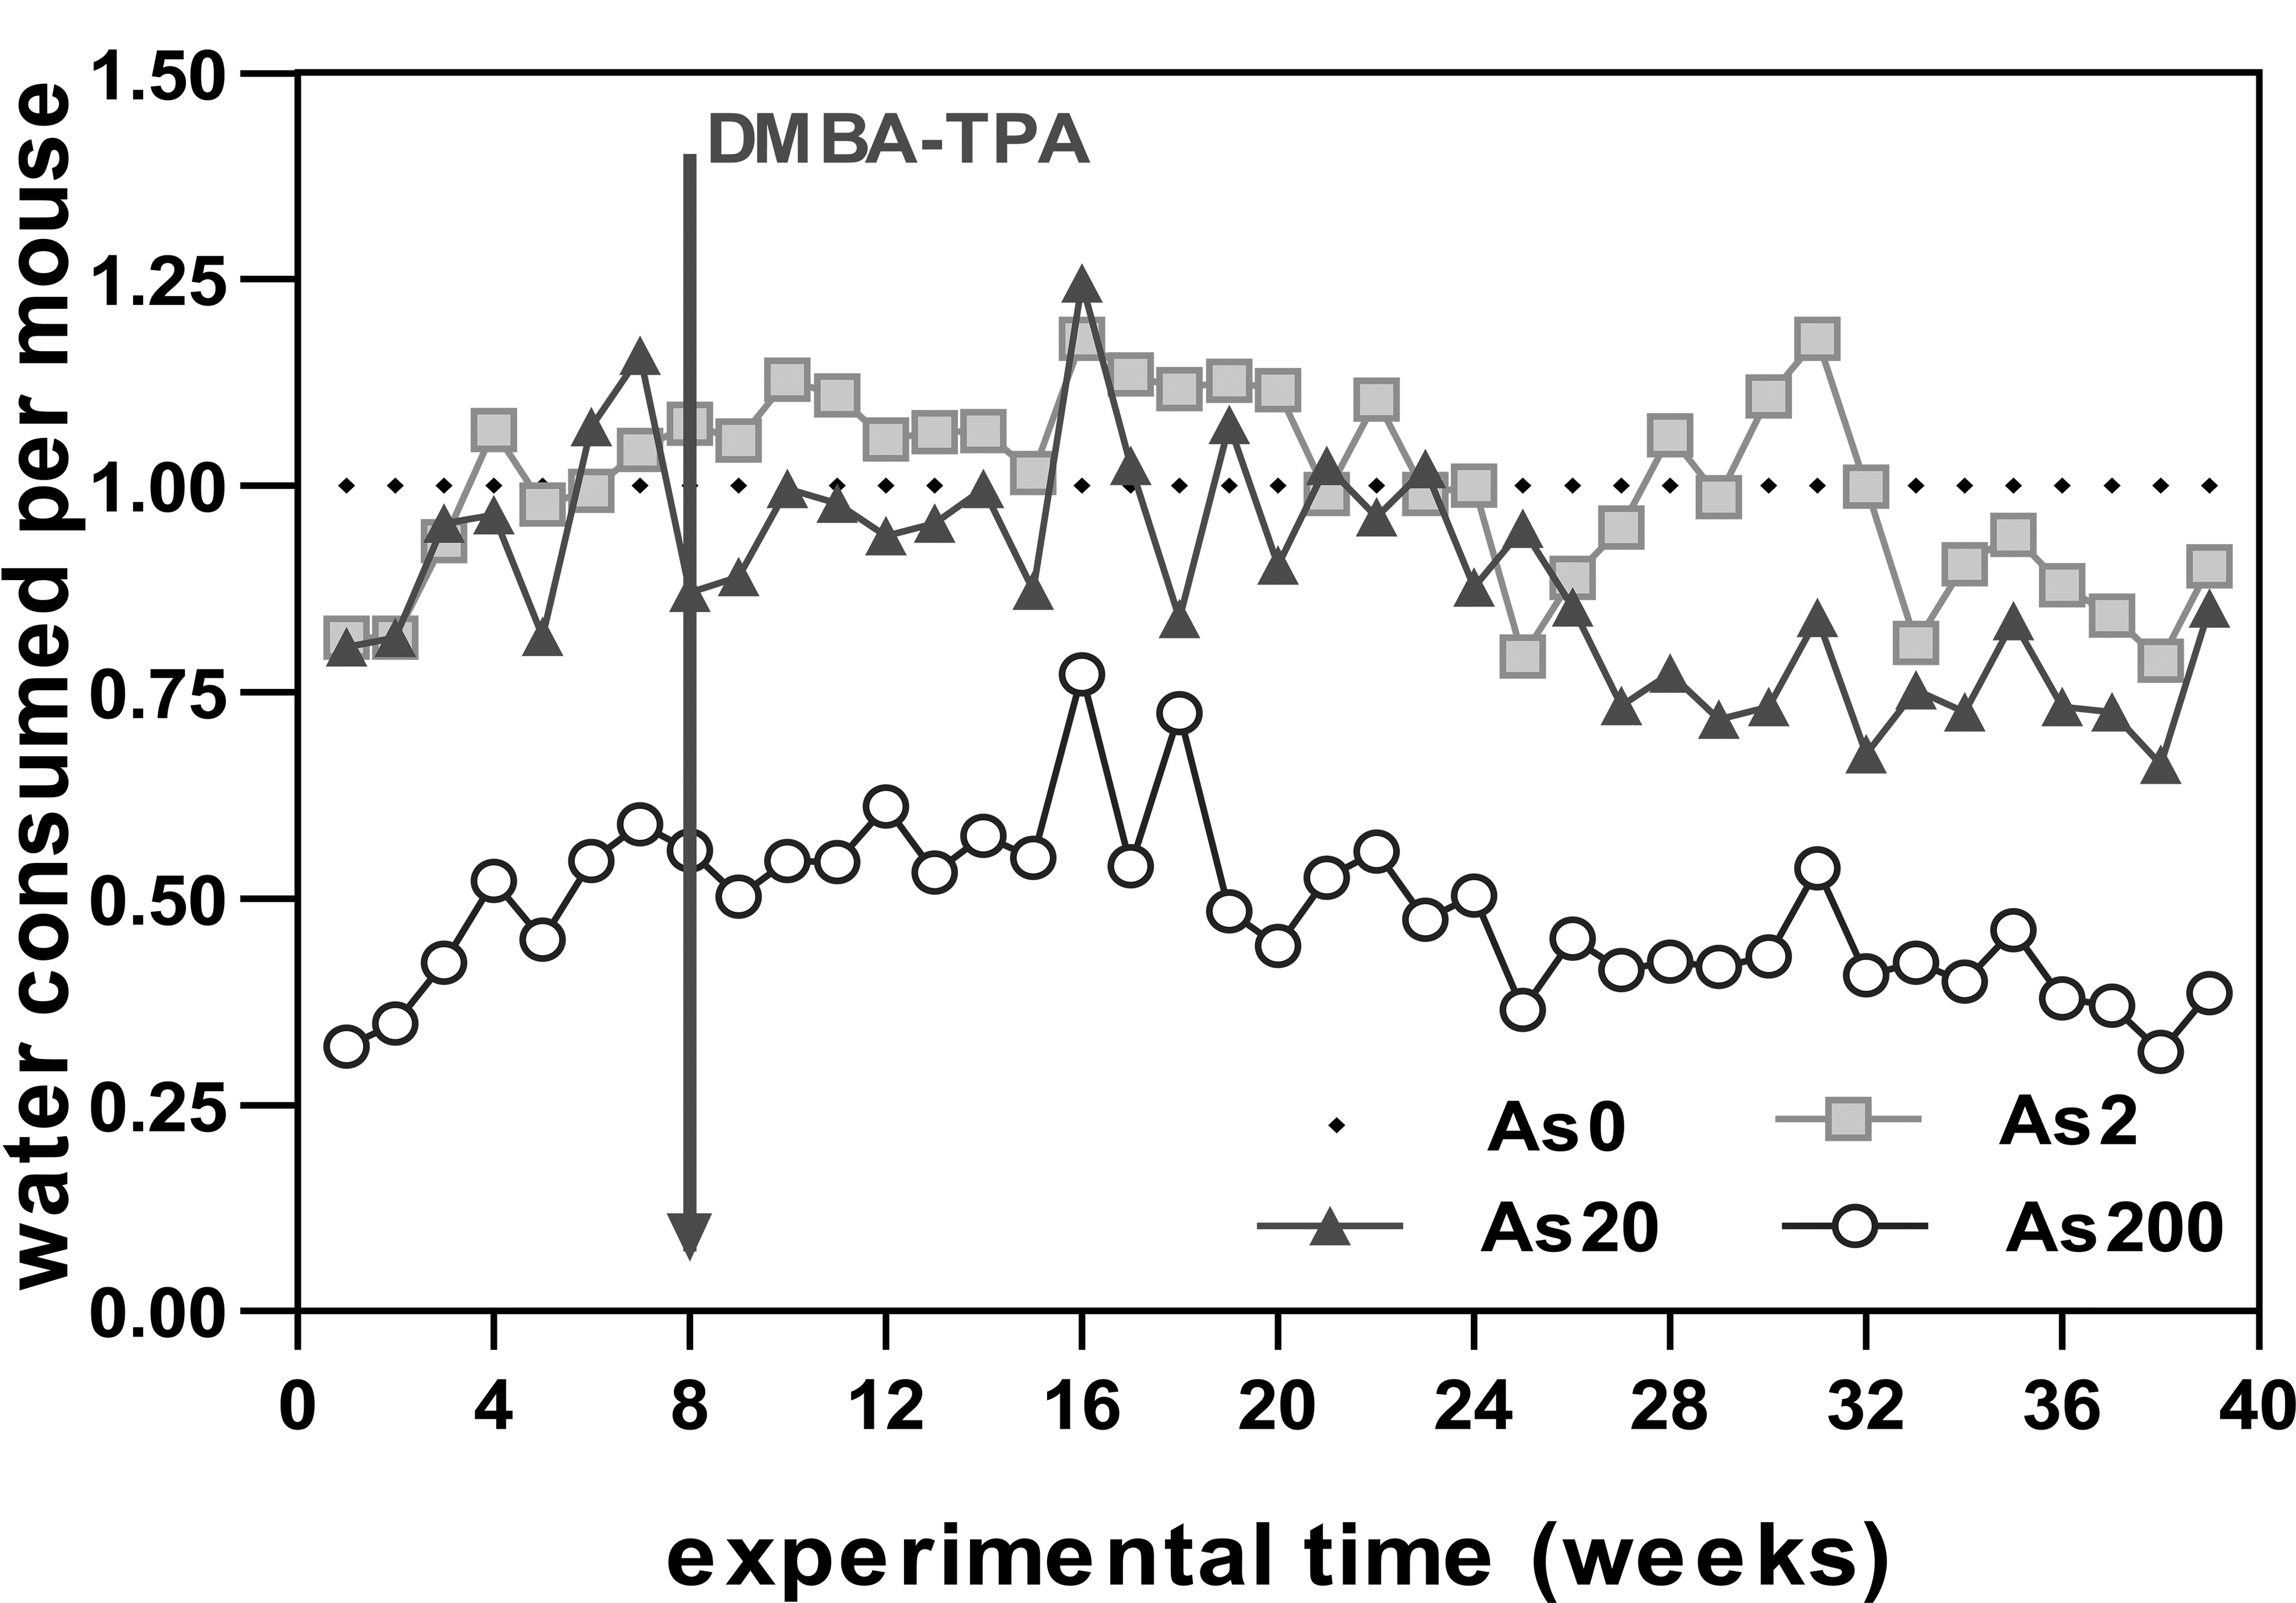
Average water intake per animal per week (experiment 1). As0 is the reference value. The arrow indicates the initiation of the carcinogenesis protocol.
A remarkable increase in the specific value of As3+ ingested (µg of As3+ ingested/g of body weight) was observed, especially in animals that drank the highest concentration of As3+ (Figure 4). At the end of the treatments, 74% mice survived in the As0, As2, and As20 groups whereas 95% survived in the As200 condition. Only the As200 group showed significant differences from the control animals in terms of survival.
As3+ (μg) consumed per gram of body weight versus time. The arrow indicates the initiation of the carcinogenesis protocol.
Analysis of Tumor Development during Promotion–Progression Stages
Tumors began to appear in the As2 and As20 groups at around the 3rd week of topical treatment and for the As200 and control groups tumors were apparent around the 6th week. The majority of tumors developed between weeks 3 and 10 of TPA promotion. After 19 weeks of treatment, all animals had developed tumors with all experimental conditions.
During the initial stages of treatment, the gradual increase in tumor size was accompanied by newly formed tumors. At the end of the treatment period, 40 to 55% of the tumors measured up to 20 mm3, although a tendency toward bulky tumors was detected particularly in animals that drank the highest dose of As3 + (Figure 5).
Final tumor volume (experiment 1). (A) Median tumor volume (mm3); (B) maximum tumor volume (mm3). Each point corresponds to 1 animal.
An evaluation of the average number of tumors per animal/week (Figure 6) showed that from the 30th topical application and onward, the control animals developed the largest number of tumors, while all animals treated with As3+ exhibited a similar number of tumors that was clearly lower than the control. According to the Gompertz Model, the α (load capacity) and γ (rate of tumor number increase) parameters were estimated for each animal to perform statistical analyses of the number of tumors. Figure 7 shows the mean values for these parameters, which were statistically analyzed and the corresponding significant levels were calculated (p < .05). The highest rate of increase in tumor number (γ) was observed for As200 animals (6–12 week promotion, Figure 6). In contrast, the highest asymptotic value (α) was seen in control animals, indicating that there was a significantly lower number of tumors in all animals drinking As3 + (16–30 weeks of promotion, Figure 6).
Tumors/mouse (experiment 1). Average number of tumors (± SE) versus number of topical TPA applications.
Evaluation of 2 descriptive parameters of the Gompertz model (experiment 1). (A) Parameter γ (growth rate); (B) parameter α (asymptotic value). Different letters represent statistically significant differences (p ≤ .05) as tested by analysis of variance (ANOVA).
Data derived from histopathological analyses are shown in Table 1. Compared with control animals, the conversion index (carcinoma/papilloma) was 6-fold for As2, 7-fold for As20, and 2-fold for As200 mice. Thus, a higher index was observed for all As3+ conditions, with a higher index seen for lower doses of As3+.
Evaluations according to tumor diagnosis (experiment 1).
aAverage ± SE.
*p < .1.
Experimental Design 2
To analyze the action of As3+ supplied in drinking water prior to or during the carcinogenic process, the 20 mg As3+/L concentration was selected.
No statistically significant differences were found in the weekly mean body weight values among the groups (data not shown). During this experiment, all animals drank similar volumes of arsenic-supplemented water.
Animal survival was recorded throughout the experimental period. The cumulative survival probability was between 0.62 and 0.76 at the end of the experiment.
Analysis of Tumor Development during the Promotion–Progression Stage
Most tumors appeared between the 4th and 10th weeks of TPA promotion. After the 1st weeks, no tumor size differences were observed regardless of the experimental conditions. Among the different experimental groups, all mice developed tumors after the 12th (W-W), 13th (As20-W), 16th (W-As20), and 20th (As20-As20) week of treatment, respectively.
Tumor volume was evaluated at the end of the experiment and showed that tumor size varied similarly to Experimental Design 1 (Figure 8).
Final tumor volume (experiment 2). (A) Median tumor volume (mm3); (B) maximum tumor volume (mm3) value. Each point corresponds to 1 animal.
In terms of the average number of tumors/animal per week, for the condition W-W the average tumor number rose after week 16 and remained at that value. Conversely, the As20-As20 group exhibited a lower average tumor number after the 14th week (Figure 9).
Tumors/mouse (experiment 2). Average number of tumors (± SE) versus number of topical TPA.
According to the Gompertz Model, α and γ parameters were calculated for each animal and the mean value for each parameter was determined (Figure 10). Concerning the rate of increase in tumor number (γ) that corresponds to the 6- to 12-week promotion shown in Figure 9, mixed conditions had significantly higher rates than control animals (p < .05, Figure 10). Meanwhile, the asymptotic value of the curve (α) showed that the control condition had significantly higher values than the As20-As20 condition (16–30 weeks of promotion, Figure 9).
Evaluation of 2 descriptive parameters of the Gompertz model (experiment 2). (A) Parameter γ (growth rate); (B) parameter α (asymptotic value). Different letters represent statistically significant differences (p ≤ .05) as tested by analysis of variance (ANOVA).
The data derived from the histopathological analysis are shown in Table 2.
Evaluation according to tumor diagnosis (experiment 2).
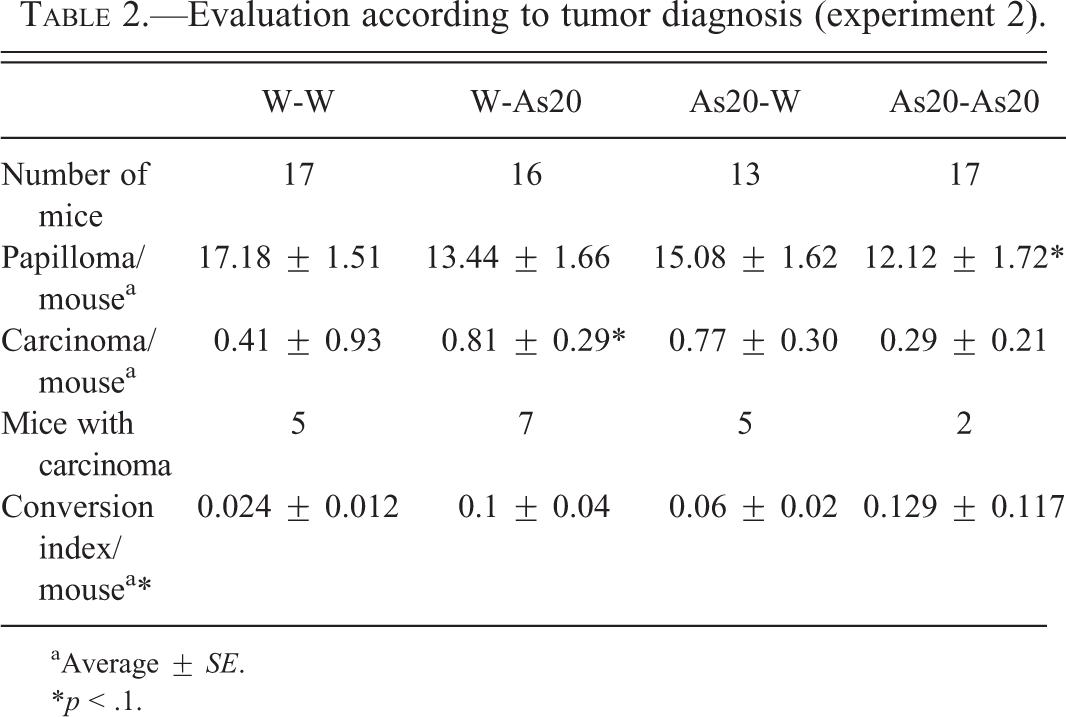
aAverage ± SE.
*p < .1.
The conversion index as compared to the control group was 4-fold higher for W-As20, 2.4-fold higher for As20-W, and 5.4-fold higher for As20-As20. While the As20-As20 group had a lower percentage of mice with carcinoma, these mice had more than 1 carcinoma each, which led to an increase in the conversion index. A higher index was observed for all groups that drank As3 + throughout the experiment, indicating that the malignancy rate increased, provided that As3 + was present in drinking water.
Discussion
Arsenic exposure is an environmental risk for the human population in general and particularly for those subpopulations living in areas with high levels of arsenic in drinking water. Since arsenic has been recognized as a human carcinogen in international epidemiological records (EPA 1988), it is crucial to determine the toxicity degree of this agent in target organs or systems in order to evaluate the risk of arsenic exposure to human health. However, some compounds containing arsenic are effective therapeutic agents for the treatment of certain types of neoplasia (Han et al. 2004; Hu et al. 2005; Shao et al. 2005; Cheng et al. 2006; Luo et al. 2006; Ai, Lu, and Qin 2006; Cheung, Chu, and Kwong 2007), especially those of hematologic origin (Amadori et al. 2005; Zhang et al. 2010).
The present experiments demonstrate important variations in the development, evolution, and diagnosis of tumors formed in a 2-stage skin carcinogenesis model in animals given drinking water supplemented with As3+.
In all the experimental conditions tested, with the exception of those animals that ingested the highest As3+ dose (As200), the animals maintained a healthy appearance, regular diet, and weights that were within normal ranges. On the other hand, animals in the As200 group presented with lower body weight but exhibited a normally active behavior. According to other investigations (Boutwell 1963; Xie et al. 2004), a decline in body weight would occur after chronic exposure to arsenic. The mice in the As200 group also drank much less water than the control animals, which is in agreement with findings by Shirachi et al. (1983) in rats. As such, the index of As3+ incorporation was much higher in these animals, not only due to the volume ingested but also because of the body weight loss.
Evaluation of tumor size revealed that tumor growth was heterogeneous throughout the carcinogenic process. At the end of the carcinogenesis protocol, most tumors that formed were small, although there were a few larger tumors, especially in the As200 group. However, differences in tumor volume relative to the control group were not statistically significant. Regarding final tumor volumes following a 2-step carcinogenesis protocol, the literature is controversial. While some authors found larger tumors than the controls (Schrauzer and Ishmael 1974; Rossman et al. 2002), others observed smaller tumors in the experimental group compared to the controls (Blakeley 1987). However, it is important to note that these variable findings are derived from different experimental models.
The number of tumor formations that appeared during the carcinogenic process in all the experimental conditions examined was analyzed using the Gompertz model, which allowed the evaluation of the data while considering 2 periods in the treatment time. In the 1st period (γ parameter), a progressive increase in the number of tumors was observed, with higher numbers seen in those animals that ingested all doses of As3+. In a study by Germolec et al. (1997) that used transgenic animals (Tg.AC) with genetically initiated skin carrying the oncogene v-Ha-ras, there was an increase in the number of papillomas in mice drinking water with As3+, but this assay ended after 14 weeks. Thus, these results can be ascribed to the process that corresponds to the 1st phase reported here. During the 2nd period (α parameter), the maximum number of tumors was attained and was nearly constant until week 30. During this period, the rate of tumor development decreased in the As3+ groups and stabilized at values below that of the controls. This response may be due to the high level of systemic As3+ that accumulated in the animals, which could in turn impair tumor development as would be expected in a standard carcinogenic process.
The changes in tumor development induced by alterations in the conditions prior to the beginning of the carcinogenesis protocol were also examined. In those mice that ingested water with and without As3+ either before or during the carcinogenesis protocol, herein called “mixed conditions” (W-As20 and As20-W), a significant increase in the number of tumors/mouse was observed during the 1st period compared to control. At the beginning of the 2nd period, from the 14th week through the remainder of the experiment, the number of tumors reached intermediate values between the control and As20-As20 groups. This finding indicated that the As20-As20 group may have accumulated a higher amount of systemic As3+ than the animals in the mixed condition group.
Previous in vitro studies on As3+ doses and time-related effects may provide an indirect explanation of our results. For example, studies using a mouse lung epithelial line by Lau et al. (2004) showed an effect of As3+ on cell proliferation and associated signal transduction pathways. They observed that at low levels of As3+, cell proliferation signaling pathways are stimulated, whereas at high concentrations of As3+, a signaling pathway that induces apoptosis is stimulated. Taking these findings into account in our study, the 1st period may be associated with the results observed in vitro with low As3+ concentrations. The 2nd period would be associated with a bioaccumulation effect that would in turn lead to an increase in systemic levels of arsenite.
Another important aspect of this work is the histopathologic evaluation of each tumor formation at the end of the experiment (30 weeks). Considering both the percentage of mice with 1 or more carcinomas and the calculated conversion index, it is noteworthy that the conversion index was higher in the As3+ groups, even though they exhibited a lower number of tumors. These results are in agreement with those of Waalkes et al. (2008), which were obtained using a different experimental model involving Tg.AC transgenic mice. These authors found a higher percentage of mice with carcinomas and a higher number of carcinomas/mouse in animals born to pregnant females given water supplemented with As3+ during the gestational period. Similarly, a study by Rossman et al. (2002) looking at the effects of As3+ and ultraviolet irradiation-induced tumorigenesis also reported a higher degree of malignancy in the developed tumors.
The coexistence of cell subpopulations with differences in gene expression levels has been described, especially in solid tumors (Giaretti et al. 1996; Glöckner et al. 2002, Herrera Patiño, Ramírez Gaviria, and Muñetón Peña 2008). Such variations in expression levels confer on each tumor formation a certain degree of heterogeneity both at a cellular and immune level (Barrio 2009). In the experimental carcinogenic process, papilloma cells accumulate additional genetic changes that are manifested during the tumor progression phase (Aldaz et al. 1987; Yamasaki and Mironov 2000). In the case of tumors in mice that drank water with As3+, the tumor microenvironment would be affected by the systemic level of As3+ in the animal, as suggested by Laconia, Doratiottoa, and Vineis (2008). Alterations at a genomic level in tumor cells can be enhanced by the mutagenic effect of As3+ and its deleterious action on DNA repair mechanisms (Lee, Oshimura, and Barrett 1985; Lee et al. 1986; Yang et al. 1992; Rossman 2003; Guillamet et al. 2004), which would favor the tumor progression phase, as is reflected in the higher conversion index.
The continuous renewal of normal epithelium is driven by the renovation capacity of stem cells. In the same way, initiated epithelial cells carrying a mutated genome can also be continuously renewed. In this study, epithelia previously initiated with DMBA that then received TPA during the 1st weeks of promotion are likely stimulated via PKC following activation of signaling pathways that are linked to cell proliferation (Shih and Lin 1993; Katiyar and Mukhtar 1997; La et al. 1999; Kim et al. 2005). The mice that received As3+ are also exposed to additional stimulation by the epithelium microenvironment (Laconia, Doratiottoa, and Vineis 2008), as well as being affected by systemic levels of As3+ (Germolec et al. 1996). These results would also explain the difference in the number of tumors observed during the 1st period.
After almost 3 months of promotion, the number of tumors stabilized and remained constant for all As3+ treatments examined here. In contrast, the tumor number increased in the control animals. The lower number of tumors formed during the 2nd period in the As3+ groups can be associated with apoptotic mechanism affecting the proliferation of epithelial cells initiated during the 1st phases of promotion and clonal expansion.
Together, our findings indicate that responses to As3+ must be analyzed with consideration given to the exposure time and As3+ dosage to account for potential pre-carcinogenic effects and intersubject variability.
Footnotes
Acknowledgments
We are very grateful to the pathologists Dr. M. E. Itoiz and Dr. H. E. Lanfranchi for their skilled analysis of histologic samples and Ms. Andrea Cruz for professional English language editing of the manuscript.
Author Contribution
All authors (MP and BM) contributed to conception or design; data acquisition, analysis, or interpretation; drafting the manuscript; and critically revised the manuscript. All authors gave final approval and agree to be accountable for all aspects of work in ensuring that questions relating to the accuracy or integrity of any part of the work are appropriately investigated and resolved.
The author(s) declared no potential conflicts of interest with respect to the research, authorship, and/or publication of this article.
The author(s) received no financial support for the research, authorship, and/or publication of this article.