
Abstract
3-Methylfuran is produced in foods during food processing and preservation techniques that involve heat treatment such as cooking, jarring, canning, and pasteurization. Currently, there are no studies available on the toxicity of 3-methylfuran. We conducted a 28-day gavage toxicity study (7 days per week) using doses of 0.0, 0.1, 0.3, 1.5, 3.0, 6.0, 12.0, and 25.0 mg/kg bw/day in order to determine the dose range needed to establish a no observed adverse effect level and to better characterize nonneoplastic effects including those affecting hematology, clinical biochemistry, gross morphology, and histopathology. Histological changes of the liver were noted in all treated animals and gross changes were noted beginning at 3.0 mg/kg bw/kg. Alterations in the activity of serum enzymes indicative of effects on the liver were observed, including increases in levels of alanine transaminase and alkaline phosphatase at the highest dose. There was a significant increase in serum thyroxine (T4) and triiodothyronine (T3), which was not accompanied by histological changes in the thyroid. For the most part, statistically significant changes were seen only at the highest dose for hematology and at the 2 highest doses for clinical chemistry parameters. In contrast, mild histological lesions in the liver were observed even at the lowest dose of 0.1 mg/kg bw/day.
Introduction
Heat-induced food contaminants have attracted the attention of both the scientific community and the public in recent years (Bakhiya and Appel 2010; Gill et al. 2010, 2011, 2013; Moser et al. 2009; Crews and Castle 2007; Wenzl, Lachenmeier, and Gokman 2007; Becalski et al. 2010). Recent surveys performed by various health agencies including the Food and Drug Administration (FDA 2004), Health Canada (Becalski et al. 2010), European Food Safety Authority (EFSA 2004), and the Swiss Office of Public Health (Reinhard et al. 2004) have all found that furan is present in a wide range of foods with levels greater than 240 μg/kg. It is found in cooked and canned meats, roasted coffee, beer, and wheat breads (Bolger, Tao, and Dinovi 2009; Crews and Castle 2007; Maga 1979; Limacher et al. 2007, 2008; Morehouse et al. 2008; Qvist and Sydow 1974). Derivatives of furan are also being used as flavoring agents in food and tobacco products (Lucas, Putman, and Hallagan 1999; Maga 1979; Mulder, Maarse, and Weurman 1972). Furan and its derivatives have received little attention until recently, when the International Agency for Research on Cancer (IARC 1995) classified it as “possibly carcinogenic to humans” (group 2B).
In most thermally treated products, the parent chemical furan has been found to be accompanied by a series of alkylated analogs, in particular 2-substituted alkylfurans, such as 2-methyl, 3-methyl, and 2-ethylfuran (Maga 1979; Becalski and Seaman 2005; Mark et al. 2006; Becalski et al. 2010; Becalski et al. 2005; Qvist and Sydow 1974). These methyl analogs of furan are metabolically activated in a similar fashion as the parent furan, yielding highly reactive, unsaturated dialdehydes (Ravindranath, Burka, and Boyd 1984; Ravindranath and Boyd 1985). Estimates of dietary exposure to furan have been calculated from surveys of furan levels in foods in Canada (Becalski et al. 2010; Becalski et al. 2005). The levels of methylfurans in jarred food approach 50% of the concentration of furan. The levels of 3-methylfuran in brewed coffee were estimated to be twice those of furan (Becalski et al. 2010). Based on a deterministic exposure assessment, the average intakes by adults of furan alone and of furan together with its derivatives were estimated at 0.37 and 0.71 µg/kg bw/day, respectively. In the case of toddlers (1–4 years), mean exposures of furan alone and total furans were estimated to be 1.12 and 1.34 µg/kg bw/day, respectively (Becalski et al. 2010). These data agree with the data collected by the World Health Organization (WHO 2011) and EFSA (2004). Since furan and its derivatives are found at high levels in baby foods, infants and children are potentially at risk. Children are highly vulnerable to chemicals because their metabolic pathways can differ from those of adults, thus they are less able to metabolize toxicants (Suk et al. 2003).
Because furan is widely distributed in the environment, human exposure to it is likely to be significant (Peterson et al. 2011). Chronic oral exposure to furan of both F344 rats and B6C3F1 mice results in dose-dependent hepatocellular toxicity and carcinogenicity (National Toxicology Program [NTP] 1993). Furan-treated rats also develop cholangiocarcinomas. Necrosis of hepatocytes is seen after subchronic or subacute oral exposure (NTP 1993; Gill et al. 2010) and acute intraperitoneal exposure (Wiley et al. 1984) to furan. The kidney is a lesser target of furan with both routes of administration (NTP 1993; Wiley et al. 1984). There is less information on exposure to furan by inhalation, but its vapors are toxic to rats (Terrill et al. 1989; Gammal et al. 1984).
2-Methylfuran is also a potent hepatotoxin in intraperitoneal (Ravindranath et al. 1986; Ravindranath and Boyd 1991) and oral (Gill et al. 2013) studies. As with furan, necrosis of hepatocytes was seen in these short-term studies; however, the kidneys were not affected. Bronchial injury to the lung was observed by Ravindranath et al. (1986). There is little information on exposure to 2-methylfuran by inhalation; however, it is toxic to rats (Terrill et al. 1989).
Little toxicological information is available for 3-methylfuran, and in almost all of the studies, the route of administration was by inhalation (Haschek et al. 1984; Morse, Boyd, and Witschi 1984; Gammal et al. 1984; Witschi et al. 1985; Wålinder, Norbäck, and Johanson 1998); in one study, intraperitoneal injection was used (Wiley et al. 1984). In inhalation studies, furan and 3-methylfuran were found to induce pulmonary and nasal toxicity (Gammal et al. 1984; Haschek et al. 1984; Morse, Boyd, and Witschi 1984; Witschi et al. 1985). Other inhalation effects of 3-methylfuran include pallor and reduced weight of liver and kidney, as well as necrosis in the kidney and cloudy swelling of centrilobular hepatocytes (Haschek et al. 1984), and amyloidosis in liver, kidney, and other organs (Witschi et al. 1985). In contrast to their findings for furan, which induced extensive centrilobular necrosis in the liver and slight proximal tubular necrosis of the kidney after intraperitoneal administration, Wiley et al. (1984) found no effects on liver or kidney from intraperitoneally administered 3-methylfuran.
Furan, 2-methylfuran, and 3-methylfuran are activated by rat microsomal systems (Peterson et al. 2011; Ravindranath, Burka, and Boyd 1984). Furan has been shown to form adducts to both amino acids (Chen, Hecht, and Peterson 1997) and nucleic acids (Byrns et al. 2006), and metabolites of radiolabeled 2-methylfuran and 3-methylfuran can bind to hepatic and pulmonary microsomal protein in vitro (Ravindranath, Burka, and Boyd 1984). While 3-methylfuran appears generally to target the same organs as 2-methylfuran, comparisons are rendered more difficult by the fact that almost all the toxicology information from 3-methylfuran is from the inhalation route, whereas most information for 2-methylfuran comes from intraperitoneal (Ravindranath et al. 1986; Ravindranath and Boyd 1991) and (more recently) gavage (Gill et al. 2013) studies.
To date, there are no toxicology studies in rodents available identifying a no observed adverse effect level (NOAEL) for either 2-methylfuran or 3-methylfuran. We have recently completed a 28-day study to determine a dose range to establish a NOAEL for 2-methylfuran (Gill et al. 2013). This pilot study was designed to determine the dose range of 3-methylfuran needed to establish the NOAEL.
Materials and Methods
Test Compound and Dosing Solutions
3-Methylfuran (Sigma-Aldrich, St. Louis, MO) was mixed with Mazola® corn oil to final doses of 0.0, 0.1, 0.3, 1.5, 3.0, 6.0, 12.0, or 25.0 mg/kg bw/day. Each dose was prepared separately on a volume-to-weight (v:w) ratio. Chilled corn oil was weighed to the nearest milligram in a conical flask. Chilled furan solution was drawn up in a Hamilton syringe, measured to the nearest microliter, injected into the corn oil, and mixed using a magnetic stir bar. Dosing solutions were dispensed into brown glass vials and capped with plastic closures adapted with silicon septa. Dosing solutions were stored in a refrigerator at 4°C.
Animal Study
Male Fischer 344 rats were purchased from Charles River Laboratories Inc. (St.-Constant, QC) at 5 to 6 weeks of age and acclimatized for 12 days before being randomized and assigned to a particular dose group (10 rats/group). Animal handling and treatment procedures complied with the Guidelines of the Canadian Council on Animal Care and were approved by the Health Canada Animal Care Committee (Ottawa, ON). Rats were identified by tail markings and housed 2 per cage. Animals had ad libitum access to Purina Rodent Chow 5001 (Agribands Purina Canada, East Strathroy, ON) and city tap water. The temperature and humidity of the room were targeted for 18 to 26°C and 30 to 70%, respectively, and monitored continuously. Animals were observed for signs of illness twice daily during weekdays and once daily on weekends and holidays. Sentinel animals for health surveillance were housed in the same room as study animals and remained disease-free throughout the study. Animals were gavaged daily (7 days/week) for 28 days with 3-methylfuran at doses of 0.0, 0.1, 0.3, 1.5, 3.0, 6.0, 12.0, and 25.0 mg/kg bw/day. The 3-methylfuran was administered in corn oil at a maximum volume of 5.0 ml/kg/bw. The animals were weighed daily prior to gavage. Food consumption was measured on a weekly basis.
Organ Weights, Gross Necropsy, and Histopathology
At the end of the study, each animal was killed by exsanguination via the abdominal aorta under isoflurane anesthesia, and a complete gross examination was performed. Liver, heart, kidneys, thymus, spleen, stomach, thyroid, adrenals, pancreas, brain, colon, lungs, testes, epididymides, prostate, and seminal vesicles were collected for histological examination. The testes were immersion fixed in Bouin’s solution. The other tissues were immersion fixed in 10% neutral buffered formalin. Liver, heart, kidneys, adrenals, spleen, thymus, testes, epididymides, prostate, and seminal vesicles were weighed prior to fixation. Right and left kidneys and testes were weighed separately. After fixation, the tissues were routinely embedded in paraffin and 5 µm sections were cut. Slides were stained with Mayer’s hematoxylin and eosin (H&E) and examined by light microscopy. Livers were examined in all dose groups. Only the control and 25.0-mg/kg bw/day dose groups were examined for the thymus, stomach, pancreas, thyroid, prostate/seminal vesicles, and adrenals. Photographs were taken on an Axiophot Zeiss microscope (Germany) with a digital camera linked to an image analysis system (Progres camera, ROCHE image analysis and archiving system).
Analysis of Serum Clinical Biochemistry
At the time of sacrifice, blood from the abdominal aorta was collected in SST Vacutainer® tubes (Becton-Dickinson, Franklin Lakes, NJ) and allowed to clot at room temperature. Serum was separated by centrifugation at 3,000× g and stored at −20°C until analysis. Clinical biochemistry was performed using a Beckman Synchron CX5 Clinical Biochemistry System (Beckman Instrument Canada Inc., Mississauga, ON). The measured markers were serum amylase (U/L), albumin (g/L), alkaline phosphatase (ALP-U/L), alanine transaminase (ALT-U/L), aspartate transaminase (AST-U/L), blood urea nitrogen (BUN-mmol/L), bilirubin-D (μmol/L), total bilirubin (μmol/L), calcium (mmol/L), chloride (mmol/L), cholesterol (mmol/L), creatinine (μmol/L), creatine kinase (U/L), glucose (mmol/L), lipase (U/L), magnesium (mmol/L), phosphorous (mmol/L), potassium (mmol/L), sodium (mmol/L), total protein (TP-g/L), triglycerides (mmol/L), thyroxine (T4-nmol/L), triiodothyronine (T3-nmol/L), and uric acid (μmol/L).
Hematology and Flow Cytometry
Blood was collected in ethylenediaminetetraacetic acid (EDTA) tubes and analyzed using a Coulter-Counter Model S-PLUS IV system (Counter Electronics, Hialeah, FL). The following parameters were measured: red blood cell count (RBC), hematocrit (HCT), hemoglobin (HGB), mean corpuscular volume (MCV), mean corpuscular hemoglobin (MCH), mean corpuscular hemoglobin concentration (MCHC), red blood cell distribution width (RDW), platelet (PLT) count, mean platelet volume (MPV), total white blood cell count (WBC), and differential counts of lymphocytes, monocytes, neutrophils, eosinophils, and basophils.
Statistical Analysis
Body weight, food consumption, clinical biochemistry, hematology, and organ weights were expressed as mean ± standard deviation. Statistical comparisons of treatment effects were done using one-way analysis of variance (ANOVA) followed by Dunett’s analysis. If tests for normality (Kolmogorov–Smirnov test) or equal variances (Bartlett) failed, then the one-way nonparametric Kruskal–Wallis test followed by Dunn’s Multiple Comparison Test was used. The Fisher’s exact test was used to analyze liver lesion incidences (GraphPad Prism version 5.0). A value of p < .05 was considered statistically significant.
Results
Body Weight, Organ Weights, and Food Consumption
Animals dosed at 25.0 mg/kg bw/day showed a significant loss (20%) in body weight compared to controls. The decrease in body weight was accompanied by a significant decrease (22%) in food consumption (Table 1). No other dose groups were affected. Absolute organ weights in the high-dose group were significantly decreased for brain (4.5%), heart (14%), spleen (13%), thymus (24%), and right (10%) and left (15%) testis (Table 2). The absolute weight of the liver was significantly increased by 14% in the 12.0-mg/kg bw/day group. Relative to body weight, liver weights were dose dependently increased by 16% and 34% at 12.0 and 25.0 mg/kg bw, respectively. In the high-dose group only, there were significant increases in the relative weights of right kidney (21%), left kidney (24%), spleen (8%), left testis (10%), and right testis (12%; Table 3). Brain weight is less prone to be affected by changes in body weight, which in this study was closely correlated with food consumption. While the absolute brain weight in the high-dose group was statistically significantly reduced, the amount of change (4.5%) was fairly small. With the exception of liver weights, which were increased without statistical significance relative to brain weight in the two highest dose groups, the trend of organ weights relative to brain weight tended to follow, but be less pronounced than that of absolute organ weights, with statistical significance seen only for decreases in heart (17%) and body (16%) weights relative to brain weight in the high-dose group (Table 4).
Body weights and food consumption in male rats receiving 3-methylfuran.
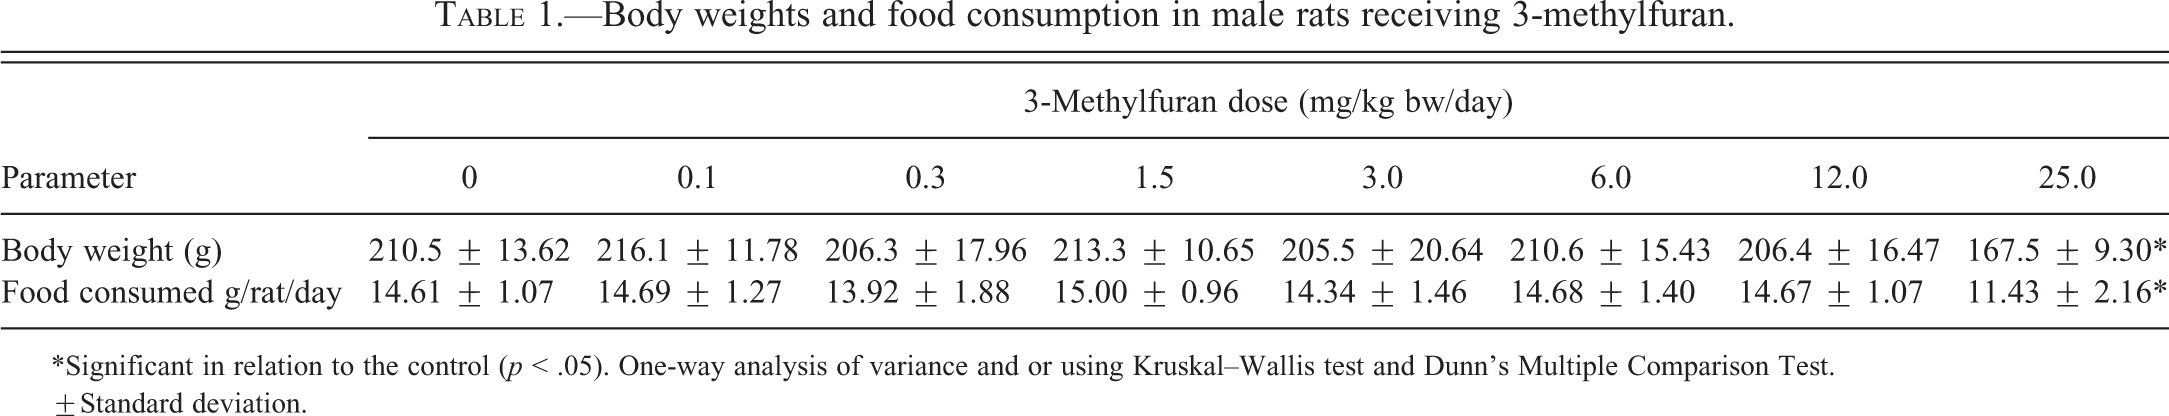
*Significant in relation to the control (p < .05). One-way analysis of variance and or using Kruskal–Wallis test and Dunn’s Multiple Comparison Test.
±Standard deviation.
Absolute body and organ weights in male rats receiving 3-methylfuran.
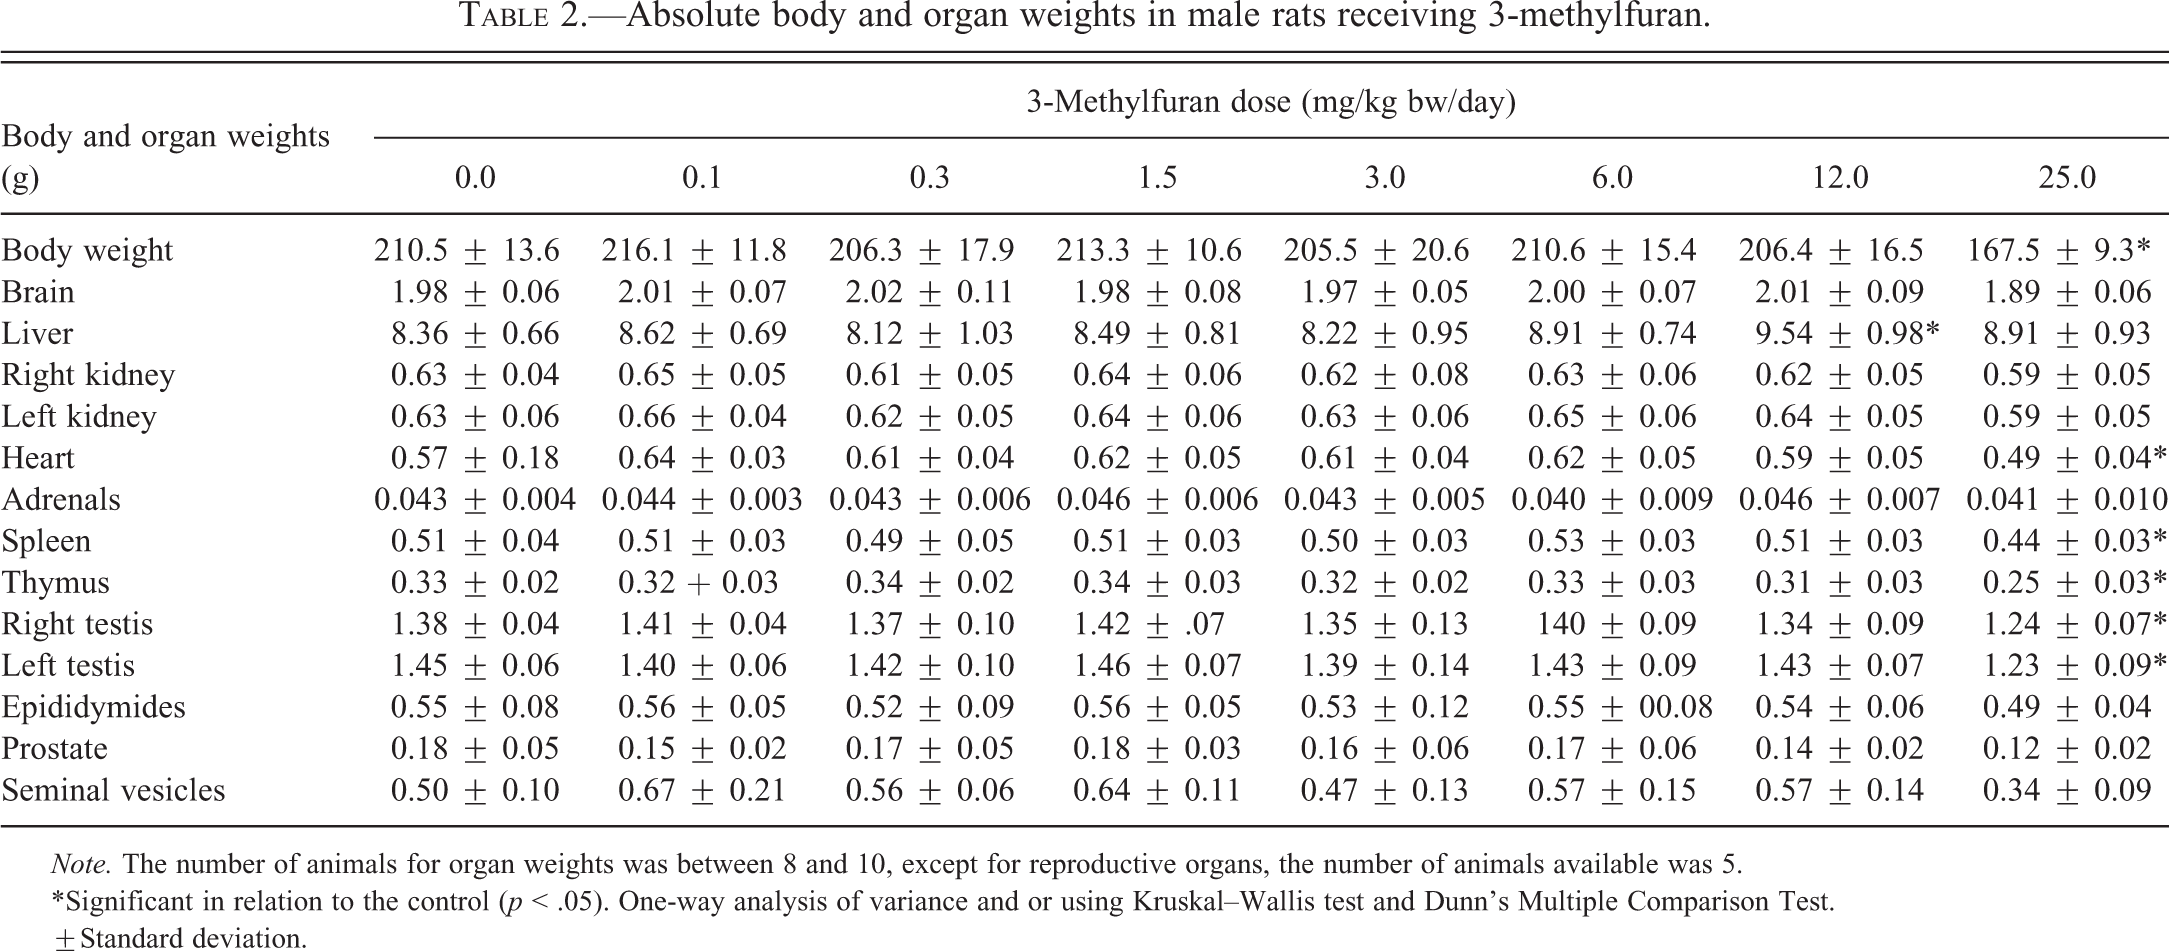
Note. The number of animals for organ weights was between 8 and 10, except for reproductive organs, the number of animals available was 5.
*Significant in relation to the control (p < .05). One-way analysis of variance and or using Kruskal–Wallis test and Dunn’s Multiple Comparison Test.
±Standard deviation.
Organ weight as percentage of body weight in male rats receiving 3-methylfuran.
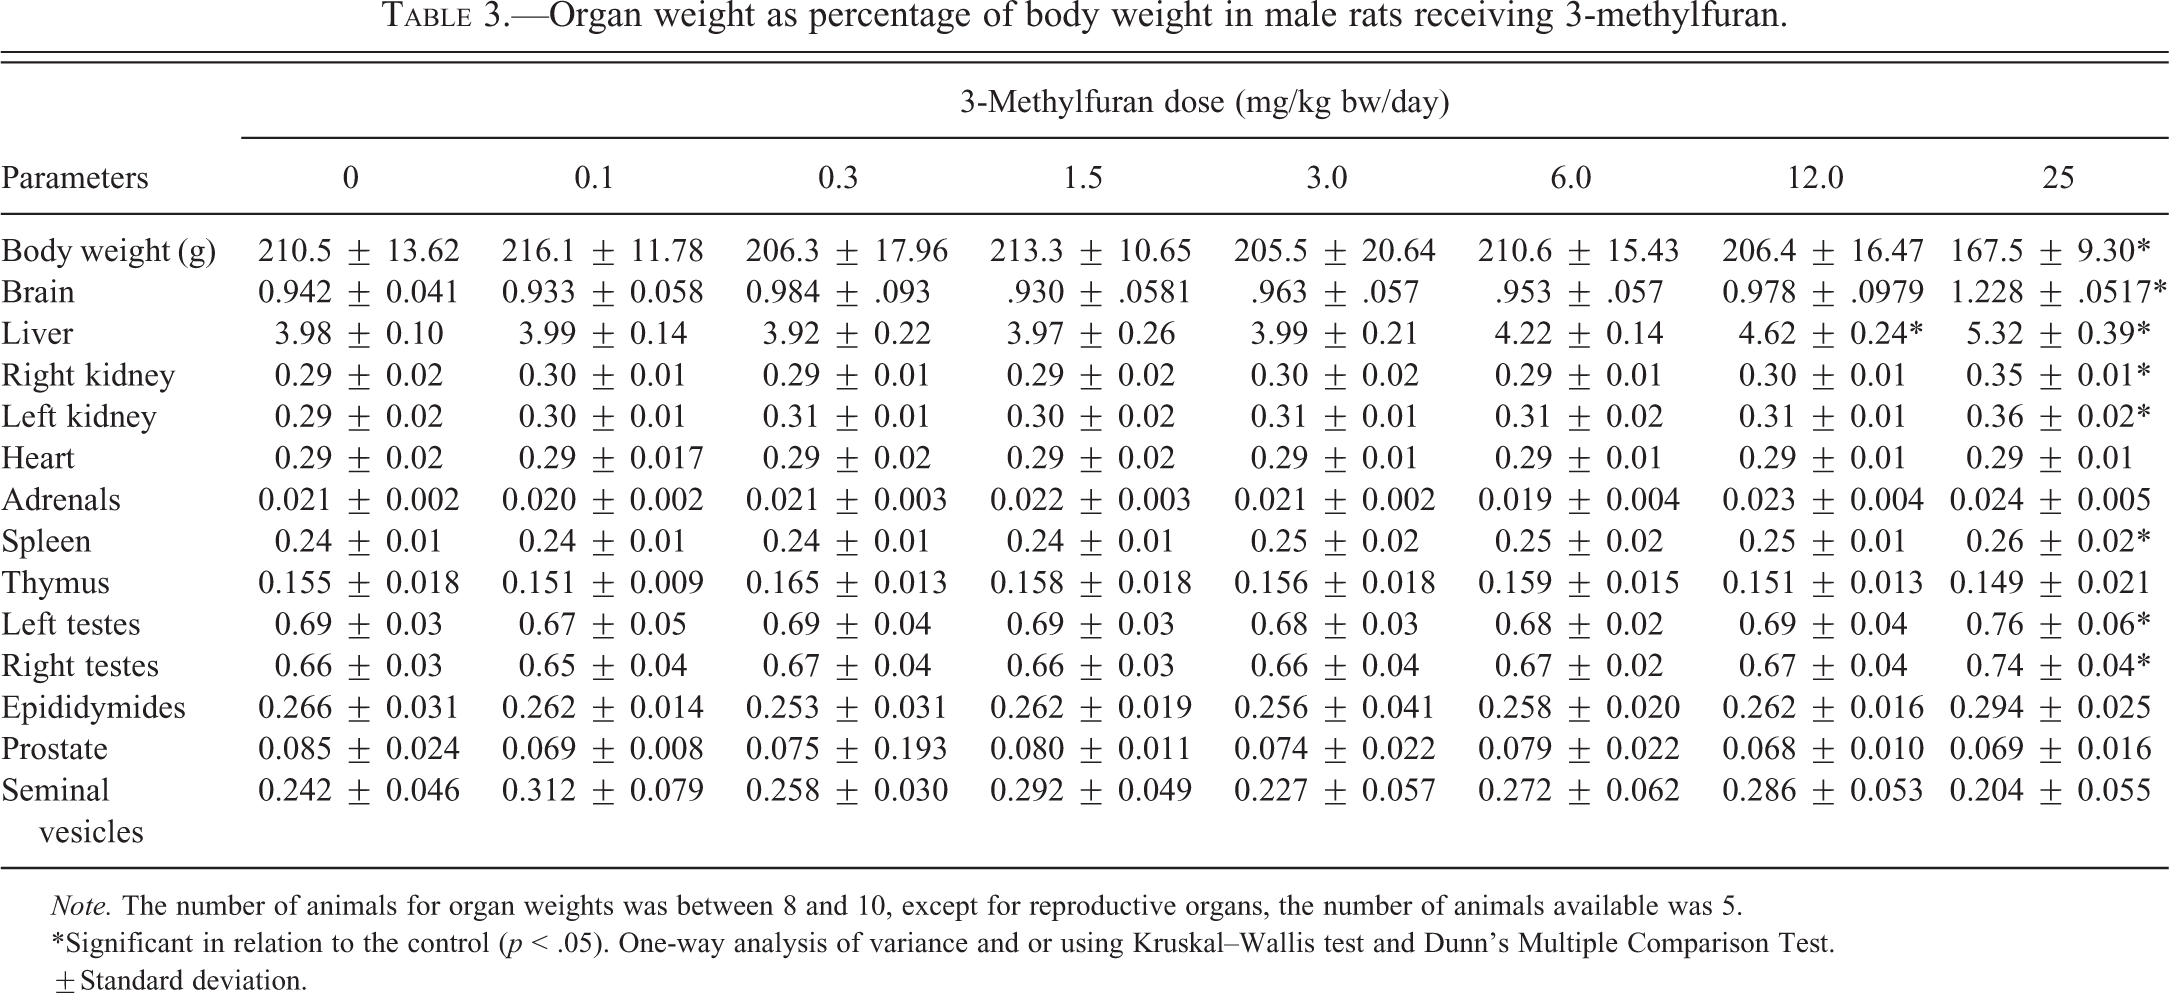
Note. The number of animals for organ weights was between 8 and 10, except for reproductive organs, the number of animals available was 5.
*Significant in relation to the control (p < .05). One-way analysis of variance and or using Kruskal–Wallis test and Dunn’s Multiple Comparison Test.
±Standard deviation.
Organ weights indicated as percentage of brain weight in male rats receiving 3-methylfuran.
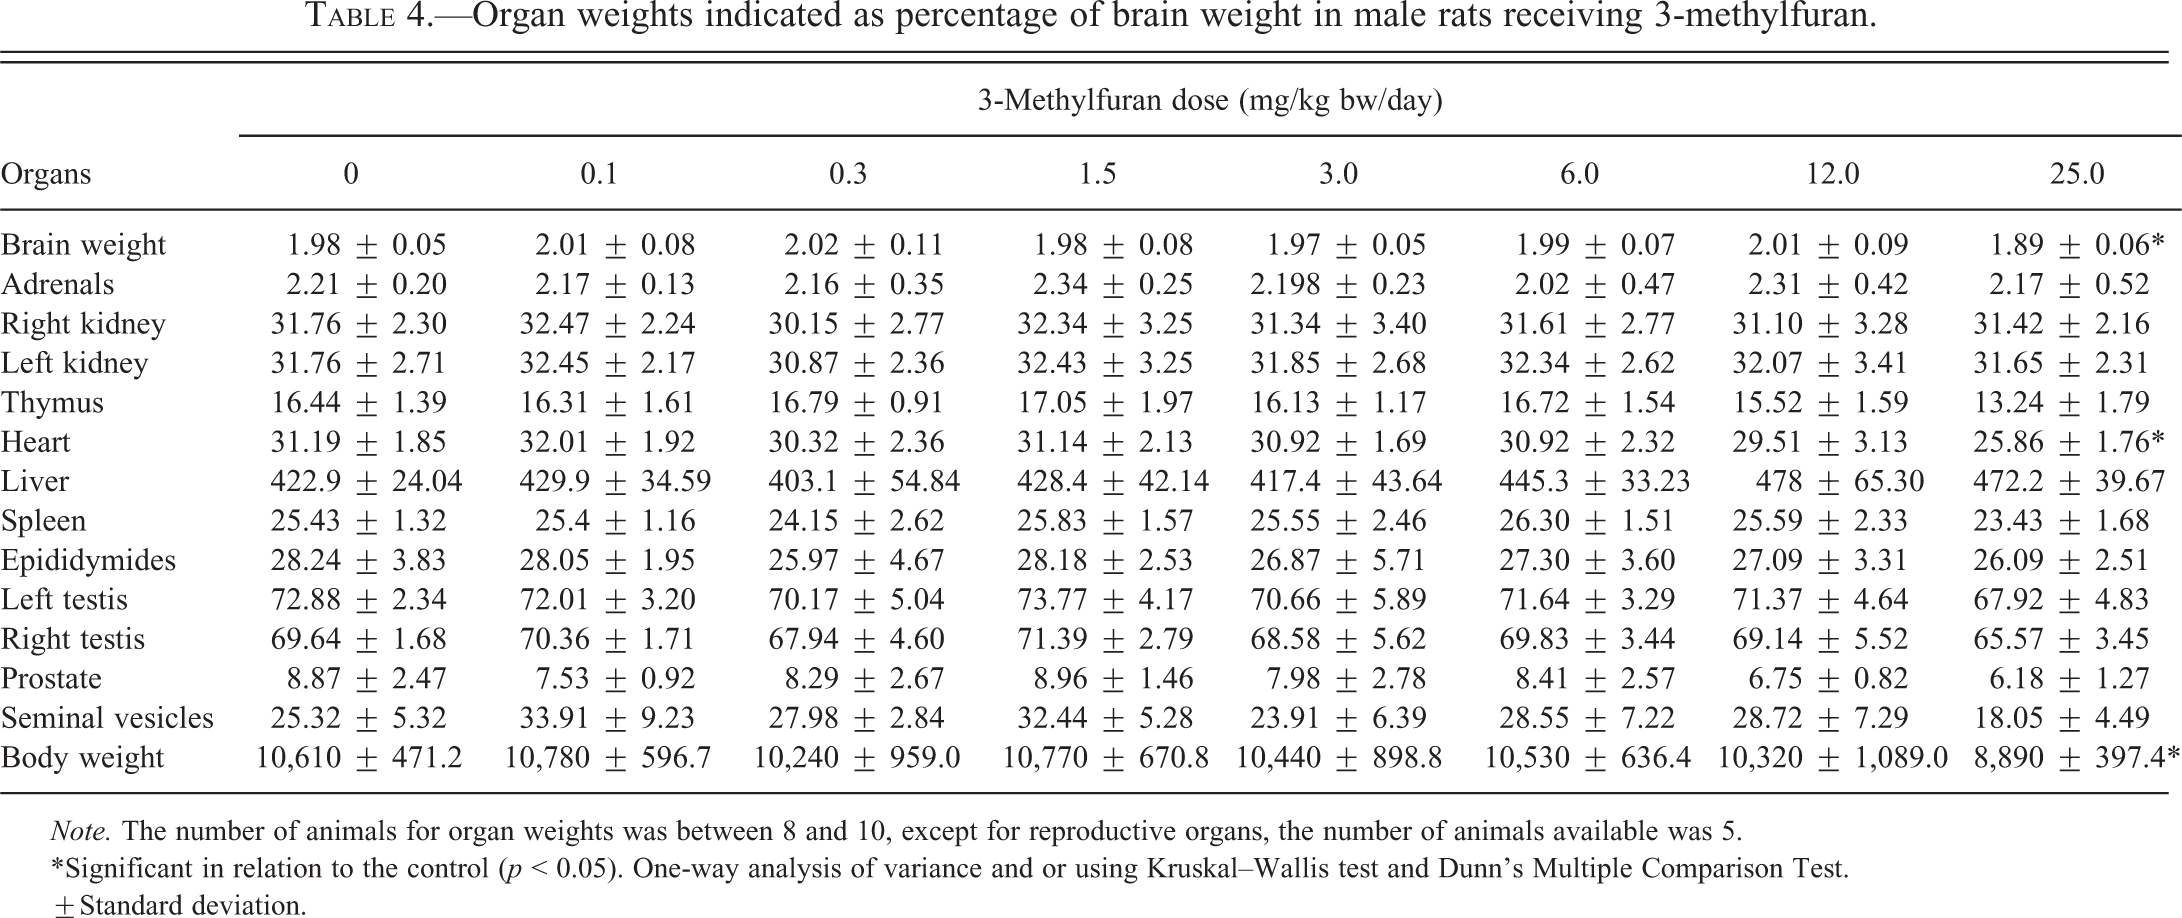
Note. The number of animals for organ weights was between 8 and 10, except for reproductive organs, the number of animals available was 5.
*Significant in relation to the control (p < 0.05). One-way analysis of variance and or using Kruskal–Wallis test and Dunn’s Multiple Comparison Test.
±Standard deviation.
Gross Observations in the Liver
One 3.0-mg/kg bw/day animal had an area of white speckling on the surface of the medial lobe. In the 6.0-mg/kg bw/day group, similar speckling was detected on one papillary process of 2 animals. In this group, the dorsal margin of the left lateral lobe was thin and pale in 7 animals. In the 12.0-mg/kg bw/day group, white speckling was evident on the surface of the left lateral, medial, and right lateral lobes of 1 animal and on 1 papillary process of another animal. Nine animals exhibited a thin, pale dorsal margin of the left lateral lobe.
A common feature of the 25.0-mg/kg bw/day dose group was the presence of multiple small white nodules and a finely irregular surface extending from the dorsal aspect of the left and right lateral lobes, the caudate lobe and less often along the medial lobe (Figure 1a and b). The caudate lobe of most animals was less than half the normal size. In 2 animals, the papillary process was reduced in size.
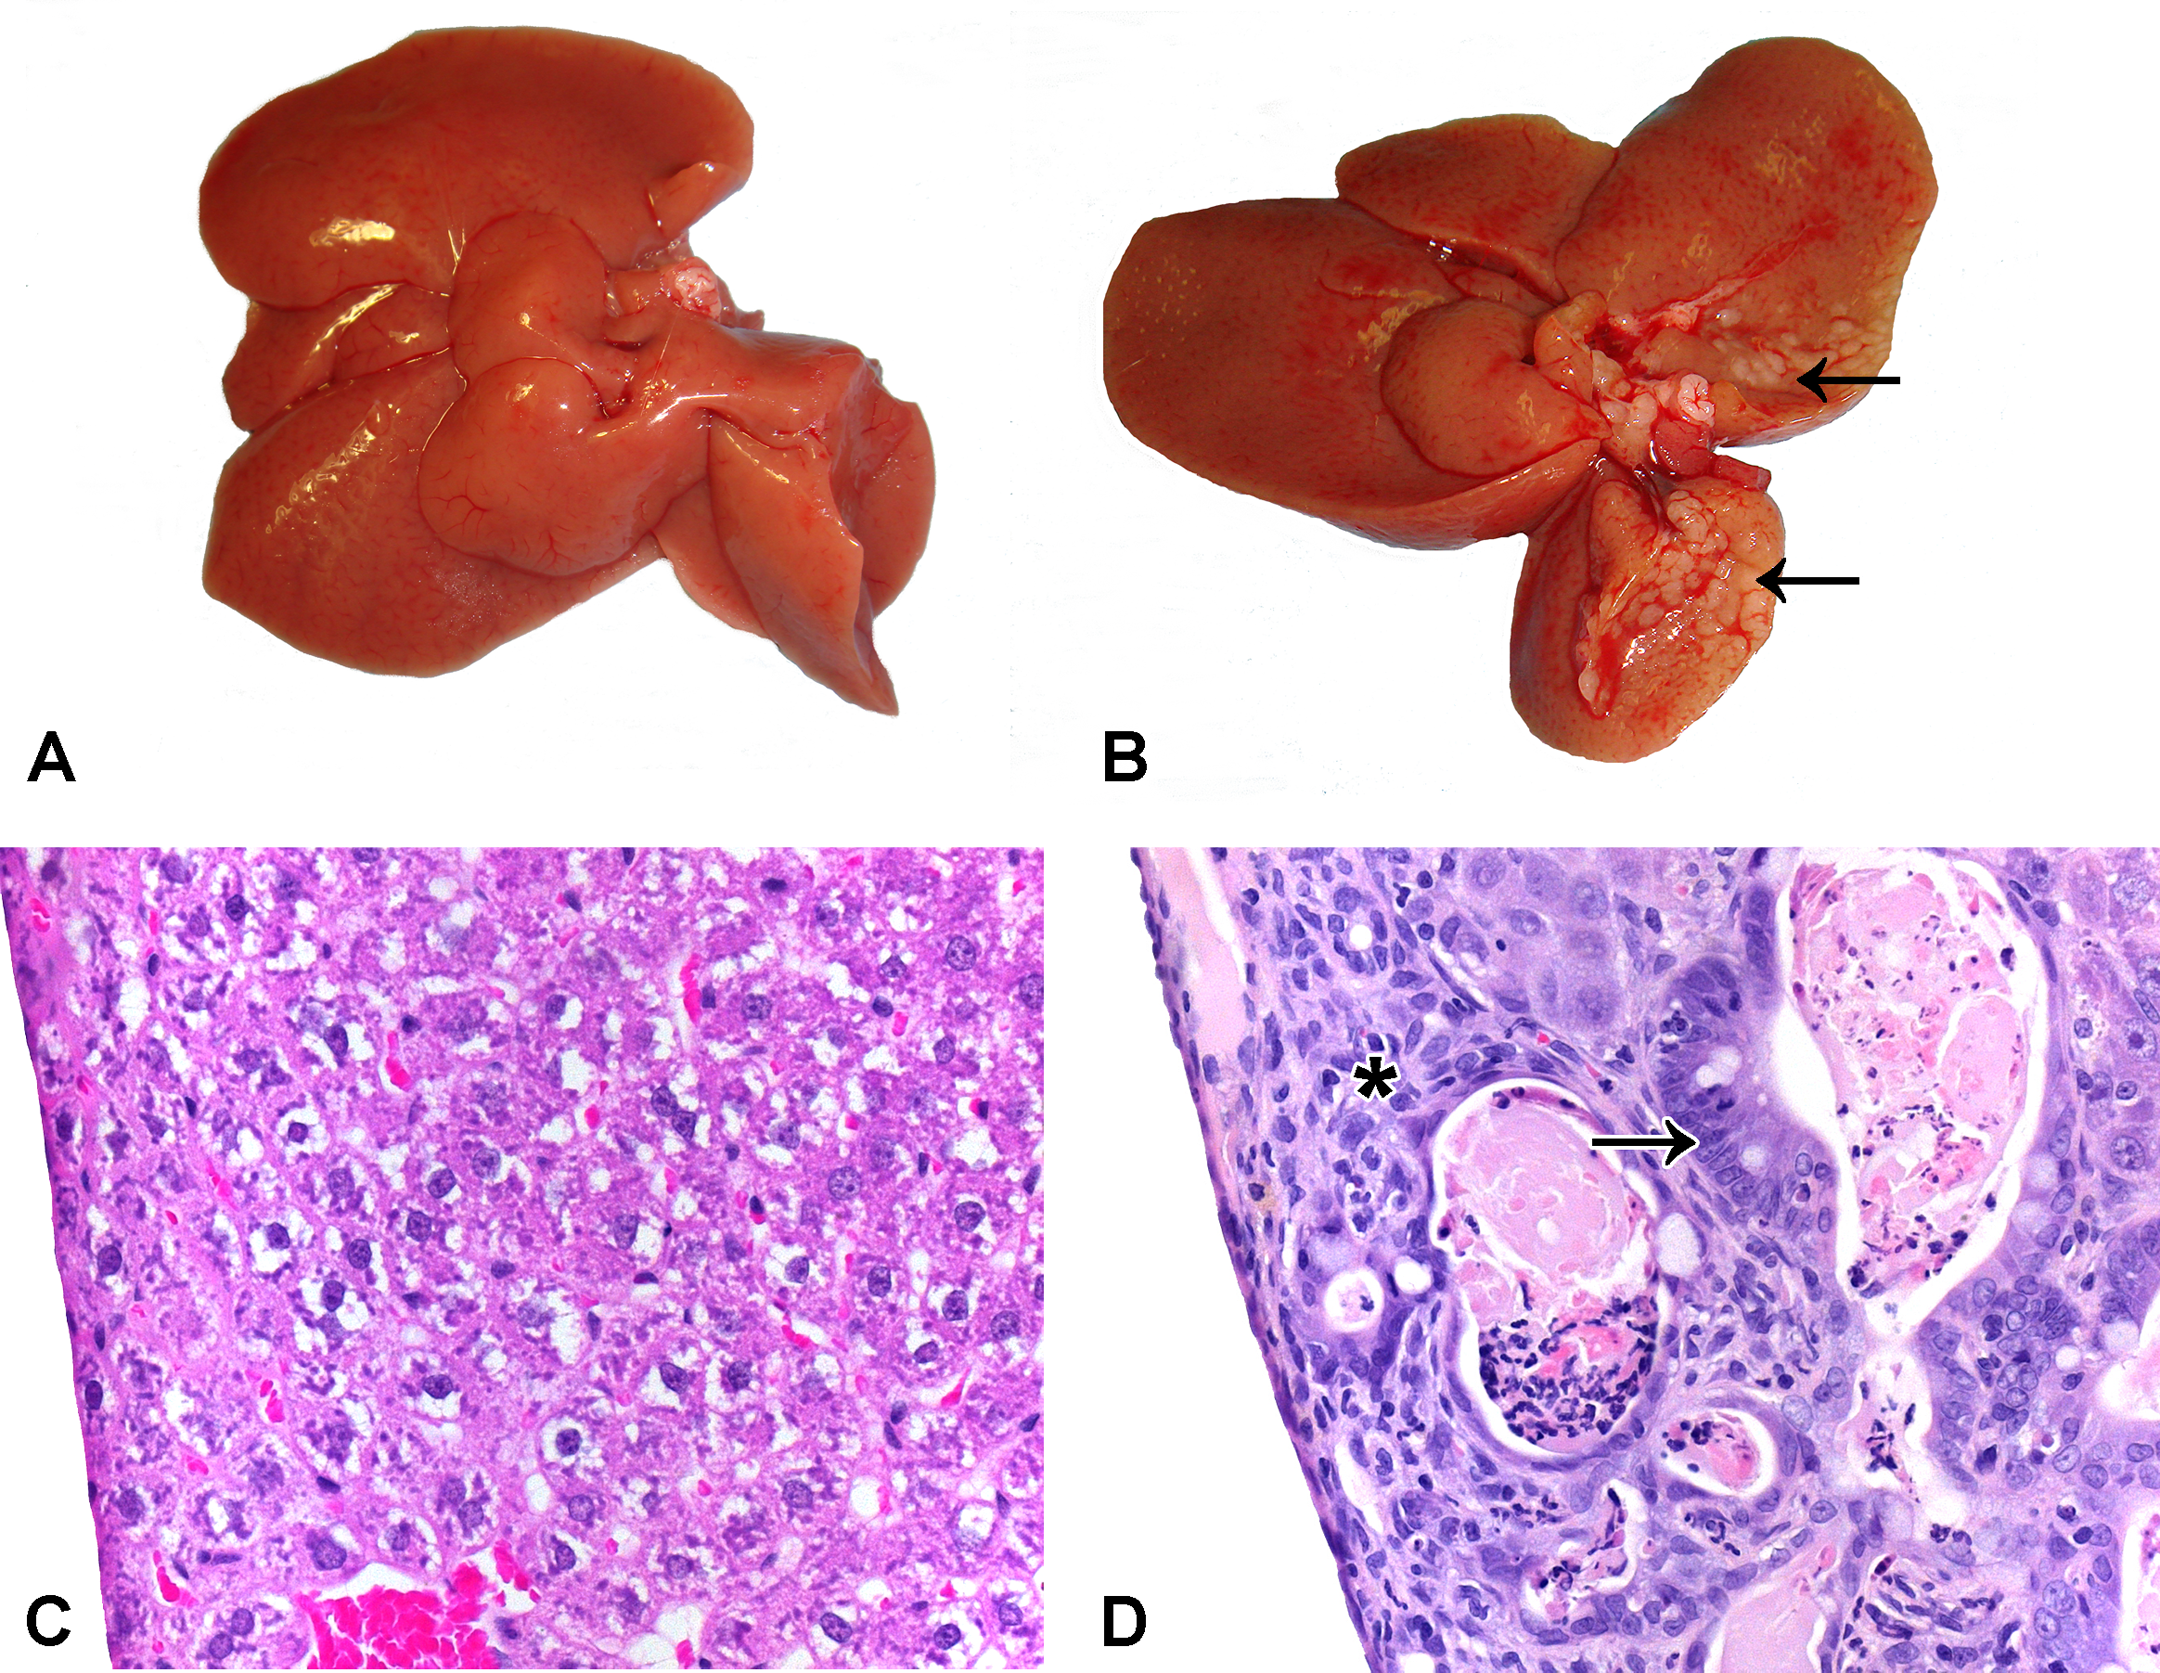
Gross photographs of the liver: (A) Control liver. (B) Liver of 25-mg/kg bw/day animal showing white nodules mostly notably on the left lateral and caudate lobes (Arrows). Photomicrographs of the liver: (C) Control liver. (D) Liver of 25-mg/kg bw/day animal showing subcapsular lesion. Hyperplastic bile duct of intestinal gland type morphology (arrow) and interstitial mix of inflammatory cells, oval cells, and mild fibrosis (*). 40×.
Histology Findings in the Liver
H&E-stained sections of formalin-fixed liver were examined by light microscopy. The lobes examined were left lateral, medial, right lateral, caudate, and papillary process. Histological lesions were detected in all dosed groups with progression of severity increasing with dose level.
The control group was used to establish a baseline for the incidence and severity of rare lesions, immediately subcapsular apoptotic hepatocytes, Kupffer cells with yellowish pigment and microfoci of inflammatory cells. Statistically significant changes in incidence of selected subcapsular histological lesions and affected liver lobes started at 1.5 mg/kg bw/day (Tables 5 and 6). At the 1.5 mg/kg bw/day, the inflammatory cell microfoci became segmentally continuous. The 3.0-mg/kg bw/day group displayed subcapsular, mild, focal oval cell hyperplasia. One animal of this group also had several hyperplastic bile ducts of normal appearing morphology. In the 6.0-mg/kg bw/day group, there was an increased mixed population of inflammatory and oval cells and rare to occasional hyperplastic bile ducts in the subcapsular region. The 12.0-mg/kg bw/day group showed an increased severity of the subcapsular lesion and periportal oval cell hyperplasia was found in 1 animal. A dose of 25.0 mg/kg bw/day produced increased subcapsular inflammatory cell populations and oval cell hyperplasia. Periportal areas were affected with occasional bridging of portal triads. Within these areas were hyperplasia of bile ducts of intestinal gland morphology (irregular size and shape of epithelium from squamous to tall columnar and occasional goblet cells) and interductal fibrosis, in some areas replacing hepatic parenchyma (Figure 1c and d). In this dose group, the medial, right lateral and caudate lobes were also affected.
Incidence of selected subcapsular histological lesions in the left lateral liver lobe.
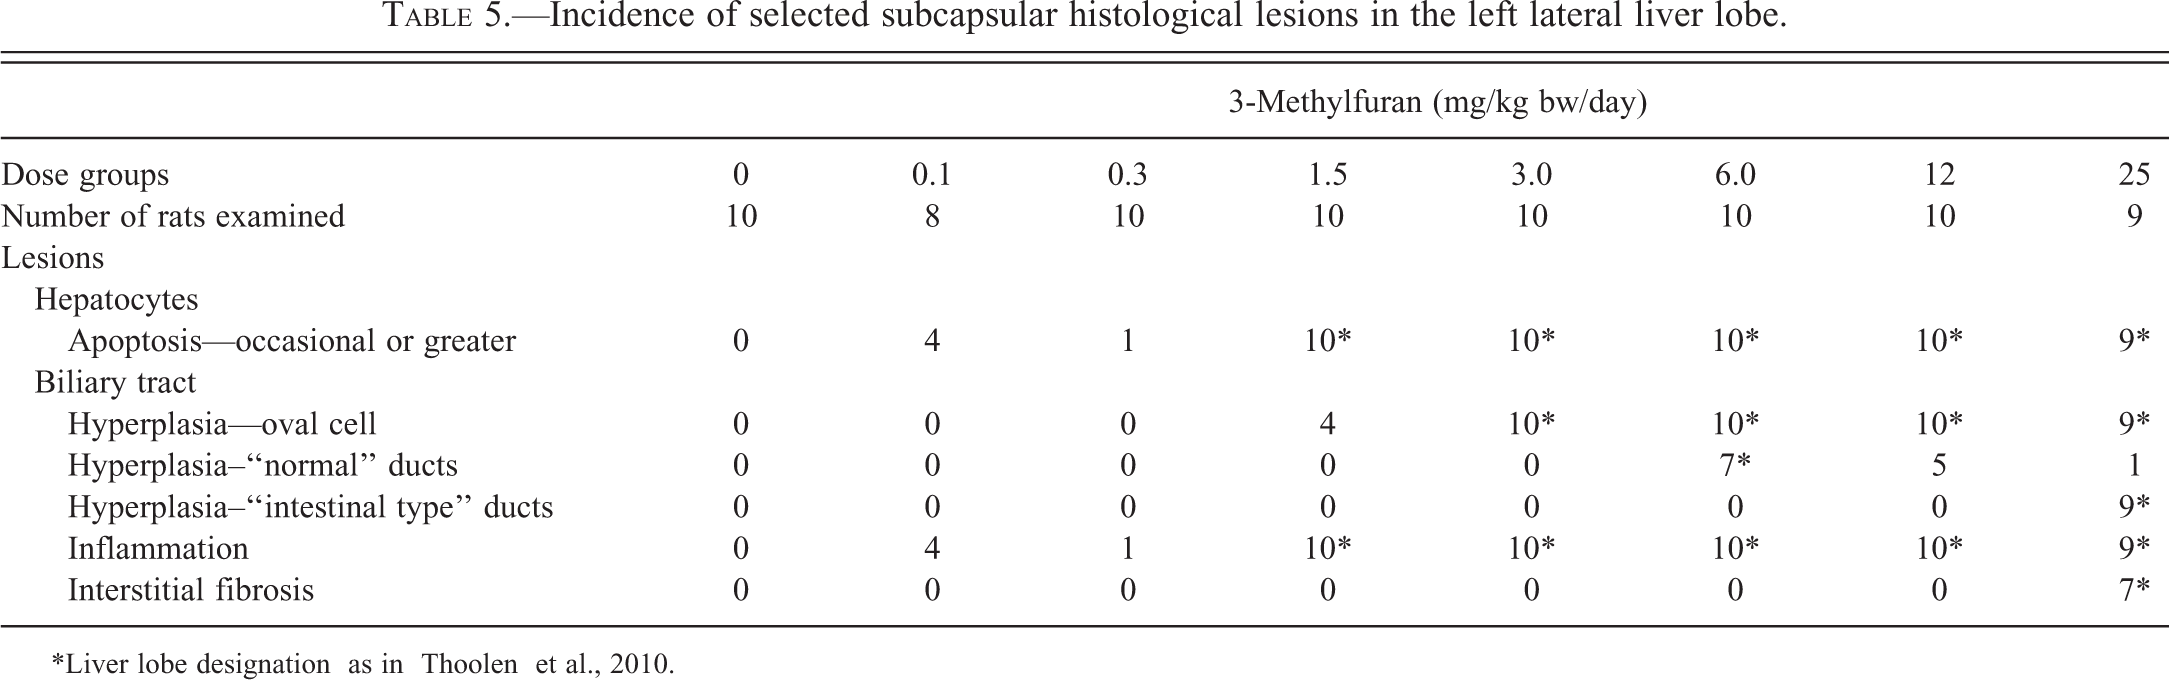
*Liver lobe designation as in Thoolen et al., 2010.
Incidence of affected liver lobes by dose group.
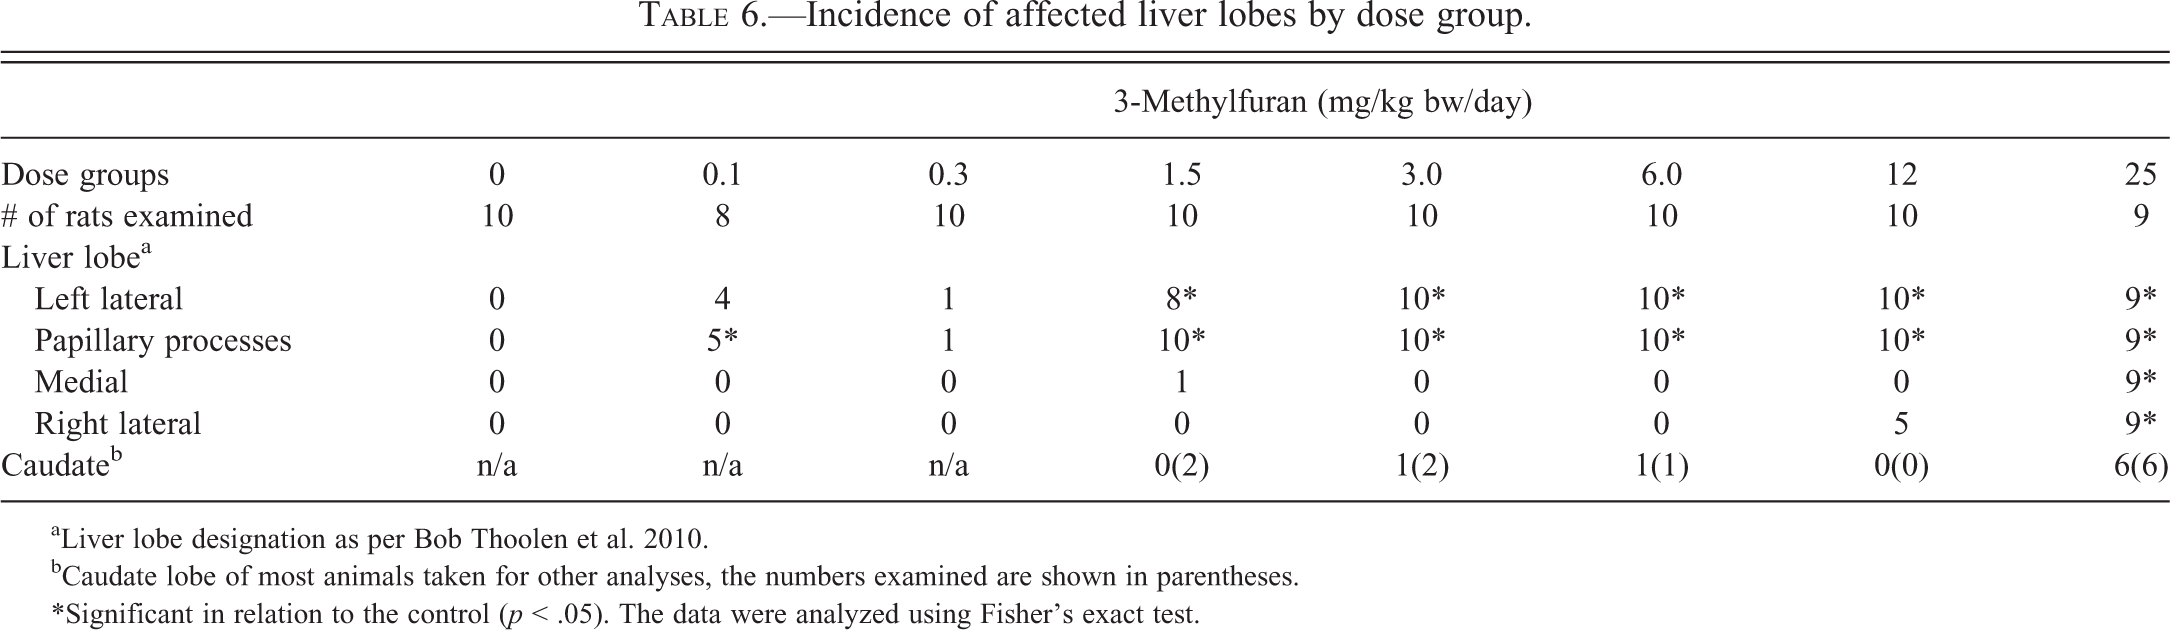
aLiver lobe designation as per Bob Thoolen et al. 2010.
bCaudate lobe of most animals taken for other analyses, the numbers examined are shown in parentheses.
*Significant in relation to the control (p < .05). The data were analyzed using Fisher’s exact test.
Microvesiculation of cytoplasm of zone 2 and 3 hepatocytes suggestive of fat vacuoles was evident with increasing severity in various lobes in the 3.0, 6.0, and 12.0-mg/kg bw/day dose groups and to a lesser extent in the 25.0-mg/kg bw/day group.
Gross Observations in Other Tissues
Three animals of the 25.0-mg/kg bw/day dose group had very small seminal vesicles. There were no gross findings in any other tissues.
Histology Findings in Other Tissues
The histology for the thymus, stomach, pancreas, thyroid, prostate/seminal vesicles, and adrenals were examined in the 0 and 25.0-mg/kg bw/day groups. Histological changes were seen only in the adrenal glands which showed an increased vacuolation of the cytoplasm in zona fasciculata cells.
Clinical Biochemistry
Physiological markers
Two of the serum enzymes indicative of liver injury were significantly affected. ALT and ALP were both significantly increased at the 25.0-mg/kg bw/day dose, by 28% and 42%, respectively, while the 10% increase seen in AST was not statistically significant (Table 7). Total bilirubin levels increased significantly (p < .05) at 6, 12.0, and 25.0 mg/kg bw/day, with an approximately 640% increase at the 25.0-mg/kg bw/day dose (Table 8). Bilirubin-D levels increased significantly (p < .05) at 12.0 and 25.0 mg/kg bw/day, with a 570% increase at the 25.0-mg/kg bw/day dose (Table 8). Cholesterol was significantly increased (p < .05) at 12.0 and 25.0 mg/kg bw/day. Triglycerides showed a significant and apparently dose-dependent decrease (p < .05) starting at 1.5 mg/kg bw/day (Table 8). Serum albumin levels and total protein were not significantly affected.
Liver enzyme parameters in male rats receiving 3-methylfuran.
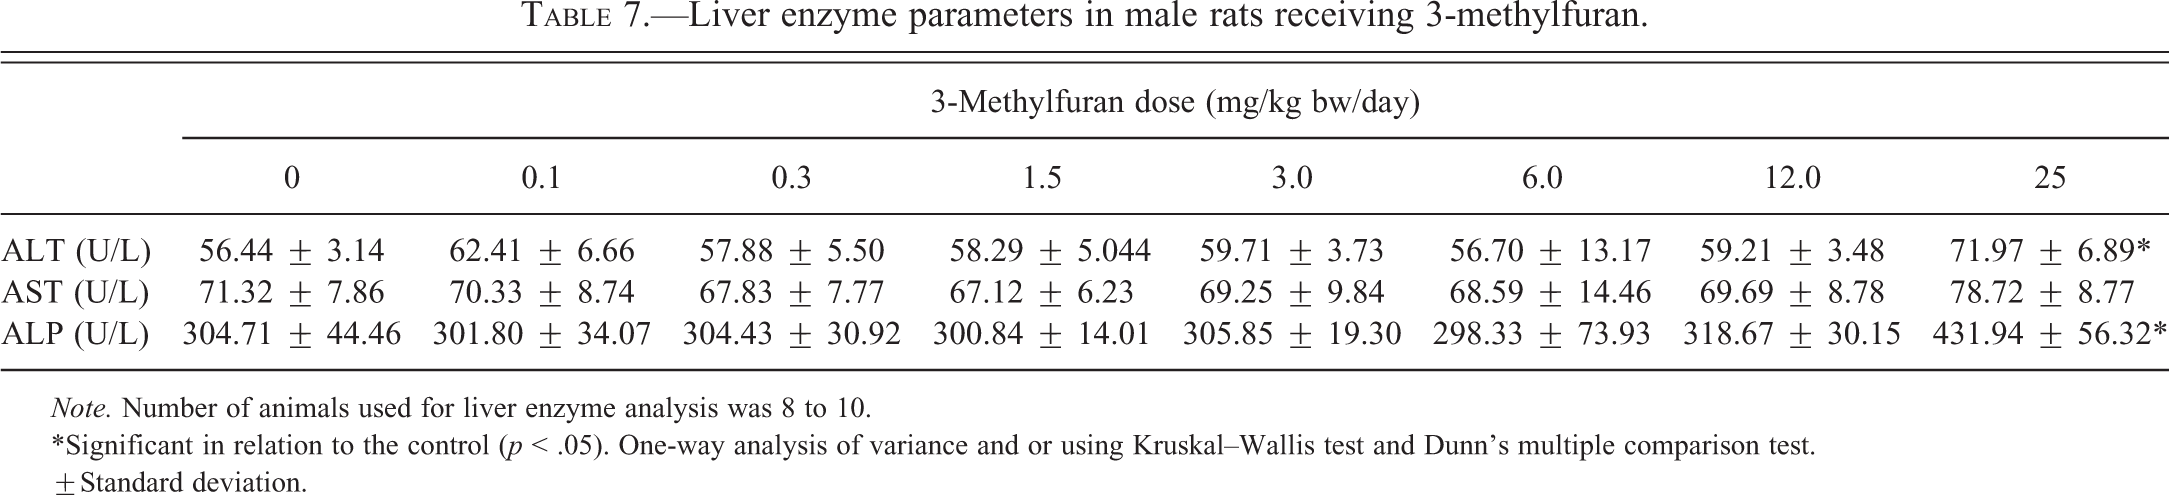
Note. Number of animals used for liver enzyme analysis was 8 to 10.
*Significant in relation to the control (p < .05). One-way analysis of variance and or using Kruskal–Wallis test and Dunn’s multiple comparison test.
±Standard deviation.
Clinical biochemistry parameters in male rats receiving 3-methylfuran.
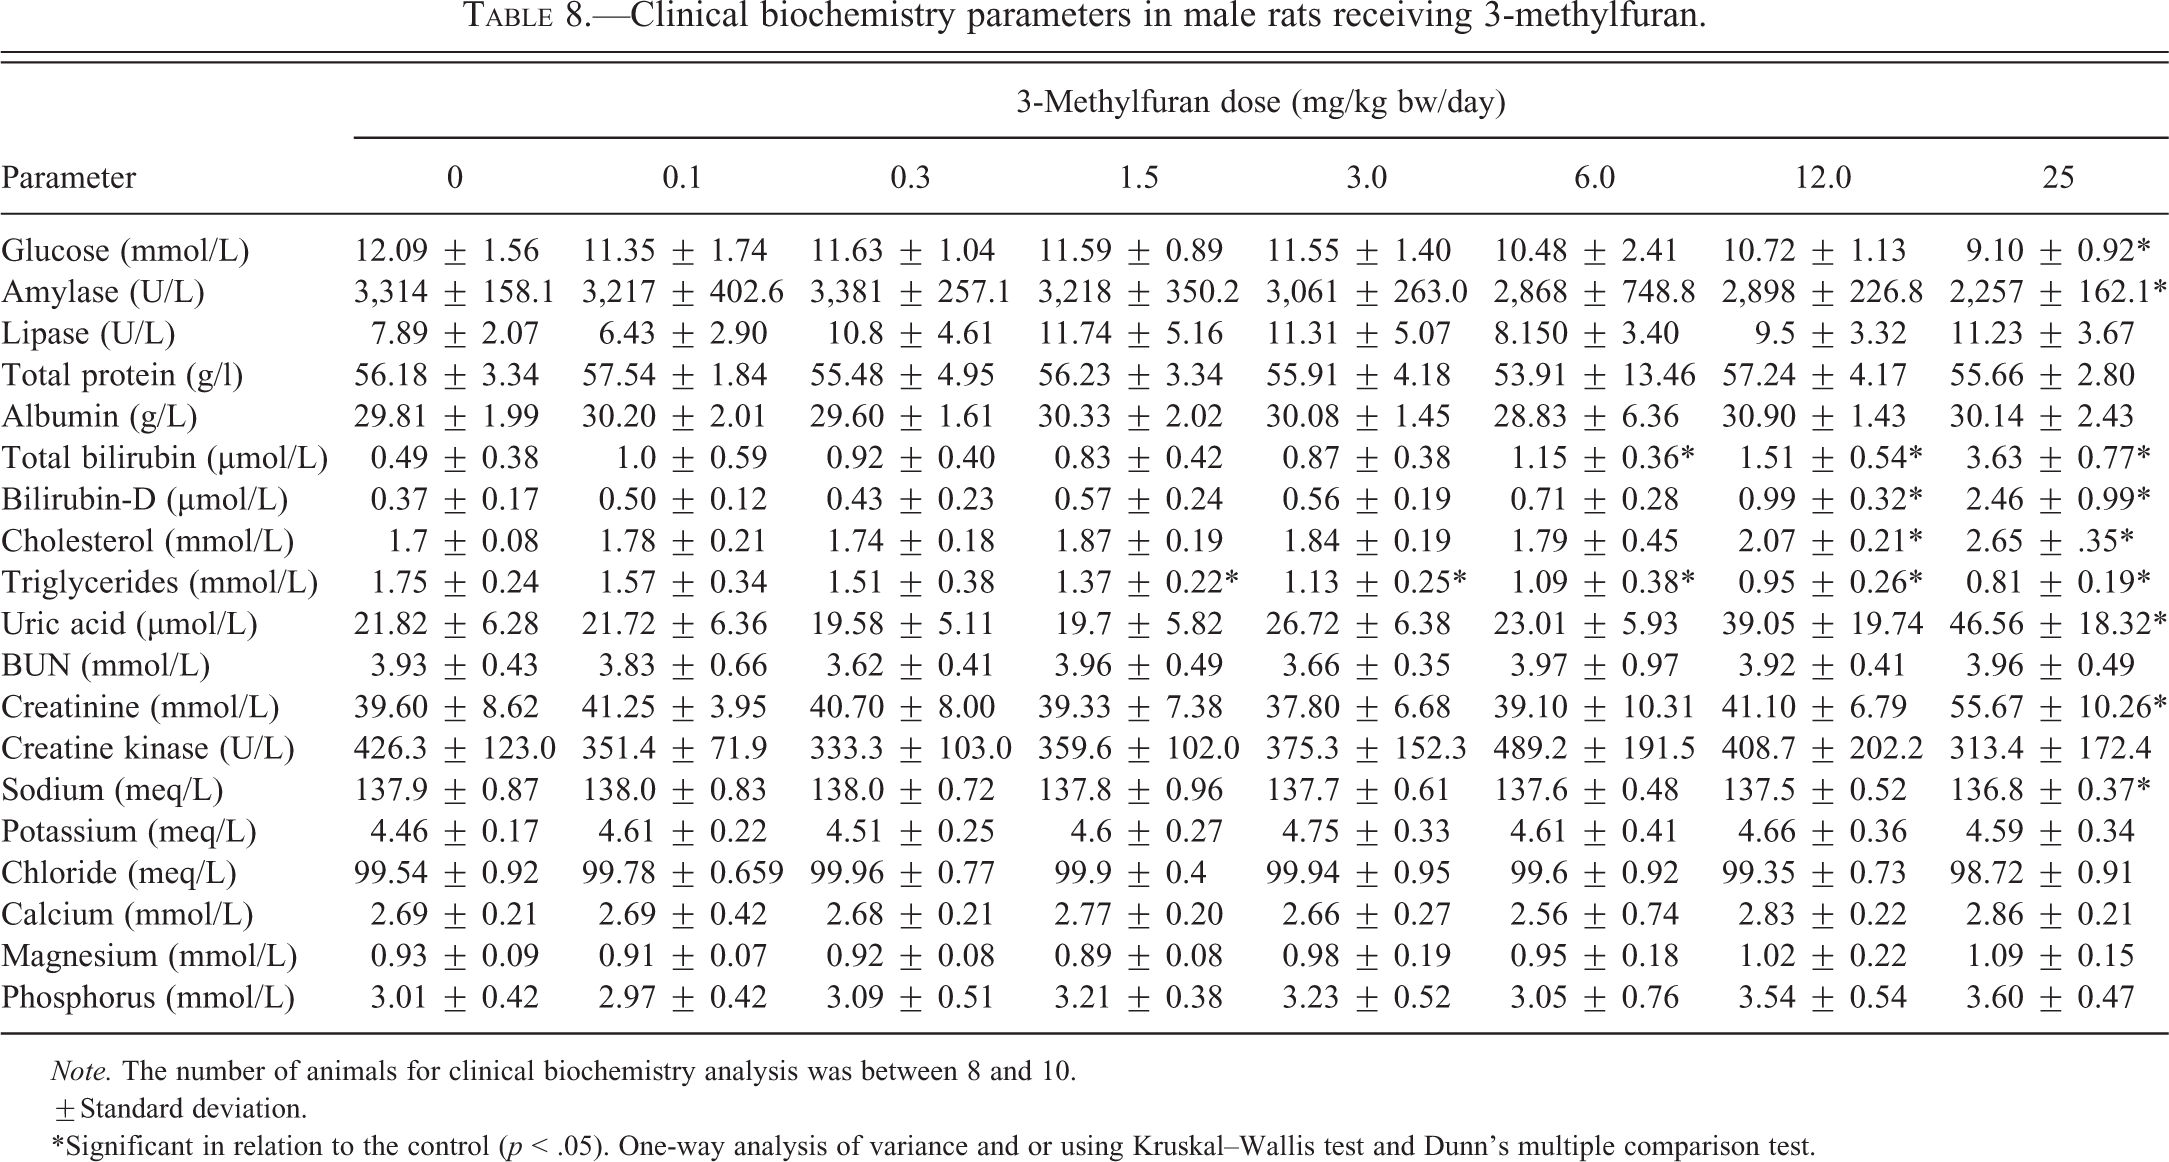
Note. The number of animals for clinical biochemistry analysis was between 8 and 10.
±Standard deviation.
*Significant in relation to the control (p < .05). One-way analysis of variance and or using Kruskal–Wallis test and Dunn’s multiple comparison test.
Serum amylase demonstrated a significant decrease (p < .05) at 25.0 mg/kg bw/day (Table 8). Creatinine showed a significant increase (p < .05) of approximately 41% at 25.0 mg/kg bw/day. Glucose decreased significantly (p < .05) at 25.0 mg/kg bw/day (25%), whereas uric acid increased significantly at 25.0 mg/kg bw/day (113%) and also showed a large increase (79%) without statistical significance at 12.0 mg/kg bw/day. Creatine kinase and lipase were not significantly changed.
Electrolyte changes
Serum electrolyte markers are shown in Table 8. The only statistically significant (p < .05) change was a decrease in sodium levels at the highest dose. However, the very small magnitude of the change (0.8%) suggests that this observation is not biologically relevant. BUN was not altered.
Hematology parameters
Hematology parameters are shown in Table 9. For RBC parameters, there was a statistically significant increase (p < .05) in RBC and a significant decrease (p < .05) in MCV and MCH at the 25.0-mg/kg bw/day dose group. There was also a significant increase (p < .05) in MCHC only at 6.0 mg/kg bw/day. However, as these changes were small (all < 5%) and not accompanied by changes in HCT or HGB levels, they may not be of biological significance. A substantial (12% and 24%) and statistically significant (p < .05) increase in PLT count was seen at 12 and 25.0 mg/kg bw/day, respectively. While the total WBC count did not change significantly at any dose, there was a significant increase (p < .05) in the number of neutrophils (42%) and monocytes (30%) at the 25.0-mg/kg bw/day dose group. At this same dose, a significant decrease (p < .05) in the number of lymphocytes (20%) was found. The levels of eosinophils and basophils did not change.
Hematology parameters in male rats receiving 3-methyfuran.
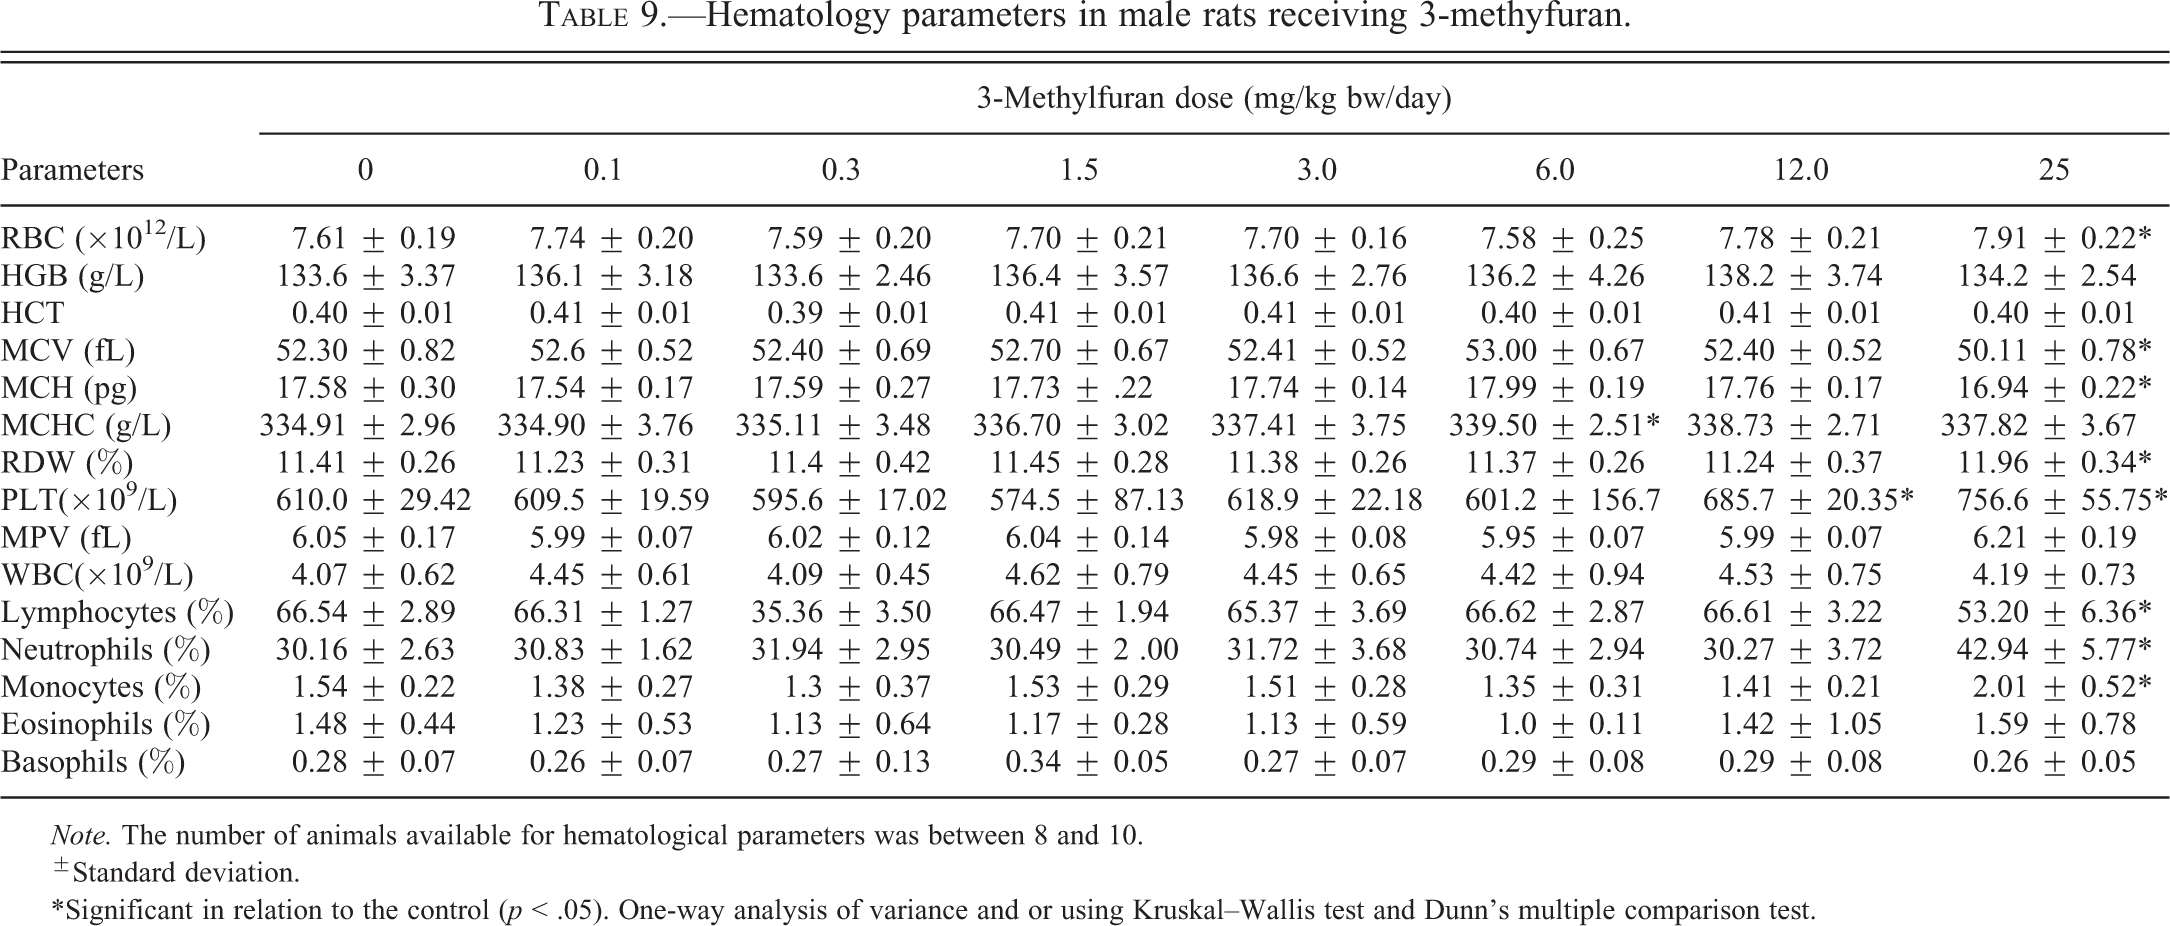
Note. The number of animals available for hematological parameters was between 8 and 10.
±Standard deviation.
*Significant in relation to the control (p < .05). One-way analysis of variance and or using Kruskal–Wallis test and Dunn’s multiple comparison test.
Endocrine functions
Levels of both thyroid hormones, T4 and T3, were above those of controls in all treated groups (Table 10). For T3, increases were statistically significant (p < .05) at 0.3, 1.5, 3.0, and 12.0 mg/kg bw/day and in each case about 20%. For T4, increases were statistically significant (p < .05) at 0.3, 1.5, 3.0, 6.0, and 12.0 mg/kg bw/day and ranged from 17% to 26%.
Thyroid hormones levels in male rats receiving 3-methylfuran.
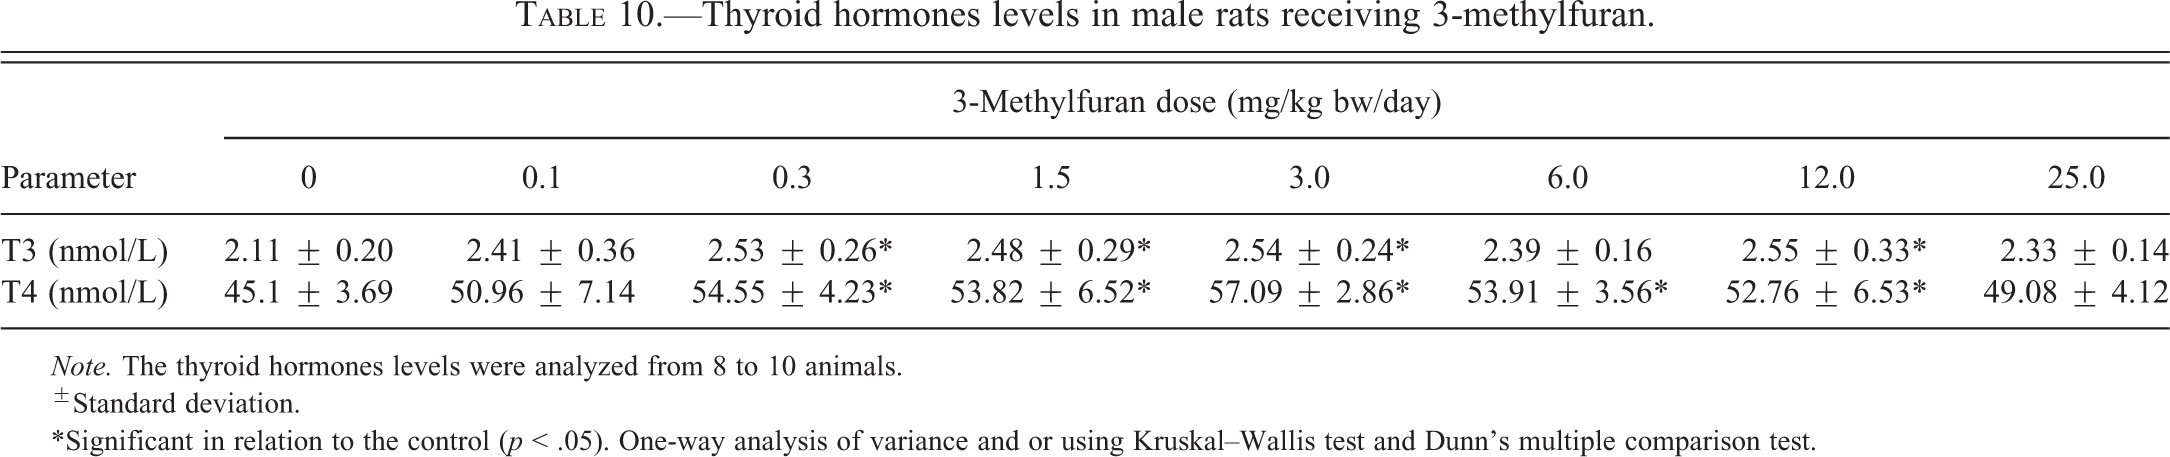
Note. The thyroid hormones levels were analyzed from 8 to 10 animals.
±Standard deviation.
*Significant in relation to the control (p < .05). One-way analysis of variance and or using Kruskal–Wallis test and Dunn’s multiple comparison test.
Discussion
This 28-day pilot study with Fischer 344 rats was conducted to determine the dose range to be used in a subchronic study assessing the oral toxicity of 3-methylfuran. The selection of the doses used in this pilot study was based on the doses used in our earlier 28-day study on 2-methylfuran (Gill et al. 2013).
The 20% reduction in body weight in rats receiving 25.0 mg/kg bw/day of 3-methylfuran in the diet was probably related to the significant decrease in food consumption of the same magnitude (22%) in this group. The decreases in the absolute weights of heart, spleen, thymus, and testes in the 25.0-mg/kg bw/day group were probably related to the decrease in body weight at this dose. It is noteworthy that the absolute liver weight did not change in the high-dose group despite the large reduction in body weight, and in the second highest dose group (12.0 mg/kg bw/day) was in fact significantly higher than in the control group. There were large, dose related (16% and 33%, respectively), and statistically significant increases in liver weights relative to body weights for the 12.0 and 25.0-mg/kg bw/day groups. This suggests a direct toxic effect of 3-methylfuran on the liver, a conclusion that is supported by the histopathological findings.
Relative organ weights in the high-dose group were also increased for the right and left kidneys (21% and 24%, respectively), spleen (8%), and both testes (10–12%). The fairly large increases in relative kidney weights could also be biologically meaningful. Although, in contrast to the liver, no histological changes were observed in the kidneys, serum levels of uric acid and creatinine were significantly increased in this dose group (by 113% and 41%, respectively), which could be indicative of kidney failure. The smaller increases in the relative weights of the spleen and testes could simply reflect that the reduction in weight of these organs was not directly proportional to the reduction in body weight.
Changes in organ weights can be sensitive indicators of chemical intoxication but can also simply reflect changes in body weight. Brain weight is considered less prone to body weight changes and the organ-to-brain weight ratio can be useful when normalizing the variability in organ weight, especially when body weight changes confound the interpretation of organ weight data (Michael et al. 2007). In this study, the absolute brain weight showed a small but statistically significant decrease of 4.5% at the high dose. Relative to brain weights, only the heart weight was significantly reduced in the high-dose group, while the weights of thymus, spleen, and testes (whose absolute weights were significantly reduced) were reduced without statistical significance. The tendency of the organ-to-brain weight ratio to follow the trend of absolute organ weights supports the view that the reduced weights of these organs result from a reduction in body weight. In contrast, as was the case with absolute liver weights, liver weights relative to brain weights did not follow that trend and were increased (12–13%) without statistical significance in the two highest dose groups.
The administration of 3-methylfuran resulted in histological changes only in the adrenals and the liver. In the adrenals, the vacuolation of cytoplasm in zona fasciculata cells observed only at the 25 mg/kg/bw/day was likely a secondary effect of the liver lesions (Frith et al. 2000).
In the liver, both gross and histological changes were observed, and these were similar to the ones reported in our earlier studies with furan (Gill et al. 2010, 2011) and 2-methylfuran (Gill et al. 2013). As in those earlier studies, there was a progression with increasing dose of 3-methylfuran in the number, type, and severity of liver lesions, ranging from an occasional apoptotic hepatocyte, microfoci of inflammatory cells and Kupffer cells with yellowish pigment to cholangiohepatitis to cholangiofibrosis. The observed microvesiculation of the cytoplasm of hepatocytes in the various lobes suggestive of fatty change might be related to the hepatotoxic lesions induced by 3-methylfuran (Thoolen et al. 2010).
These lesions were accompanied by changes in clinical parameters related to liver injury. The observations of clinical chemistry suggest that, as with furan and 2-methylfuran, 3-methylfuran affects both the hepatocytes and the bile duct system in the liver. At the 25.0-mg/kg bw/day dose, increases were seen in serum levels of the hepatic “leakage” enzymes ALT and AST (without statistical significance in the latter), indicative of damage to the hepatocytes, and in ALP, which is more indicative of bile duct damage (Ramaiah 2007). Statistically significant reductions in serum triglycerides were observed at 3.0 mg/kg bw/day and above. Such decreases can be a biomarker of hepatotoxicity, most frequently of hepatocellular necrosis, that is independent of nutritional status in the rat (Provost, Hanton, and Le Net 2003). Dose-dependent and statistically significant decreases in triglycerides were also observed in the 90-day gavage study with furan (Gill et al. 2010). Substantial, dose-related, and statistically significant increases were seen in levels of cholesterol, bilirubin-D, and total bilirubin (55%, 570%, and 640%, respectively, at 25.0 mg/kg bw/day). Increases in cholesterol can be indicative of biliary obstruction or an acute or subacute necrosis of the liver (Mitruka and Rawnsley 1981). Increases in serum bilirubin can result from cholestasis (retention of bile) subsequent to impairment of intrahepatic or extrahepatic bile flow, cytotoxicity to the liver or from excessive hemolysis (Klaassen and Watkins 1999). This retention of bile can explain the yellowish pigment observed in the gross morphology. Reduced levels of glucose (25% reduction at the 25.0-mg/g bw/day dose) could also reflect impaired liver function together with reduced food intake. In the furan study, glucose levels in male rats were reduced by 22% at the high dose of 8.0 mg/kg bw/day although food intake was not significantly affected (Gill et al. 2010).
Serum amylase was decreased in a generally dose-dependent way starting at 3.0 mg/kg bw/day and statistically significant at 25.0 mg/kg bw/day. Dose dependently decreased levels of amylase were also found in male and female rats after treatment with furan (Gill et al. 2010) and 2-methylfuran (Gill et al. 2013). Amylase levels are decreased in liver disease, including hepatitis (Bhutta and Rahman 1971) and the decreased levels observed here could reflect the inflammation and necrosis of the liver induced by 3-methylfuran. Decreases in pancreatic and salivary amylases, reflected in lower serum levels, have been reported during alcohol consumption, which also increases the excretion of amylase in the urine (Maruyama et al. 2003). Perhaps the effects of furan, 2- and 3-methylfuran on amylase levels could also involve nonhepatic mechanisms, similar to those of alcohol.
The very large and significant increases in creatinine and uric acid (40% and 113%, respectively, at 25.0 mg/kg bw/day) are suggestive of renal injury, although there were no histological changes in either of the kidneys. However, the weights of both kidneys relative to body weight were also significantly increased (20–24%) in the high-dose group; the absolute kidney weights in this group did not change relative to controls despite a 20% decrease in body weight. These findings could possibly reflect increased demands on or changes in the functioning of this organ.
To determine whether 3-methylfuran interferes with thyroid hormone homeostasis, serum T3 and T4 levels were measured. Levels of T3 were significantly increased by approximately by 20% at 0.3, 3.0, and 12.0 mg/kg bw/day, while T4 levels were significantly increased by 17–20% at all doses except 0.1 and 25.0 mg/kg bw/day. Increases in levels of T3 and T4 were seen in our 90-day study with furan in male rats although less so in female rats (Gill et al. 2010). In the 28-day study with 2-methylfuran in male rats (Gill et al. 2013), an increase in dose resulted in an increase in the level of T3 starting at 1.5 mg/kg bw/day. Interestingly, statistically elevated levels of T4 were seen at 1.5 and 3.0 mg/kg bw/day, but not at the lowest dose of 0.4 mg/kg bw/day, nor at the 3 highest doses of 6.0, 12.0, and 25.0 mg/kg bw/day. This pattern is similar to that seen in the present study with 3-methylfuran, in which T4 levels peaked at 3.0 mg/kg bw/day, suggesting the possibility that these 2 derivatives of furan may be acting as endocrine disruptors.
More than 85% of the hormone released by the thyroid gland is in the form of T4. The active form of thyroid hormone, T3, is derived from the conversion of T4 by the type 1,5,-monodeiodinase enzyme located primarily in the liver and the kidney (Christian and Trenton 2003). Changes in levels of T3 seen with furan, 2-methyulfuran, and 3-methylfuran can therefore reasonably be attributed, at least in part, to the extensive liver damage caused by all 3 chemicals. However, thyroid hormone levels could be influenced by direct effects on the thyroid gland itself, on the liver and kidney, as well as on the hypothalamus and pituitary gland, which regulate the thyroid gland through thyrotropin-releasing hormone (TRH) and thyroid-stimulating hormone (TSH). It is possible that furan and its derivatives could affect enzyme activity in multiple target organs through mechanisms that are not detected histologically. The nondose-related changes in T4 levels seen with 2-methylfuran and 3-methylfuran, and the sex differences seen with furan on thyroid hormones (Gill et al. 2010), suggest that furan and its derivatives may have various and complex interactions with metabolic functions.
The hematopoietic system is one of the most sensitive targets of toxic compounds and is an important index of physiological and pathological status. While the total WBC count did not change, there was a statistically significant increase in the number of neutrophils (42%) and monocytes (31%) and a statistically significant decrease in the number of lymphocytes (20%) at the 25.0-mg/kg bw/day dose. Lymphocytes are mediators of the specific immune response against pathogens, while neutrophils are responsible for phagocytosis (Sacher and McPherson 1991). An increase in neutrophil count is associated with acute insult to the body whether in the form of infection or not. Monocytes are also phagocytic. The increase in neutrophils and monocytes at the expense of lymphocytes is therefore suggestive of a response to tissue injury in the liver. Interestingly, the same statistically significant trends toward increases in neutrophils and monocytes, and a decrease in lymphocytes, were seen with 2-methylfuran (Gill et al. 2013), but in the present study the change in numbers were more dramatic.
RBC parameters were largely unaffected by 3-methylfuran. Even when statistically significant differences were seen at 25.0 mg/kg bw/day (increase in RBC and decrease in MCV and MCH), these changes differed from controls by only 4%. Similarly, furan was found not to affect hematology parameters in male or female rats (Gill et al. 2010), while the data on 2-methylfuran supported a slight effect on RBC destruction and the stimulation of hematopoiesis (Gill et al. 2013).
PLT numbers were significantly elevated (12% and 24%) at 12 and 25.0 mg/kg bw/day. Interestingly, in the 28-day study with 2-methylfuran in male rats, the same dose groups (12 and 25.0 mg/kg bw/day) showed similar increases in the PLT counts (Gill et al. 2013). In the 90-day study with furan, the high dose of 8.0 mg/kg bw/day increased the PLT count by 19% in males and 24% in females (Gill et al. 2010). An increased PLT count is most often caused by a reaction to injury or inflammation and can also be associated with malignant neoplasms of the liver and other organs (Mitruka and Rawnsley 1981). The liver damage caused by furan, 2-methylfuran and 3-methylfuran may have caused or contributed to the increased PLT count observed in all 3 studies. Direct effects on the bone marrow are another possibility.
In this pilot study, the liver was the major target organ, as indicated by changes in gross, histological, and clinical parameters. In addition, the absolute liver weight of the 25-mg/kg bw/day group did not change despite a 20% drop in body weight and increased in the 12-mg/kg bw/day group; relative liver weight increases were 34% and 16%, respectively, in these groups. Although there were changes in the weights of other organs, these were not accompanied by histological changes. Based on this pilot study and our previous subchronic study on the parent molecule, furan, we will be using 0.0, 0.03, 0.10, 0.5, 2.0, and 8.0 mg/kg bw/day to determine the NOAEL for 3-methylfuran.
Footnotes
Acknowledgments
We thank Véronique Gagné, Jocelyn Souligny, Keith Snider, Don Demers, Dominque Patry, and Michel Sanche for their help during the animal phase of the study. We also thank Dr. Martha Navarro for the consultation on the health status of the animals and Dr. Michael Barker for helping us with the photographs.
The author(s) declared no potential conflicts of interest with respect to the research, authorship, and/or publication of this article.
The author(s) received no financial support for the research, authorship, and/or publication of this article.