
Abstract
In most thermally treated products, a series of alkylated furan derivatives have been found, in particular 2-substituted alkylfurans such as 2-methylfuran. These methyl analogs are metabolically activated in a similar fashion as the parent furan, yielding highly reactive unsaturated dialdehydes. There is currently limited toxicological data available for 2-methyl furan exposure by any route that makes conducting a risk assessment difficult. In this pilot study, we report the general toxicology findings affecting tissue morphology, histopathology, clinical biochemistry, and hematology in a 28-day gavage study. The liver was the primary target organ that developed dose-dependent toxicity. Relative liver weights were increased by 42% at 25.0 mg/kg/body weight (bw)/day. Histological changes in the liver were observed at 0.4, 1.5, 3.0, 6.0, 12.0, and 25.0 mg/kg bw/day. These changes were not accompanied by clinical changes in the serum enzyme markers such as alanine transaminase, alkaline phosphatase, and aspartate transaminase. Clinical biochemistry markers for kidney were altered, but these were not accompanied by histological changes. The prostate was significantly decreased in size at the 25.0 mg/kg bw/day dose of 2-methyfuran. Some hematological parameters were also altered.
Keywords
Introduction
Heat-induced food contaminants have attracted the attention of both the scientific community and the public in recent years (Moser et al. 2009; Crews and Castle 2007; Wenzl, Lachenmeier, and Gokman 2007; Becalski et al. 2010). Recent surveys performed by various health agencies, including the U.S. Food and Drug Administration (FDA), Health Canada (Becalski et al. 2010), European Food Safety Authority (2004), and the Swiss Office of Public Health (Reinhard et al. 2004), have all found that furan is present in a wide range of foods up to levels greater than 240 µg/kg. It is found in cooked and canned meats, roasted coffee, beer, and wheat breads (Bolger, Tao, and Dinovi 2009; Crews and Castle 2007; Maga 1979; Morehouse et al. 2008). Derivatives of furan are also used as flavoring agents in food and tobacco products (Lucas, Putman, and Hallagan 1999; Maga 1979). Furan and its derivatives have received little attention until recently, when the International Agency for Research on Cancer (1995) classified it as “possibly carcinogenic to humans” (Group 2B).
In most thermally treated products, the parent chemical furan has been found to be accompanied by a series of alkylated analogs such as 2-methyl, 3-methyl, and 2-ethylfuran, of which 2-substituted alkylfurans are the most common (Maga 1979; Becalski and Seaman 2005; Mark et al. 2006; Becalski et al. 2010). The methyl analogs of furan are metabolically activated in a similar fashion as the parent furan, yielding highly reactive, unsaturated dialdehydes (Ravindranath, Burka, and Boyd 1984; Ravindranath and Boyd 1985). Estimates of dietary exposure have been calculated by conducting surveys of furan levels within foods found in Canada (Becalski et al. 2005, 2010). The levels of methylfurans in jarred foods approached 50% of the concentration of furan. Brewed coffee had estimated levels of 2-methylfuran that were twice those of furan (Becalski et al. 2010). Based on a deterministic exposure assessment, the average intakes of furan alone and of furan and its derivatives by adults were estimated to be 0.37 and 0.71 µg/kg/body weight (bw)/day, respectively. In the case of toddlers (1–4 years), mean exposures to furan alone and together with its derivatives were estimated to be 1.12 and 1.34 µg/kg/bw/day, respectively (Becalski et al. 2010). Since furan and its derivatives are found at high levels in jarred baby foods, infants and children are potentially at risk. Children are also highly vulnerable to chemicals because their metabolic pathways can differ from those of adults; thus, they are less able to metabolize toxicants (Suk, Murray, and Avakian 2003).
Furan and 2-methylfuran were found to be potent hepatotoxins (Wiley et al. 1984; Ravindranath et al. 1986). Little toxicological information is available for 2-methylfuran where the preferred route of administration was by inhalation (Egle and Gochberg 1979) or intraperitoneal injection. Results from inhalation studies of furan, 2-methylfuran, and 3-methylfuran were all found to induce pulmonary toxicity (Ravindranath et al. 1986). 2-Methylfuran has been found to cause centrilobular necrosis of the liver as well as pulmonary bronchiolar lesions in mice (Franklin and Boyd 1978). It is activated by rat microsomal systems (Ravindranath and Boyd 1985) and metabolites of radiolabeled 2-methylfuran administered intraperitoneally can bind to both DNA and protein (Ravindranath et al. 1986; Ravindranath and Boyd 1991). To date, there are no toxicological studies in rodents identifying a no observable adverse effect level (NOAEL) for 2-methylfuran. This pilot study was designed to determine the dose range of 2-methylfuran needed to determine the NOAEL.
Materials and Methods
Test Compound and Dosing Solutions
In the initial study, 2-methlyfuran was mixed with Mazola® corn oil to final concentrations of 0.0, 6.0, 12.0, 25.0, 50.0, 100.0, and 200.0 mg/kg bw/day. However, animals at the three highest doses were either found dead within 24 hr or sacrificed after 48 hr due to their clinical symptoms. Hence, the 50.0, 100.0, and 200.0 mg/kg bw/day doses were eliminated and 0.4, 1.5, and 3.0 mg/kg bw/day dose groups were added.
Each dose was prepared separately on a volume-to-weight (v:w) ratio. Chilled corn oil was weighed to the nearest milligram in a conical flask. Chilled furan solution was drawn up in a Hamilton syringe, measured to the nearest microliter, injected into the corn oil, and mixed using a magnetic stir bar. Dosing solutions were dispensed into brown glass vials and capped with plastic closures adapted with silicon septa. Dosing solutions were stored in a refrigerator at 4°C. Fresh solutions were prepared every 14 days. Previous studies have demonstrated the stability of furan dosing formulations for at least 14 days under these conditions (National Toxicology Program 1993).
Animal Study
Male Fischer 344 rats were purchased from Charles River Laboratories Inc. (St. Constant, QC) at 5 to 6 weeks of age and acclimatized for 12 days before being randomized and assigned to a particular dose group (10/group). Animal handling and treatment procedures complied with the Guidelines of the Canadian Council on Animal Care and were approved by the Health Canada Animal Care Committee (Ottawa, ON). Rats were identified by tail markings and housed 2 per cage. Animals had ad libitum access to Purina Rodent Chow 5001 (Agribands Purina Canada, East Strathroy, ON) and city tap water. The temperature and humidity of the room were targeted for 18° to 26°C and 30 to 70%, respectively, and monitored continuously. Animals were observed for signs of illness twice daily during weekdays and once daily on weekends and holidays. Sentinel animals for health surveillance were housed in the same room as study animals and remained disease-free throughout the study. Animals were gavaged daily (7 days/week) for 28 days with 2-methylfuran at doses of 0.0, 0.4, 1.5, 3.0, 6.0, 12.0, or 25.0 mg/kg bw/day. The 2-methylfuran was administered in corn oil at a maximum volume of 5.0 ml/kg bw. The animals were weighed daily prior to gavage. Food consumption was measured on a weekly basis.
Organ Weights, Gross Necropsy, and Histopathology
At the end of the study, each animal was killed by exsanguination via the abdominal aorta under isofluorane anesthesia and a complete gross examination was performed. Liver, heart, kidneys, thymus, spleen, stomach, thyroid, adrenals, pancreas, testes, epididymides, prostate, and seminal vesicles were collected for histological examination. The testes were immersion fixed in Bouin’s solution. The other tissues were immersion fixed in 10% neutral buffered formalin. Liver, hearts, kidneys, spleen, thymus, testes, prostate, and seminal vesicles were weighed prior to fixation. Paired organs were weighed separately. After weighing, the right kidney, spleen, and thymus were each cut in cross section where half was retained in either 10% neutral buffered formalin or collected fresh for other analyses.
After fixation, the tissues were routinely embedded in paraffin and 5-µm sections were cut. Slides were stained with Mayer’s hematoxylin and eosin and examined by light microscopy. For the liver, all dose groups were examined. Only the control and 25.0 mg/kg bw/day dose groups were examined for the stomach, thyroid, parathyroid (when present in thyroid section), adrenals, thymus, spleen, pancreas, testes, epididymides, prostate, seminal vesicles, and heart.
Photographs were taken on an Axiophot Zeiss microscope (Germany) with a digital camera linked to an image analysis system (Progres camera, ROCHE image analysis, and archiving system).
Analysis of Serum Clinical Biochemistry
At the time of sacrifice, blood from the abdominal aorta was collected in SST Vacutainer® tubes (Becton-Dickinson, Franklin Lakes, NJ) and allowed to clot at room temperature. Serum was separated by centrifugation at 3,000×g and stored at −20°C until analysis. Clinical biochemistry was performed using a Beckman Synchron CX5 Clinical Biochemistry System (Beckman Instrument Canada Inc., Mississauga, ON). The measured markers were serum amylase (U/L), albumin (g/L), alkaline phosphatase (ALP-U/L), alanine transaminase (ALT-U/L), aspartate transaminase (AST-U/L), bicarbonate (mmol/L), total bilirubin (µmol/L), calcium (mmol/L), chloride (mmol/L), cholesterol (mmol/L), creatinine (µmol/L), creatine kinase (U/L), glucose (mmol/L), lipase (U/L), magnesium (mmol/L), phosphorous (mmol/L), potassium (mmol/L), sodium (mmol/L), sodium:potassium ratio, total protein (TP-g/L), triglycerides (mmol/L), thyroxine (T4-nmol/L), triiodothyronine (T3-nmol/L), uric acid (µmol/L), and urea (mmol/L).
Hematology and Flow Cytometry
Blood was collected in ethylenediaminetetraacetic acid tubes and analyzed using a Coulter-Counter Model S-PLUS IV system (Counter Electronics Hialeah, FL). The following parameters were measured: red blood cell (RBC) count, hematocrit (HCT), hemoglobin (HGB), mean corpuscular volume (MCV), mean corpuscular hemoglobin (MCH), mean corpuscular hemoglobin concentration (MCHC), red blood cell distribution width (RDW), platelet (PLT) count, mean platelet volume (MPV), total white blood cell (WBC) count, and differential counts of lymphocytes, monocytes, neutrophils, eosinophils, and basophils.
Results
Histology Observations in the Initial Study High-dose Group Animals
The animals in the 100.0 and 200.0 mg/kg bw/day dose groups were found dead within 24 hr of dosing. After 48 hr, the 50.0 mg/kg bw/day animals were killed due to an unhealthy appearance and marked weight loss compared to the control group. The liver and stomach appeared to be the only organs affected upon examination at gross necropsy. All animals examined had inflamed stomachs but appeared normal upon histological examination. The liver showed similar gross changes as previously described in our furan-treated rats (Gill et al. 2010). The left lateral and caudate lobes and papillary processes were the most severely affected. There was mild to very marked centrilobular necrosis, ranging from the involvement of a few zone 3 hepatocytes to necrosis of large areas of parenchyma (Figure 1A and B).
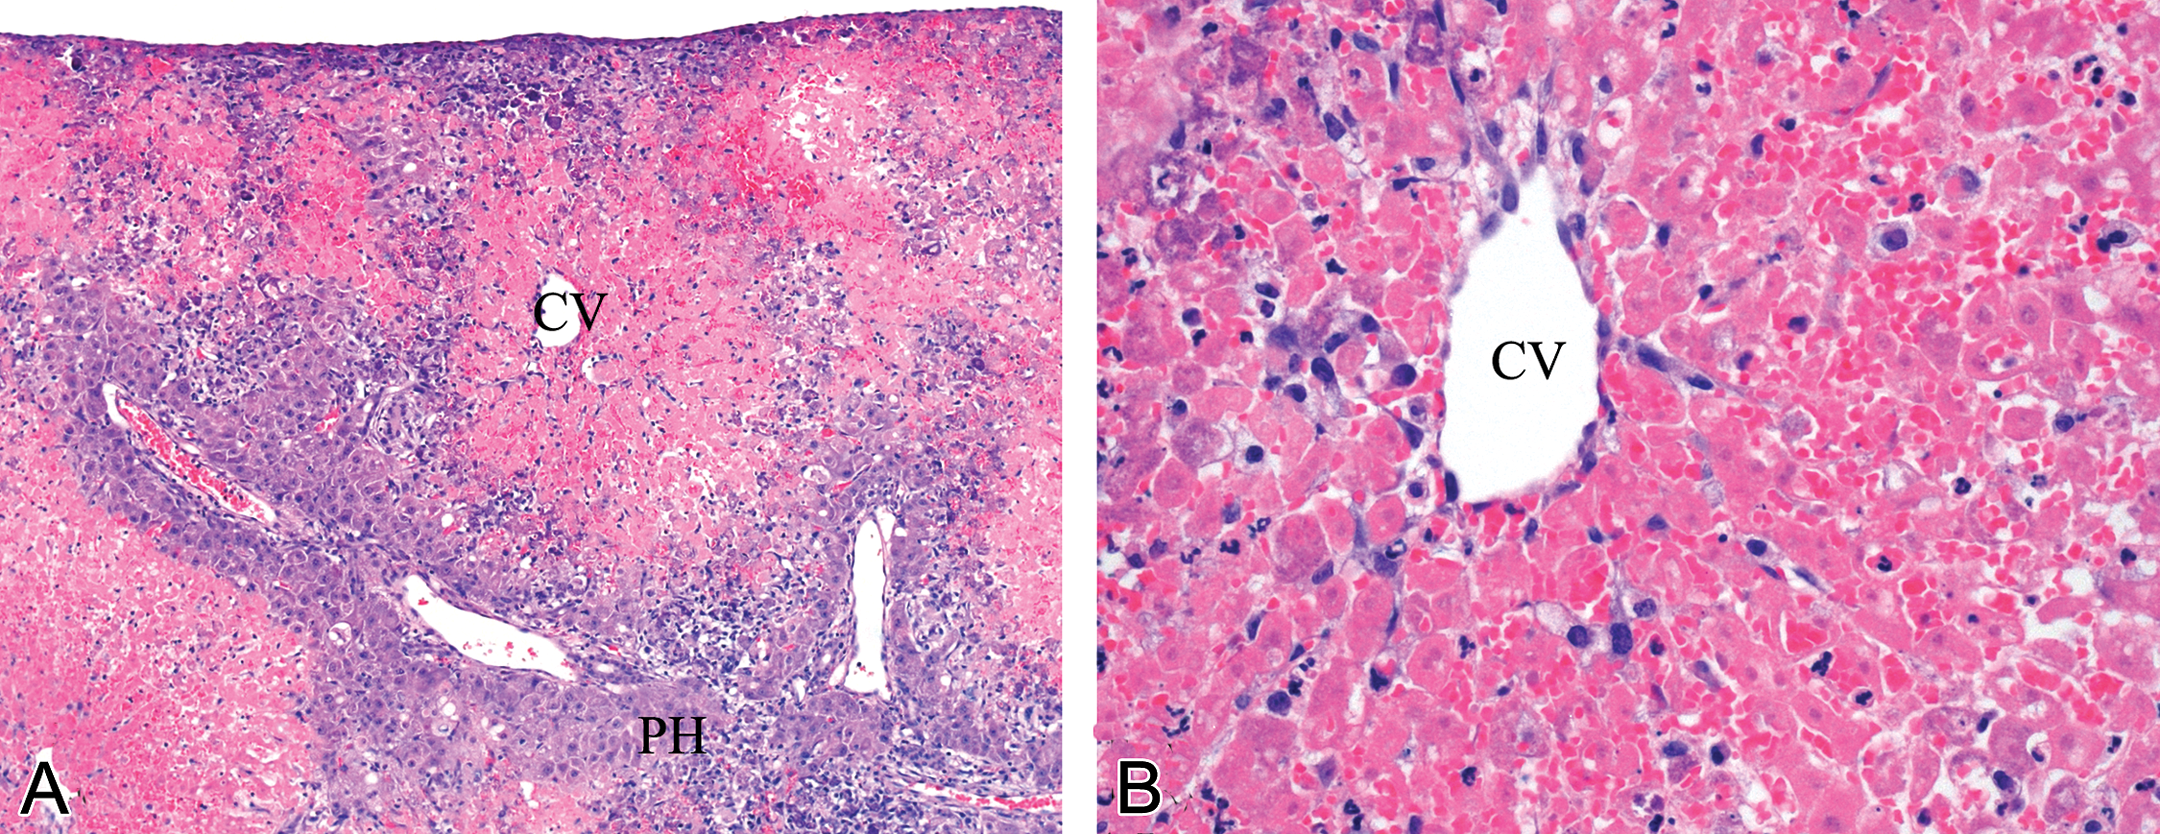
Photomicrographs of rat liver fixed in 10% neutral buffered formalin and stained with Mayer’s hematoxylin and eosin (H&E). Animals dosed with 100 or 200 mg/kg bw/day were found dead in their cages (24 hr), while those in the 50.0 mg/kg bw/day survived but were sacrificed within 48 hr of dosing. All the liver samples had similar histological changes. A and B represents photomicrographs of the liver of a 50-mg/kg bw/day dosed animal sacrificed after 48 hr of dosing. (A) shows extensive centrilobular hepatocyte necrosis encroaching on periportal hepatocytes, central vein (CV), and periportal hepatocytes (PH); infiltration of inflammatory cells is seen throughout the lobule and is most evident at the periphery (magnification 10×); (B) 40× magnification of liver shown in photomicrograph A showing centrilobular necrosis and CV.
The remainder of this study focuses on the results of the 0.0, 0.4, 1.5, 3.0, 6.0, 12.0, and 25.0 mg/kg bw/day dose groups of 2-methylfuran.
Body Weight, Organ Weights, and Food Consumption
The animals at 25.0 mg/kg bw/day lost 7% bw compared to the control animals. Although not statistically significant, there is a linear trend between the control and 25.0 mg/kg bw/day dose groups. This decrease in bw was accompanied by a significant decrease in food consumption (Table 1). No other dose groups were affected. Some organ weights were significantly altered relative to bw (Table 2). Relative liver weights were significantly and dose dependently increased starting at 9% in the 3.0 mg/kg bw/day dose and reaching 42% in the 25.0 mg/kg bw/day dose group. Relative spleen weights were increased at the higher doses, starting at 17% in the 6.0 mg/kg bw/day group and reaching 22% at the 25.0 mg/kg bw/day dose group. The relative weight of the left kidney increased by approximately 6% at the 25.0 mg/kg bw/day group although this effect was not seen in the right kidney. No other organ showed significant changes in relative or absolute weight. There was a linear significant trend in decrease in relative prostate weight in the 25.0-mg/kg bw/day dose group. It was decreased by approximately 20% compared to controls.
Body weight and food consumption.
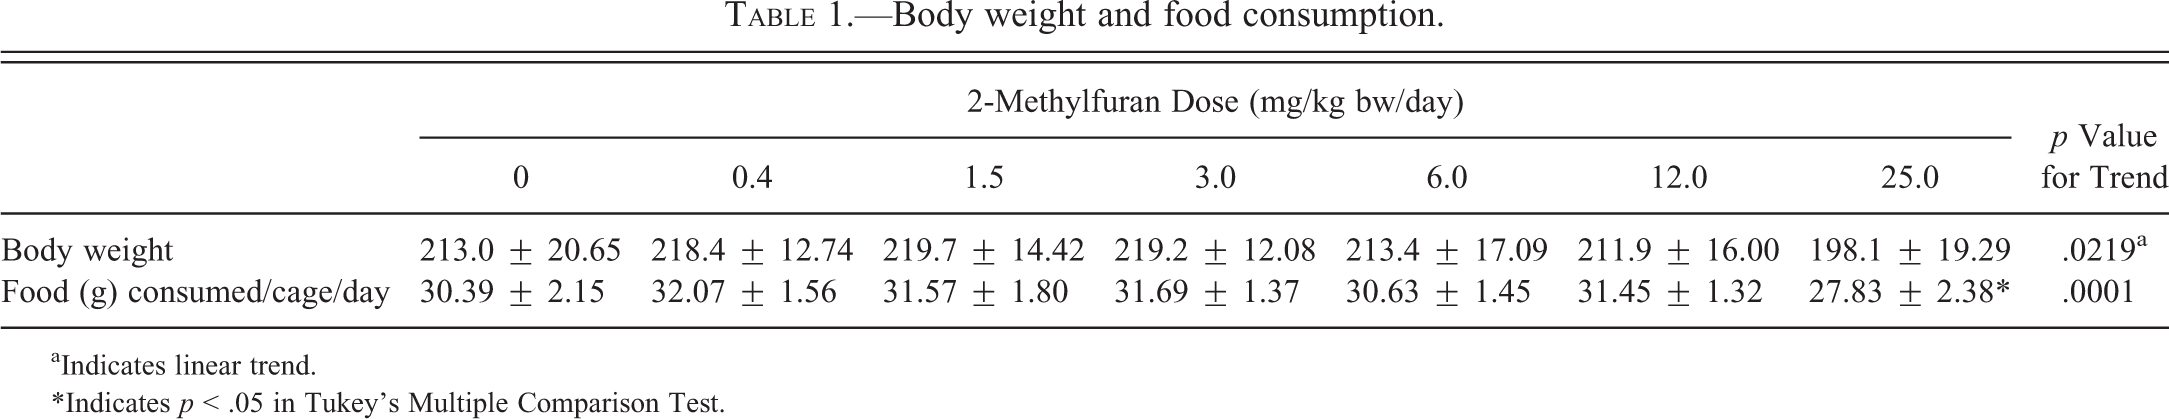
aIndicates linear trend.
*Indicates p < .05 in Tukey’s Multiple Comparison Test.
Organ weight as % body weight in rats treated with 2-methylfuran.
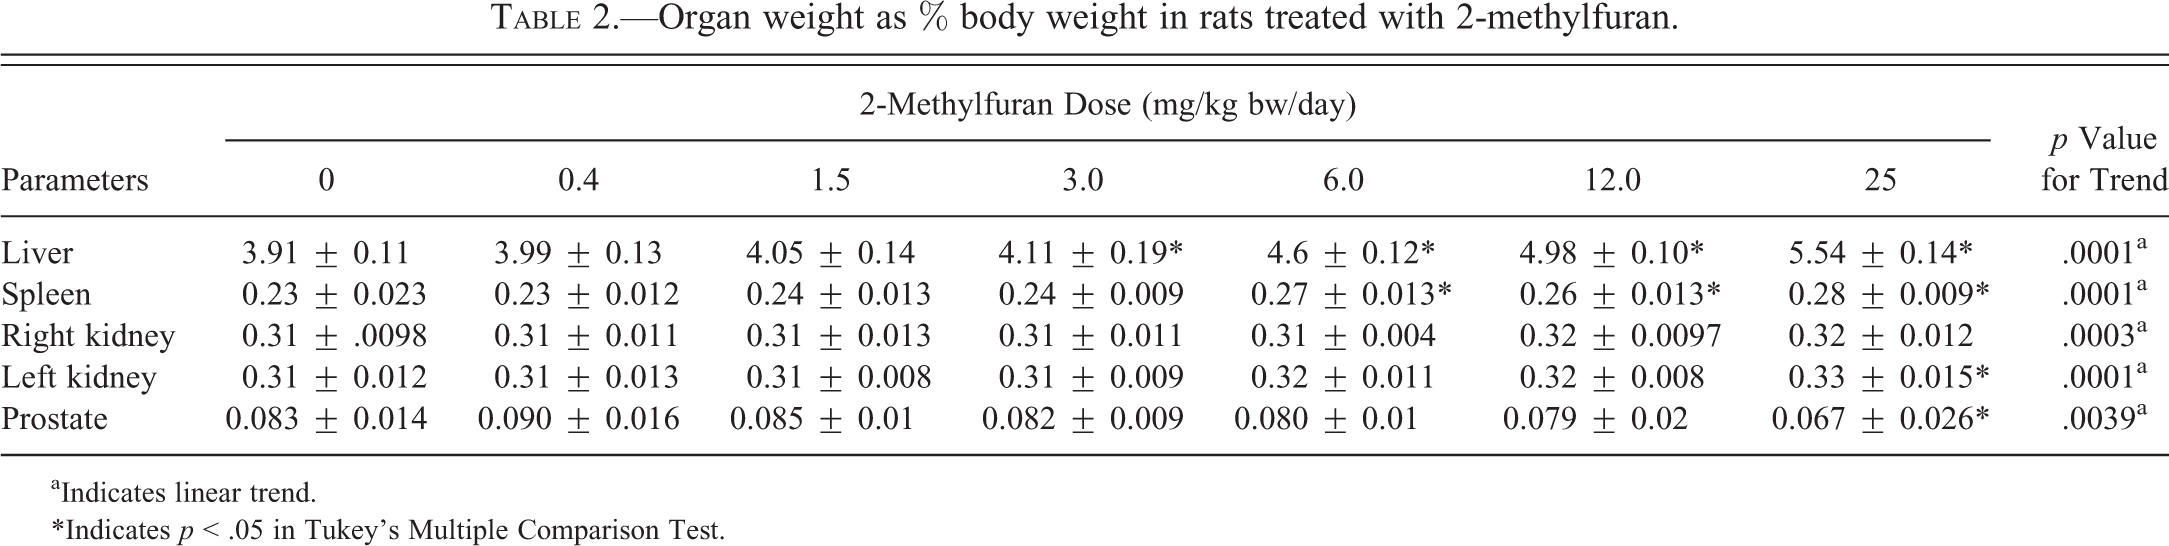
aIndicates linear trend.
*Indicates p < .05 in Tukey’s Multiple Comparison Test.
Gross and Histological Observations in the Liver
Treatment-related gross pathology observations were restricted to the liver. All animals of the 25.0-mg/kg bw/day dose group had mild changes in the left lateral lobe. Less consistently affected were the papillary processes (3 animals) and caudate lobe (4 animals). Small white foci and/or small white slightly raised nodules were evident near the liver hilus in 6 animals (Figure 2B). Pale or yellow/green discoloration of the dorsal margin of the left lobe was noted in 5 animals of the 25.0-mg/kg bw/day group. Two animals of the 12.0-mg/kg bw/day and 1 animal of the 6.0-mg/kg bw/day dose groups had small white foci on the dorsal margin of the left lateral lobe.
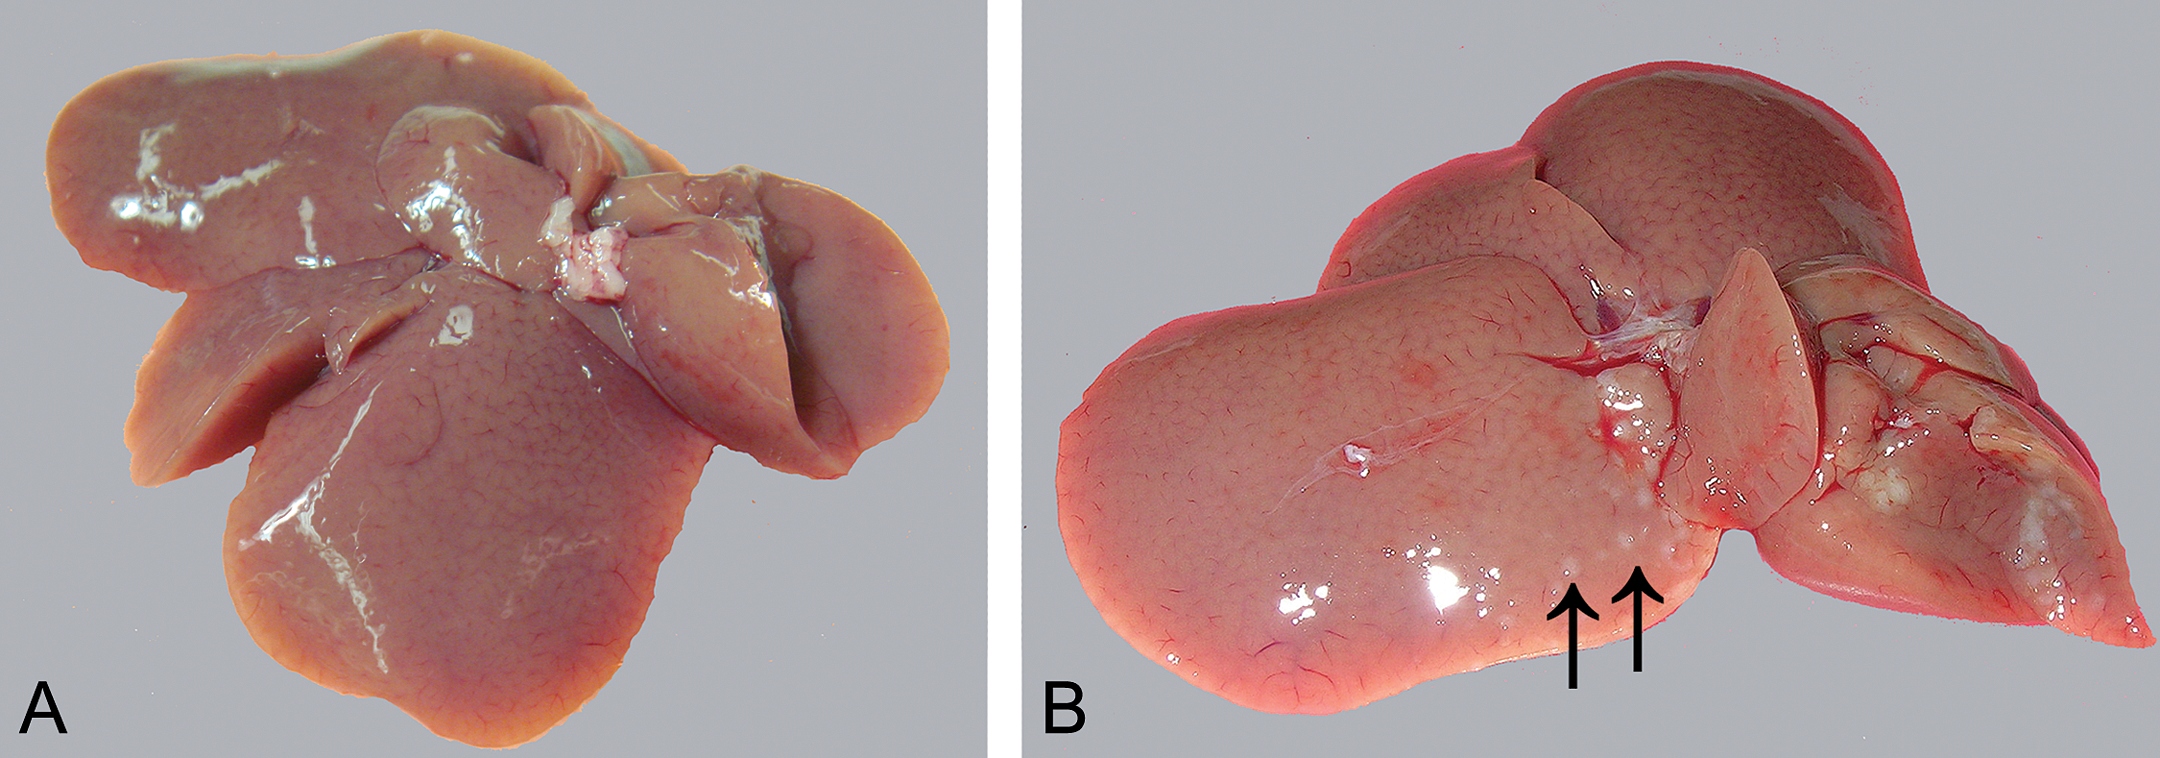
Gross pathological lesions in the liver. Images were obtained from the livers of a control rat (A) and a rat treated with 25 mg/kg bw/day of 2-methylfuran (B). Grayish white nodules can be seen in the left and right lobes of the treated rat (arrow).
Histological lesions that increased in severity with dose were detected in the livers of the 1.5-, 3.0-, 6.0-, 12.0-, and 25.0-mg/kg bw/day dose groups. Mild histological hepatic lesions of apoptotic hepatocytes, Kupffer cells with yellow pigment in the cytoplasm, and microfoci of inflammatory cell infiltrate noted in the 1.5-mg/kg bw dose progress in severity with increasing dose group. Initially being a subcapsular lesion, the above changes also appear periportal in the 12- and 25-mg/kg dose groups. Mild interstitial fibrosis and oval cell hyperplasia first evident at 6.0 mg/kg, progress to mild to moderate, focal, subcapsular, and periportal cholangiofibrosis in the 12- and 25-mg/kg groups (Figure 3).
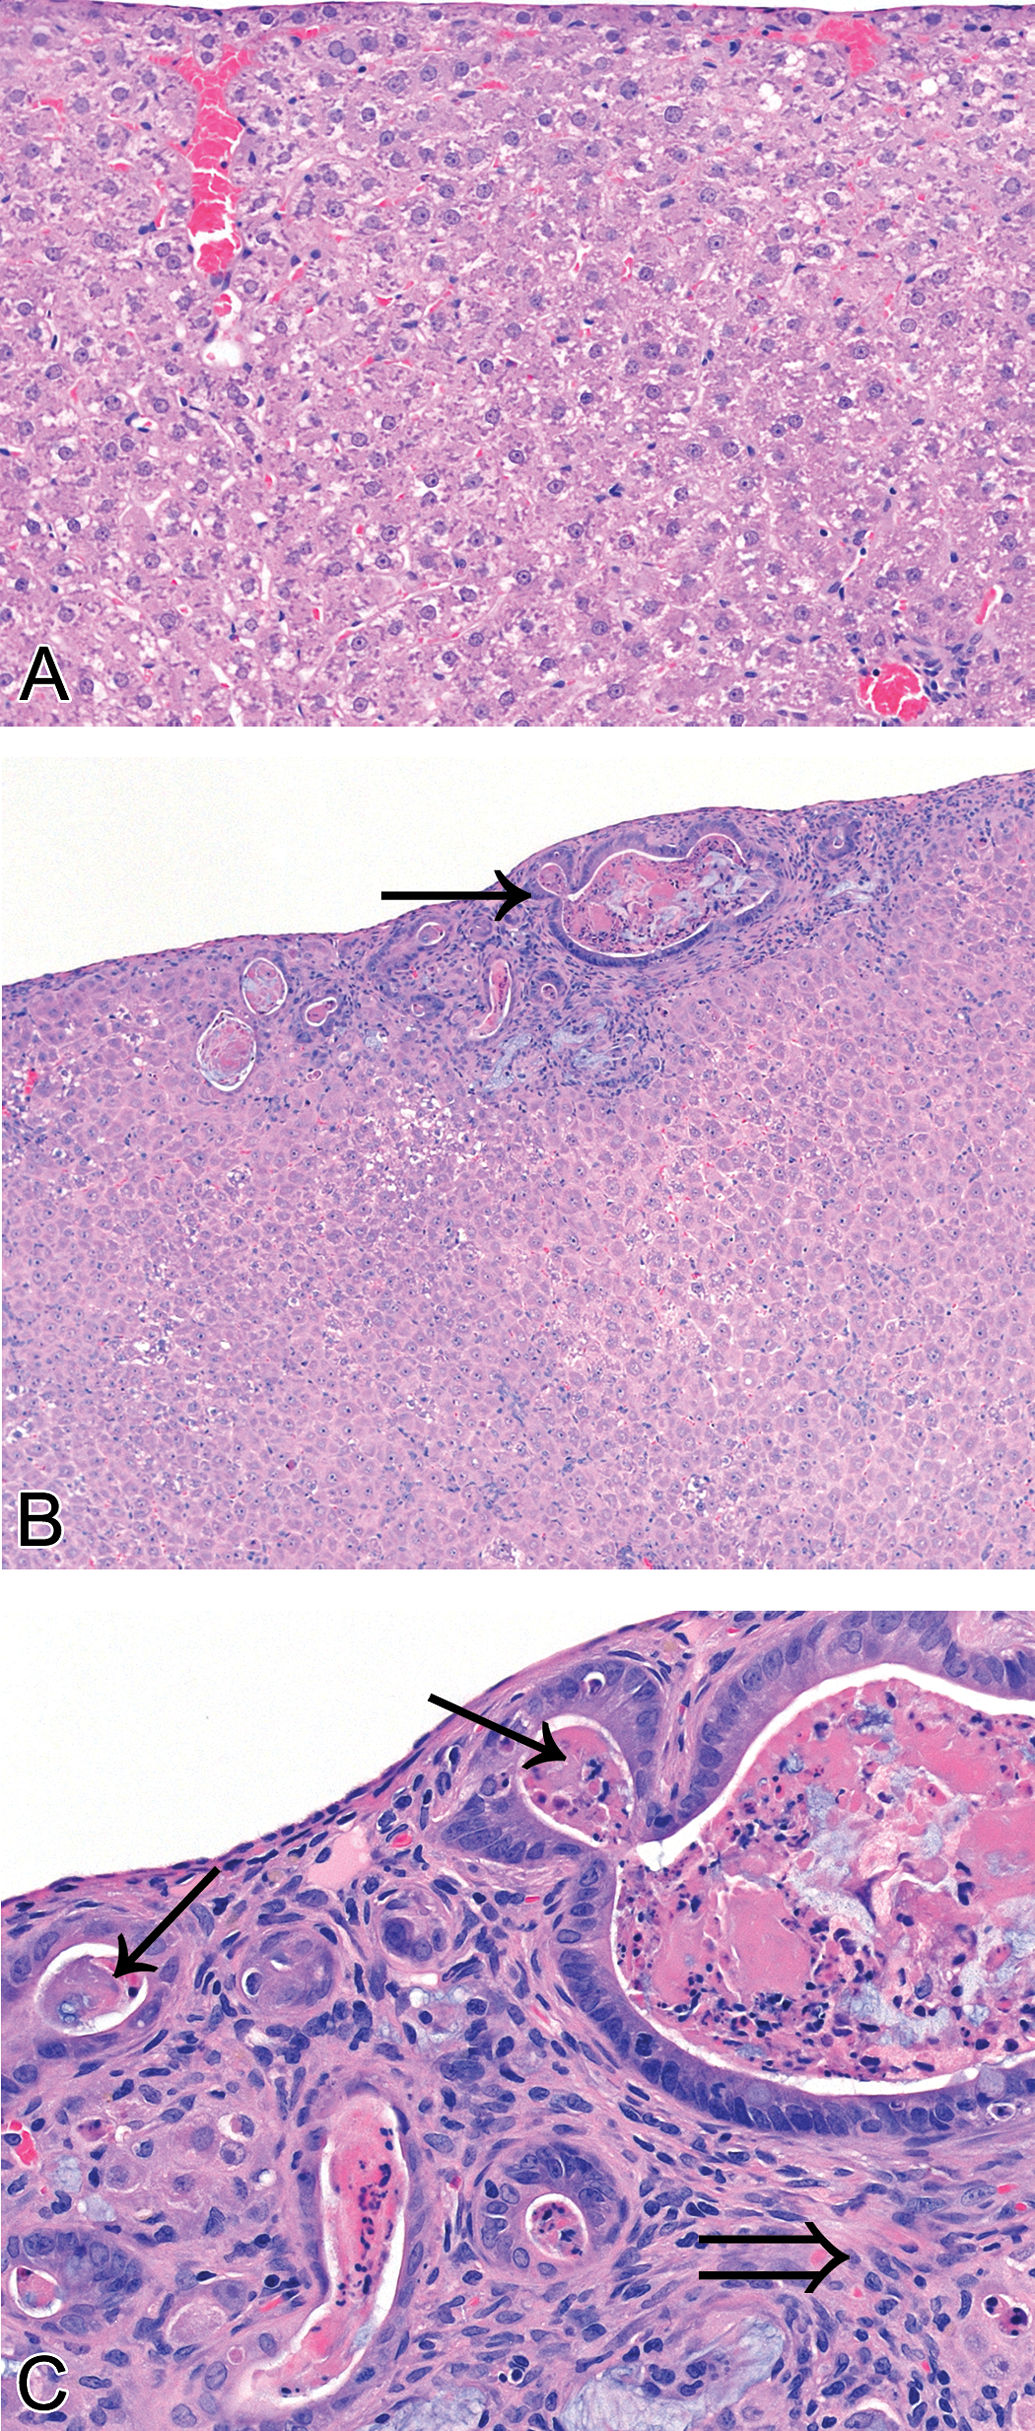
Photomicrographs of rat liver fixed in 10% neutral buffered formalin and stained with Mayer’s H&E. (A) Liver of a control rat showing normal a subcapsular morphology (20×). (B) Liver of a rat dosed with 25 mg/kg bw/day showing subcapsular cholangiofibrosis (Arrow, 10×). (C) Liver of same rat dosed with 25 mg/kg bw/day showing subcapsular cholangiofibrosis, intestinal gland-type bile duct (arrow); mix of fibrosis, inflammatory cells, and oval cells (open arrow) at 40× magnification.
Gross and Histological Observations in Other Tissues
A single incidental finding was observed in 1 animal of the 6.0-mg/kg bw/day dose group whose left testis was flaccid and about half the normal size. The left epididymis was also smaller than normal. No changes were observed in any other tissues.
There was increased vacuolation in the zone fasciculata of the adrenals in the 25.0-mg/kg bw/day dose group. In the control group, vacuolation was graded from mild (6 animals) to moderate (4 animals). In the 25.0-mg/kg bw/day group, vacuolation was graded from mild (2 animals) to moderate (8 animals). No dose-related gross observations or histological changes were seen in the other tissues examined, which included heart, lungs, kidneys, pancreas, prostate, seminal vesicles, testes, spleen, stomach, thyroid, or parathryoid (when found in the thyroid sections).
Clinical Biochemistry
Physiological Markers
Serum enzymes (ALT, AST, and ALP) indicative of liver injury were not significantly affected (Table 3).
Liver enzyme parameters in rats treated with 2-methylfuran.
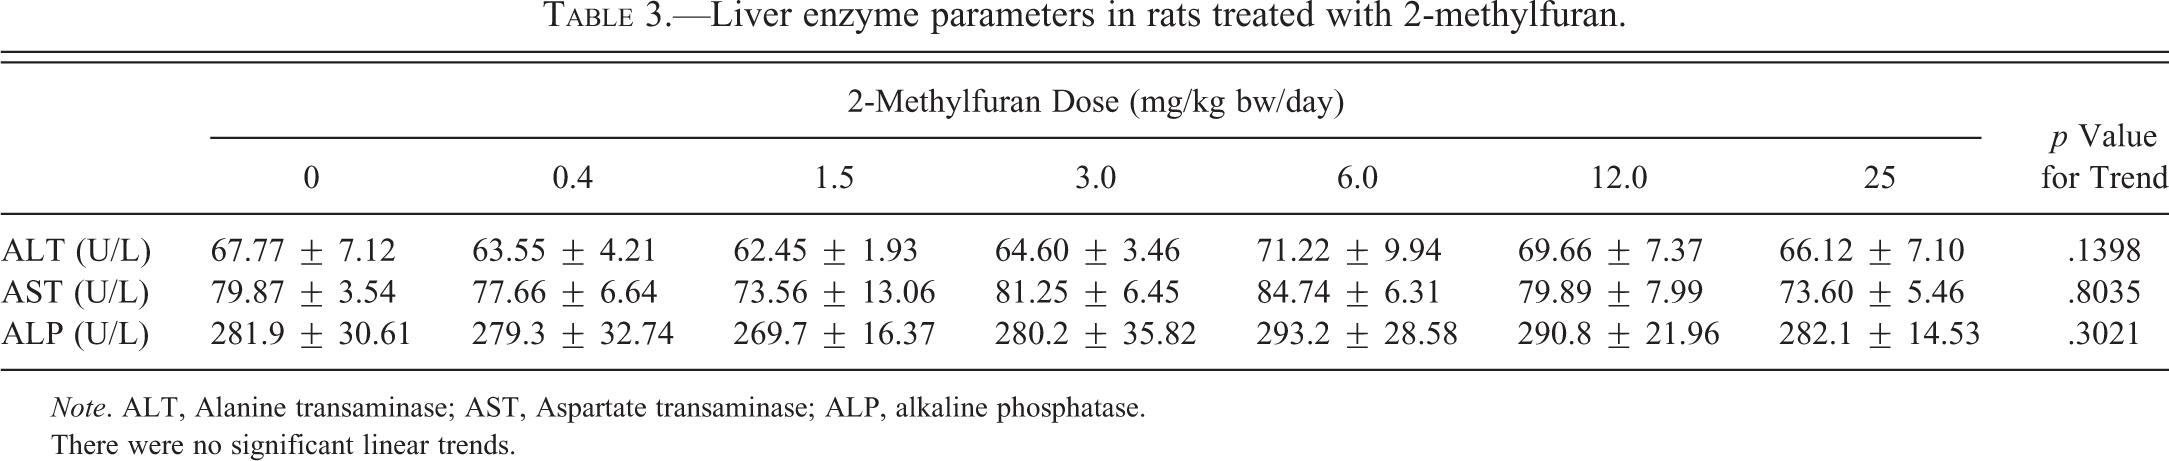
Note. ALT, Alanine transaminase; AST, Aspartate transaminase; ALP, alkaline phosphatase.
There were no significant linear trends.
Total bilirubin levels increased with dose and differed significantly (p < .05) from controls at the 25.0-mg/kg bw/day dose (Table 4). Serum albumin levels were significantly increased (p < .05) at 6.0-, 12.0-, and 25.0-mg/kg bw/day doses. Total protein was significantly increased (p < .05) at 12.0- and 25.0-mg/kg bw/day doses. Cholesterol was significantly and dose dependently increased (p < .05) starting at 0.4 mg/kg bw/day. Triglycerides showed a significant decrease (p < .05) starting at 3.0 mg/kg bw/day. Serum amylase demonstrated a significant decrease (p < .05) starting at 1.5 mg/kg bw/day. Creatinine showed a significant linear trend decrease starting at the 0.4-mg/kg bw/day dose group and dose-dependent significance (p < .05) starting at the 6.0 mg/kg bw/day. Creatine kinase showed a significant decreasing trend with dose. Lipase showed a significant linear trend increase (p < .0001) with increasing dose. No significant changes were seen in the levels of glucose, uric acid, and urea (last 2 parameters not shown).
Clinical biochemistry parameters in serum of rats treated with 2-methylfuran.
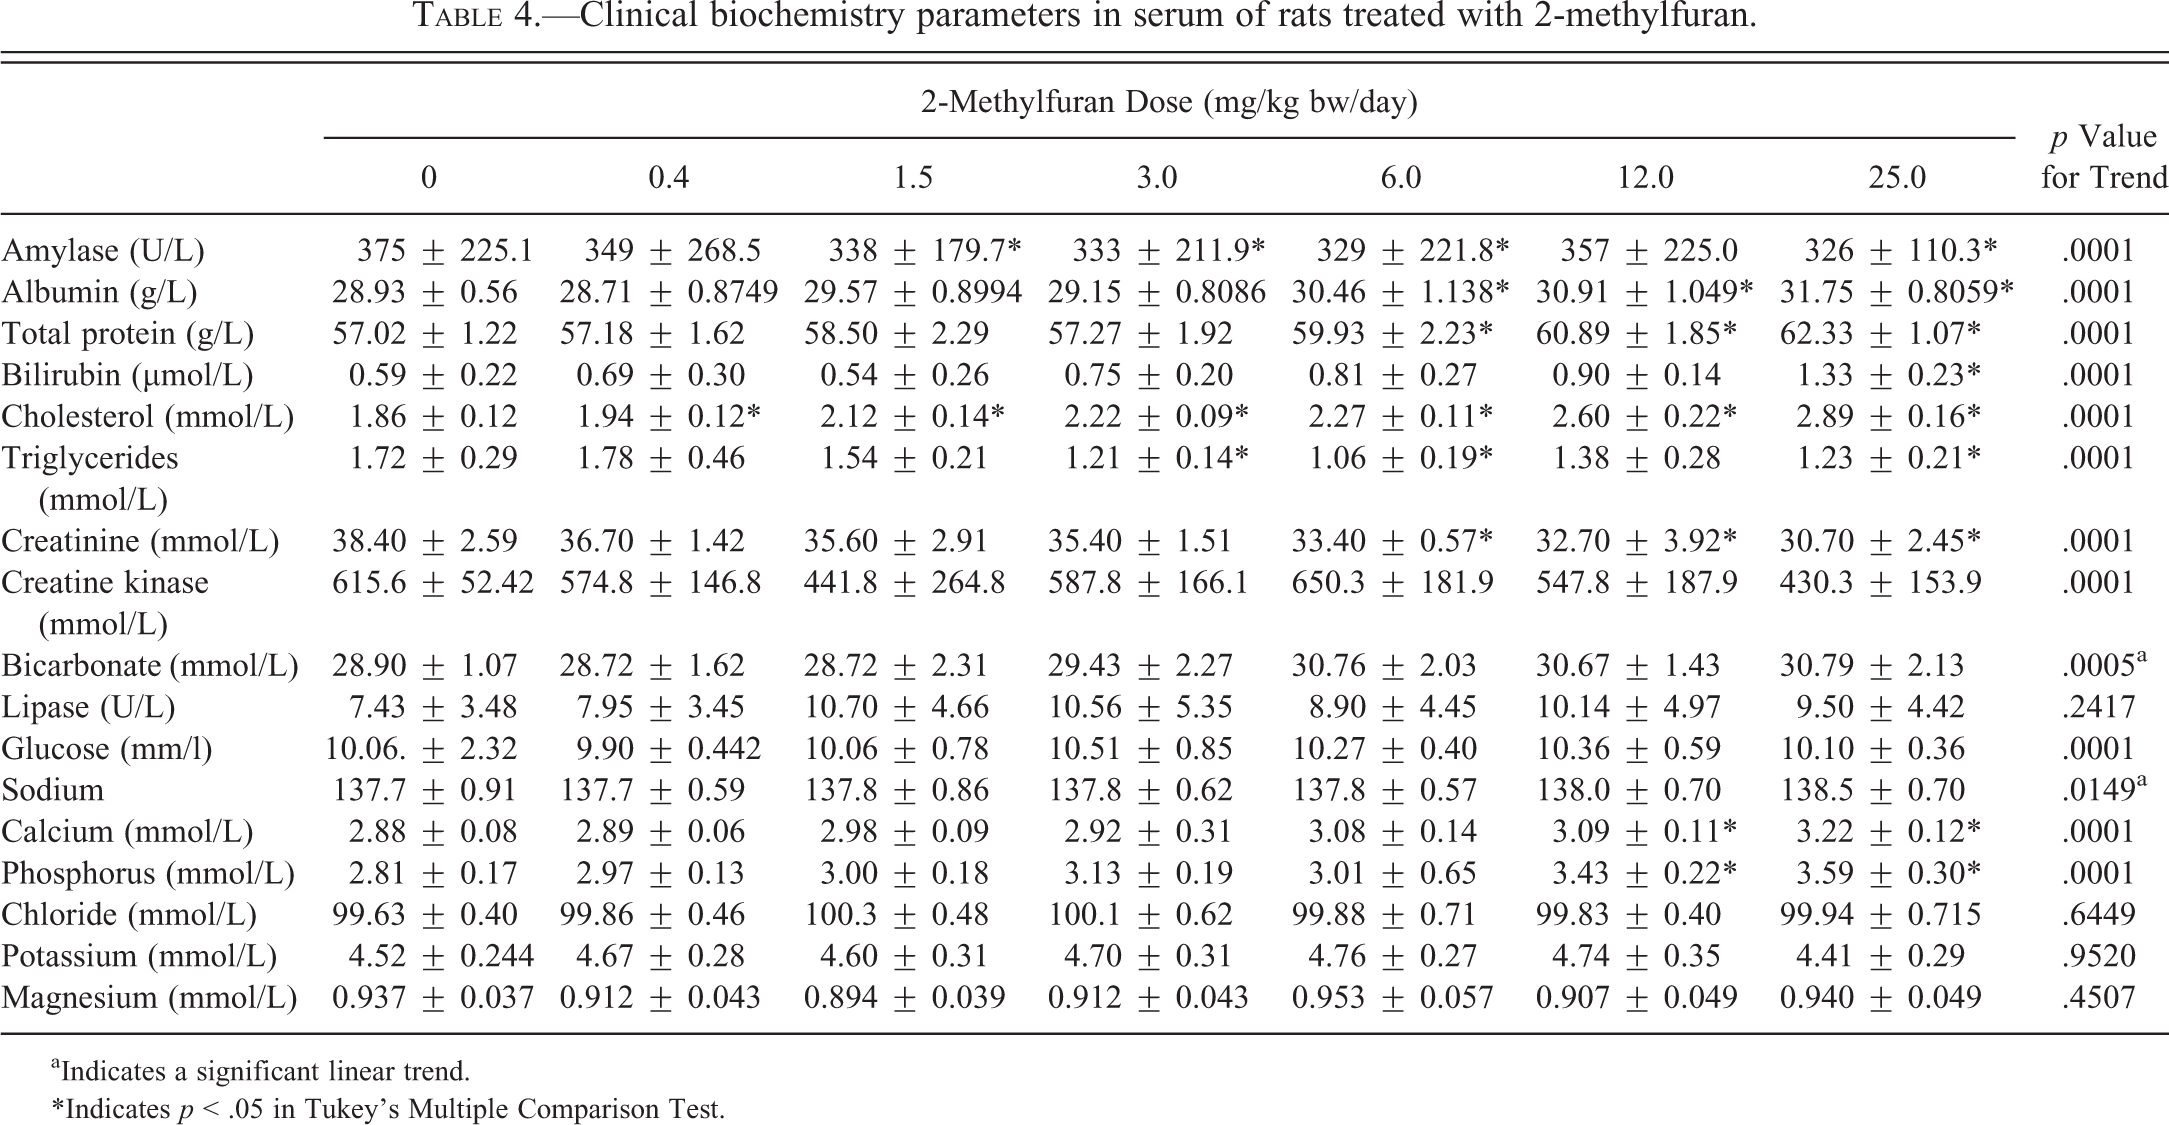
aIndicates a significant linear trend.
*Indicates p < .05 in Tukey’s Multiple Comparison Test.
Electrolyte Changes
The changes in serum electrolyte markers are shown in Table 4. Phosphorus and calcium showed a significant increasing trend and differed significantly from controls at the 12.0- and 25.0-mg/kg bw/day doses (p < .05). Sodium, potassium, Na:K ratio, chloride, and magnesium showed no change. Bicarbonate levels did not differ significantly but showed a statistically significant linear increasing trend (0.04899) with dose.
Hematology Parameters
Hematology parameters are shown in Table 5. RBC count, HGB, HCT, and MCV were all significantly decreased (p < .05) at the 25.0-mg/kg bw/day dose, while RDW was significantly increased (p < .05) at the 12.0- and 25.0-mg/kg bw/day dose groups. PLT levels were significantly and dose dependently increased at the 6.0-, 12.0-, and 25.0-mg/kg bw/day doses (16%, 17%, and 24% increase, respectively, relative to controls). The MCH showed a slight but significant trend to decrease at 25.0-mg/kg bw/day, while MCHC and MPV were not altered.
Hematology in rats treated with 2-methylfuran.
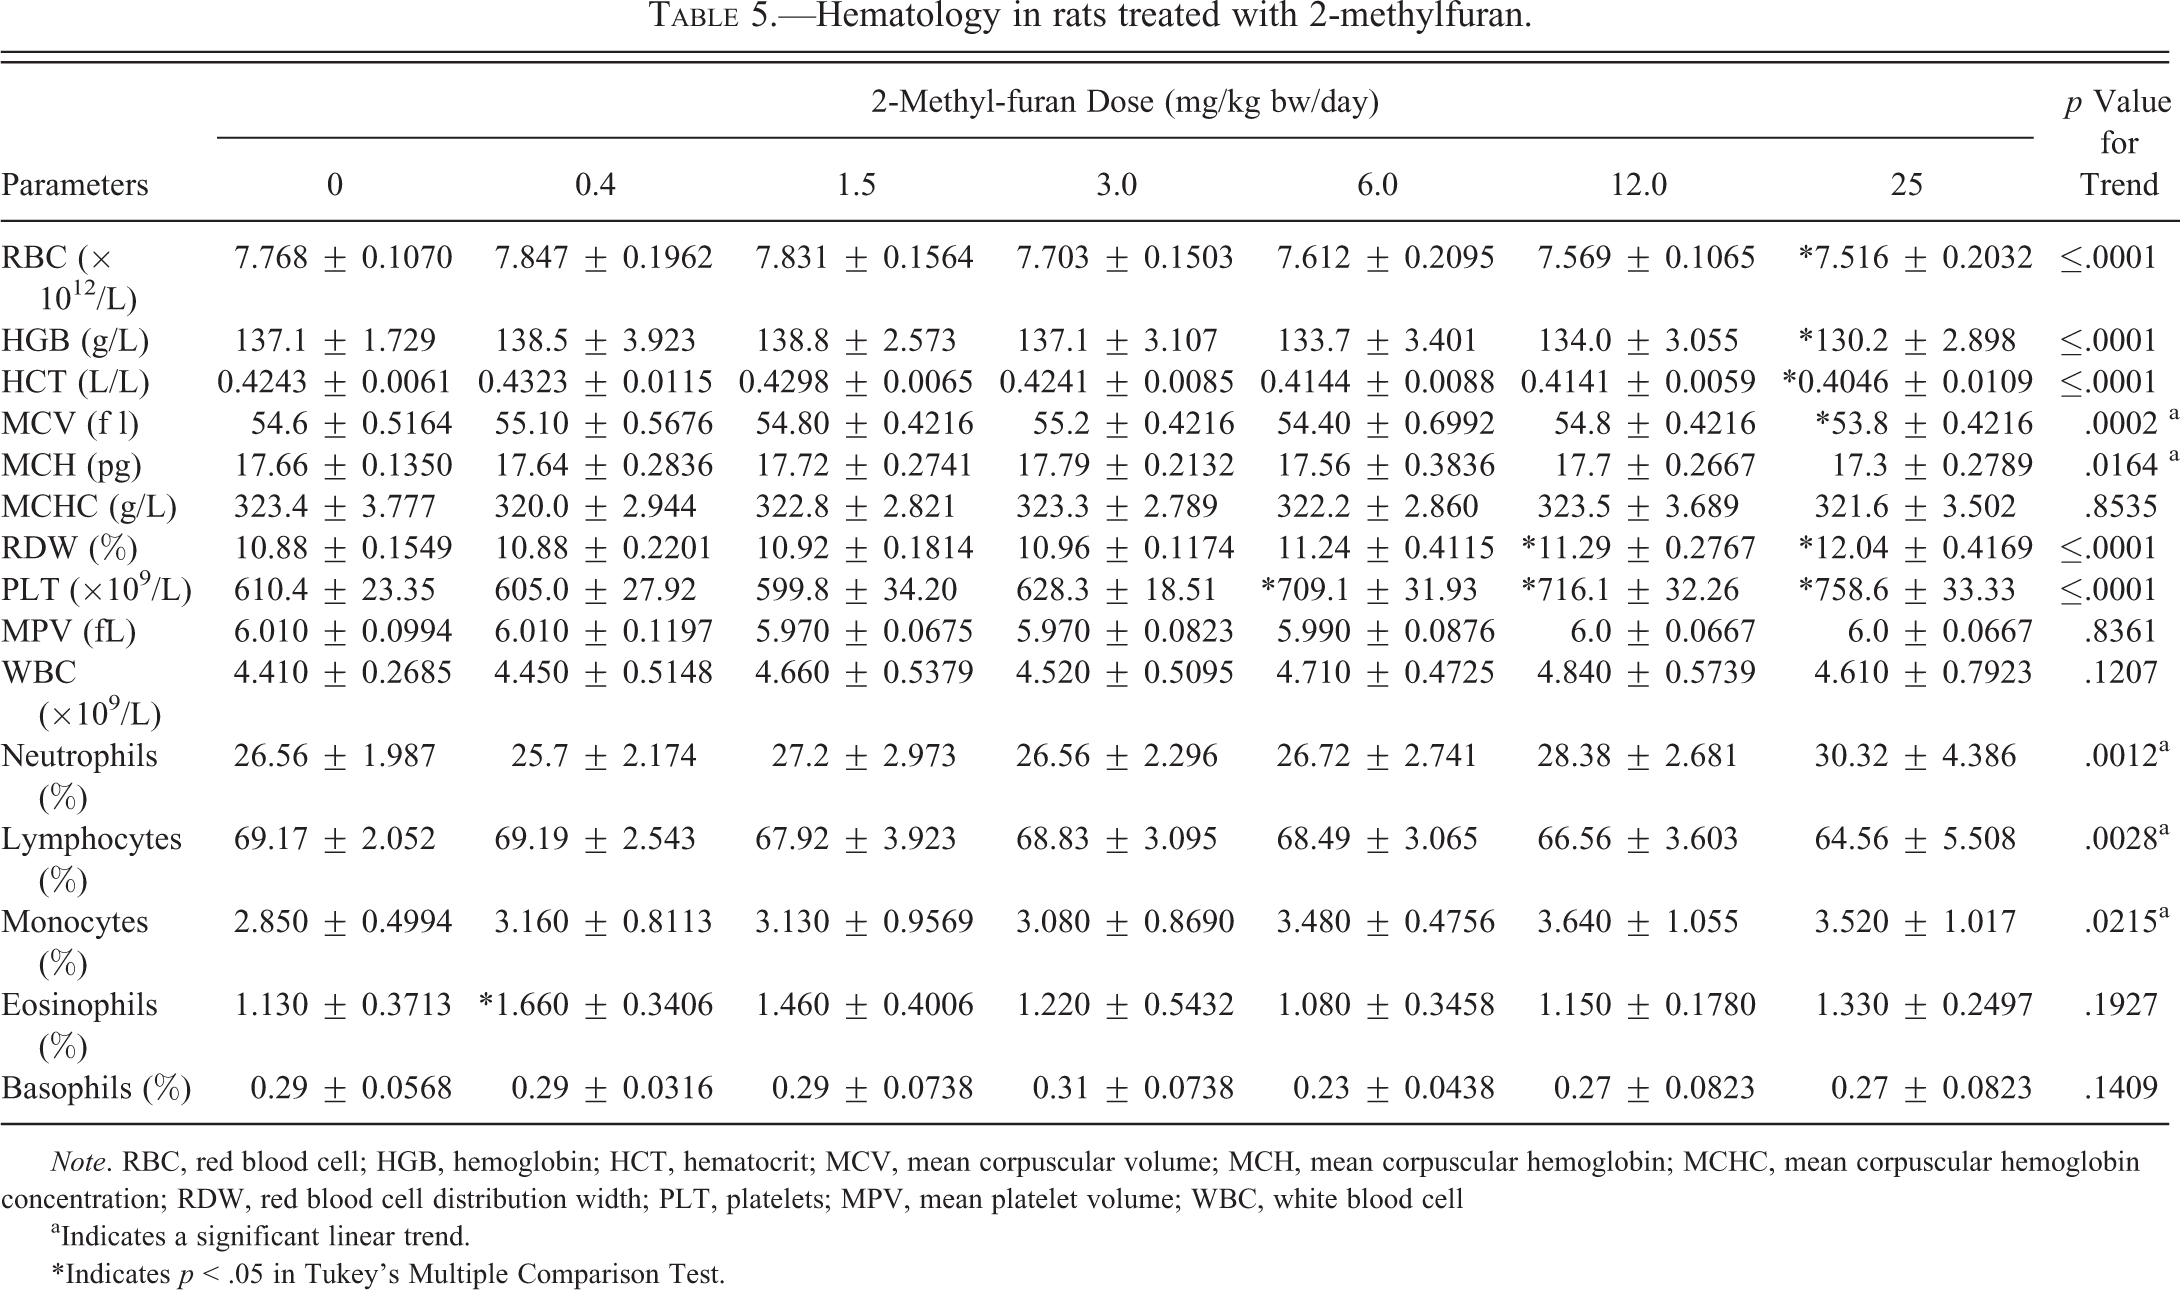
Note. RBC, red blood cell; HGB, hemoglobin; HCT, hematocrit; MCV, mean corpuscular volume; MCH, mean corpuscular hemoglobin; MCHC, mean corpuscular hemoglobin concentration; RDW, red blood cell distribution width; PLT, platelets; MPV, mean platelet volume; WBC, white blood cell
aIndicates a significant linear trend.
*Indicates p < .05 in Tukey's Multiple Comparison Test.
Total WBC count, and levels of basophils and eosinophils were not affected. However, there was a significant decreasing trend for lymphocytes and significant increasing trends for neutrophils and monocytes.
Endocrine Functions
Total serum T4 levels were significantly increased (p < .05) only at 1.5 and 3.0 mg/kg bw/day but not at the higher doses, whereas T3 levels were significantly increased (p < .05) with dose starting at the 1.5-mg/kg bw/day dose group (Table 6).
T3 and T 4 in rats Treated with 2-methylfuran.
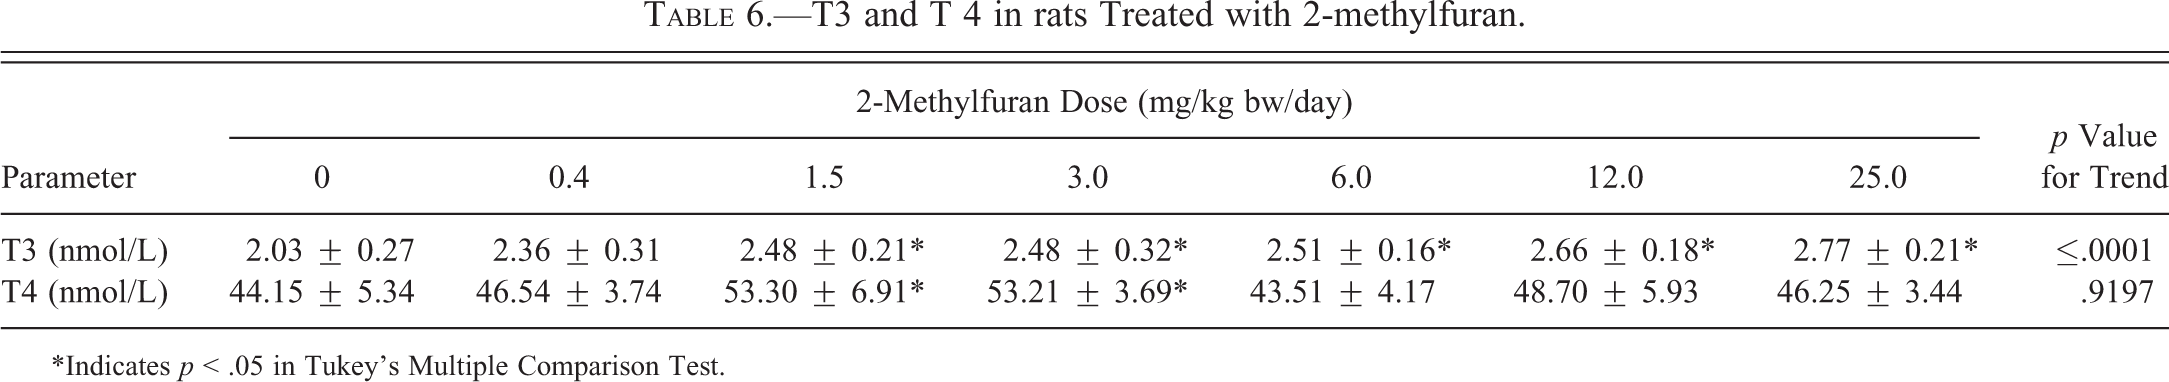
*Indicates p < .05 in Tukey’s Multiple Comparison Test.
Statistical Analysis
Bw, food consumption, clinical biochemistry, hematology, and organ weights were expressed as mean ± standard deviation. Statistical comparisons of control rats and 2-methylfuran treated rats were performed by one-way analysis of variance (ANOVA) followed by Tukey’s multiple comparison test. Linear trend analysis was also performed. A value of p < .05 was considered statistically significant.
Discussion
This 28-day pilot study with Fischer 344 rats was conducted to determine the optimal dose range for a subchronic study on the oral toxicity of 2-methylfuran. The selection of the initial dose range was based on doses previously used for inhalation or intraperitoneal injection studies in the Sprague-Dawley rat (Ravindranath and Boyd 1985). In our study, the doses of 50.0, 100.0, and 200.0 mg/kg bw/day were too elevated and resulted in either death (24 hr) or poor health of animals (48 hr).
The administration of 2-methylfuran resulted in significant increases in liver weights. The gross and histological changes in the liver were similar to the ones reported in our earlier studies of the parent molecule furan in terms of the type of microscopic lesions observed and the lobes that were affected in both rat (Gill et al. 2010) and mice (Gill et al. 2011). Three possible explanations have been proposed for the differential lobe susceptibility to furan. One speculation for the differential response between lobes is the route of portal venous circulation through the liver, which could allow a higher concentration of furan exposure to the caudate liver lobe in contrast to the median, right, and left lobes. In addition, there could be interhepatic lobe differences in furan metabolism (Elmore and Sirica 1991). The third possibility for the necrosis, inflammation, and fibrosis along the subcapsular surface of the left or caudate lobes of the liver is that these lobes are located immediately adjacent to the stomach; hence, it is likely there is direct diffusion of furan through the stomach to these lobes (Butterworth et al. 2004; Wilson et al. 1992). In the current 2-methylfuran pilot study, histological lesions were observed starting at the 1.5-mg/kg bw/day dose group.
The observations of clinical chemistry suggest that, as with furan, exposure to 2-methylfuran affects both the hepatocytes and the bile duct system in the liver. No significant changes were seen in the hepatic “leakage” enzymes ALT and ASP, indicative of damage to the hepatocytes, nor in ALP, indicative of bile duct damage (Ramaiah 2007). However, statistically significant reductions in serum triglycerides were observed at 3.0 mg/kg bw/day and above which can be a biomarker of hepatotoxicity, most frequently of hepatocellular necrosis, that is independent of nutritional status in the rat (Provost, Hanton, and Le Net 2003). Dose-dependent and statistically significant decreases in triglycerides were also observed in the 90-day gavage study with furan (Gill et al. 2010). Substantial, dose-related, and statistically significant increases were seen in the levels of cholesterol and bilirubin, which rose by 55% and 125%, respectively, at the 25.0-mg/kg bw/day dose. Increases in cholesterol can be indicative of biliary obstruction or acute or subacute necrosis of the liver (Mitruka and Rawnsley 1981). Increases in serum bilirubin can result from cholestasis (retention of bile) subsequent to impairment of intrahepatic or extrahepatic bile flow, cytotoxicity to the liver, or from excessive hemolysis (Klaassen and Watkins 1999). This retention of bile can explain the greenish to yellowish pigment observed in the gross morphology.
Serum amylase was decreased significantly in a dose-dependent manner starting at 1.5 mg/kg bw/day. A dose-dependent decrease in the levels of amylase was also found in male and female rats after treatment with furan (Gill et al. 2010). Amylase levels are decreased in liver disease, including hepatitis (Bhutta and Rahman 1971) and the decreased levels observed here could reflect the inflammation and necrosis of the liver induced by 2-methylfuran. Decreases in pancreatic and salivary amylases in serum levels have been reported during alcohol consumption, which also increases the excretion of amylase in the urine (Maruyama et al. 2003). Perhaps, the effects of furan and 2-methylfuran on amylase levels could also involve nonhepatic mechanisms, similar to those of alcohol.
Both albumin and total protein levels were slightly statistically increased. The increased total protein levels probably reflect the increased albumin levels. The biological significance, if any, of the increase in albumin is not clear. Impaired liver function is generally reflected in a decrease in protein synthesis and lower serum levels of albumin (Ramaiah 2007). Small increases in albumin levels were also observed with furan (Gill et al. 2010). Since both serum protein and cholesterol are largely regulated via synthesis and also reflect synthetic ability of the liver (Okokon, Nwafor, and Ekpo 2010), the increase in one or both of these parameters could reflect a stimulatory effect of 2-methylfuran on some hepatic enzymes.
Levels of some of the electrolytes were altered. Phosphorus and calcium showed a linear increase with dose and were increased significantly at 12.0 and 25.0 mg/kg bw/day. Sodium showed an increased linear trend with dose, although differences among groups were small. Chloride, potassium, and magnesium showed no significant changes. No significant differences were found in bicarbonate levels, but it showed a significant (0.04899) linear increase with dose. Changes in electrolytes can result from multiple metabolic changes including gastrointestinal and renal dysfunction. Increases in bicarbonate levels can be associated with acute and subacute necrosis of the liver, nephritic syndrome, and renal failure (Mitruka and Rawnsley 1981). The increases in phosphorous and calcium, along with the significant decrease of creatinine, are suggestive of renal injury. In this regard, it is noteworthy that creatinine showed a consistently decreasing trend starting at the lowest dose. The changes in creatinine levels could be associated with the 6% increase in the relative weight of the left kidney at the 25.0-mg/kg bw/day dose. However, there were no histological changes in either the left or the right kidney. In general, kidney failure is associated with increased serum creatinine levels, reflecting the kidneys’ inability to clear this waste product of muscle metabolism. However, the reduction in serum creatinine levels in this study could reflect an impaired ability by the liver or kidneys (or both) to synthesize creatine, resulting in a reduced provision to muscle tissue (to which most of the creatine is transported), and hence a reduction in the resulting waste product creatinine.
To determine whether 2-methylfuran interferes with thyroid hormone homeostasis, serum T3 and T4 levels were measured. Levels of T3 increased significantly and in a dose-related manner starting at 1.5 mg/kg bw/day, whereas T4 levels were increased only at 1.5 and 3.0 mg/kg bw/day but not at the 3 highest doses. Over 85% of the thyroid hormone is synthesized and released as T4. The active form of T3 is derived from conversion of T4 by the type 1,5-monodeiodinase enzyme located primarily in the liver and the kidney (Christian and Trenton 2003). Hence, changes in T3 may be mainly due to injury to the liver. This possibility is supported by the extensive histological changes in the liver, although changes in serum enzymes indicative of liver damage (ALT, AST, ALP) were not observed.
The hematopoietic system is one of the most sensitive targets of toxic compounds and is an important index of physiological and pathological status. While the total WBC count did not change and there were no significant differences in the differential count, neutrophils and monocytes showed an increasing trend and lymphocytes a decreasing trend. Lymphocytes are mediators of the specific immune response against pathogens, while neutrophils are responsible for phagocytosis (Sacher and McPherson 1991). An increase in neutrophil count is associated with acute insult to the body whether in the form of infection or not. Monocytes are also phagocytic. The trend of an increase in neutrophils and monocytes at the expense of lymphocytes is therefore suggestive of a response to tissue injury in the liver. However, in healthy rats, there can be an extensive range in the relative percentages of lymphocytes (ca. 65–90%) and neutrophils (ca. 10–30%), and the possible significance of these observations remains to be confirmed.
A range of RBC parameters were significantly decreased at the highest dose (RBC, HGB, HCT, MCV). While MCH and MCHC were also reduced at the highest dose, it was without statistical significance. The RDW was significantly increased at the two highest doses, indicating an increase in the range of RBC size. These changes are suggestive of the destruction of mature RBCs and a change in the rate of production of RBCs (erythropoiesis) and also of anemic conditions. It suggests that 2-methyfuran has the potential to stimulate the release of erythropoietin release from the kidney, which is the humoral regulator of RBC production. Blood parameters such as MCV and MCH are important in the diagnosis of anemia in animals. The significant increase in spleen weight in the 3 highest dose groups is compatible with an effect of furan on RBC turnover.
An increased PLT count is most often caused by a reaction to injury or inflammation and can also be associated with malignant neoplasms or the liver and other organs (Mitruka and Rawnsley 1981).
The decrease in relative prostate size could be attributed to 2-methylfuran preventing the conversion of testosterone into a more potent form, dihydrotestosterone (DHT). DHT is responsible for the development of many male sex characteristics. Accumulation of DHT in the prostate can lead to an enlargement in size due to cell division, a condition called prostatic hyperplasia. Therefore, it appears that 2-methylfuran may inhibit the formation of DHT from testosterone thereby reducing the size of the prostate gland.
In this pilot study, the liver was the major target organ as indicated by changes in gross, histological, and clinical parameters. Although there were changes in the weights of other organs including prostate, kidneys, and spleen, these were not accompanied by histological changes. The results of this study will be used to conduct a subchronic study.
Footnotes
Acknowledgments
We thank Véronique Gagné, Jocelyn Souligny, Julie Todd Keith Snider, Don Demers, Dominque Patry, and Michel Sanche for their help during the animal phase of the study. We also thank Dr. Martha Navarro for the consultation on the health status of the animals and Dr. R. Mueller for helping us with the photographs.
The author(s) declared no potential conflicts of interest with respect to the research, authorship, and/or publication of this article.
The author(s) received no financial support for the research, authorship, and/or publication of this article.