
Abstract
A number of novel urinary biomarkers have been identified and partially qualified for use as markers for renal injury in rats. To date, all evaluation studies have been made using 18 to 24 hour collection periods. However, shorter, more welfare friendly, urine collection periods are also used in industry. In this article, we quantify urinary biomarker concentration in serial paired sequential short and long urine collections from male rats administered varying concentrations of cisplatin. We calculate the rate of biomarker excretion in normal animals for both collection periods and the bias and correlation in urinary biomarker concentration between collection periods in dosed and control animals, and we estimate the level of agreement in biomarker concentration between both collection periods. We conclude that although there are minor differences in the concentration of some urinary biomarkers that are dependent upon the time and duration of collection, shorter collection protocols do not influence subsequent interpretation of normalized urinary biomarker data for most biomarkers.
Keywords
Introduction
Drug induced kidney injury is a leading cause of candidate compound attrition in drug development (Garrett and Workman 1999; Kola and Landis 2004; Lesco and Atkinson 2001). However, with the exception of histopathological examination, the functional assessments (urea, creatinine) and evaluation of urinary parameters (traditional urinalysis) are widely regarded as being insensitive to, and poorly specific for, renal injury (Han et al. 2002; Star 1998). Over recent years, a number of novel urinary biomarkers have emerged in rodents that have been shown to be of greater sensitivity and specificity than the traditional plasma markers (Ferguson, Vaidya, and Bonventre 2008; Ozer et al. 2010; Yu et al. 2010; Rouse et al. 2011), and this improvement in performance has been recognized through a qualification process overseen by the European Medicine Agency (EMA) and Federal Drug Administration (FDA) (Goodsaid and Frueh 2007; Goodsaid, Frueh, and Mattes 2008; Goodsaid et al. 2009). However, to date all evaluations of the novel urinary biomarkers have been made using a long overnight collection protocol of 18 to 24 hours. No attempts have been made to determine if urine biomarker concentrations collected during a shorter, daylight collection period are of comparable utility for determining renal injury to the standard longer collection. Shorter collection periods are of interest as concerns over animal welfare in the United Kingdom have led some pharmaceutical companies to reduce the period of time that rodents are housed in metabowl collection cages from 13 to 24 hours to only 6 hours.
In this article, the second in a series of three, we aim to characterize any differences in a number of novel urinary biomarkers between short daylight (6-hour) and longer overnight (18-hour) collection periods made sequentially over 24-hour periods. We follow groups of rats given various doses of cisplatin, a common well-characterized nephrotoxicant, over time (up to 22 days) and measure urinary biomarker concentrations from both collection periods.
The biomarkers of interest in this study were the traditional biomarkers urinary total protein (TP), glucose and n-acetyl-beta-d-glucosaminidase (NAG) and the novel biomarkers urinary albumin, alpha glutathione s-transferase (α-GST), glutathione S-transferase-yb1 (GSTYB1), lipocalin, kidney injury molecule-1 (KIM-1), osteopontin, and renal papillary antigen 1 (RPA-1).
This is the second article of a series of three. The first in the series documented the detailed methodology of the study of which the results in this article form part and also reported the biological variation, reference change values (defined as the critical difference that must be exceeded between two sequential results for a significant [or true] change to occur) (Fraser 2001), and reference ranges for 5 traditional (2 plasma and 3 urinary) and 9 novel (1 plasma and 8 urinary) biomarkers of renal injury (Pinches et al. 2012a [this volume]). The third assesses any gender differences between biomarker responses and correlates these changes with histopathological findings (Pinches et al. 2012b [this volume]).
Methods
A detailed methodology for this study was reported in the first article in this series (Pinches et al. 2012a). In brief, 85 male HsdHAN Wistar rats supplied by Harlan UK were acclimatized for at least 6 days prior to dosing. The animals had free access to pelleted RM1 (E) SQC diet and to water, except during the 6-hour urine collection period when food was temporarily withdrawn. Rats were housed in an accredited facility at AstraZeneca Research Facilities (Nether Alderley, Cheshire, UK). All animal procedures were carried out under local Ethical Committee guidelines and followed the UK Home Office (1989) “Code of Practice for the Housing and Care of Animals Used in Scientific Procedures.”
Study Design
Seven groups of 10 male HAN Wistar rats were given a single dose of 0.1 mg/kg, 1 mg/kg, or 2.5 mg/kg cisplatin dissolved in 0.9% physiological saline by intraperitoneal injection on day 1. Three control groups of 5 male HAN Wistar rats were also given the same volume per body weight of vehicle (5 mL/kg) by intraperitoneal injection on day 1. Urine samples were collected on a maximum of 6 occasions with two timed collections on each occasion. The first collection was made for 6 hours followed by a short rest period and then a further collection for 18 hours. Urine collection was performedon days–4/–3 predose and days 2/3, 4/5, 7/8, 14/15, and 21/22 postdose depending upon study group. Blood sampling and necropsy with subsequent histopathology were performed on days 5, 8, and 22. The analysis of novel biomarkers was performed on the urine collected.
Materials
Cisplatin (cis-diammineplatinum (π) dichloride) (CAS N°15663-27-1) was purchased from Sigma-Aldrich (Gillingham, UK). Doses were selected on the basis of results obtained in an exploratory dose-finding toxicity study where a clear dose response for degeneration/necrosis of the S3 segment of the proximal tubules was observed at 1 and 5 mg/kg on days 2 and 5 and no response was observed at 0.1 mg/kg. The high dose of 2.5 mg/kg was selected in order to establish clear kidney toxicity without lethality.
Urine Collection
Urine samples were taken sequentially by metabowl collection, first for 6 hours, then, following a short rest period (∼1 hr in home cage), for 18 hours. The 6-hour urine collection was made during daylight hours with food withdrawn. The 18-hour collection was made mostly at night (12-hour dark period) with food available. Animals had access to water ad libitum throughout both urine collections. Multiple aliquots of urine were made and analyzed for creatinine, NAG, urine specific gravity, quantitative measurement of glucose, and total protein on the day of collection. Aliquoted samples were stored at –80°C until analysis for the novel biomarkers.
Biomarker Analysis
Urinary biomarkers were assessed using a multiplex ECL-based Meso Scale Discovery (MSD) Sector Imager 6000 instrument (MSD, Gaithersburg, MD, USA). Analysis was conducted using three plate options. α-GST, GSTYb1, and RPA-1 were assessed using the Argutus AKI Test assay kit (MSD, Gaithersburg, MD, USA) as per manufacturer’s instructions. A similar protocol was followed for analysis of lipocalin-2, osteopontin, albumin, and KIM-1 1 using kidney injury panel 1 assay kit (MSD, Gaithersburg, MD, USA). Details of the methodology used to analyze urinary and plasma biomarkers and to perform creatinine correction have been described previously (Pinches et al. 2012a).
Statistical Analysis
Data was collated and analyzed using Excel (Microsoft, Seattle, WA) and statistical analysis performed using Analyse-it (Leeds, UK).
Investigating the influence of normalization factors
We initially investigated to see if either urine creatinine concentration or urine volume were influenced by either dosing with cisplatin or by period of collection in both sexes. For urine volume, we corrected for duration of collection in the 18-hour collections by dividing by 3 (18 hr/6 hr). For creatinine, we normalized values by volume and then by duration of collection. Normalization by volume was done by calculating the product of the urinary creatinine and the urine volume for each of the two collection periods (urine analyte concentration × urine volume). Then the 18-hour collection values were corrected for duration of collection by dividing by 3. Groups were then compared using a Student’s t-test with a probability of rejecting the null hypothesis of p < .05.
Investigating the influence of collection period on novel biomarkers
To investigate the influence of collection period on the excretion of the urinary biomarkers (including creatinine) in normal animals, we initially focused on control animal samples. For this analysis, we normalized biomarker values by volume and then by duration of collection in a similar manner to that used for creatinine above. We then calculated the bias (difference in means), 95% confidence intervals (bias ± 1.96 SD), and p-values (the probability of rejecting the null hypothesis, that the bias is equal to zero, when it is in fact true) between these pair of values for each biomarker using a method described by Altman and Bland (1987).
Determining the correlation between collection periods
To ascertain if biomarker signals seen postdosing were similar between collection periods, we calculated the correlation and bias between collection periods for all samples (dosed and control) taken during the study. For this analysis, we normalized urinary biomarkers for creatinine concentration (corrected value = biomarker/creatinine concentration), as it is standard practice for urinary biomarkers to be normalized for creatinine. We then calculated Pearson correlation (r-value) and p-value (calculated using the t approximation—where p < .05 implies that the two are correlated) (Sheskin 2003), bias, and bias confidence intervals for all samples (dosed and control) using Analyse-it software (Leeds, UK).
Determining the agreement between collection periods
Finally, we determined the agreement between the two collection periods using a semiqualitative method. Initially we calculated the fold change over predose value for each biomarker value (corrected for creatinine). This was then determined either to be “elevated” or “normal” depending upon whether the value exceeded the reference change values outlined in the first article in this series (Pinches et al. 2012a) (the reference change value is the cut off value at which any greater sequential change is considered significant). We then used a method previously described by Fleiss (1981) to determine the agreement between the two collection periods. Contingency tables were generated, kappa statistics calculated (Table 4), and the p-value (where p < .05 implies that the agreement between the variables is not due to chance), and confidence intervals calculated using Analyse-it software (Leeds, UK). The Kappa statistic measures the degree of agreement between the collection period interpretation (elevated vs. normal) above that expected by chance alone. It has a maximum of 1 when agreement is perfect, 0 when agreement is no better than chance. Other values can be roughly interpreted as follows: < .20 poor, < .40 fair, < .60 moderate, < .80 good, 1 very good (Landis and Koch 1977).
Results
Histological Observations
The histological findings observed were in concordance with those expected for cisplatin induced renal tubular injury in rats (Racusen and Kasgarian 2007). A full description and images of the lesions can be found in Pinches et al. (2012b). In brief, there was dose dependent tubular necrosis (principally to the S3 segment) followed by subsequent tubular regeneration and repair. The tubular necrosis was of maximal incidence and severity in the high-dose male rats at day 5. The mid-dose rats also had evidence of tubular necrosis and regeneration but at a reduced incidence and severity. The low-dose rats have minimal findings with only two males showing minimal evidence of tubular necrosis at any time point. At day 22, high-dose rats showed evidence of recovery, although minor findings were still observed (nuclear pleiomorphism, regenerative hyperplasia).
Biomarker Results
Mean group urinary biomarker concentrations (corrected for creatinine) and mean urinary volume and creatinine (corrected for period) are shown Table 1.
Group mean and standard deviation for each urinary biomarker (corrected for creatinine) at each time point for both 6-hour and 18-hour collections in male rats dosed with 0 mg/kg, 0.1 mg/kg, 1 mg/kg, and 2.5mg/kg cisplatin i.p.
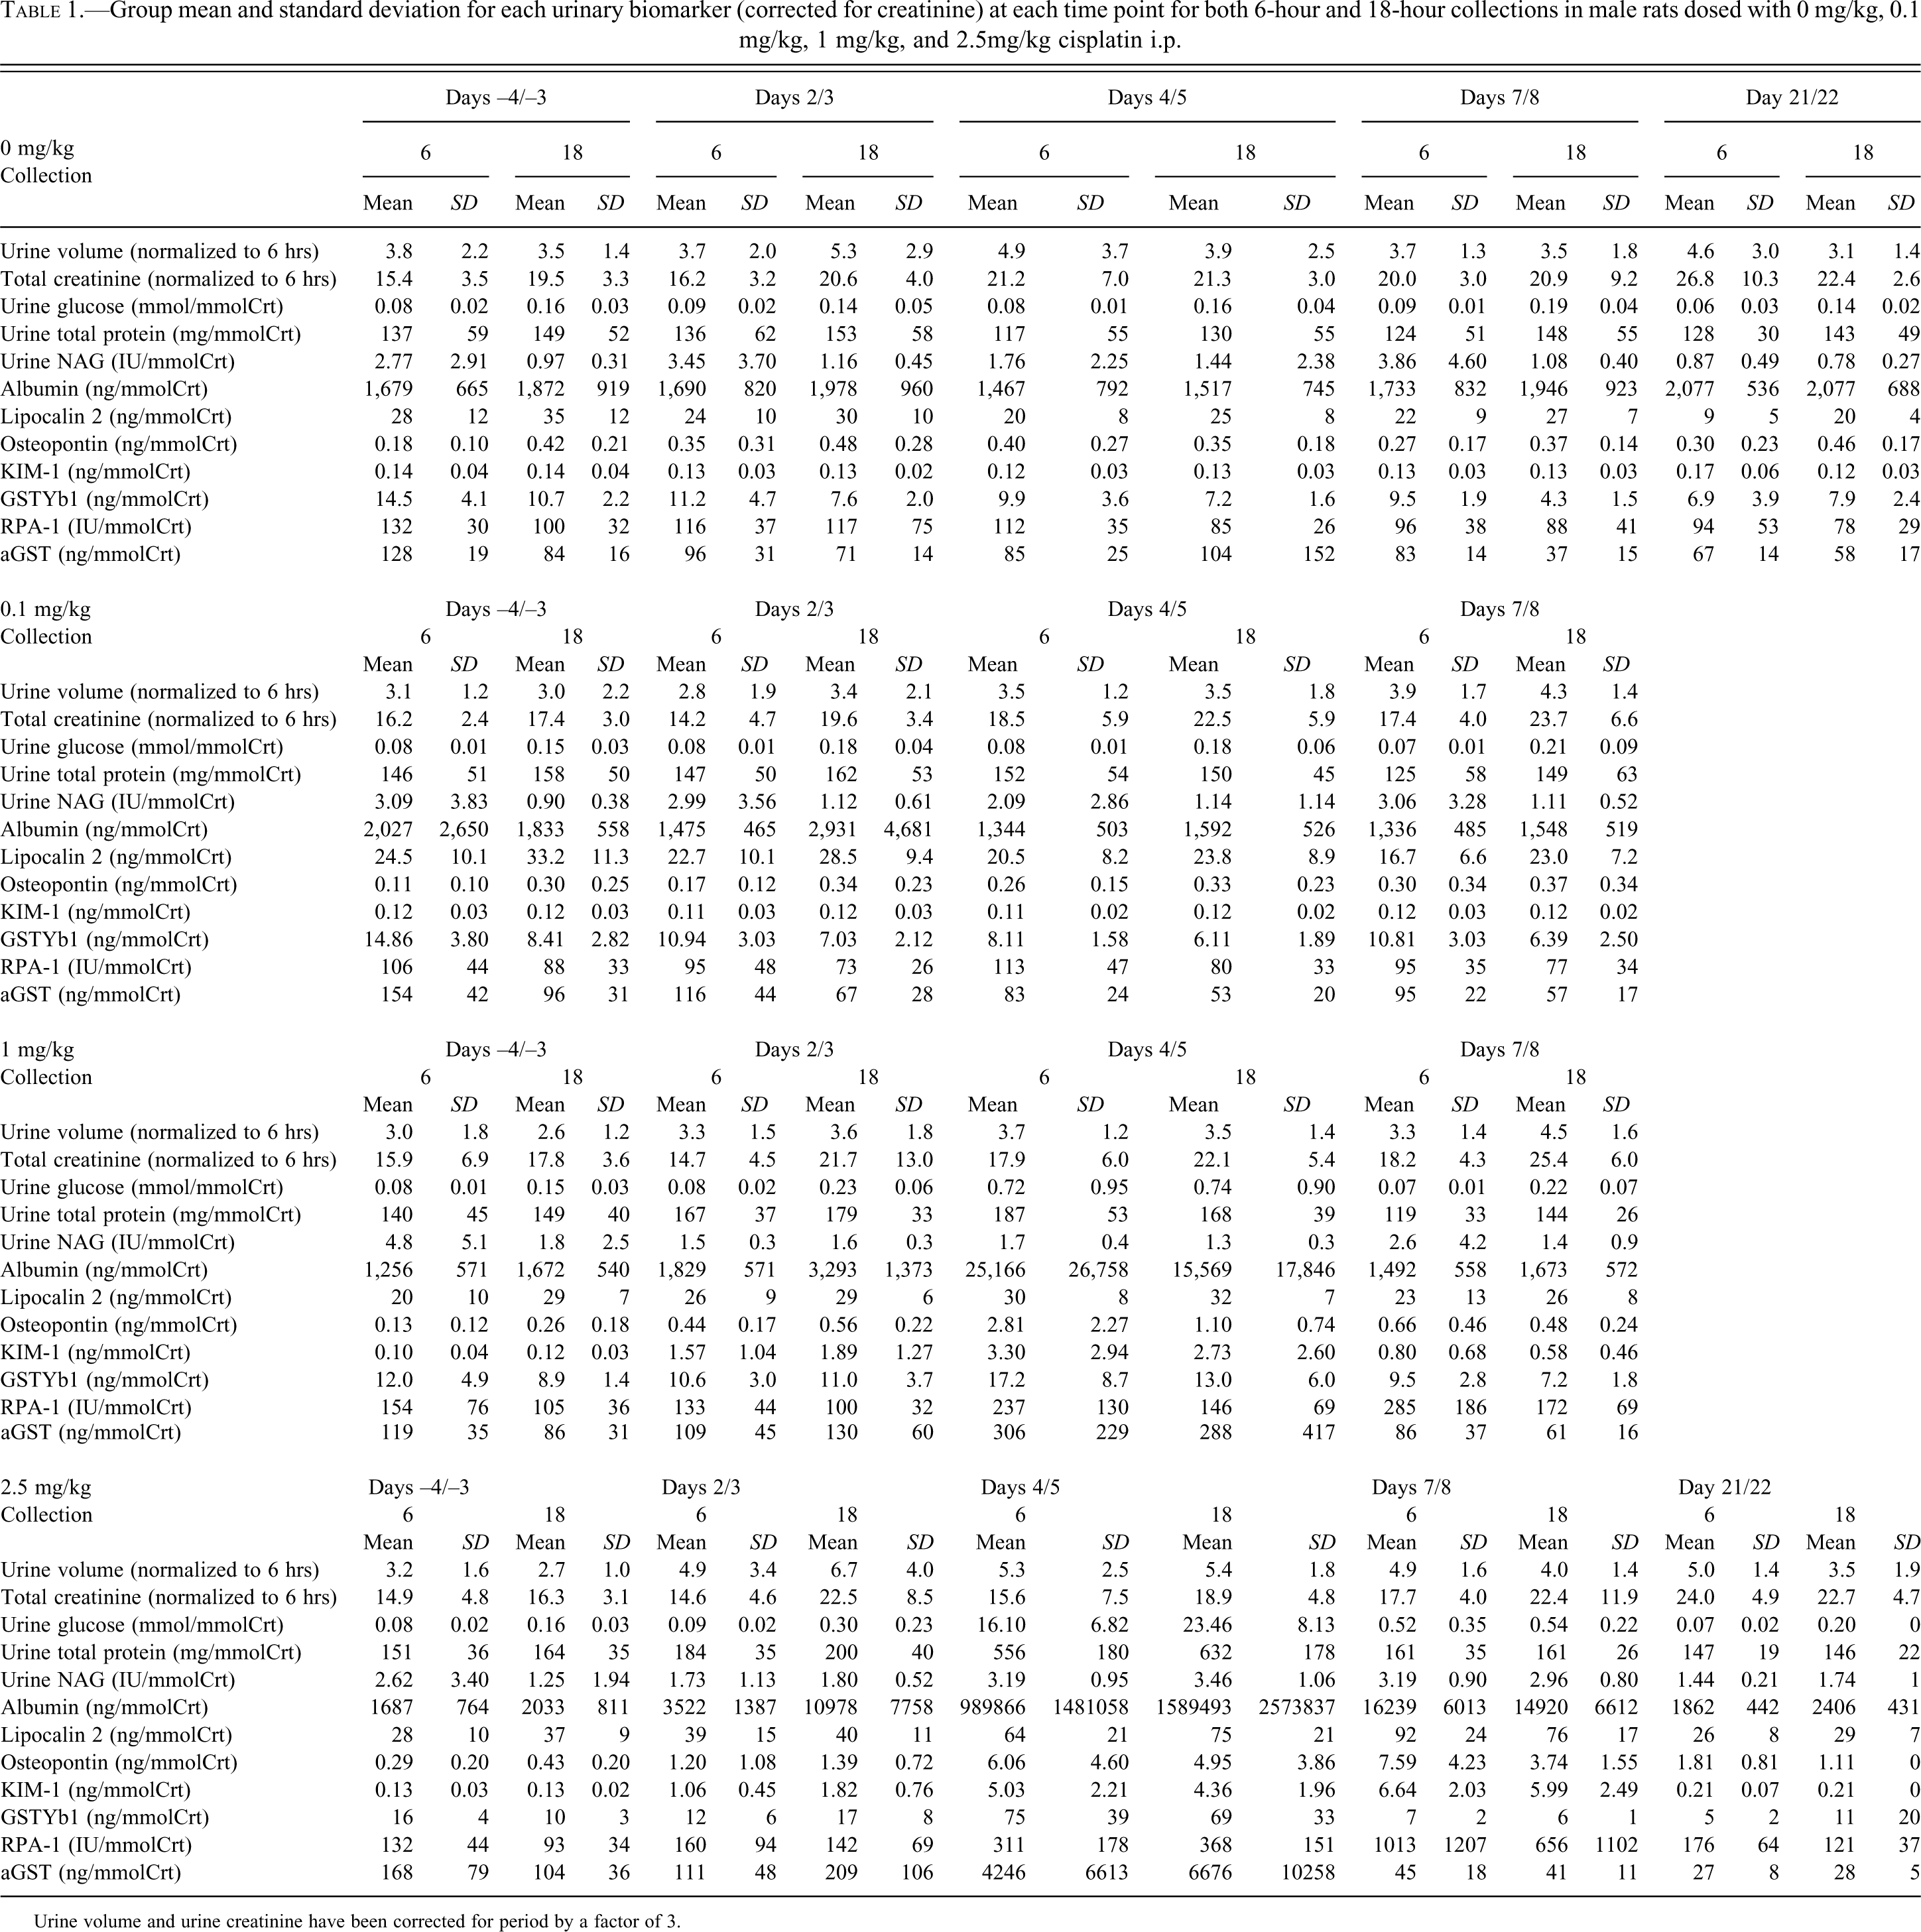
Urine volume and urine creatinine have been corrected for period by a factor of 3.
Investigating the Influence of Normalization Factors
There were no significant differences in total creatinine excretion between the treatment and control groups at any time point for either collection period (6 hours or 18 hours). There were also no significant differences in urine volume when corrected for time for each collection period (p = .85), or for dosed animals (p = .56).
However, significantly higher (p < .001) creatinine excretion was observed for the 18-hour collections compared with the 6-hour collections when corrected for time. The mean difference in creatinine excretion at 18 hours was 10 mmol/L. From this it can be extrapolated that 18-hour creatinine normalized biomarker estimates should be slightly lower than 6-hour normalized biomarker estimates provided that biomarker excretion is not affected by shorter collection period (due to a proportionally larger denominator).
Investigating the Influence of Collection Period on Novel Biomarkers
In control animals there were significant differences (p < .001) between biomarker excretion during each collection period in albumin, lipocalin, osteopontin, GSTYb1, glucose, NAG, and total protein. There were no differences in excretion during collection period for KIM-1 and RPA-1. With the exception of GSTYb1 and NAG, all other biomarkers had higher excretion during the 18-hour collection period. The bias and p-values from paired tests are shown in Table 2.
Bias, 95% confidence intervals (CI), and p-values for differences between urinary biomarkers (corrected for period) collected sequentially for 6 hours then 18 hours from control animals.
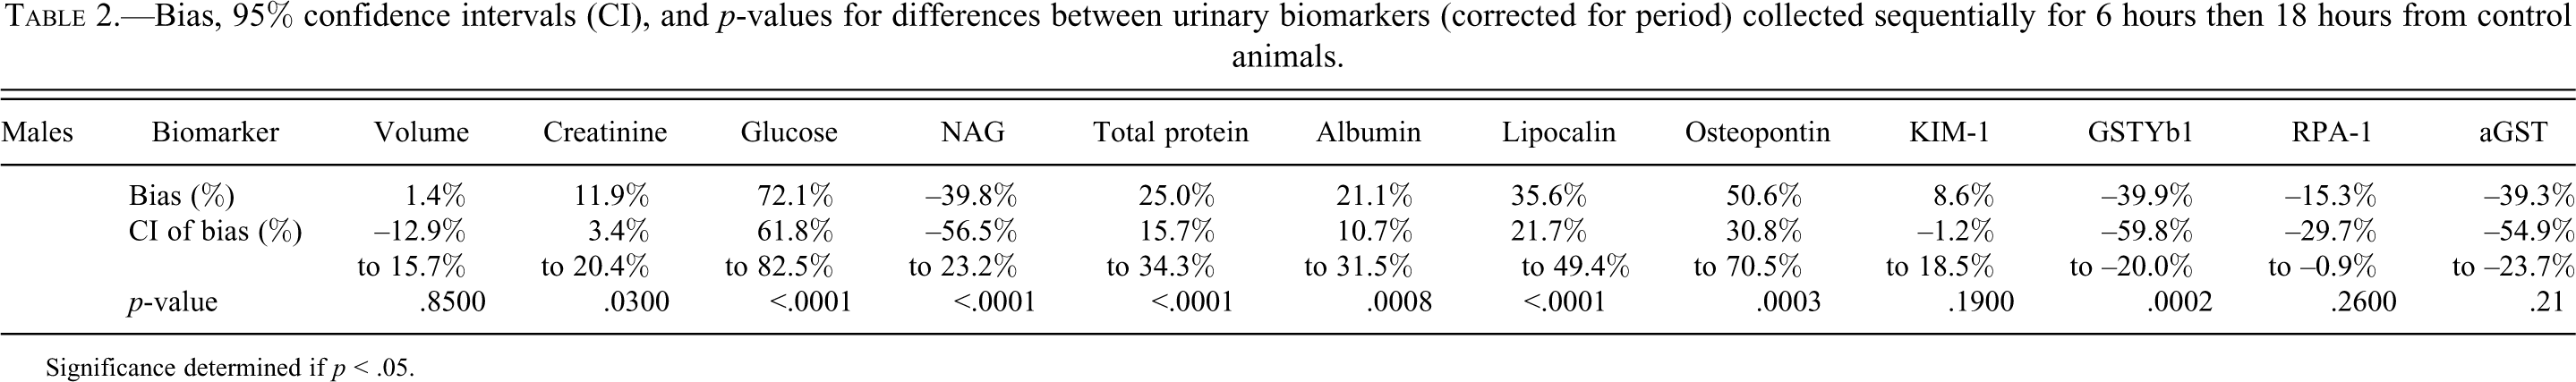
Significance determined if p < .05.
Determining the Correlation between Collection Periods
Results of the correlation are shown in Table 3. Correlation between collection period was generally high (r > .8), although NAG and aGST had limited correlation. Bias between collection periods was <25% for all biomarkers except glucose and NAG, where there was moderate (30%) to marked (65%) bias.
Bias and Pearson correlation coefficients for differences between urinary biomarkers (corrected for urinary creatinine) collected sequentially for 6 hours and then 18 hours from male rats dosed with either 0 mg/kg, 0.1 mg/kg, 1 mg/kg or 2.5 mg/kg cisplatin i.p.
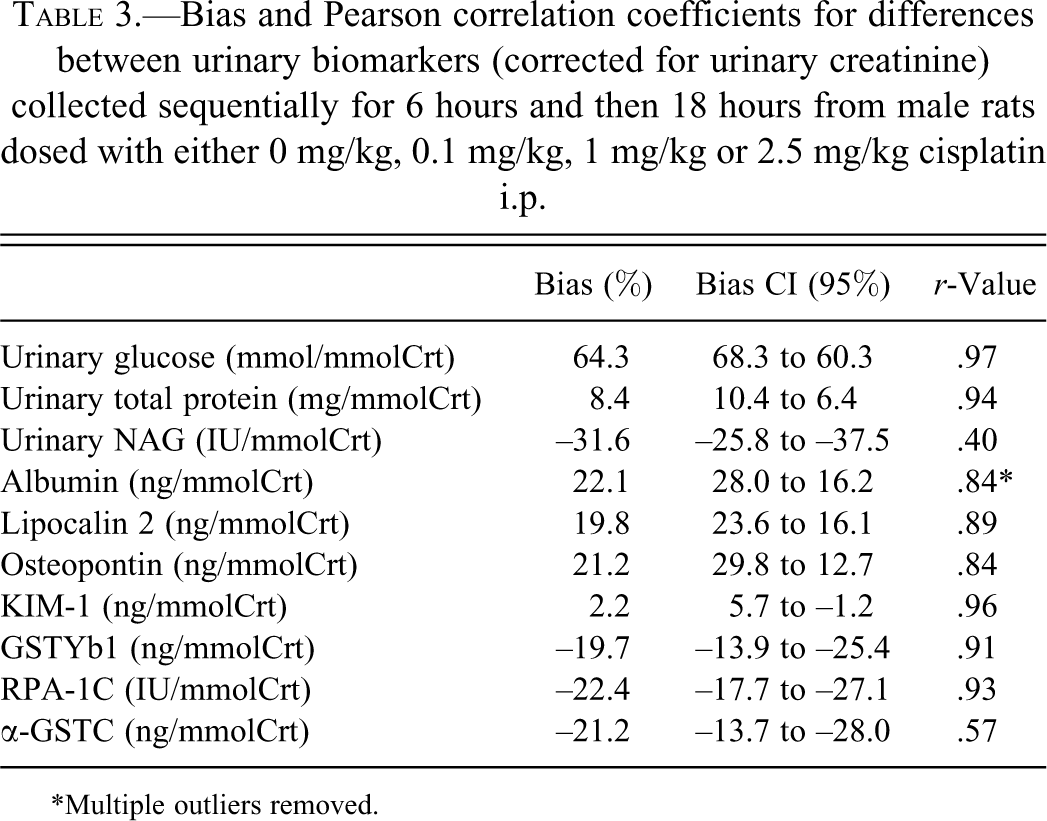
*Multiple outliers removed.
Determining the Agreement between Collection Periods
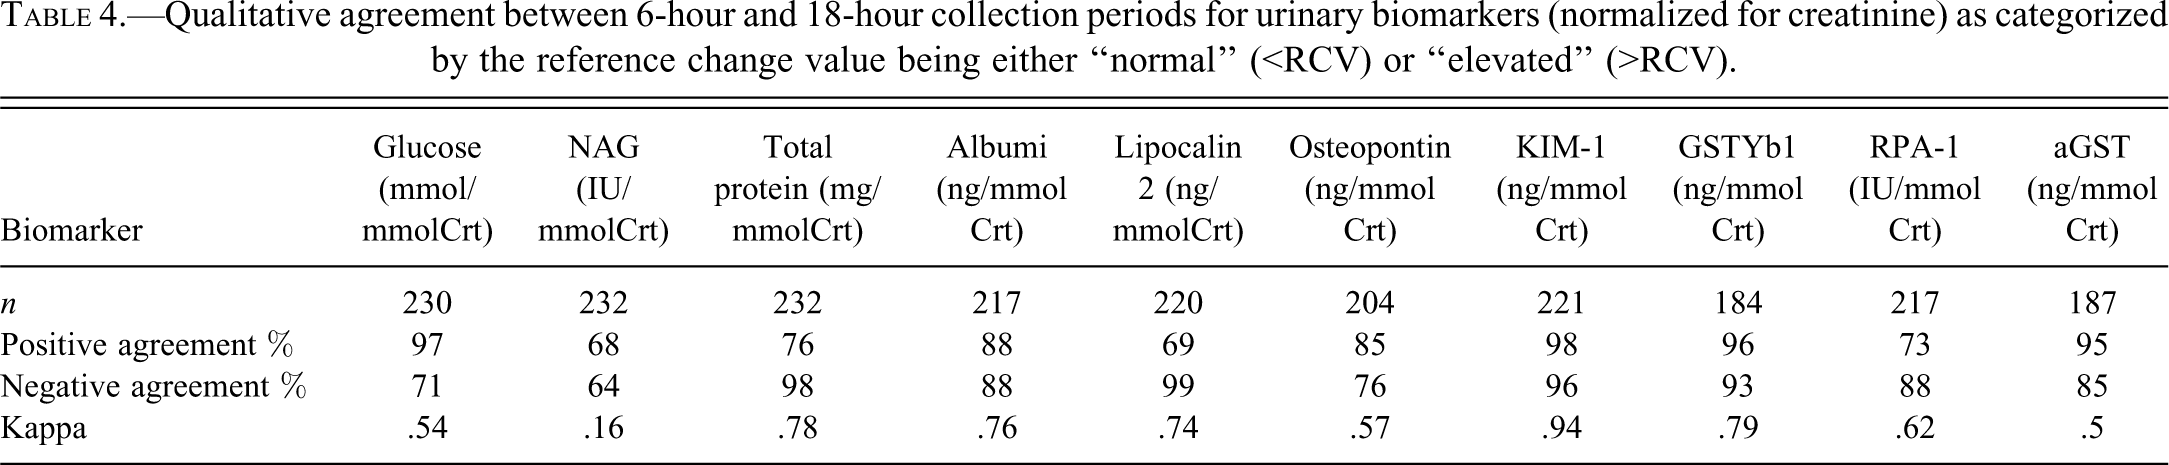
Results of the agreement analysis are shown in Table 4. Slight agreement (<.2) was demonstrated for NAG and moderate agreement (.41–.6) was demonstrated for glucose, osteopontin, and aGST. Substantial agreement (.61–.8) was demonstrated for total protein, albumin, lipocalin, GSTYB1, and RPA-1; while almost perfect agreement (>.8) was demonstrated for KIM-1.
Qualitative agreement between 6-hour and 18-hour collection periods for urinary biomarkers (normalized for creatinine) as categorized by the reference change value being either “normal” (<RCV) or “elevated” (>RCV).
Discussion
This study assesses the influence of two different urine collection protocols on both the baseline, and response of, urinary biomarkers to renal injury induced by cisplatin. Our data show that although there are differences in the biomarker excretion between collection periods (8–51% for the novel biomarkers) for most biomarkers, these differences do not, for the majority of biomarkers, impact on the subsequent interpretation.
In this study we show that in undosed animals the excretion of urinary biomarkers albumin, lipocalin, osteopontin, GSTYb1, glucose, NAG, and total protein vary significantly between the short and long collection periods used in this study. These findings indicate that it is not appropriate to directly compare urinary biomarker values (original urinary concentration, total excretion per unit time, or creatinine normalized value) collected by the two different protocols for these biomarkers. In addition, we find that variability in baseline excretion of urinary creatinine (12%) also limits direct comparison between collection protocols for nomalized values of any urinary biomarker (due to potential error introduced by the normalizing factor creatinine).
In this study, the two collection protocols were different from each other in a number of ways. Apart from the difference in the duration of collection, the longer (18-hour) collection period also included a 12-hour nocturnal phase. During this time, the rats had constant access to food. In contrast, the shorter 6-hour collection period was made during daylight hours only, and access to food was restricted. These differences are very likely to account for the variation in urinary biomarker noted in this study.
We found that in general terms, the enzymes analyzed (NAG, GSTYb1, and aGST) showed reduced excretion (–40%) during the 18-hour collection; whilst urinary proteins, glucose, and creatinine were excreted at an increased rate/at higher concentrations (albumin 21%, lipocalin 36%, osteopontin 51%, glucose 72%, and total protein 25%). In accordance with these findings, Maruhn and colleagues (1977) reported that urinary enzyme excretion decreased during the nocturnal period and was highest during the daylight period. They also showed that this finding appears to be unrelated to overall renal function. However, as these enzymes are derived from the kidney tubular epithelium, then diurnal changes to cell permeability and enzyme release may be responsible. The cause of this is unknown, but it may be as a consequence of physiological changes associated with the strong diurnal variations in physical activity exhibited by rats, being much more active at night (Scales and Kluger 1987). A further possibility is that preanalytical enzyme degradation occurs during the longer collection period. However NAG, aGST, and GSTYb1 have been shown to be stable for at least 3 days at 4°C both in our laboratory (data not shown) and by others (R. Connolly, personal communication).
Rodents also have a strong preference for nocturnal feeding (Shepherd 1986). This preference is thought to be associated with the well-recognized diurnal variation in urinary glucose (Kinter 2005). In the present study, the variation in urinary glucose between the collection protocols may also have been exacerbated by the removal of food from the metabowl environment during the day. Food is withdrawn so as to improve urine sample quality by reducing contamination with waste food debris.
Diurnal variation in total protein and albumin have also been previously described (Pons et al. 1996). In their study, nocturnal increases in the urinary component of plasma proteins (total protein and albumin) were attributed to changes in systemic blood pressure, renal blood flow, and glomerular filtration rate. In the present study we also demonstrate that lipocalin and osteopontin have significant variation between collection periods of a greater magnitude than albumin or total protein. The reasons for this remain unclear, but may also be due to diurnal changes to cell permeability or to the circadian rhythmicity in renal haemodynamics.
Only KIM-1 and RPA-1 failed to show any significant difference in urinary excretion between collection periods. For KIM-1 this may reflect the virtual absence of excretion in urine in healthy animals, as KIM-1 is selectively expressed only in injured renal tissues (Vaidya, Ferguson, and Bonventre 2008; Zhou et al. 2008), but for RPA-1 the reasons remain unclear.
This study also highlights the potential limitations of normalization by creatinine, as we found that creatinine excretion varied significantly between collection protocols. This finding is in accordance with Roelfsema and colleagues (1980), who showed that creatinine excretion is subject to circadian variation. However, as creatinine is used as the standard normalization method for urinary parameters, it has the potential to introduce an additional error if normalized values are used for cross-study comparison when the collection protocols vary between studies. Such comparisons and associated meta-analyses are becoming more frequent with the drive by pharmaceutical collaborations to generate and present urine data on novel biomarkers to regulatory authorities (Goodsaid, Frueh, and Mattes 2008). Therefore, the influence of the light/dark regime, feeding and watering regime, and wider husbandry issues should be taken into account when making direct comparisons of normalized biomarker values across studies and sites.
Despite these limitations and the evident variation in biomarker excretion between collection protocols in undosed animals, we also show that for most biomarkers, serial urine samples taken from animals undergoing renal injury, are correlated when evaluated by quantitative or qualitative methods. With the exception of NAG and aGST, all biomarkers showed a high level of correlation (r > .8) between collection protocol when comparing all animals (dosed and undosed). In essence, this supports the hypothesis that the dynamic biomarker profiles seen in urine following renal injury are equivalent for the two collection protocols. That is, a raised biomarker value seen during a 6-hour collection is very likely to be accompanied by a raised biomarker value seen during a subsequent 18-hour collection. This correlation occurred despite the expected longitudinal variation in the magnitude of biomarker excretion between collection periods following the point injury induced by cisplatin (i.e., collections at 24–30 hours versus collections at 30–48 hours post-cisplatin administration, where injury may be progressive and worsening). This finding provides reassurance that a shorter collection period can be used without significantly affecting study outcome. We further explored this by determining the level of agreement between “normal” and “elevated” biomarker values for both collection protocols and found that there was substantial to almost perfect agreement for albumin, lipocalin, GSTYb1, RPA-1, and KIM-1.
In this study, we describe clear differences in urinary biomarker excretion between short and long collection protocols from undosed rats. But despite the variable excretion of a number of biomarkers and the normalizing factor creatinine, we also show that shorter collection protocols do not influence the subsequent interpretation of urinary biomarker data for most novel biomarkers in this model.