
Abstract
The aim of this retrospective study was to assess the incidence and severity of tubular atrophy/hypoplasia in the testes of 104 control Göttingen minipigs aged 4.5 to 15 months. The finding was termed “tubular hypoplasia/atrophy” according to published descriptions for the dog. It included different microscopic changes that were considered part of a continuum, namely seminiferous epithelium vacuolation, presence of multinucleated germ cells in the tubular lumen, and decreased numbers (hypospermatogenesis) or absence of germ cells. This retrospective study demonstrates that tubular hypoplasia/atrophy is present in more than 70% of Göttingen minipigs and can occur at a marked severity in control animals. It correlated with a higher level of cell debris and a decrease in sperm content in the epididymides and with lower absolute and relative testes weights. There was no correlation with the weight of other sexual organs, total bodyweight, or age, which demonstrates that this change was not related to sexual immaturity. The distinction between this background finding and a compound-related effect could be challenging for the pathologist.
Introduction
Microscopic evaluation of the testes is a key step in the evaluation of toxicological effects on spermatogenesis in all species. Guidelines were updated to include thorough microscopic evaluation of the testes, and state-of-the-art recommendations were published (Creasy 1997; Lanning et al. 2002). In these articles, the authors pointed out the complexity of the testicular evaluation and the absolute necessity to interpret the microscopic changes observed in the light of the spontaneous findings.
Testicular histological background findings are well characterized in most of the species used in toxicology (Russell et al. 1990; Rehm 2000; Goedken, Kerlin, and Morton 2008). However, in the Göttingen minipig, literature on background pathology in any tissue is sparse (Myren, Einer-Jensen, and Bennett 1989; Jorgensen et al. 1998; Franca et al. 2000), and only a few reference articles were found concerning spontaneous testicular changes in this species (Dincer et al. 2007; Creasy 2012; Creasy et al. 2012). The frequent spontaneous microscopic changes observed in the testes of this species, as in the dog, can render an accurate toxicological evaluation difficult for the pathologist. In male minipigs, sexual maturity is said to occur between 4 and 6 months of age (Jorgensen et al. 1998; Svendsen 2006). Except dedicated juvenile studies, the toxicology studies are mainly performed with young adult animals, that is, for minipigs, about 4 months of age, but no references were found to document the influence of age on the testicular morphology in minipigs. Considering the increasing use of the minipig in toxicology, the absence of adequate knowledge on background testicular findings could hinder proper assessment of drug safety. We therefore conducted a retrospective study in 104 Göttingen minipigs to characterize these changes and to evaluate their incidence, severity, and relationships with other parameters.
Materials and Methods
Animals
Testes and epididymides of 104 Göttingen minipigs were examined microscopically. The selected minipigs were control animals from a total of 24 different toxicity studies, performed between 2008 and 2011 in 2 different facilities: at Ricerca Biosciences SAS (now WIL Research), Saint Germain-Nuelles, France, or at Galderma Research and Development, Sophia Antipolis, France. All animals were supplied by Ellegaard Göttingen Minipigs, Dalmose, Denmark. They were singly housed and were under normal experimental environmental conditions (environmental temperature 22 ± 3°C, humidity 35 to 70%, or 50 ± 20% with at least 10 air changes per hour, and with a 12 hr artificial light or dark cycle). The age of animals at necropsy ranged from 4.5 to 15 months. Fifty-nine were 4 to 5 months of age, 23 were 6 to 10 months of age, and 22 were older than 10 months of age at necropsy.
All animals came from control groups of toxicological studies and, therefore, received saline only or placebo vehicle by the dermal, intravenous, or oral route for 2 to 39 weeks. None of the selected studies had demonstrated a systemic placebo effect. Each study was conducted in compliance with European regulations governing the housing and the use of animals and following the principles stated in the Guide for the Care and Use of Laboratory Animals (National Research Council 1996). Administration procedures were performed according to the good practice guide to the administration of substances, European Federation of Pharmaceutical Industries and Associations/European Centre for the Validation of Alternative Methods (EFPIA/ECVAM; Diehl et al. 2001), and all protocols were approved by internal ethical committees.
Necropsy and Organ Weight
Total bodyweight was recorded for each animal. The testes and the epididymides were sampled and weighed at necropsy, and then fixed in Davidson’s or modified Davidson’s fluid.
The prostate and the seminal vesicles were sampled and for some of the studies, also weighed. Organ weights were expressed as absolute (in gram) and relative (to terminal bodyweight) weights.
Histological Technique and Evaluation
Testes were trimmed transversely through the middle and embedded in paraffin as a full piece or, for some animals with very large testes, as a half or quarter piece. The epididymides were trimmed longitudinally, including head, body, and tail or transversely (head and tail only). Paraffin blocks were sectioned at 4 µm and stained with hematoxylin and eosin. In some studies, megaslides were used due to the large size of the samples.
Histological slides from both testes and epididymides of the 104 Göttingen minipigs were reevaluated for this retrospective analysis by a single pathologist using light microscopy, and about 20% of all slides were peer-reviewed by another pathologist.
Histological terminology was derived from published nomenclature in dogs (Russell et al. 1990; Rehm 2000; Lanning et al. 2002; Dincer et al. 2007; Goedken, Kerlin, and Morton 2008).
Microphotographs were taken for illustration purposes using an Olympus DP21 microscope digital camera only.
Semiquantitative Evaluation of Microscopic Changes in Testes and Epididymides
Tubular hypoplasia/atrophy in the testes was evaluated using a semiquantitative method, in which the approximate percentage of tubule cross sections with the change was assessed. The grade was considered minimal (grade 1) if less than 5% of tubules were affected, slight (grade 2) if 5 to 25% of tubules were affected, moderate (grade 3) if 25 to 50% of tubules were affected, marked (grade 4) if 50 to 75% of tubules were affected, and severe (grade 5) if more than 75% of tubules were affected. Grade 0 was attributed if no tubules were affected. The stage of development of the change was not taken into account in assessing the grade. These changes in the first four rows of tubules surrounding the rete testis were not considered in the count because they were encountered in almost all animals examined. In the epididymides, tubular sperm content and presence of cell debris were evaluated (semiquantitative evaluation of the whole organ) using a 0 to 3 grading scheme, with grade 0 epididymides having a normal intratubular sperm content and grade 3 the lowest intratubular sperm content. Grading was performed for each testis and each epididymis separately and, where necessary, the highest of the grades was recorded for the animal.
Quantitative Evaluation of Microscopic Changes in Testes
In order to validate the semiquantitative scoring method for evaluation of testes, a quantitative assessment of affected tubules was performed in 40% of the testes. Forty-one animals were included in this analysis; 8 were 4 to 5 months of age, 13 were 6 to 10 months of age, and 20 were older than 10 months of age at necropsy. The total number of tubular cross-sectional profiles in each testis was recorded and the absolute number of tubule cross sections with features of hypoplasia/atrophy was manually counted.
Statistical Analysis
For each animal, the grade of tubular hypoplasia/atrophy in the testes was compared with the grade of corresponding epididymal sperm content, age at necropsy (in months), bodyweight (in grams), and testis, epididymidis, prostate, and seminal vesicle weights (absolute—in grams—and relative to the bodyweight,), using the analysis of variance (ANOVA) method and followed by Tukey’s test if there was a grading score effect. In order to obtain homogeneous numbers of animals per group and considering the low number of animals having the grade 4 testicular finding, animals having a grade 3 or 4 of hypoplasia/atrophy were pooled together.
Comparison between quantitative and semiquantitative evaluation was done by a Wilcoxon test for the overall distribution of grades according to the age categories of minipigs and by a Spearman’s rank correlation test for the correlation between grades for each animal.
Results
Microscopic Findings in the Testes
Semiquantitative Analysis
In all, 74.04% of animals of the cohort showed “tubular hypoplasia/atrophy” of the testes. This terminology was adapted from publications on this subject and included several changes that were considered to be part of a continuum, from a lower number of tubular spermatogenic cells that can appear vacuolated, occasionally associated with intraluminal multinucleated giant cells, to their total absence, the tubules then being only lined by Sertoli cells (see Figure 1A to C). This change had a multifocal distribution in the testes and was composed of small or larger groups of tubules, adjacent to unaffected ones (see Figures 2 –4). The qualitative appearance of the finding did not vary with age.
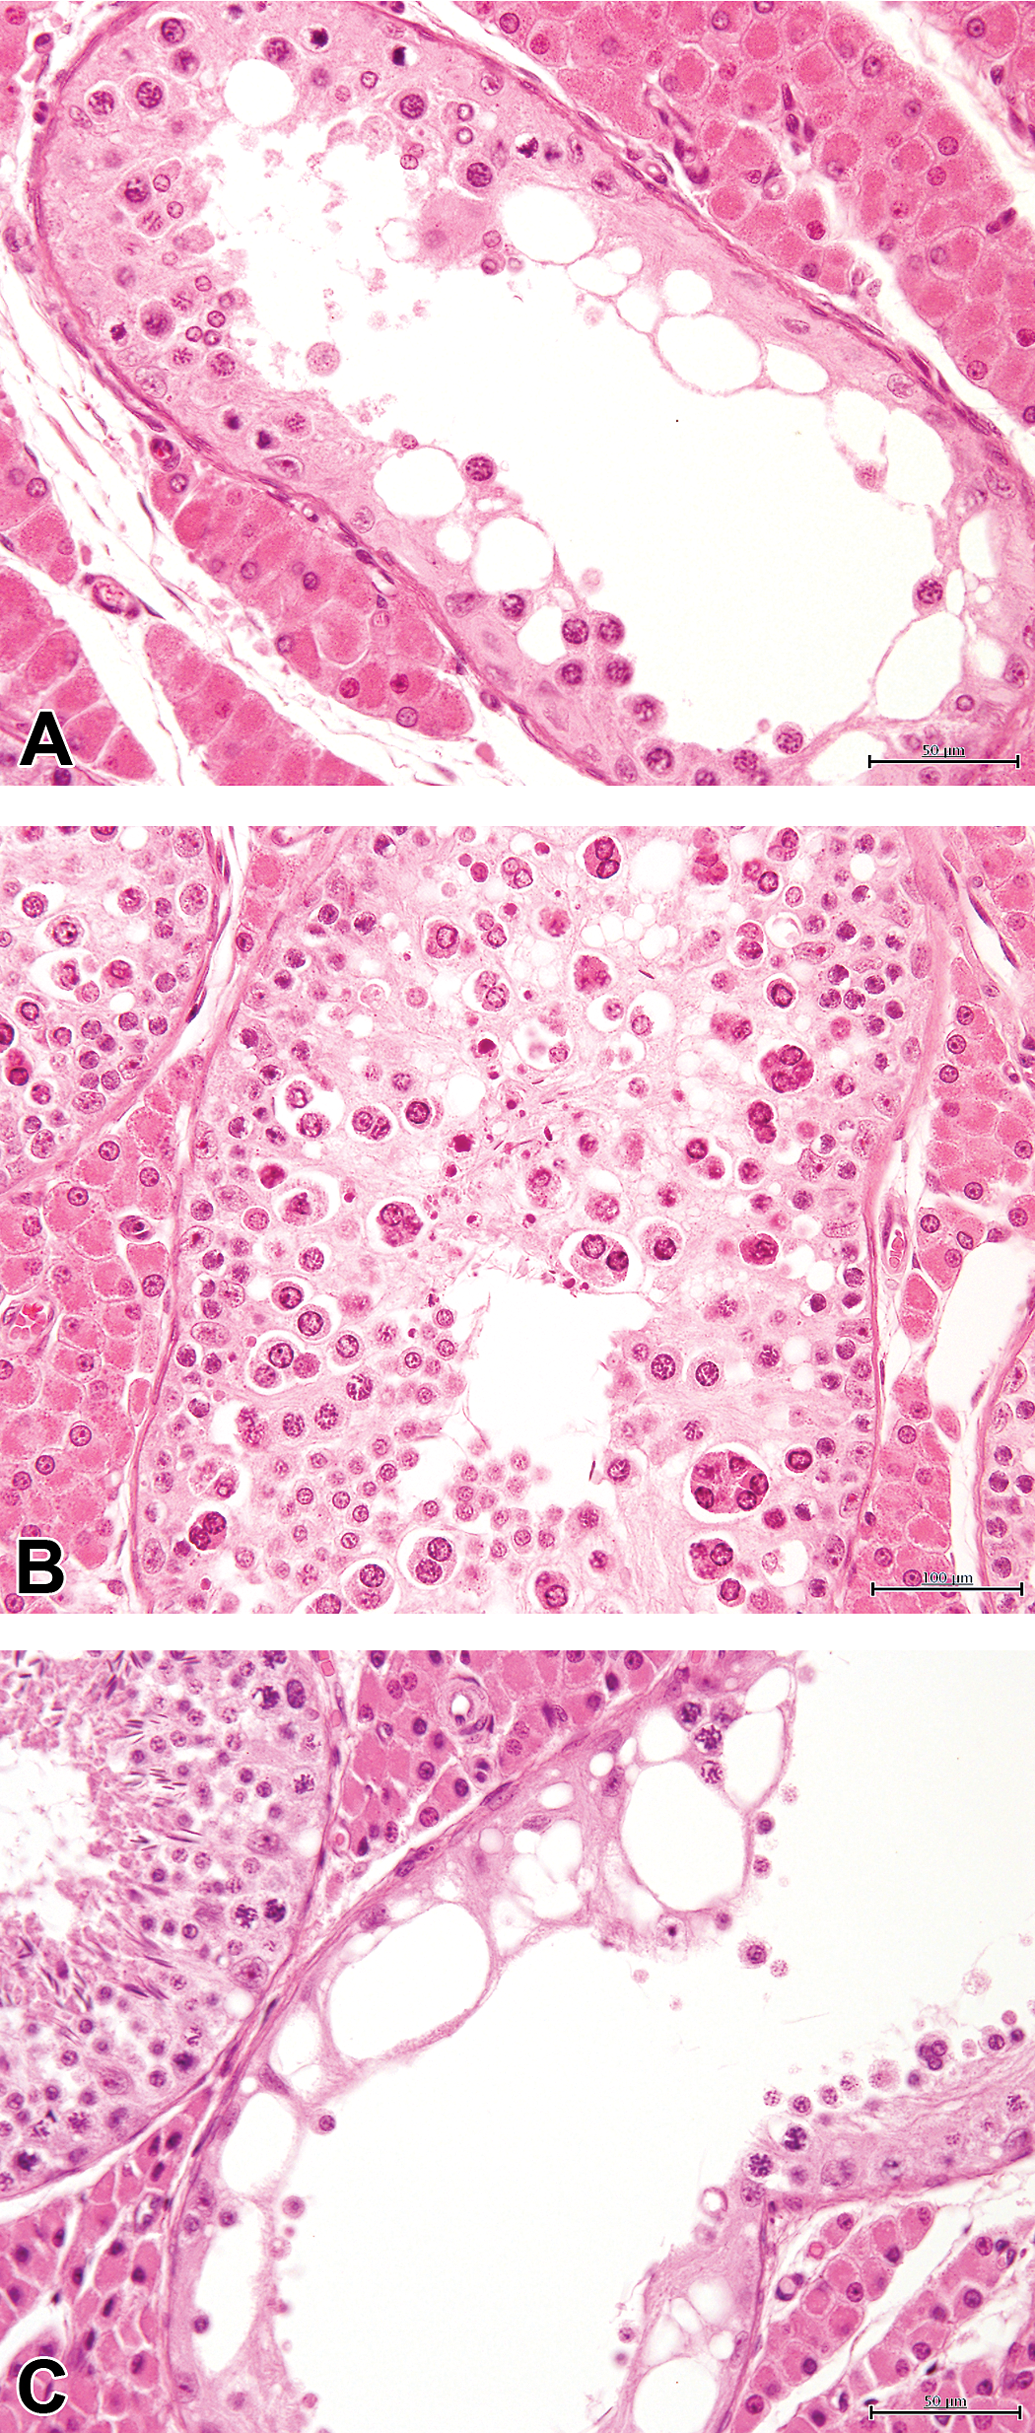
Testicular tubules with features of hypoplasia/atrophy. (A) Decreased number of spermatocytes and round spermatids in tubules with hypospermatogenesis. (B) Numerous round spermatids and multinucleate germ cells, with vacuolated seminiferous epithelium. (C) Tubule showing features of severe hypoplasia/atrophy. Note a normal tubule (upper left). H&E, 40×.
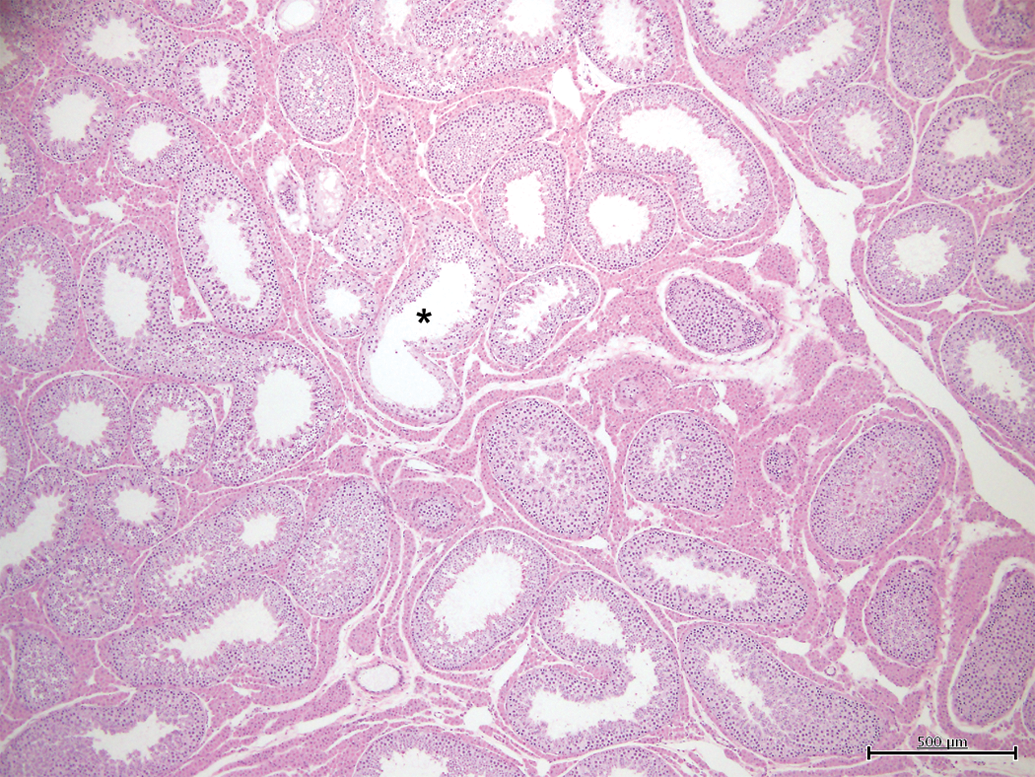
Testis with minimal tubular microscopic changes (grade 1). Less than 5% of tubules show features of hypoplasia/atrophy (*). H&E, 4×.
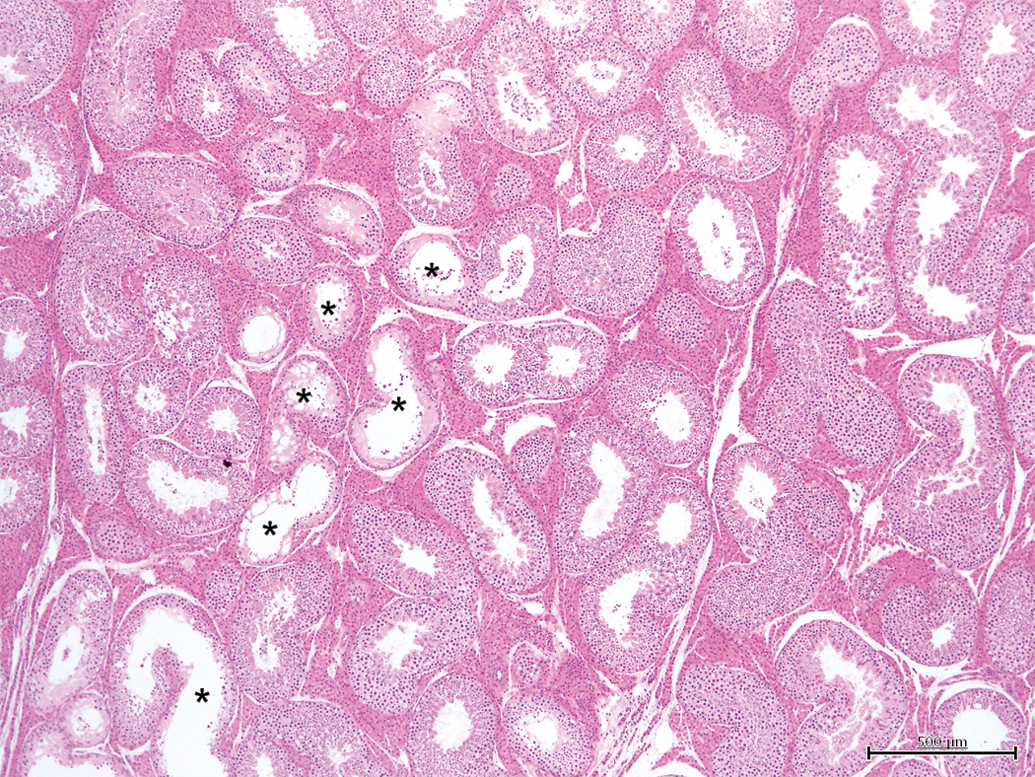
Testis with slight tubular microscopic changes (grade 2). Between 5 and 25% of tubules show features of hypoplasia/atrophy (*). H&E, 4×.
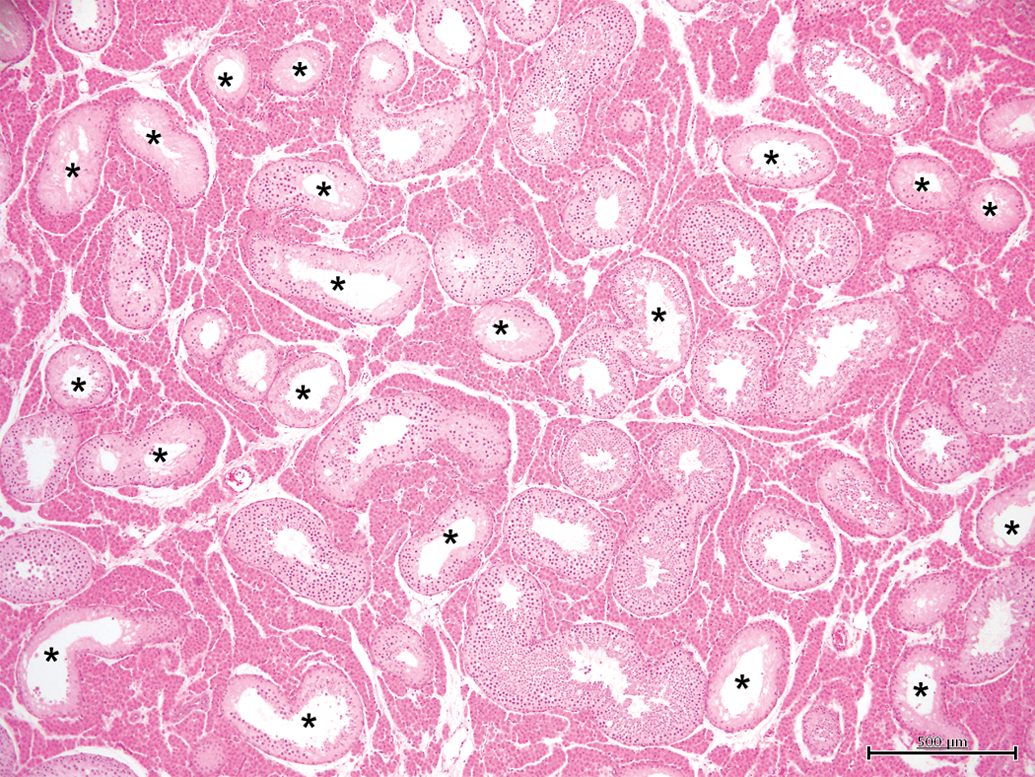
Testis with moderate tubular microscopic changes (grade 3). Between 25 and 50% of tubules show features of hypoplasia/atrophy (*). H&E, 4×.
Of the 59 male minipigs that were necropsied between 4 and 5 months of age, 38 (64.4%) presented features of tubular hypoplasia/atrophy, of which 8 (21.1%) were unilateral and 30 (78.9%) involved both testes. In this age group, 28, 5, 3 and 2 animals showed tubular hypoplasia/atrophy with a grade 1, 2, 3 and 4, respectively (see Figure 5, Table 1).
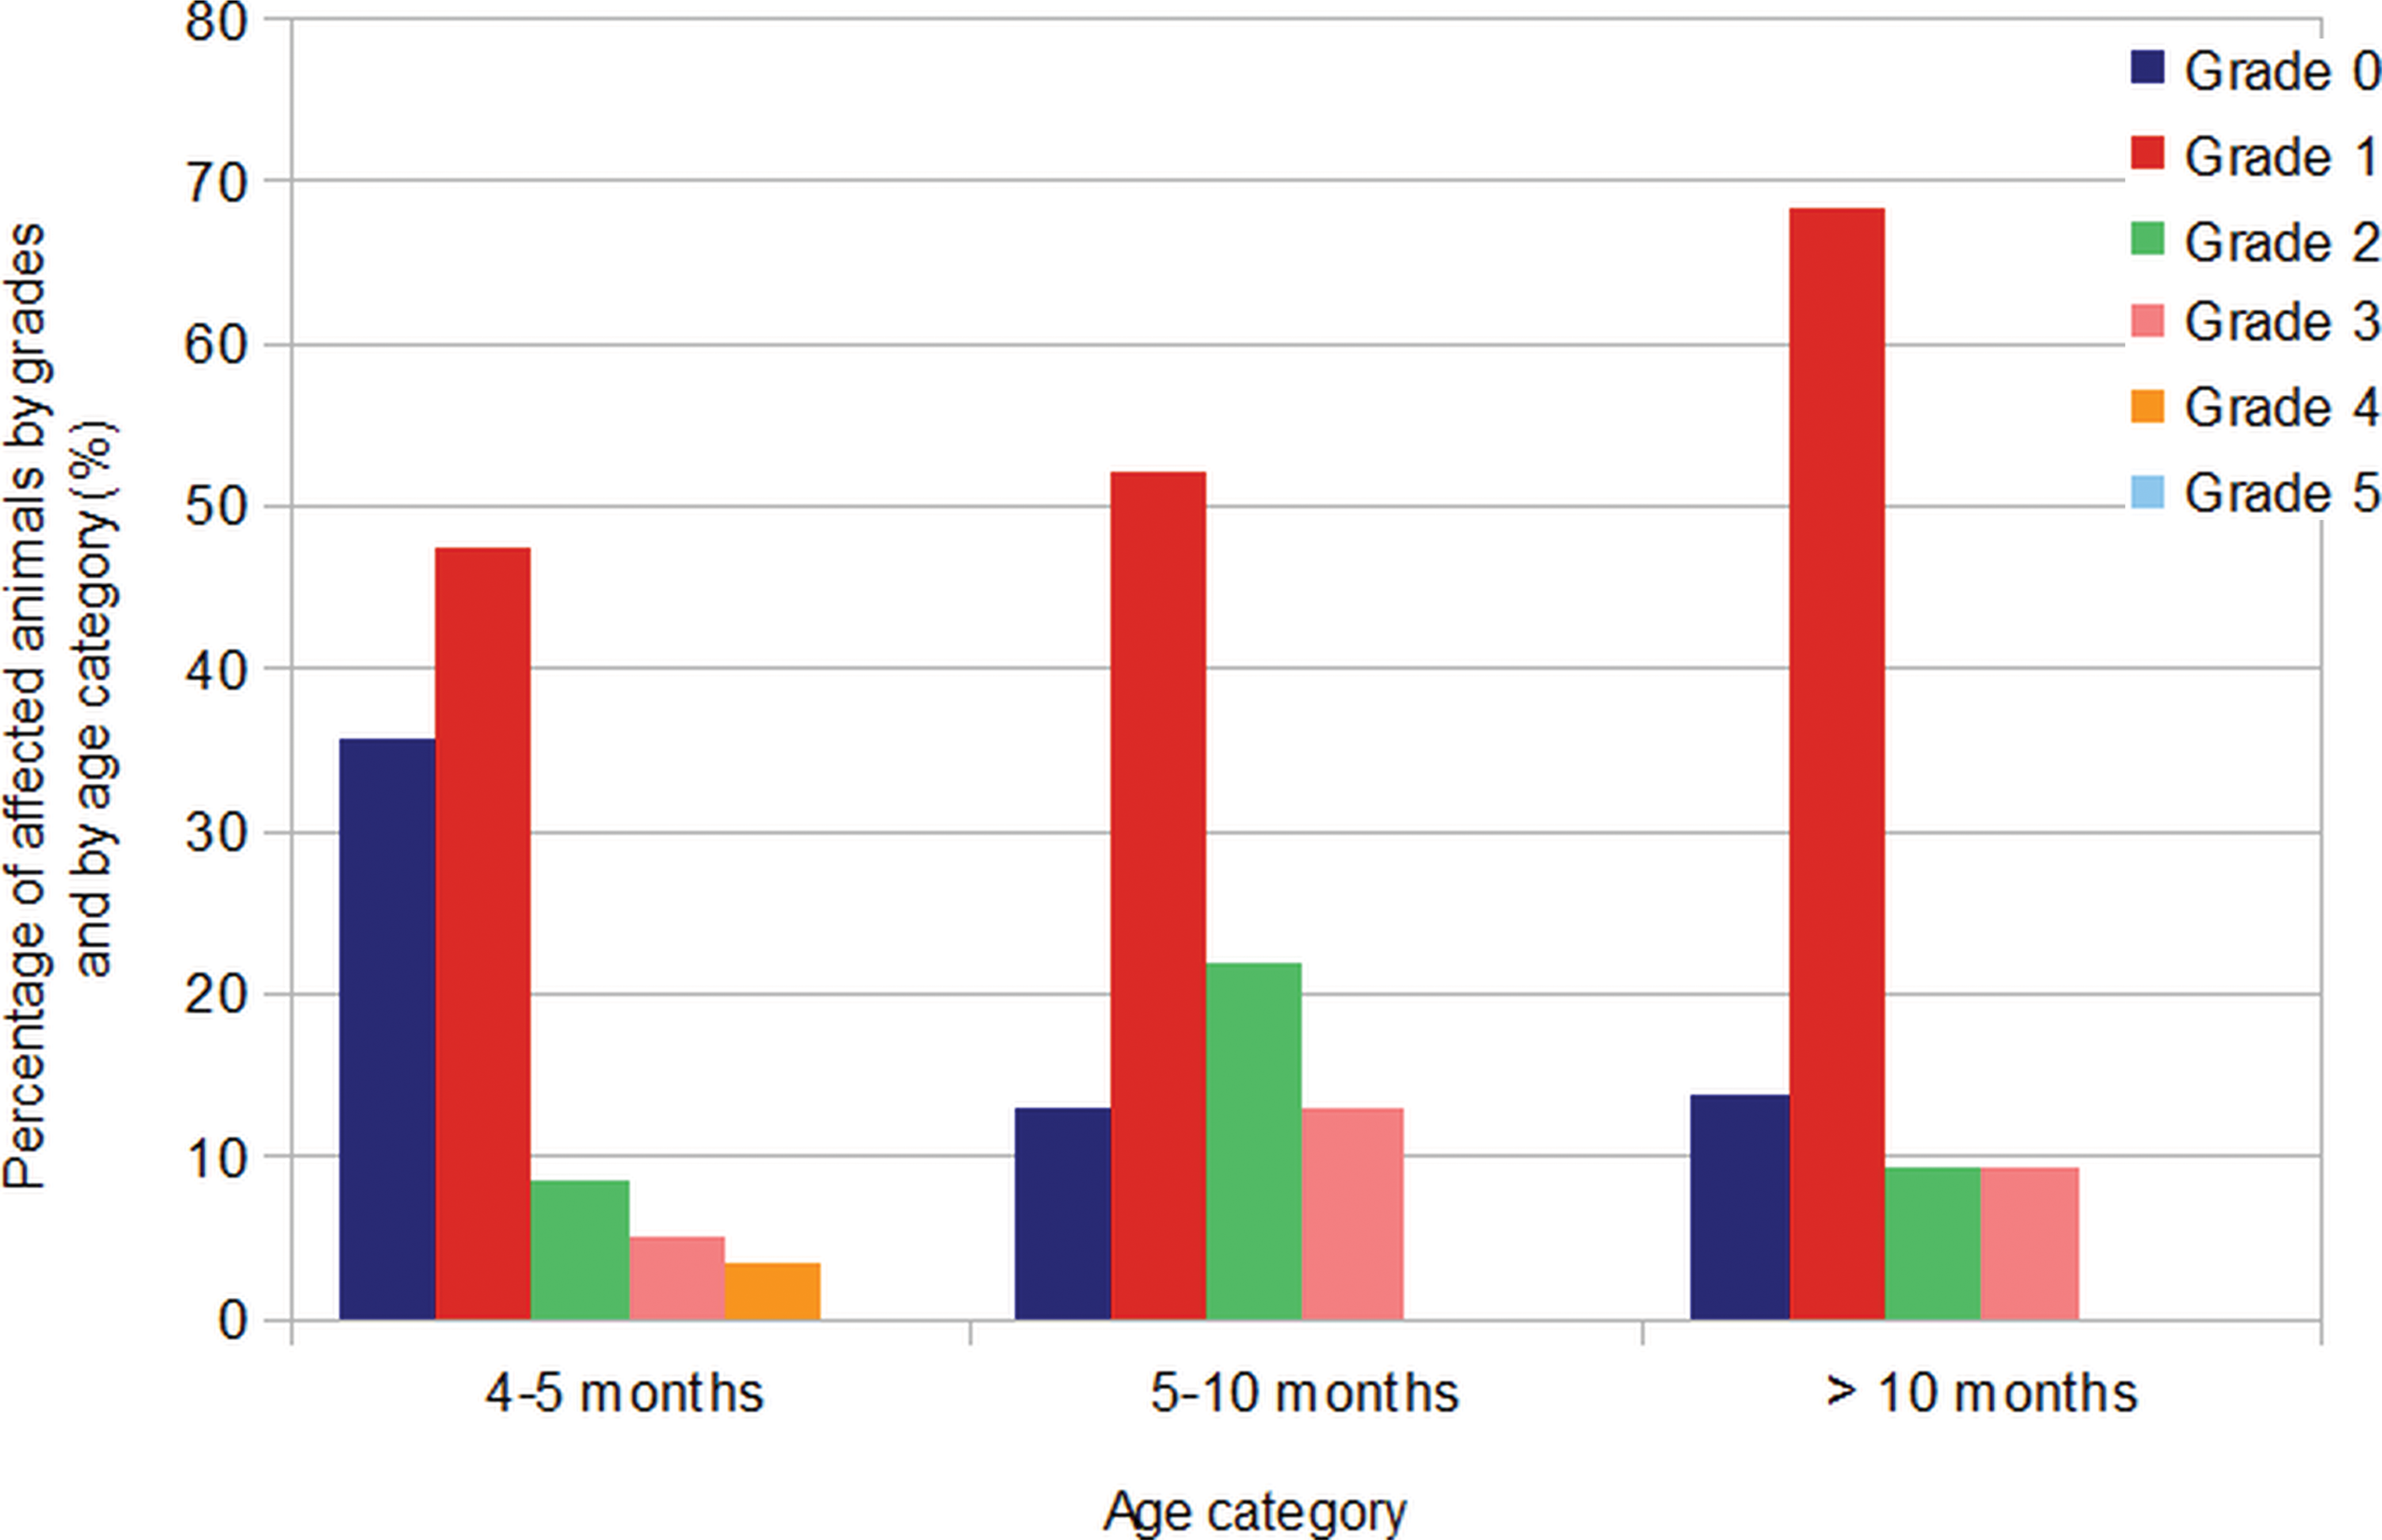
Distribution of the gradings of tubular hypoplasia/atrophy depending on the age of the minipigs (months).
Incidence of the spontaneous finding “tubular hypoplasia/atrophy” in the testes of Göttingen minipigs.
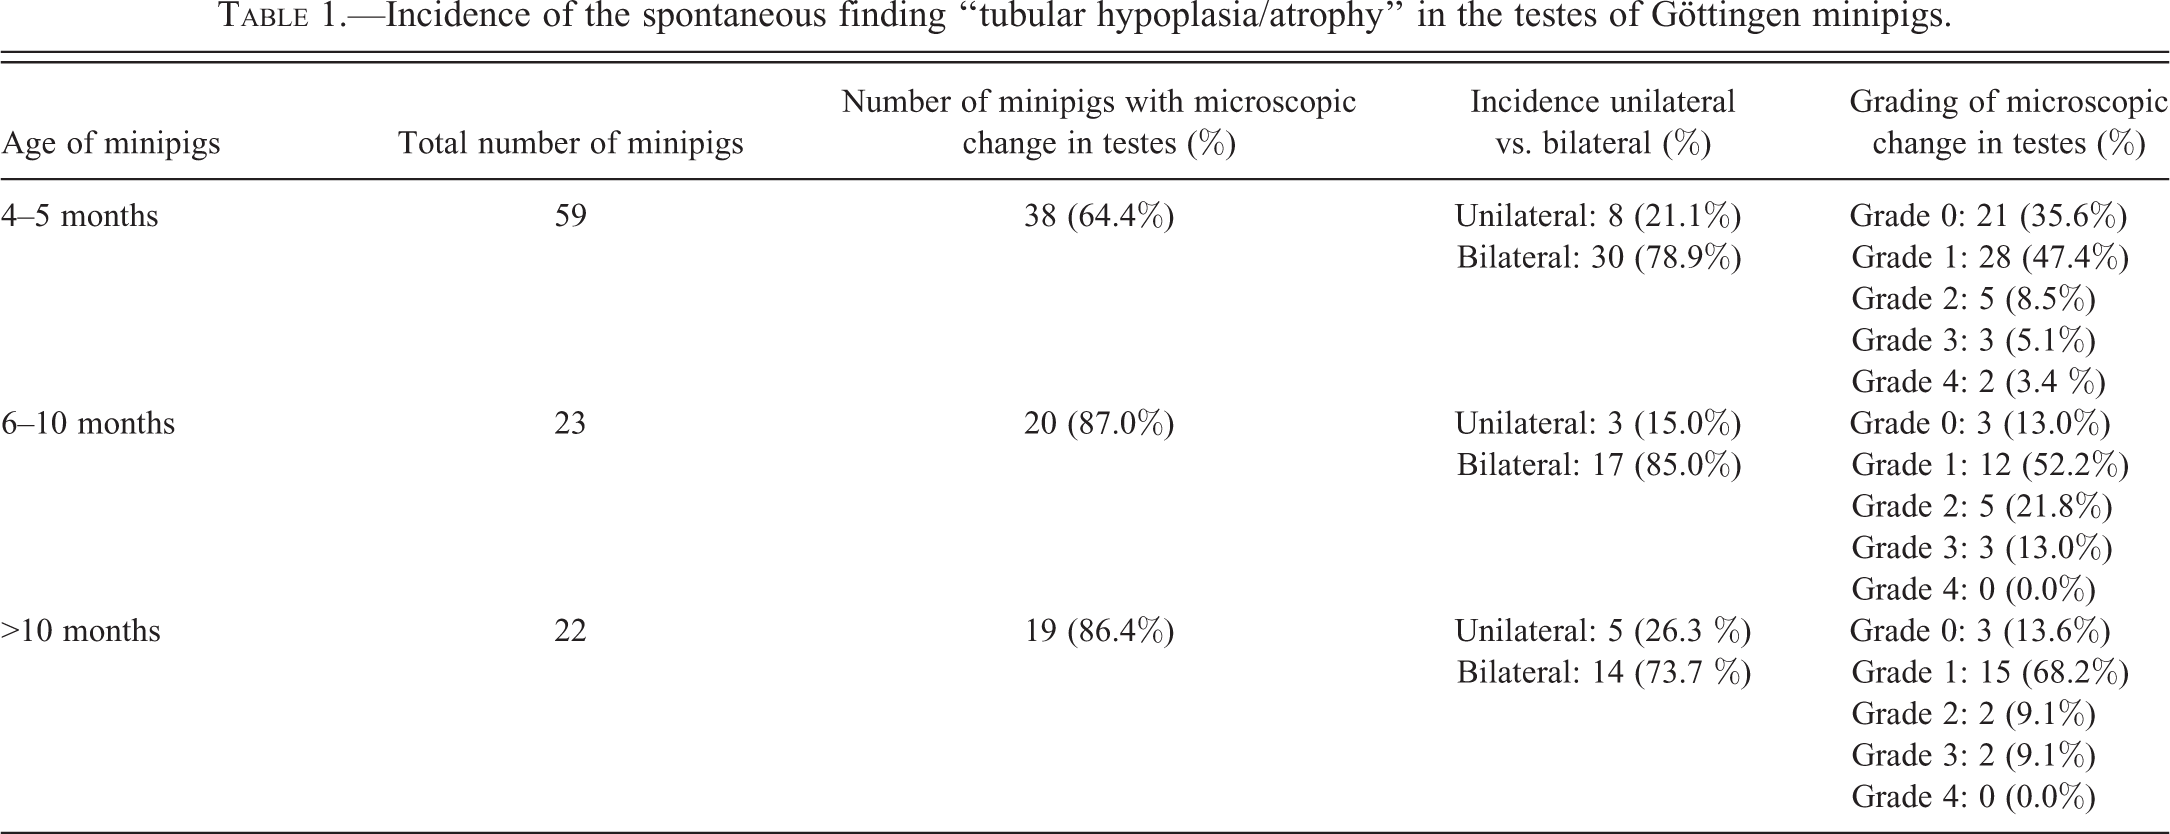
Twenty (87.0%) of the 23 male minipigs that were 6 to 10 months old at necropsy showed tubular hypoplasia/atrophy. Three (15.0%) were unilateral and 17 were bilateral. In this age group, 12, 5, and 3 animals had grade 1, 2 and 3 tubular hypoplasia/atrophy, respectively, and none had grade 4.
Concerning the 22 male minipigs necropsied at more than 10 months, 19 (86.4%) showed tubular hypoplasia/atrophy, with 5 animals (26.3%) displaying this feature in only 1 testis. In this age group, 15, 2, and 2 animals had grade 1, 2 and 3 tubular hypoplasia/atrophy, respectively, and none had grade 4. No testis examined had more than 75% of tubules affected.
Relationships between Microscopic Findings, Age, and Testicular Weight
A one-way ANOVA test indicated that there was no correlation between the grading of testicular tubular hypoplasia/atrophy and the age of the minipigs (p = .2594), demonstrating the absence of correlation between sexual maturity and this finding. Although not statistically significant, it is worth mentioning that the grade 4 finding was present only in animals of 4 to 5 months of age.
Mean testicular absolute weight was 32.31 g for those animals aged between 4 and 5 months at necropsy, 35.20 g for animals necropsied between 6 and 10 months of age and 41.03 g for animals necropsied older than 10 months (see Figure 6).
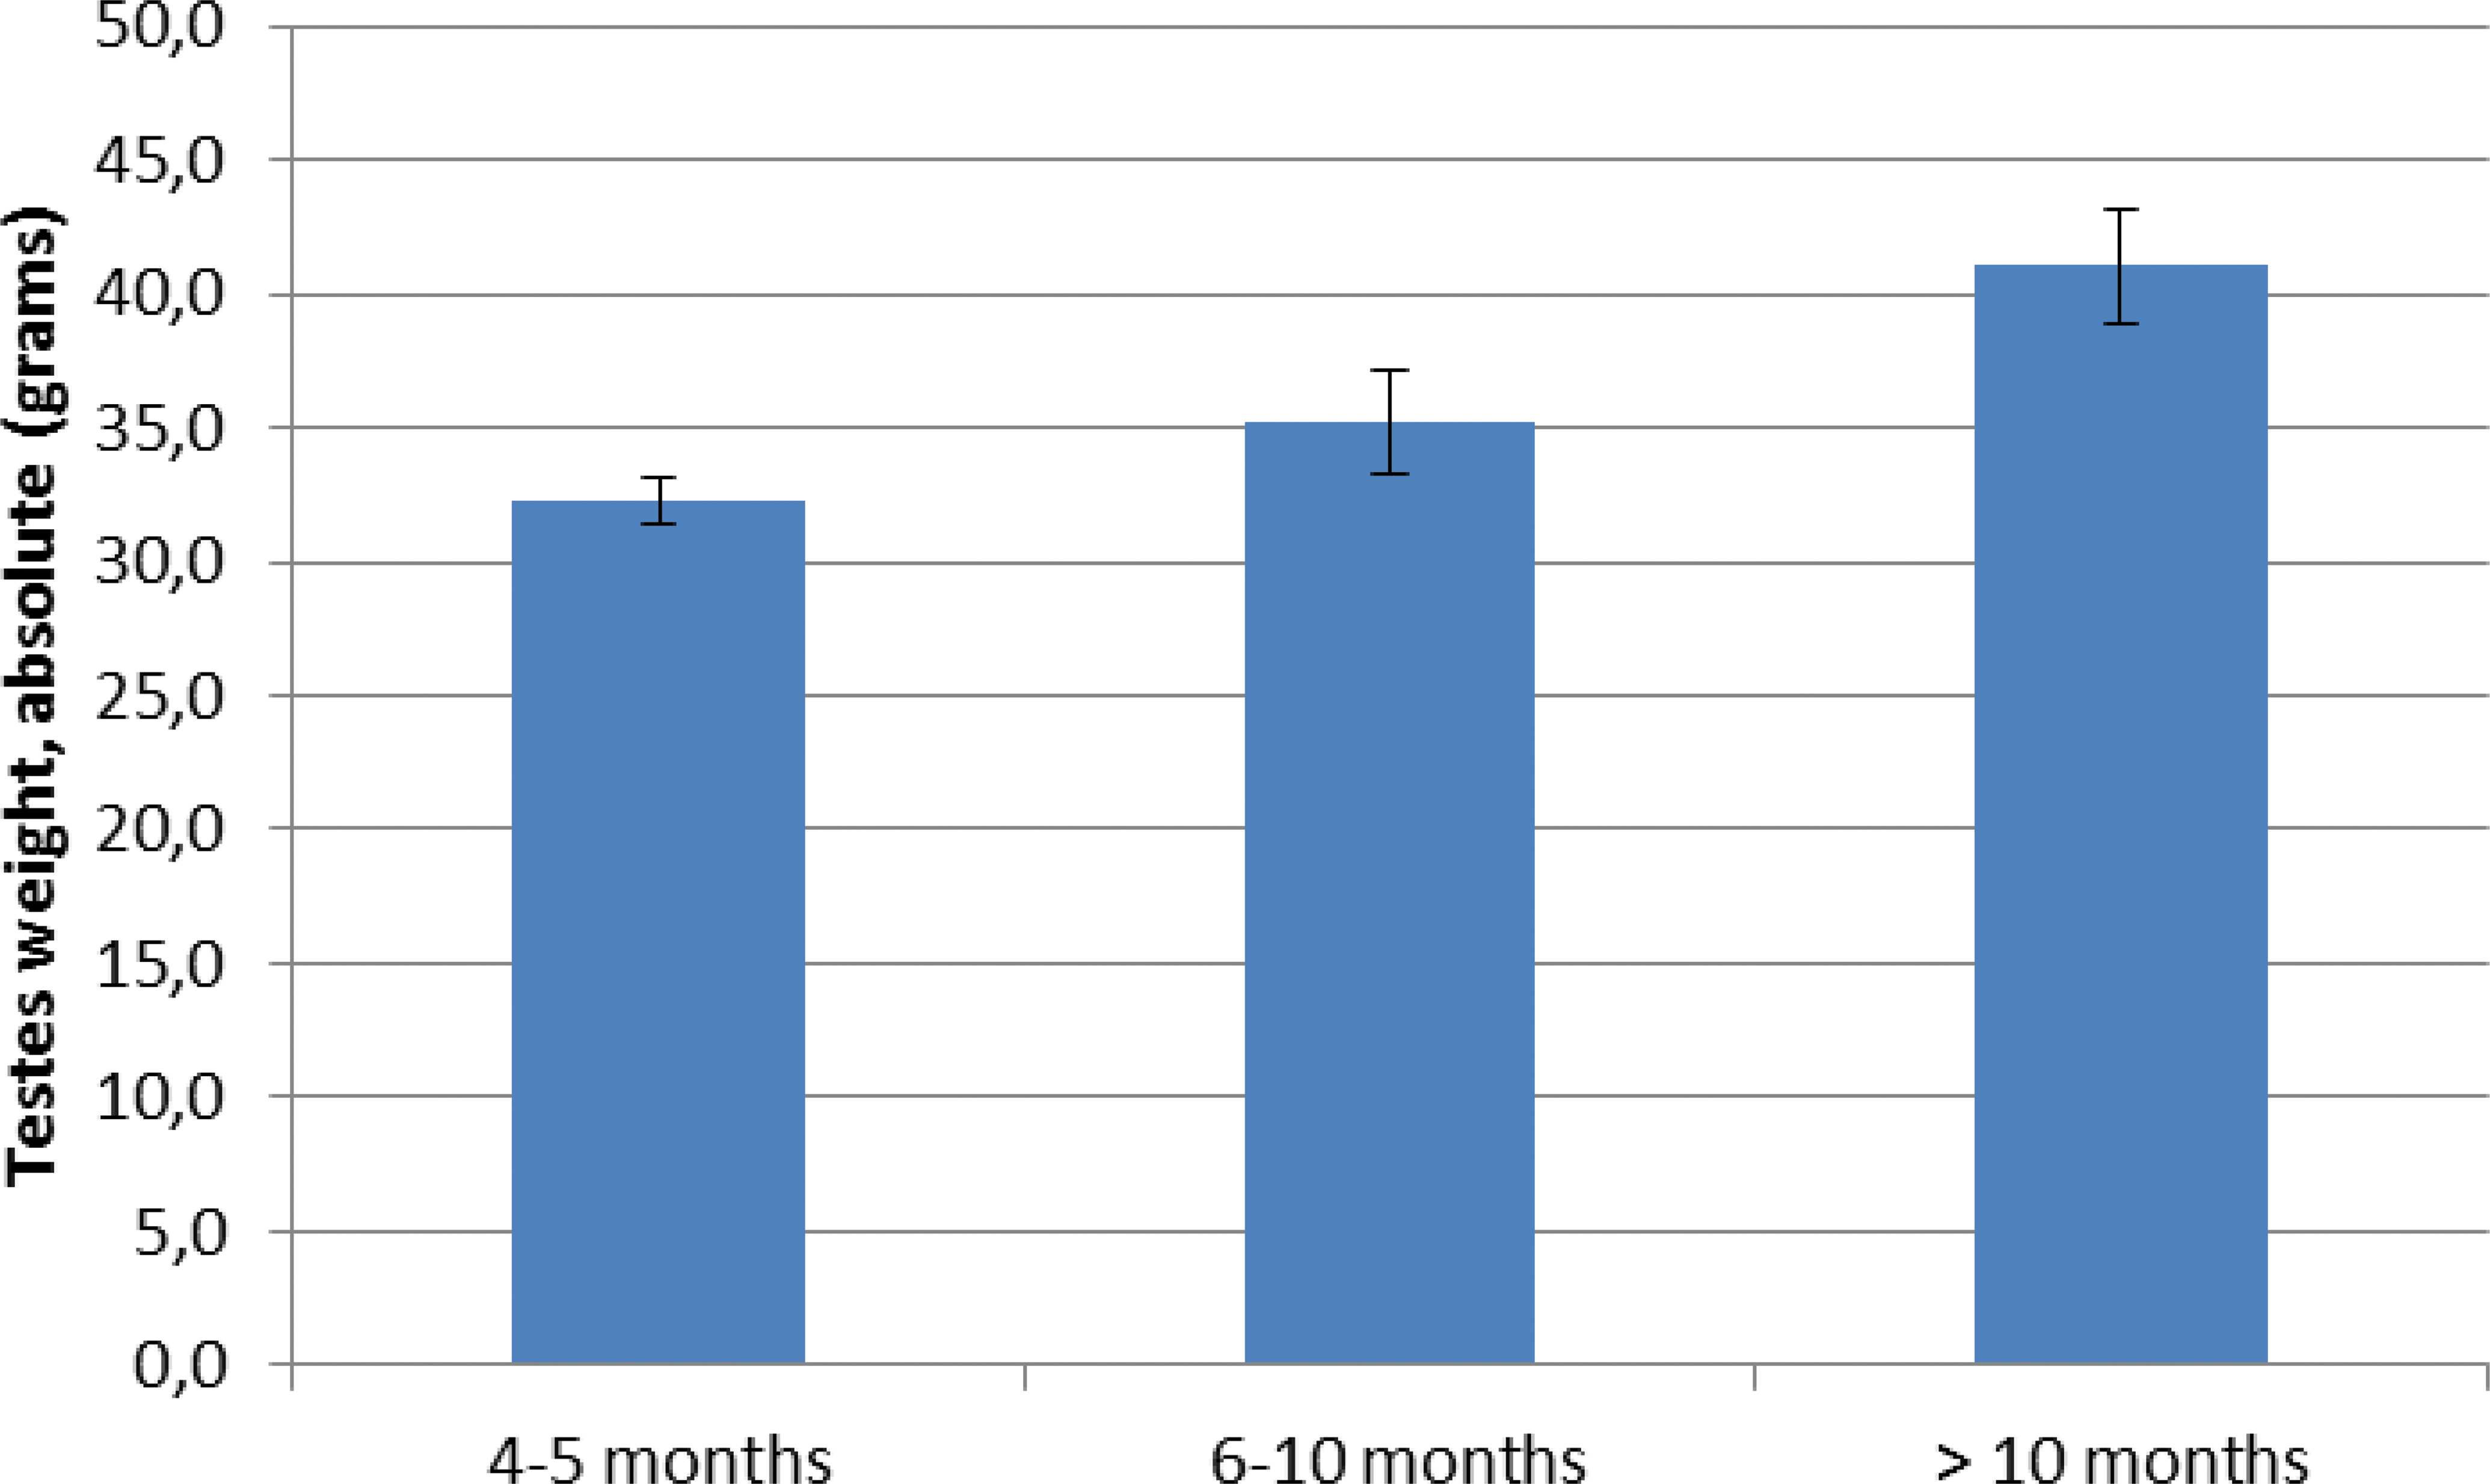
Mean testes absolute weights (grams) at necropsy according to the ages of male minipigs.
A one-way ANOVA test showed a significant relationship between age at necropsy and absolute testicular weight (p = 6.814 × 10⁻⁵), between age at necropsy and relative testicular weight (p = .002), and between age at necropsy and total body weight (p < 2.2 × 10⁻¹⁶). It was thus concluded that testes in male minipigs were still growing and becoming heavier with increasing age.
Terminal Bodyweight and Other Reproductive Organ Weights
Terminal bodyweights ranged from 7,900 g to 16,285 g, with a mean of 10,879.3 g. No statistical correlation was observed between the terminal bodyweight and the severity of hypoplasia/atrophy in testes (p > .05).
The mean testicular weight (absolute) was lower in animals showing grade 2 or grade 3 findings when compared to the grade 0 or grade 1 animals (see Table 2 and Figure 7). A one-way ANOVA test showed that this difference was statistically significant (p < .0001). More precisely, by Tukey’s test, animals with a grade 3 finding had a significantly lower weight than animals with a grade 0 or 1 (p < .001 for both).
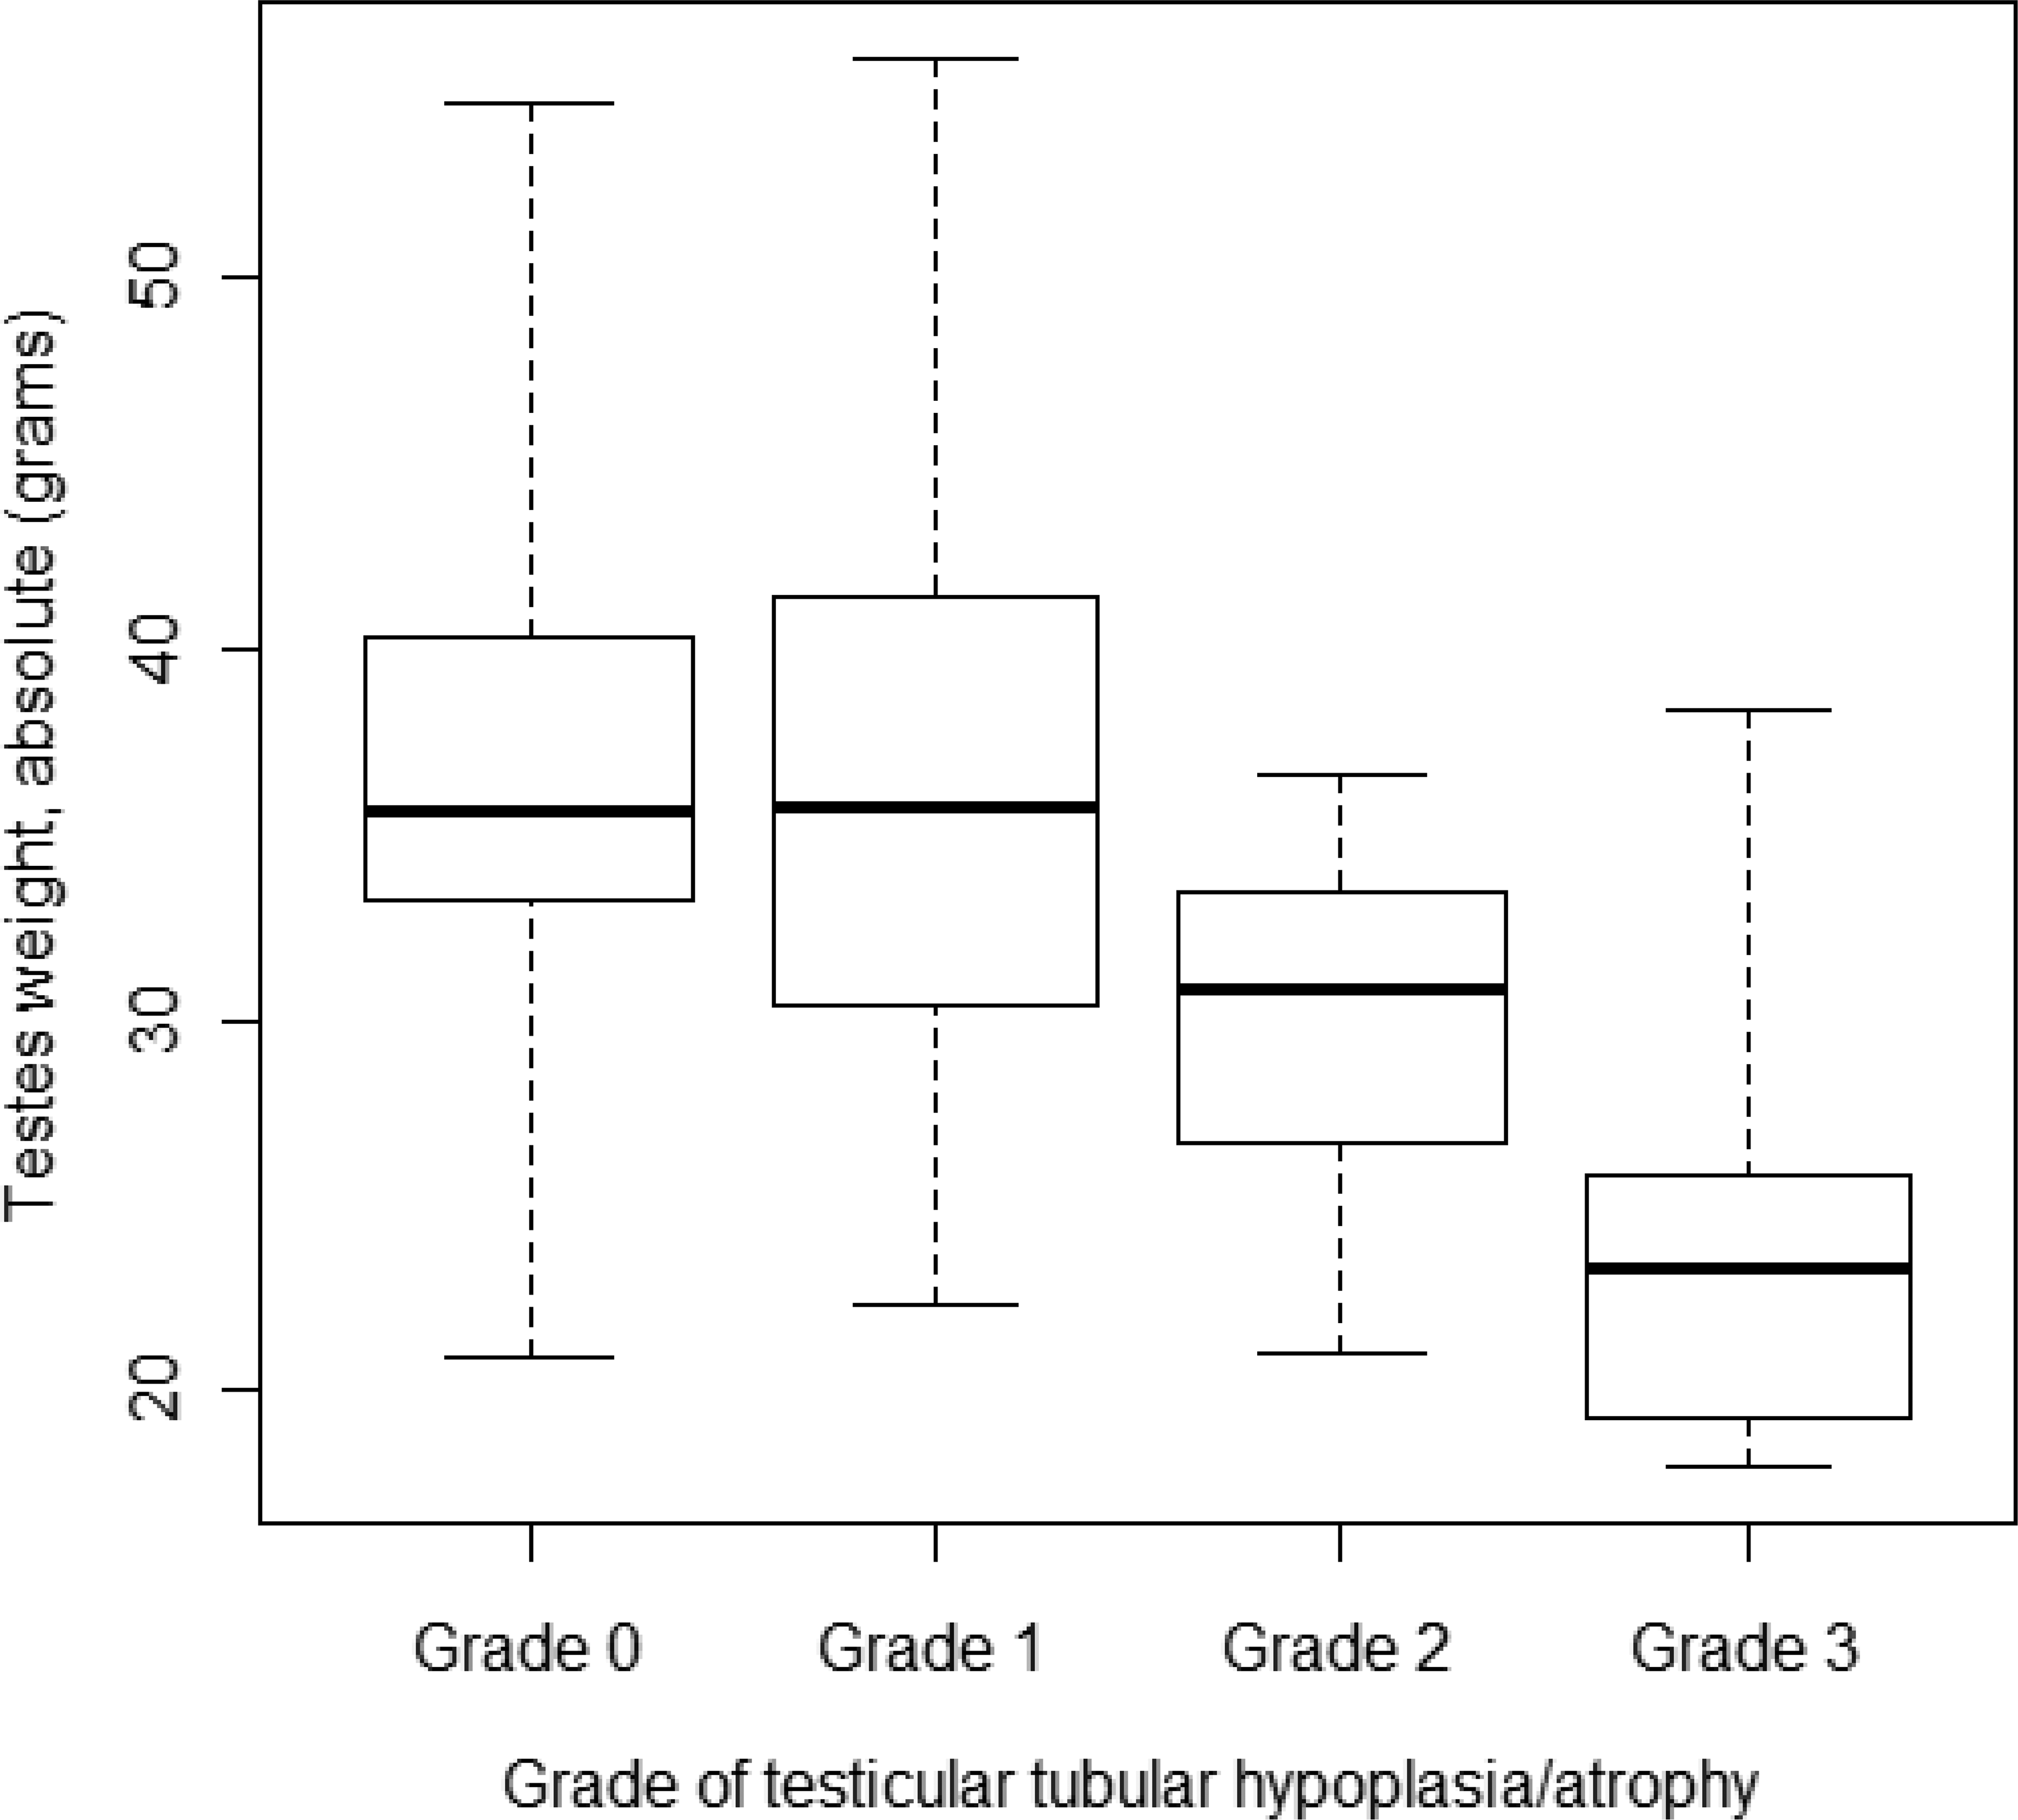
Relationships between minipig testis weight and grade of testicular microscopic changes. The lowest horizontal line is the minimal value, the second line (the bottom of the box) represents the first quartile (25% of the values are below this value), the third line is the median value (50% of the values are below this value), the fourth line (the top of the box) is the third quartile (75% of the values are below this value), and the highest line is the maximal value.
Testicular absolute weight (in grams) and severity of testicular microscopic hypoplasia/atrophy.
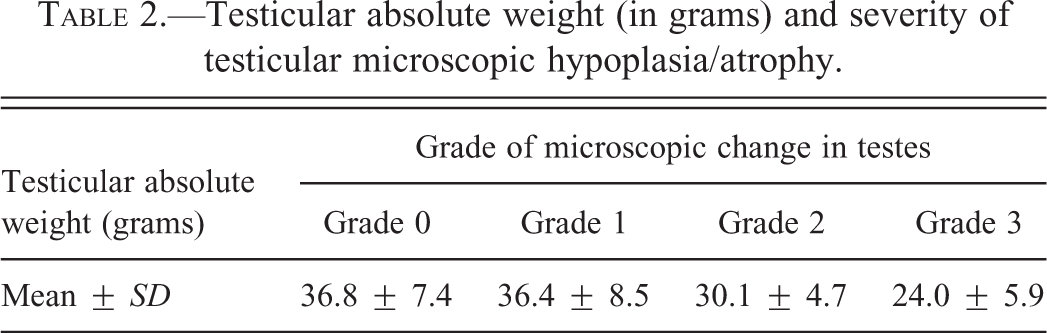
Therefore, the testes with the highest severity of tubular hypoplasia/atrophy had a statistically significant lower weight than those with only no or very mild severity of this change.
There were no statistically significant correlations between the severity of testicular tubular hypoplasia/atrophy and: (1) absolute weights of epididymides (p = .3900), (2) relative weights of epididymides (p = .0974), (3) prostate weight (absolute or relative, p = .6868 and p = .8099, respectively), or (4) seminal vesicles absolute weight (p = .2695).
Quantitative Analysis
The number of tubular cross sections per testis was evaluated on midline sections of testes. They ranged from 1,024 to 3,300, with a mean value of 2,141.1 tubules per testis (the median was 2,184; see Table 3). There was no statistical difference between the number of tubules and age of animals (Kruskall–Wallis test, p = .6345).
Incidence of tubular hypoplasia/atrophy in the testes of Göttingen minipigs by quantitative analysis.
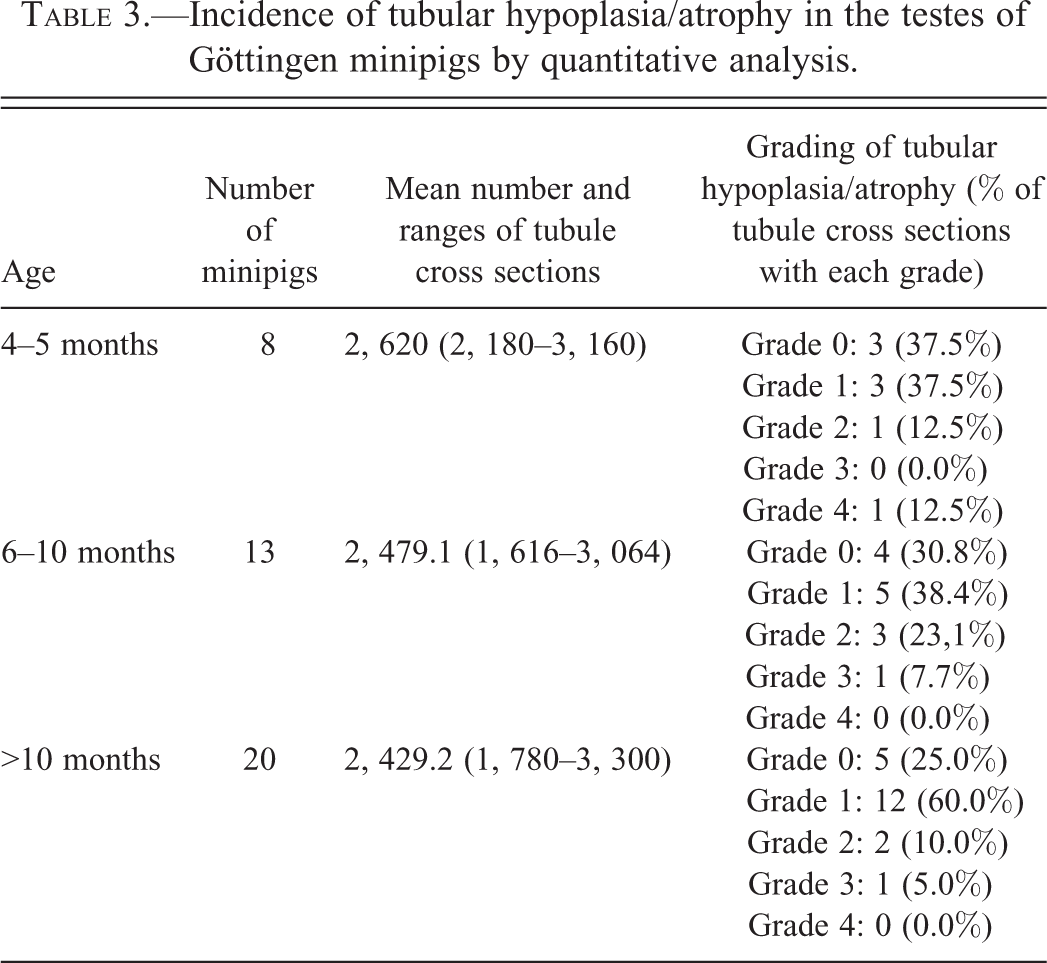
When a bilateral lesion was present, the number of tubules with hypoplasia/atrophy was similar in both testes of the same animal.
The one-way ANOVA test did not reveal a statistically significant correlation between the number of tubules with hypoplasia/atrophy and the age category of minipigs (p = .3656), corroborating what was observed by semiquantitative evaluation.
Comparison between Grading by Quantitative and Semiquantitative Evaluations
The semiquantitative estimations of percentage of affected tubular cross sections were confirmed by counting in the quantitative method in most animals; they differed only for 6 animals (see Table 4).
Incidence of the spontaneous finding tubular hypoplasia/atrophy.
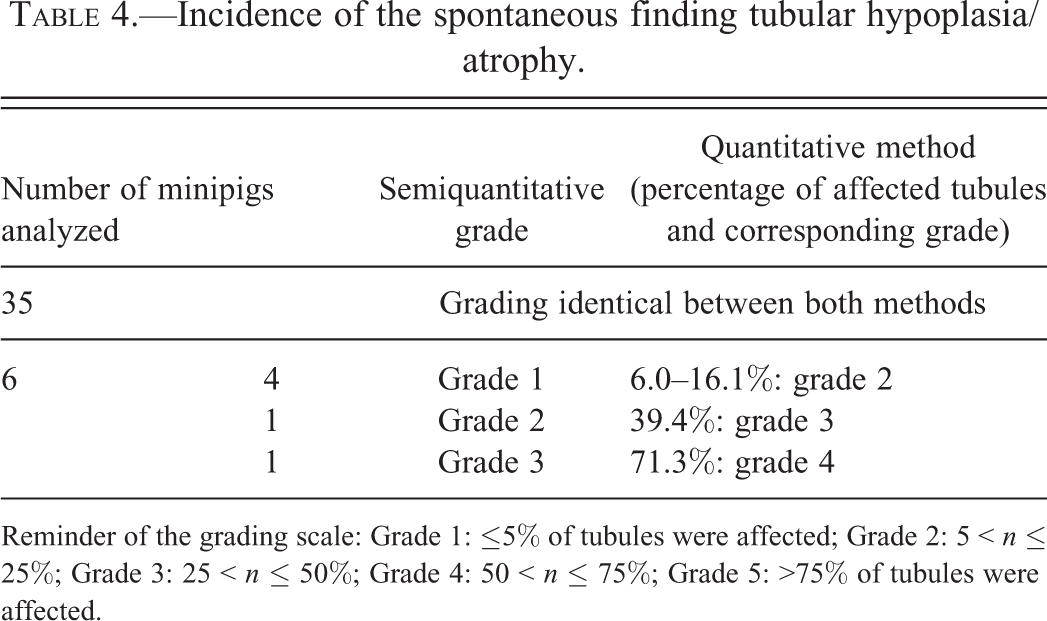
Reminder of the grading scale: Grade 1: ≤5% of tubules were affected; Grade 2: 5 < n ≤ 25%; Grade 3: 25 < n ≤ 50%; Grade 4: 50 < n ≤ 75%; Grade 5: >75% of tubules were affected.
The results obtained by quantitative or semiquantitative methods were not statistically different (p = .89, Wilcoxon test on the proportion of affected tubules by grades and by age category). There was a significant correlation between gradings obtained using both methods (ρ = 0.91, p < 2.2 × 10⁻¹⁶).
It was thus concluded that both methods gave similar results and that the less laborious semiquantitative method of evaluation is reliable.
Microscopic Findings in the Epididymides
Of the 104 minipigs, 81 animals showed no decreased sperm content in the epididymides. Twenty-three animals had decreased intraluminal sperm content in the epididymides, associated with a higher incidence of cell debris (16, 6, and 1 animals at a grade 1, 2, and 3, respectively (see Figures 8 and 9).
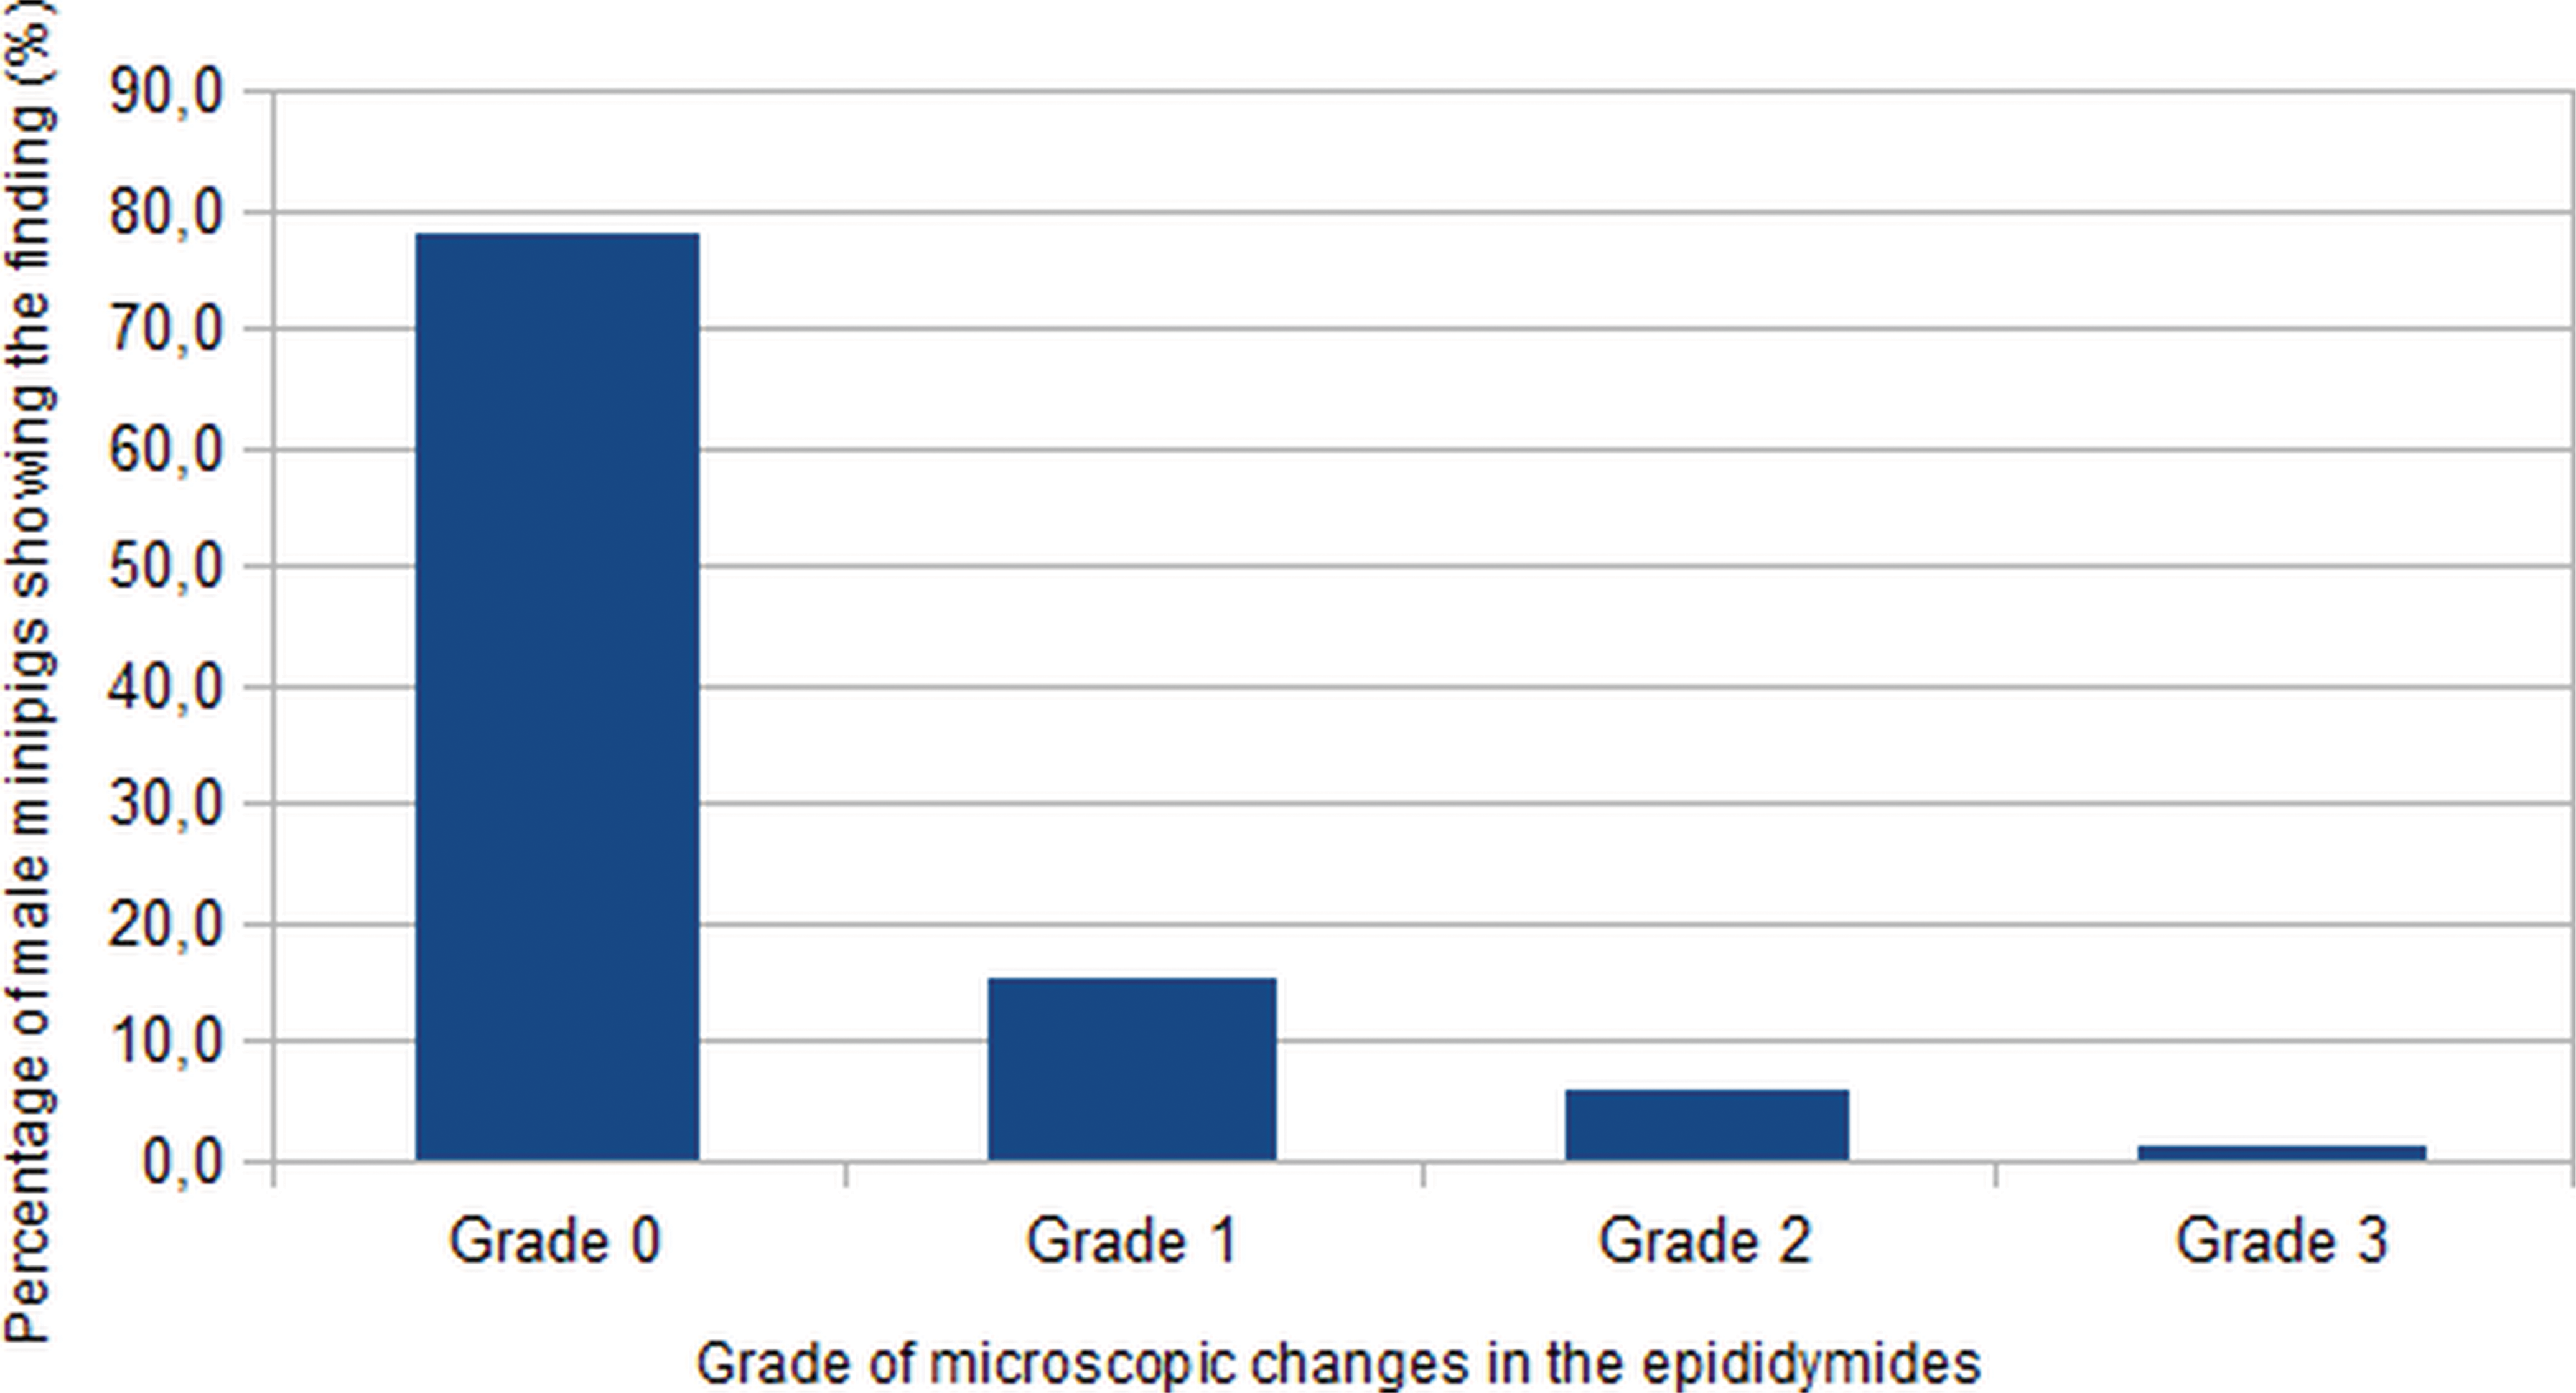
Incidence of male minipigs with microscopic changes of decreased intraluminal content in the epididymides (grade represents the worst severity noted for both epididymides).
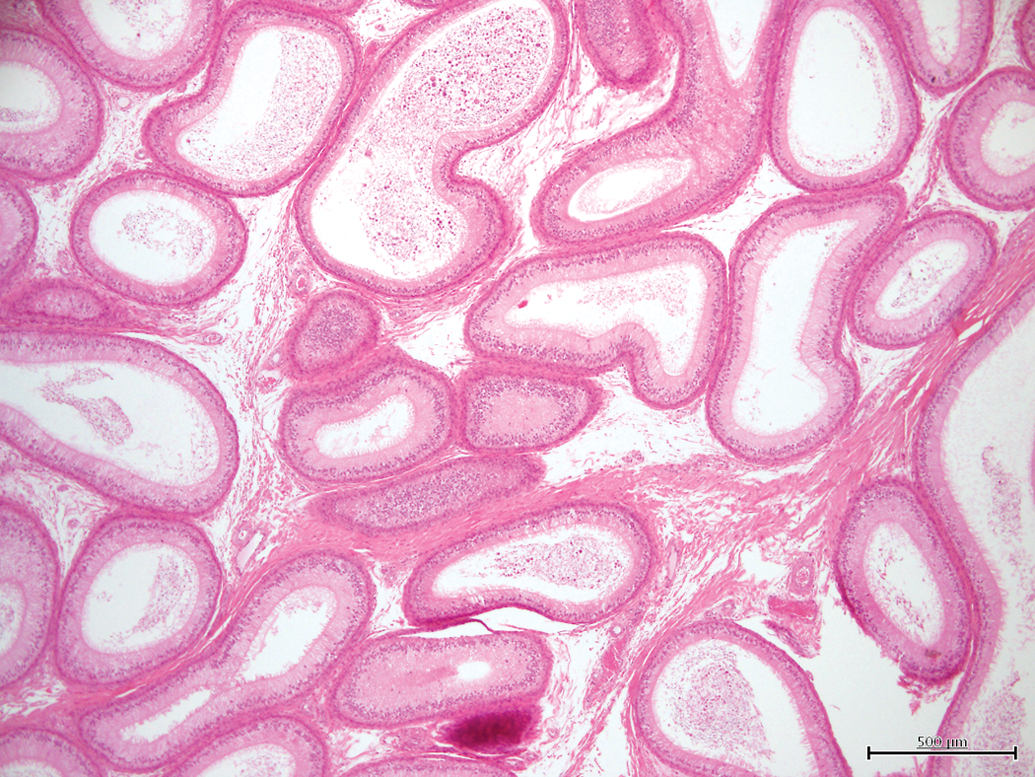
Epididymal tubules, 25 to 50% (grade 3) having a low intratubular sperm content. H&E, 4×.
There was no specific distribution of the finding among the various regions of the epididymides.
The scores of epididymal decreased sperm content were compared with the grade of testicular tubular hypoplasia/atrophy in each animal (see Figure 10).
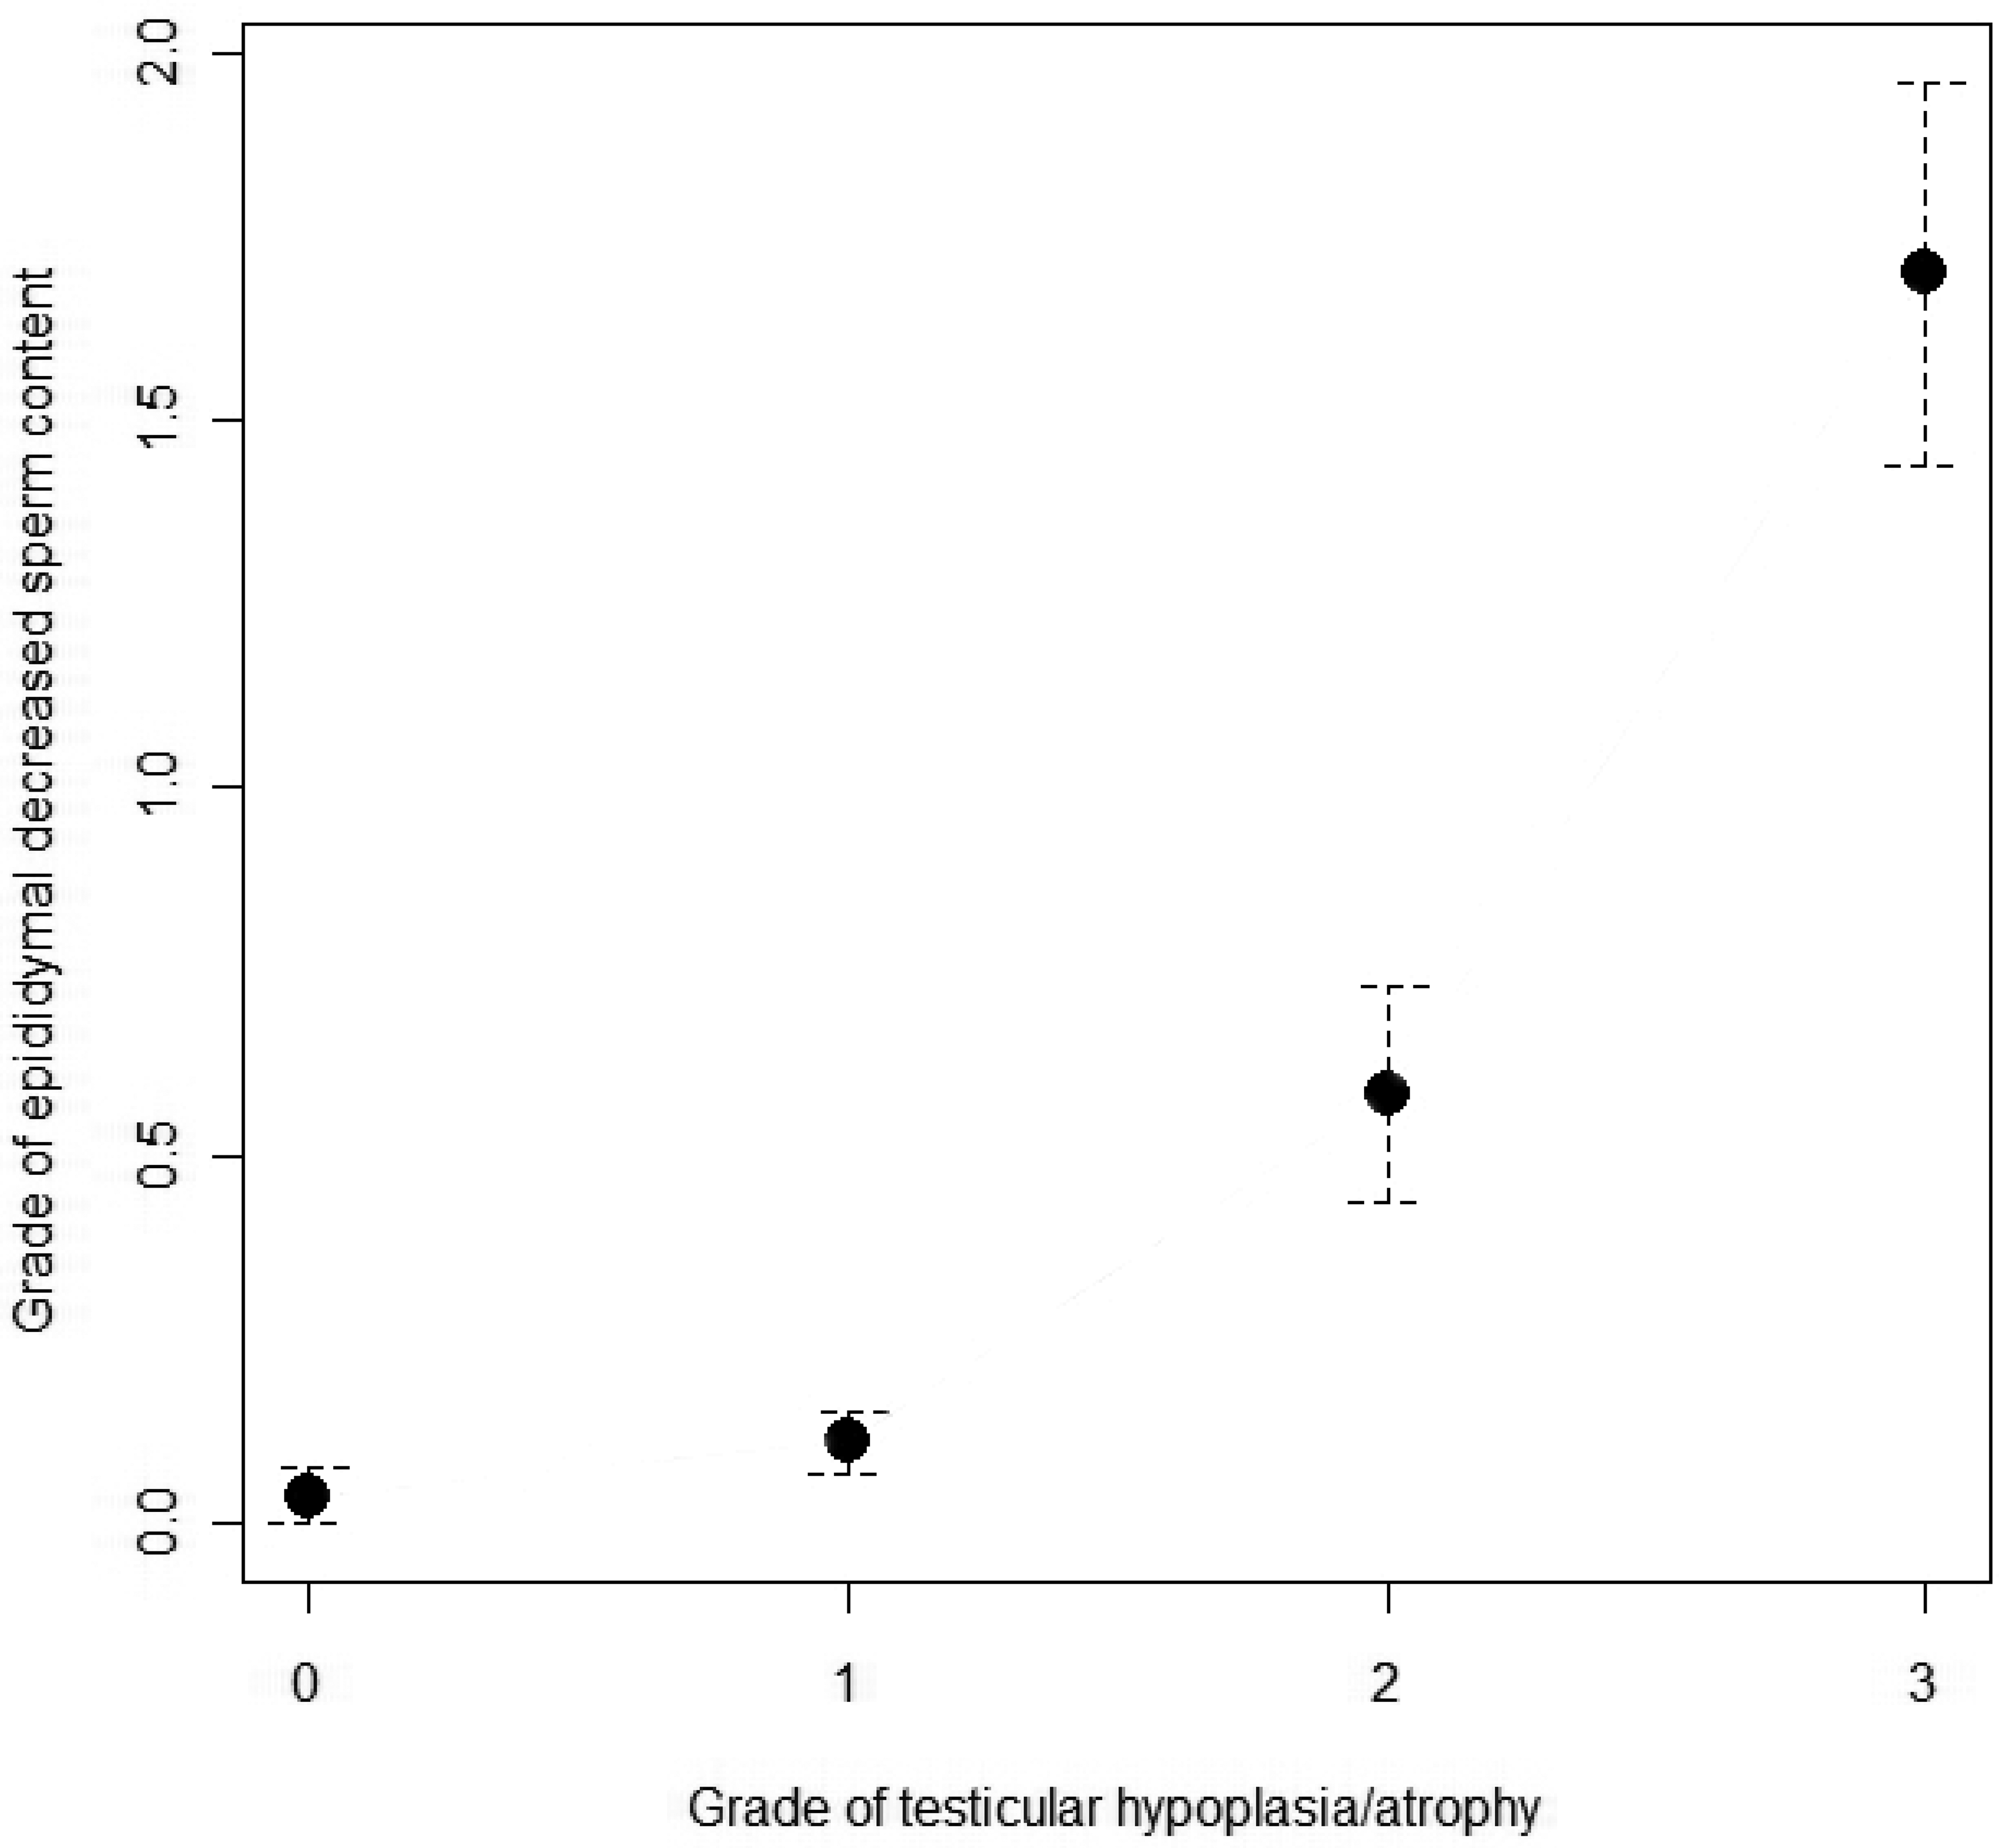
Relationship between epididymal decreased sperm content and testicular microscopic changes for each minipig. (Grade 3 and 4 were merged for the statistical analysis.) Results are presented as mean ± standard error of the mean.
The grade of epididymal decreased sperm content was statistically significantly correlated with the grade of testicular tubular hypoplasia/atrophy in each animal (one-way ANOVA test: p < .0001). By Tukey’s tests, animals with grade 2 or grade 3/4 testicular tubular hypoplasia/atrophy were shown to have significantly lower epididymal sperm content as compared with grade 0 or grade 1 animals (p < .005 for all these comparisons). However, no statistical differences were observed in sperm content for animals with grade 1 testicular tubular hypoplasia/atrophy when compared to animals without testicular findings (p = .8619, Tukey’s test).
Discussion
This report describes the most frequent spontaneous microscopic changes observed in the testes of Göttingen minipigs. We suggest that these changes should be pooled together under the finding “tubular hypoplasia/atrophy,” as they represent a continuum. We chose the term “tubular hypoplasia/atrophy” according to the sparse references found in the literature. Unlike in the dog, we did not differentiate hypospermatogenesis from degeneration or atrophy, because we considered hypospermatogenesis to be on a continuum with hypoplasia/atrophy, featuring a progressive loss of germ cells until their complete absence, tubules being lined by Sertoli cells only.
Results from quantitative and semiquantitative analyses were closely similar. Only in those cases with a proportion of hypoplastic/atrophic tubules close to one of the cutoffs between grades presented any incoherence. Therefore, we consider that the semiquantitative analysis is sufficiently powerful.
This change was frequently observed (74.04% of the animals). It occasionally affected over 50% of the tubule cross sections and resembled appearances that can arise following a toxicologic effect. It can be therefore challenging for the pathologist to make the distinction between this finding, which is part of the normal microscopic background, and a treatment-related effect.
Dogs of ages usually used in acute or subacute toxicology studies, and partially mature macaques, can have similar findings, however (Creasy 1997; Rehm 2000; Goedken, Kerlin, and Morton 2008; Luetjens and Weinbauer 2012), so the minipig is not alone among non-rodent species in this respect.
In Beagle dogs, similar changes may be associated with incomplete maturity. In most Beagle dogs, histological maturity is said to occur by 10 months of age (Goedken, Kerlin, and Morton 2008; Creasy 2012), sometimes 9 months (Lanning et al. 2002), with either a decreased incidence of histological features of tubular hypoplasia or atrophy and decreased epididymal content (Goedken, Kerlin, and Morton 2008), or a similar incidence whatever the age (Rehm 2002; Creasy 2012). Male cynomolgus macaques reach sexual maturity at approximately 4 or 5 years of age (Lanning et al. 2002), and therefore they often appear immature or incompletely mature during acute or subacute toxicology studies. In male rats, maturity occurs generally between 8 and 10 weeks, so, except in toxicology studies targeted at juvenile animals, confusion with spontaneous immaturity is seldom a problem in the rat. In male minipigs, sexual maturity is said to occur between 4 and 6 months of age (Svendsen 2006; Jorgensen et al. 1998), but the histological status of testes is not mentioned in these publications.
In this retrospective analysis of a large cohort of control animals (from 4.5 months to 15 months), we demonstrated the absence of relationships between the age of the minipigs and the incidence/severity of tubular hypoplasia/atrophy in the testes. Therefore and despite the absence of juvenile animals in this work, we are strongly convinced that this finding cannot be considered as a sign of incomplete maturity, contrary to the dog.
Tubular hypoplasia/atrophy in the testes correlated with a lower testis weight (absolute and relative weights) and a lower sperm content in the tubular lumen of epididymides. There was no correlation with bodyweight or the weight of other sexual organs.
Influence of age on testes weights is manifest as testes were still growing until at least 10 months of age. Overall, we demonstrated in our cohort that testicular weights tend to increase when adult minipigs get older but that the incidence and severity of testicular background findings remain stable between 4.5 and 15 months.
Purpose-bred miniature pigs are increasingly used in biomedical research, as they are a valuable alternative to the use of dogs or monkeys, considering the similarities of their anatomy and physiology with those of humans (Bode et al. 2010; Svendsen 2006; Foster et al. 2010). Knowledge of the incidence, severity, and multifocal distribution of this testicular finding will help the pathologist in the evaluation of histological findings.
Footnotes
The author(s) declared no potential conflicts of interest with respect to the research, authorship, and/or publication of this article.
The author(s) received no financial support for the research, authorship, and/or publication of this article.