
Abstract
Histopathology generally represents the reference standard for performance evaluation of nonclinical biomarkers used to inform regulatory decision making. This study uses drug-induced nephrotoxicity in rats to evaluate histopathology methods utilized in biomarker performance assessments. Male Sprague-Dawley rats received a single dose of cisplatin (0.5–5.0 mg/kg, intraperitoneally) to produce mild renal injury. Animals were euthanized 72 hr postdose and perfusion fixed. Kidneys were processed for histology and stereology procedures. Kidney injury molecule-1 (Kim-1) was measured in urine and in kidney tissue. Digital slide images were generated and analyzed by pathologists after collaborating on a training set of glass slides and digital images. Image analysis identified immunohistochemistry (IHC)-defined tubular injury. Stereology methods yielded estimations of proximal tubular cell number and volume. Statistical relationships among data sets were determined using correlation coefficients. Receiver operator characteristic (ROC) analyses determined the effect of method on biomarker assessment. Urinary Kim-1 was strongly correlated with digital image analysis and secondarily to histopathology evaluations. Stereology demonstrated weak or no correlation to pathology and urinary Kim-1. In ROC analyses, semiquantitative evaluations determined higher values for urinary Kim-1 performance than did IHC-based qualitative digital analyses. Semiquantitative evaluation as used in this study was most predictive of urinary Kim-1 values.
Introduction
There is general agreement between the pharmaceutical industry, government regulators, and the medical profession that all would benefit with more sensitive and specific biomarkers of tissue injury that would allow earlier identification and intervention in toxicity and/or disease-induced organ injury. Each of these groups has participated in moving forward this objective. As they have dealt with many of the practical and technical issues arising from identification, characterization, and qualification of novel biomarkers, a recurring problem has appeared. Quantitative performance qualification of a biomarker is limited or defined by the sensitivity of the existing standard that defines injury. Classically, tissue injury has been identified by standard histopathology methods that are semiquantitative (Crissman et al. 2004; Burkhardt et al. 2011). As increasingly sensitive biomarkers and biomarker assays are developed, the possibility that changes in novel biomarkers might be discernible prior to changes identified by these classical methods has increased.
The concept that a cellular biomarker might provide a predictive signal prior to detectable morphological changes questions the sensitivity of the assays used to measure change. Does a more detailed examination reveal previously undetected change or is biomarker signaling truly in advance of change? This is particularly and uniquely relevant to biomarker qualification, where subjective interpretation, method insensitivity, and/or lack of specificity could disproportionately affect the perceived performance of a biomarker. For example, if a subjective methodology is used that dismisses alterations interpreted as “background changes,” but those alterations are actually associated with biomarker release, then the biomarker would be perceived as providing a signal prior to change in the reference standard instead of commiserate with changes in the reference standard. Conversely, a methodology that inaccurately identifies variations in normal histology as changes would yield a perceived insensitivity in the biomarker when, in actuality, no changes were present. The present paradigm for biomarker evaluation does not appear adequately sensitive for all cases (Ozer and Teitelbaum 2009). The anchor for evaluation of ultrasensitive biomarkers might require either a more sensitive histopathology measure or a totally different, as of yet, unidentified tissue-associated parameter. The need for increasingly more sensitive and specific anchors for biomarker qualification becomes even more critical, as one new biomarker is designated as the anchor for another (Ozer 2010).
Several methods provide potentially less variable and more sensitive and quantifiable measures of tissue change that could be associated with biomarker appearance (Laurinavicius et al. 2012). High fidelity scanning can convert glass slides to digital images, allowing software-based, image analysis (Pantanowitz 2010; Klapczynski et al. 2012) and quantification of injury or association with a stainable tissue protein. Software applications for stereology evaluation of digital images have also evolved enhancing the ability to detect and quantify changes in tissue morphology (Nyengaard 1999; Boyce et al. 2010; Boyce, Boyce, and Gundersen 2010). These methods offer potentially more sensitive methods for evaluating early and/or very mild changes to tissue morphology that might be relevant to early biomarker release and unperceivable to a trained pathologist working with light microscopy.
The identification and characterization of novel kidney biomarkers have brought opportunities to rapidly advance biomarker recognition and have provided a successful test case for the U.S. Food and Drug Administration (FDA) qualification process (Dieterle et al. 2010). However, during the qualification process, the sole application of industry standard safety/toxicology study “best practices” (Crissman et al. 2004) to the special case of biomarker qualification was questioned. FDA reviewers noted that appropriate practices for safety assessments might not always be optimum for biomarkers evaluation. Subsequently, recommendations for pathology evaluation in biomarker qualification studies were offered by a group of pathologists endorsed by the Society of Toxicologic Pathology (Burkhardt et al. 2011). The FDA issued a Draft Guidance for Industry, “Use of Histology in Biomarker Qualification Studies” in December 2011. Both of these efforts attempted to identify the best existing histopathology methods for producing biomarker qualification data including identifying special techniques or staining that might support evaluation of hematoxylin and eosin (H&E)-stained slides via light microscopy. The study presented here was designed to create mild kidney injury, to compare stereology and digital image analyses with pathologists’ semiquantitative evaluation, and to relate those results to measured urinary biomarker concentrations.
The largest consideration in design of this study was the nature or properties of biomarkers. Biomarkers can be variably defined based on their proposed context of use. However, biomarkers generally possess similar characteristics that define their utility: (1) they serve as measurable surrogates for a less measurable process or parameter; (2) their dynamics are correlated with those of the process or parameter that they “mark”; (3) in specific conditions, they are informative (diagnostic, prognostic, or predictive). But, the biological sources, mechanisms, and dynamics through which biomarkers appear and disappear are not uniform. Biomarkers found in biofluids are typically indicators of functional change or cellular injury. Because of the excess functional capacity found in most biological processes, the majority of biomarkers that provide early signals of injury are identifying cellular injury. Even in cellular injury, several common methods of biomarker release (Louden et al. 2010) are possible: (1) intracellular biomarker molecules can be released from cells with sufficiently damaged cell membranes; (2) intracellular biomarker can be actively secreted in increased amounts as free molecules or in endosomes/exosomes; (3) cell membrane proteins can be released from the cell membrane. Each method has different implications for the detection of the biomarker and its correlation to injured tissue as determined by histopathology evaluation.
The availability of well-described injury models and highly sensitive commercially available assays, the experience of the laboratory with these models and assays, and the expansion of knowledge around kidney injury biomarkers prompted the selection of kidney injury and kidney injury biomarkers for this study. The kidney also provided an ideal biofluid (urine) for direct accumulation and collection of biomarker from injured kidney cells.
Materials and Methods
Project Approach
Three distinct areas of investigation were pursued within this project.
A working group of 3 pathologists was formed. This pathology working group (PWG) worked on a training set of study slides and images from those slides to better align their future individual evaluations of test images. Each individual pathologist of this group provided semiquantitative evaluations of kidney injury in test sets of digital images of H&E-stained sections from cisplatin and saline-treated rats.
Kidney tissue from the same rats was used for digital image analysis based on immunohistochemistry (IHC) for the specific kidney injury biomarker, kidney injury molecule-1 (Kim-1).
Stereology analyses were conducted on paired, H&E-stained, serial kidney sections from the same rats. Both tubular epithelial cell counts and proximal tubular tissue volume estimations were obtained.
Animal Experiments
All animal procedures were performed in accordance with the U.S. Public Health Service Guide for the Care and Use of Laboratory Animals in an Association for Assessment and Accreditation of Laboratory Animal Care International (AAALAC)-accredited facility on the White Oak Federal Research Center Campus (Institutional Animal Care and Use Committees [IACUC] protocol WOAP 2009-100). Healthy adult male Sprague-Dawley rats (Harlan Laboratories, Frederick, MD) were housed in standard plastic caging and maintained with ad libitum food and water on a 12-hr light/dark cycle at 22° to 24 °C.
Rats were divided into 5 cohorts of 6 rats each and 1 group containing 3 rats. On day 0, the cohorts containing 6 rats received a single intraperitoneal injection of saline or 0.5, 1.0, 2.0, 3.0, or 5.0 mg/kg cisplatin (Sigma, St. Louis, MO). Based on changes seen in pilot studies, 3 days posttreatment was selected for sacrifice because the intent was to detect early tissue changes. At this time point, the proximal tubular epithelial cells of some treated rats demonstrated mild to moderate changes ranging from degenerative vacuolization to acute necrosis, primarily in the outer medulla and particularly at higher doses, although many treated rats had no changes in kidney morphology based on light microscopy. The changes detected were consistent in type, location, and degree with previous reports in rats (Gautier et al. 2010; Vinken et al. 2012; Wadey et al. 2013). Urine for urinary biomarker measurement was collected from rats placed in individual metabolism cages on a refrigerated rack (Techniplast, Bugguggiate, Italy) for approximately 16 hr immediately prior to euthanasia. Rats were anesthetized via isoflurane inhalation 72 hr following intraperitoneal injection and euthanized by exsanguination with serum harvesting for chemistry analysis. Perfusion fixation with freshly mixed 4% paraformaldehyde/0.1% glutaraldehyde solution was completed immediately following euthanasia. Both kidneys were harvested with one-half of each kidney being placed in formalin for routine histology processing for staining. The other half of each kidney was separately retained for stereology evaluation processing. The orientation of sectioning and the portions retained for routine histology or stereology processing rotated with each animal so that across the experiment all perspectives were represented from both kidneys for stereology, routine histopathology, and IHC techniques.
PWG and Histopathology Evaluation
A PWG was created to minimize the variability in semiquantitative evaluation of test images. The members of the PWG were of varied backgrounds and lengths of experience. Tissues were processed, cut, and H&E stained by EPL, Inc. (Sterling, VA). One year prior to PWG formation, a single pathologist who eventually participated in the PWG gave a preliminary blinded semiquantitative review of the glass slides produced by EPL. Digital images were generated from these slides with the Aperio ScanScope CS slide scanner (Vista, CA). The pathologist providing the preliminary evaluation was not reexposed to the slides and did not have access to the digital images until the PWG began its work. A training set of images representing the observed range of cisplatin-induced injury was identified from the preliminary evaluation. Morphological change was the only criteria used for inclusion in the training set (biomarker levels were not considered). From this training set (Figure 1) and over the course of multiple meetings, the PWG became familiar with the type and location of changes that they would be evaluating in the test images. Initial impressions were formed on glass slides with subsequent evaluation of images from those slides. The PWG confirmed that working with images would not impair evaluation. Details of scoring were discussed and scoring reviewed on the training images. Pathologists had access to the training set throughout all evaluations and could use them as a scoring reference. Individual pathologists were then asked to provide semiquantitative 0 to 5 scoring for test image sets. The images used to create the lexicon were not included in any subsequent (test) evaluations. Pathologists were aware that cisplatin was the agent of injury even when blinded to other information. Each image set was evaluated twice: once blinded to treatment and dose groups and once with treatment and dose information. A minimum washout period of 6 weeks was observed between open and blinded evaluations of identical images. Each of the 5 image sets contained 16 to 20 images from the same 20 kidneys. In each image set, sampling was at a different location within the kidney for a total of 5 locations per kidney. These locations were determined by selecting sections every 600 μm beginning at the cut surface of the bisected (longitudinal or transverse) kidney and continuing until the tissue was exhausted. Although some image sets were composed of transverse section images and other image sets contained longitudinal section images, only 1 orientation, either transverse or longitudinal, was present in each image set. Each image set was evaluated 10 times by 3 different pathologists for a total of 30 evaluations. For each kidney, a composite score was derived from the averaged 30 evaluations.
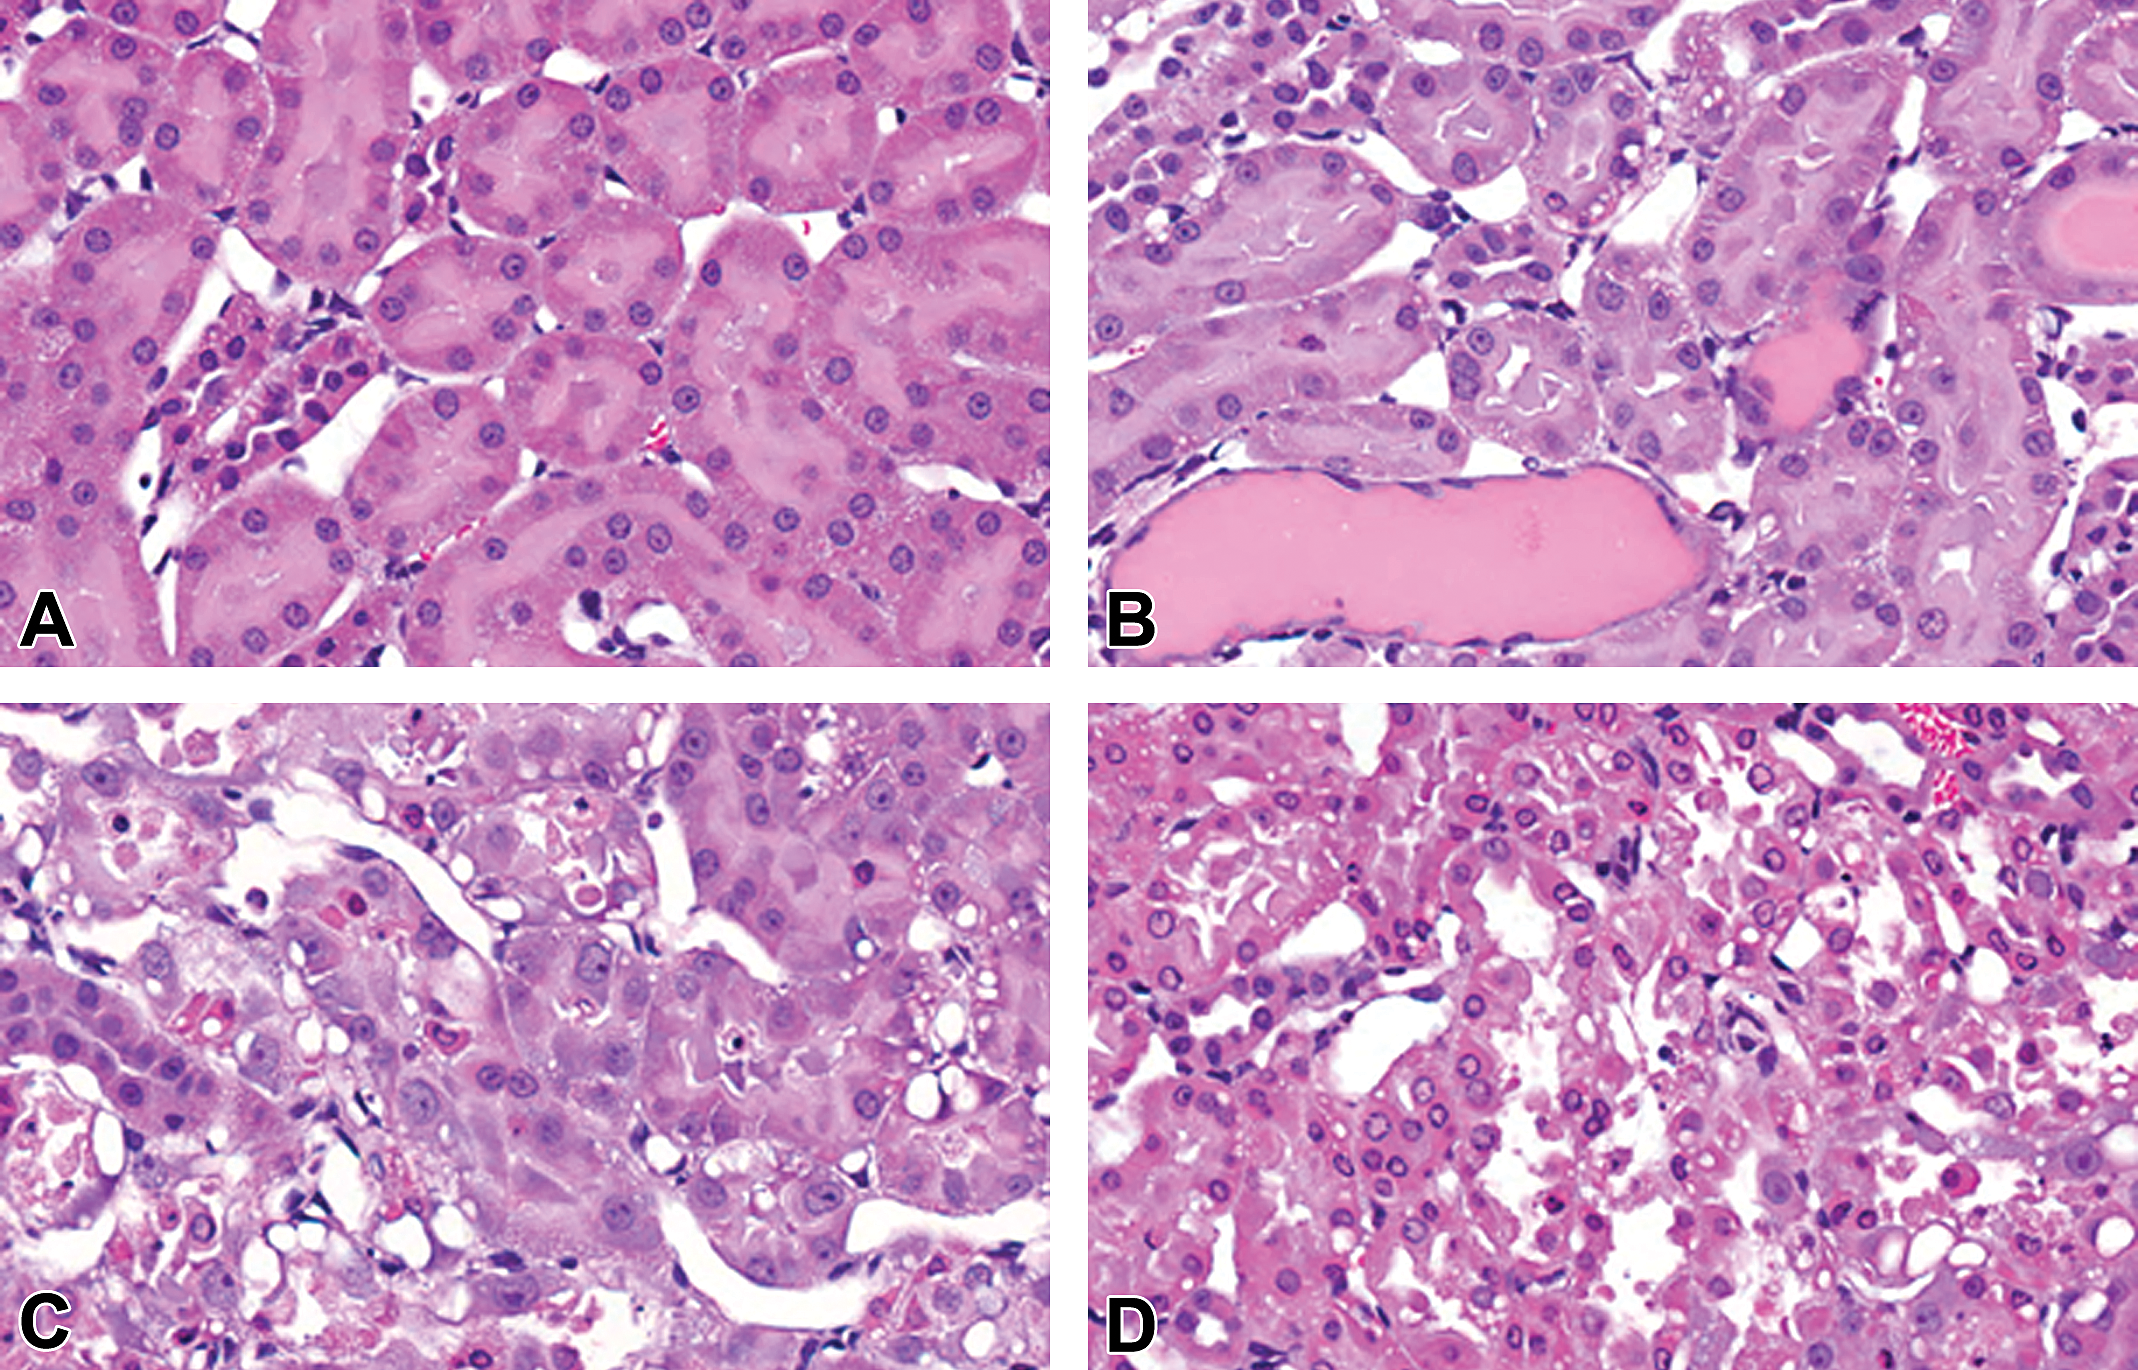
Histopathology identified cisplatin-induced kidney injury. The range of cisplatin-induced changes detected in this study are demonstrated (A–D) without regard to dose; (A) control rat demonstrates no notable changes in proximal tubular epithelium or architecture; (B) treated rat showing mild proximal epithelial cell vacuolization and tubular dilatation with protein casts; (C) treated rat exhibiting moderate epithelial necrosis; and (D) treated rat with severe epithelial necrosis and general loss of tubular architecture.
IHC Staining and Digital Image Analysis
Tissues were processed, cut, and stained by EPL (Sterling, VA). One 3-µm section from each longitudinal and transverse section of kidney was submitted for IHC staining. Deparaffinization through counterstaining was performed on the DISCOVERY XT autostainer from Ventana Medical (Tucson, AZ). Antigen retrieval was performed using the tris-ethylenediaminetetraacetic acid (EDTA) buffer, CC1. The primary antibody, goat anti-rat polyclonal tissue injury molecule-1 (Tim-1; R&D Systems, Minneapolis, MN; AF3689), was used at a 1:50 dilution. For the negative control, normal goat serum at an equivalent protein concentration to the primary was used in place of the primary antibody. Following the primary antibody and negative control, the secondary antibody was applied, a biotinylated goat anti-rabbit IgG from Vector Laboratories (Burlingame, CA), which was detected and visualized using the streptavidin–biotin peroxidase Diaminobenzidine (DAB) Map kit (Ventana Medical, Tucson, AZ). Sections were counterstained in hematoxylin for 4 minutes. Positive staining was observed by brown coloring.
Image analysis was performed using digital images generated from the Aperio ScanScope CS slide scanner (Vista, CA). The Aperio Positive Pixel Count Algorithm (V9) was used to classify positive pixels (DAB stained) according to their intensity thresholds into 3 groups: strong positive, positive, and weak positive (Figure 2). All other pixels were labeled as negative. The resulting percentage of positive pixels was used for evaluation. Whole slide images of kidney were used for analysis with one transverse section and one longitudinal section from each animal.
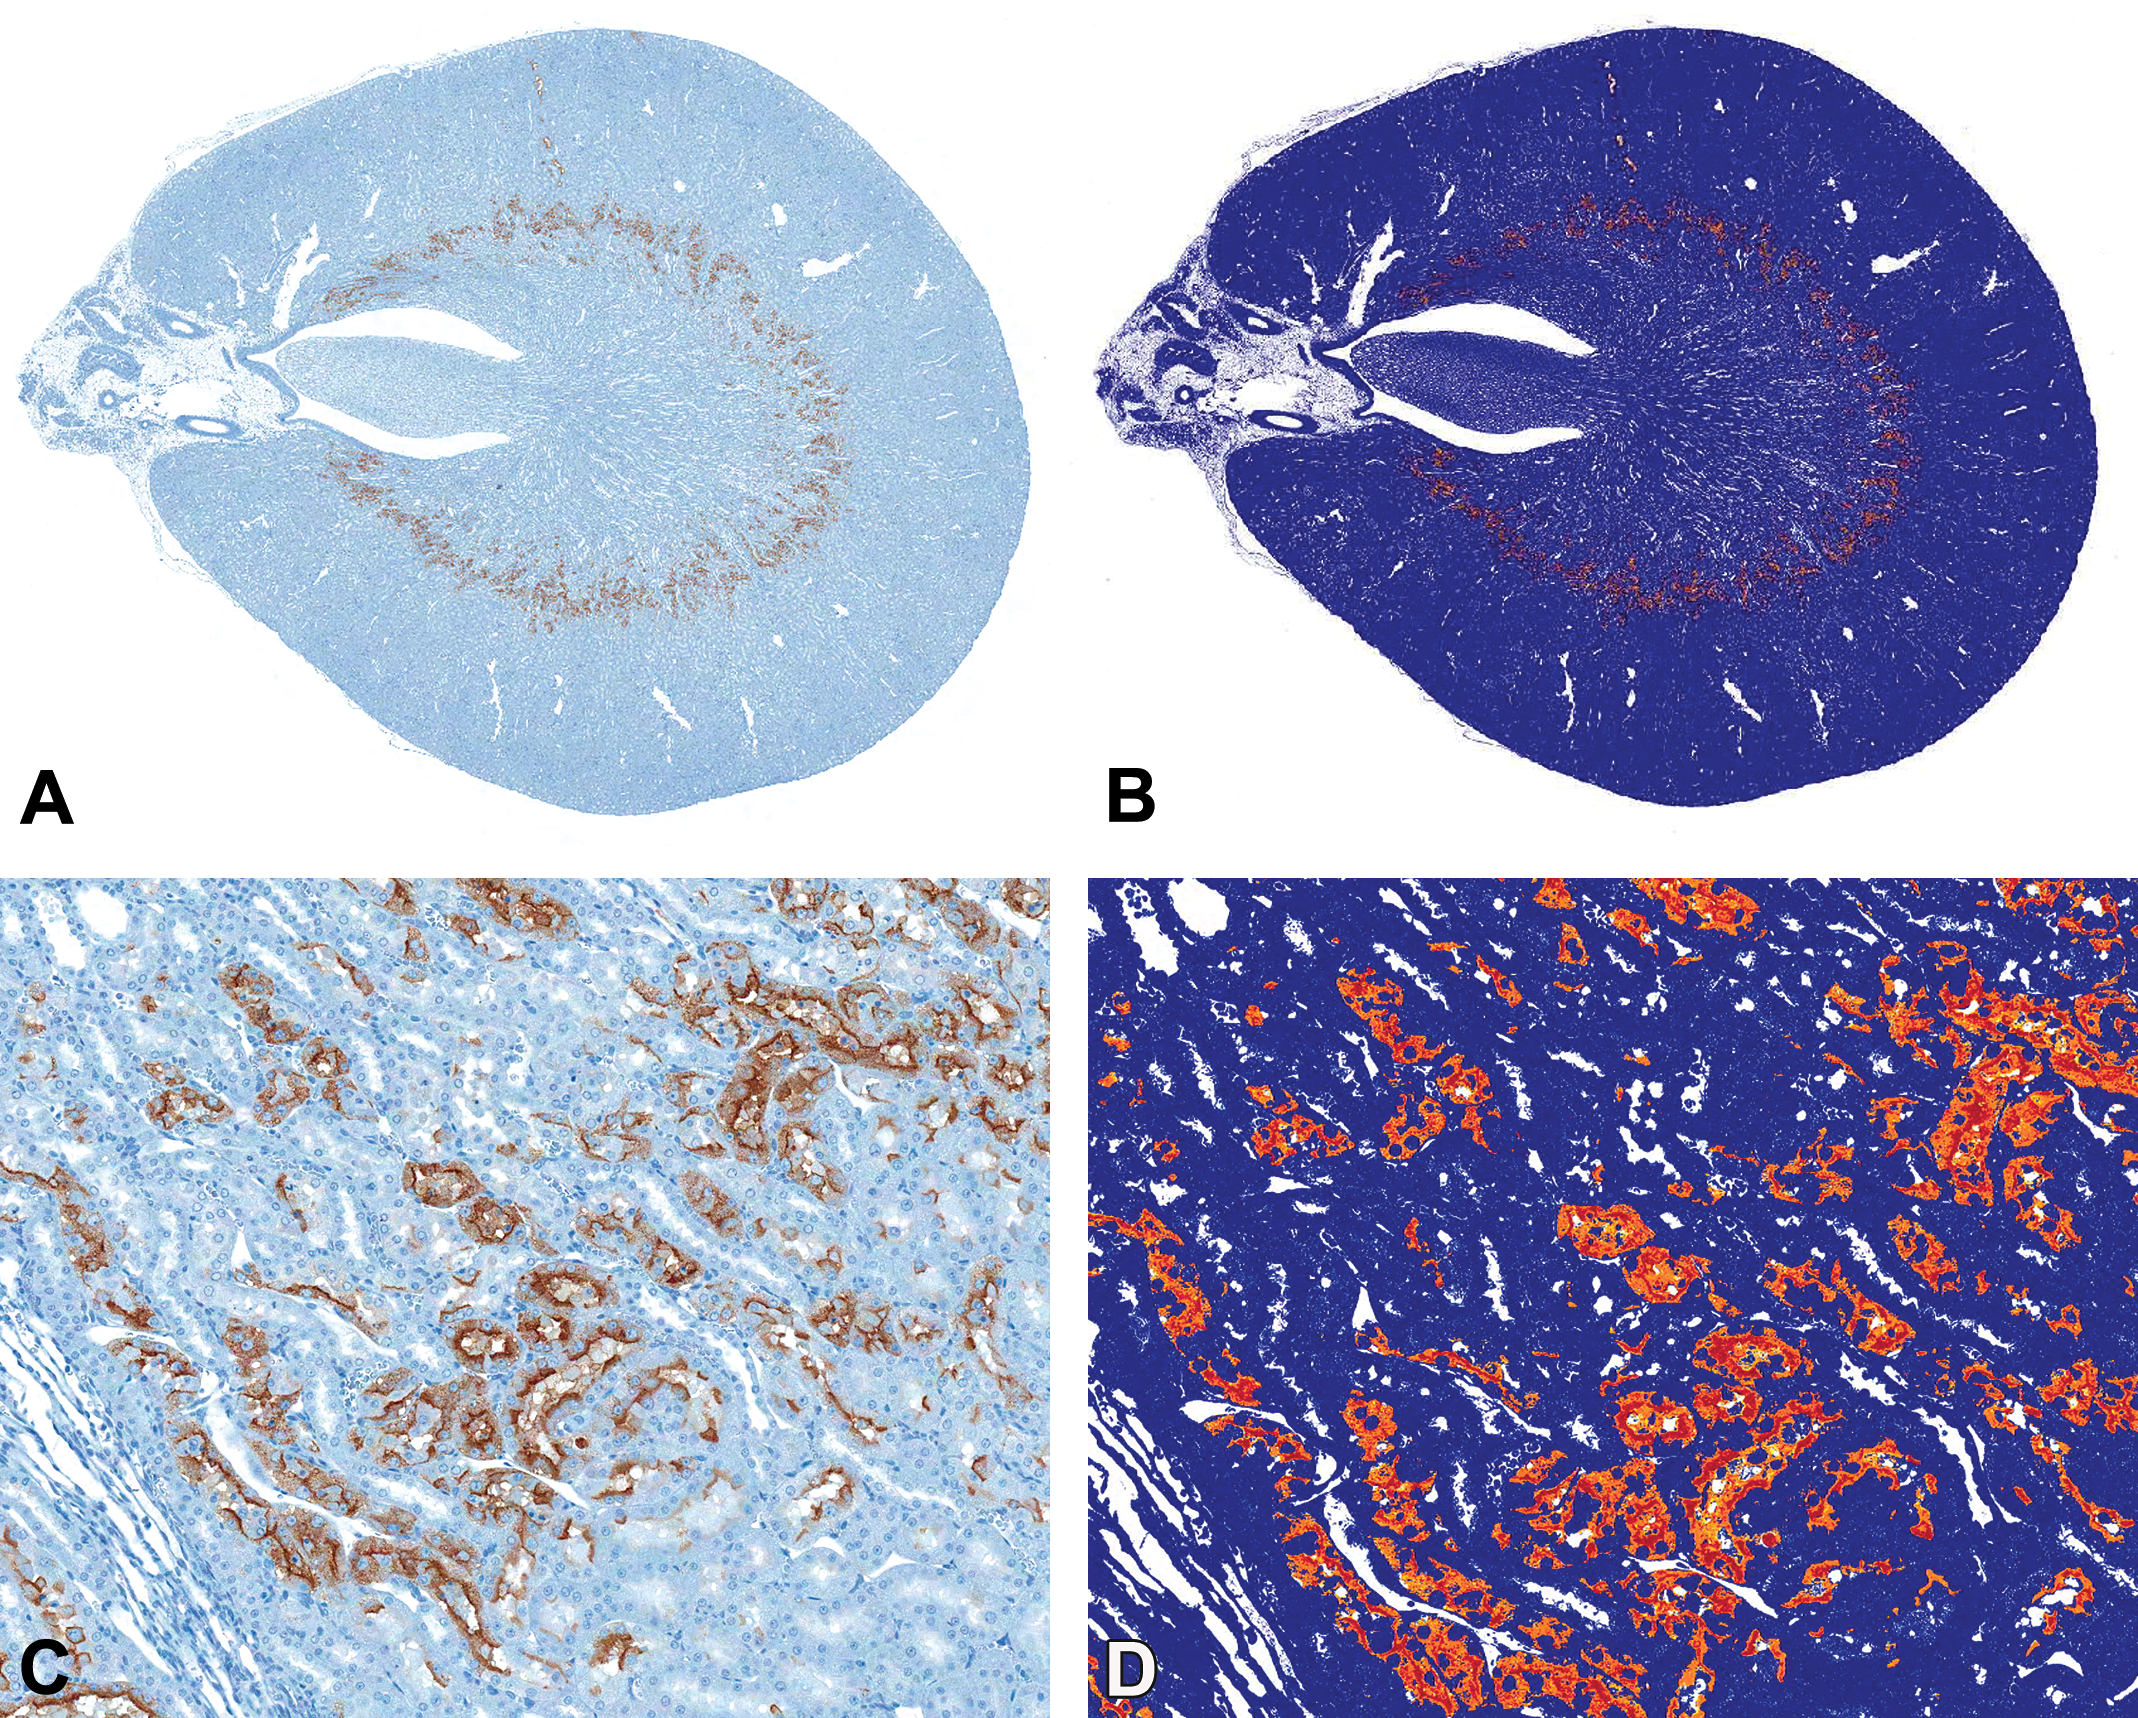
Digital image analysis of Kim-1 immunohistochemical staining of cisplatin-induced kidney injury. Aperio 20× whole slide image (A) with magnified example (B) of Kim-1 positive staining (brown); corresponding positive pixel image analysis (B, D) with yellow, orange, and red representing weak positive, positive, and strong positive, respectively. Kim-1 = kidney injury molecule-1.
Stereology Preparation and Evaluation Methods
The left kidney from the first rat was longitudinally sectioned and the right kidney was transversely sectioned. In each subsequent rat, the sectioning orientation was alternated. The halves retained for stereology also alternated from rat to rat so that ultimately tissue retained for stereology represented all areas of both kidneys. The halves of each kidney retained for stereology were then processed according to parameters for stereological evaluation allowing systematically uniform random sampling (see Supplementary Document 1).
Tissues were processed, cut, and stained with H&E by EPL (Sterling, VA) according to the stereology processing guidelines. Tissue shrinkage during processing was calculated and no difference in shrinkage was detected between the kidneys of saline- and cisplatin-treated rats (percentage shrinkage mean ± standard deviation [SD]; 0.660 ± 0.134 vs. 0.662 ± 0.133). Serial pairs of sections were collected and mounted on slides every 200 sections or approximately every 600 µm. Tissues were sectioned exhaustively, with the number of slide pairs per block ranging from 4 to 6 slides for longitudinal sections and 8 to 10 slides per block for transverse sections. Resulting slides were scanned at 40× magnification on the Aperio ScanScope CS slide scanner. Digitized images were analyzed in newCAST software (Visiopharm, Denmark) for proximal tubular cell volume and cell count. Figure 3 depicts stereology cell counting and volume estimate grids.
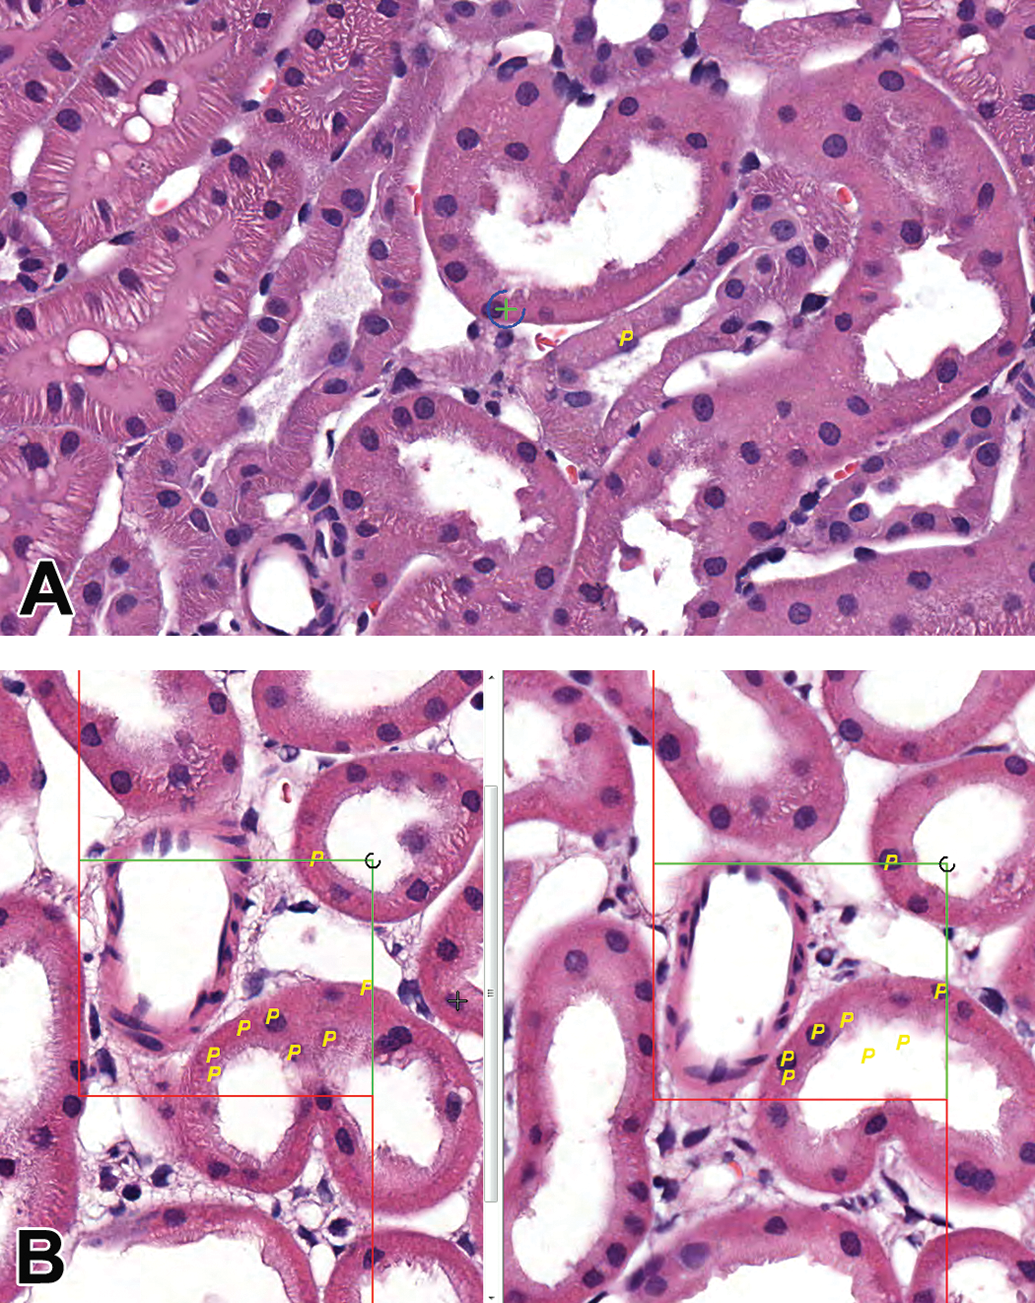
Stereology volume and cell count estimates. Proximal tubular volume estimation screen (A) applied in a systematic random sampling with + on tubular epithelium yielding a positive (P) count; Cell count estimate screen (B) showing aligned images from 3-μm serial sections with a positive count (P) for both images when a cell was apparent in only 1 of the 2 images.
Volume estimate: To generate regions of interest (ROIs), newCAST performed a 10% randomized sampling of the entire kidney section. A 1 × 1 point grid was applied to the 80,483 µm2 fields of view (FOVs). The intersection of the lines in the upper right quadrant of the point grid was used as the counting mechanism for counting normal proximal tubule cells. Cells were counted if that area of the point grid intersected the nucleus or cytoplasm of a proximal tubule cell. Apoptotic/necrotic cells were not counted. The calculations were performed in the software using Cavalieri's principle for volume estimation.
Cell count estimate: To generate ROIs, newCAST randomly sampled 0.05% of the entire kidney section, ensuring there were at least 200 samples per organ. Disector pairs were serial sections at 3 µm. A 81 × 65 μm (total area 5,265 µm2) counting frame was overlaid onto the FOVs. Counting consisted of marking proximal tubule cell profiles that were present in 1 section and absent in the corresponding dissector pair with counting both ways. A calculation to determine the cell count estimate for each kidney was performed in the software using the Physical Disector calculation.
Urinary Biomarker Measurement
Prior to and independent of histopathology review, the urinary levels of 7 kidney injury–associated biomarkers were determined using commercially available multiplex assays for the MesoScale Discovery Platform (Meso Scale Discovery, Gaithersburg, MD). Urine was thawed, centrifuged, and aliquoted for storage at −80 °C until analyzed. Kim-1, albumin (Alb), lipocalin-2 (Lcn-2), clusterin (Clu), osteopontin (Opn), mu and alpha glutathione S-transferases (μGst & αGst), and renal papillary antigen-1 (Rpa-1) were quantified in urine on the electrochemiluminescence platform using manufacturer’s instructions. Two urinary biomarkers, Kim-1 and αGst, demonstrated significantly increased urinary levels following cisplatin treatment (supplementary file). In this study, Kim-1 was more strongly correlated with preliminary histopathology than αGst. Further, in a previous kidney injury biomarker study, Kim-1 also demonstrated a more sensitive, consistent, and reliable response to proximal tubular injury (Rouse et al. 2011) and displayed superior IHC staining. Based on these facts, Kim-1 was chosen over αGst for IHC staining and comparison to its respective urinary levels. The mesoscale antibody for Kim-1 was actually a commercially available antibody, Tim-1. This is the same antibody that was used for IHC staining of kidney tissue for Kim-1.
Serum Chemistry Analysis
Sera were analyzed for concentrations of albumin, total protein, alkaline phosphatase, alanine aminotransferase, amylase, total bilirubin, calcium, phosphorus, glucose, sodium, potassium, globulins, blood urea nitrogen (BUN), and creatinine (Cr) using a Vetscan Model 200 Blood Analyzer and Vetscan Comprehensive Diagnostic Profiles (Abaxis, Union City, CA).
Statistical Analysis
All statistical analyses were conducted in SigmaPlot 12.5 with significance determined by p < .05. Pearson correlation coefficients were determined for all candidate biomarkers. Standard descriptive statistics of nontreated animals were used to determine the mean and SD of a parameter within the experimental control population. A value greater than 2 or 3 SDs beyond the mean of control animals was designated as the cutoff for true positives for each assay. These determinations of true positive were then used in receiver operator characteristic (ROC) analyses to generate ROC curves depicting urinary biomarker performance using all parameters having a significant correlation to urinary Kim-1. The ROC-generated area under the curve (AUC) based on each significant parameter was used as a comparator for assessment of biomarker performance.
Results
Table 1 lists preliminary histopathology evaluation scores, urinary Kim-1 biomarker concentrations, BUN, serum Cr, results of digital image and stereology analyses, and the composite histopathology evaluation scores from the PWG for the selected animals. Pearson product–moment correlation coefficients were determined for all of these variables and are presented in Table 2. The preliminary pathology evaluation had a highly significant and relatively strong correlation (.798) with the composite pathology score calculated from the work of the PWG. Although the preliminary evaluation also had a good correlation (.730) to urinary Kim-1, the composite pathology evaluation correlation to urinary Kim-1 was stronger (.945). Composite pathology was also positively correlated with positive pixel counts (transverse section, .885; longitudinal section, .852) from digital image analysis of the IHC-stained kidney. A significant negative correlation was described between composite pathology and both transverse (−.619) and longitudinal (−.488)–based proximal tubular tissue volume estimates. Only the transverse section volume estimate had a significant (−.478) correlation with urinary Kim-1. The most significant and largest correlation coefficient (.983) was found between urinary Kim-1 and transverse section positive pixel counts. Kim-1 and positive pixel counts from IHC-stained longitudinal sections were also highly correlated (.943). The classical kidney injury biomarkers, BUN and Cr, were modestly correlated with urinary Kim-1, positive pixel counts, and composite histopathology scores. Cr was also negatively correlated with the transverse volume estimate. Treatment was significantly correlated with the 2 pathology evaluations and the longitudinal volume estimates. A significant correlation was not found for stereology-based proximal tubular epithelial cell counts relative to any of the other recorded parameters.
Individual animal treatment and values for candidate biomarkers of kidney injury.a
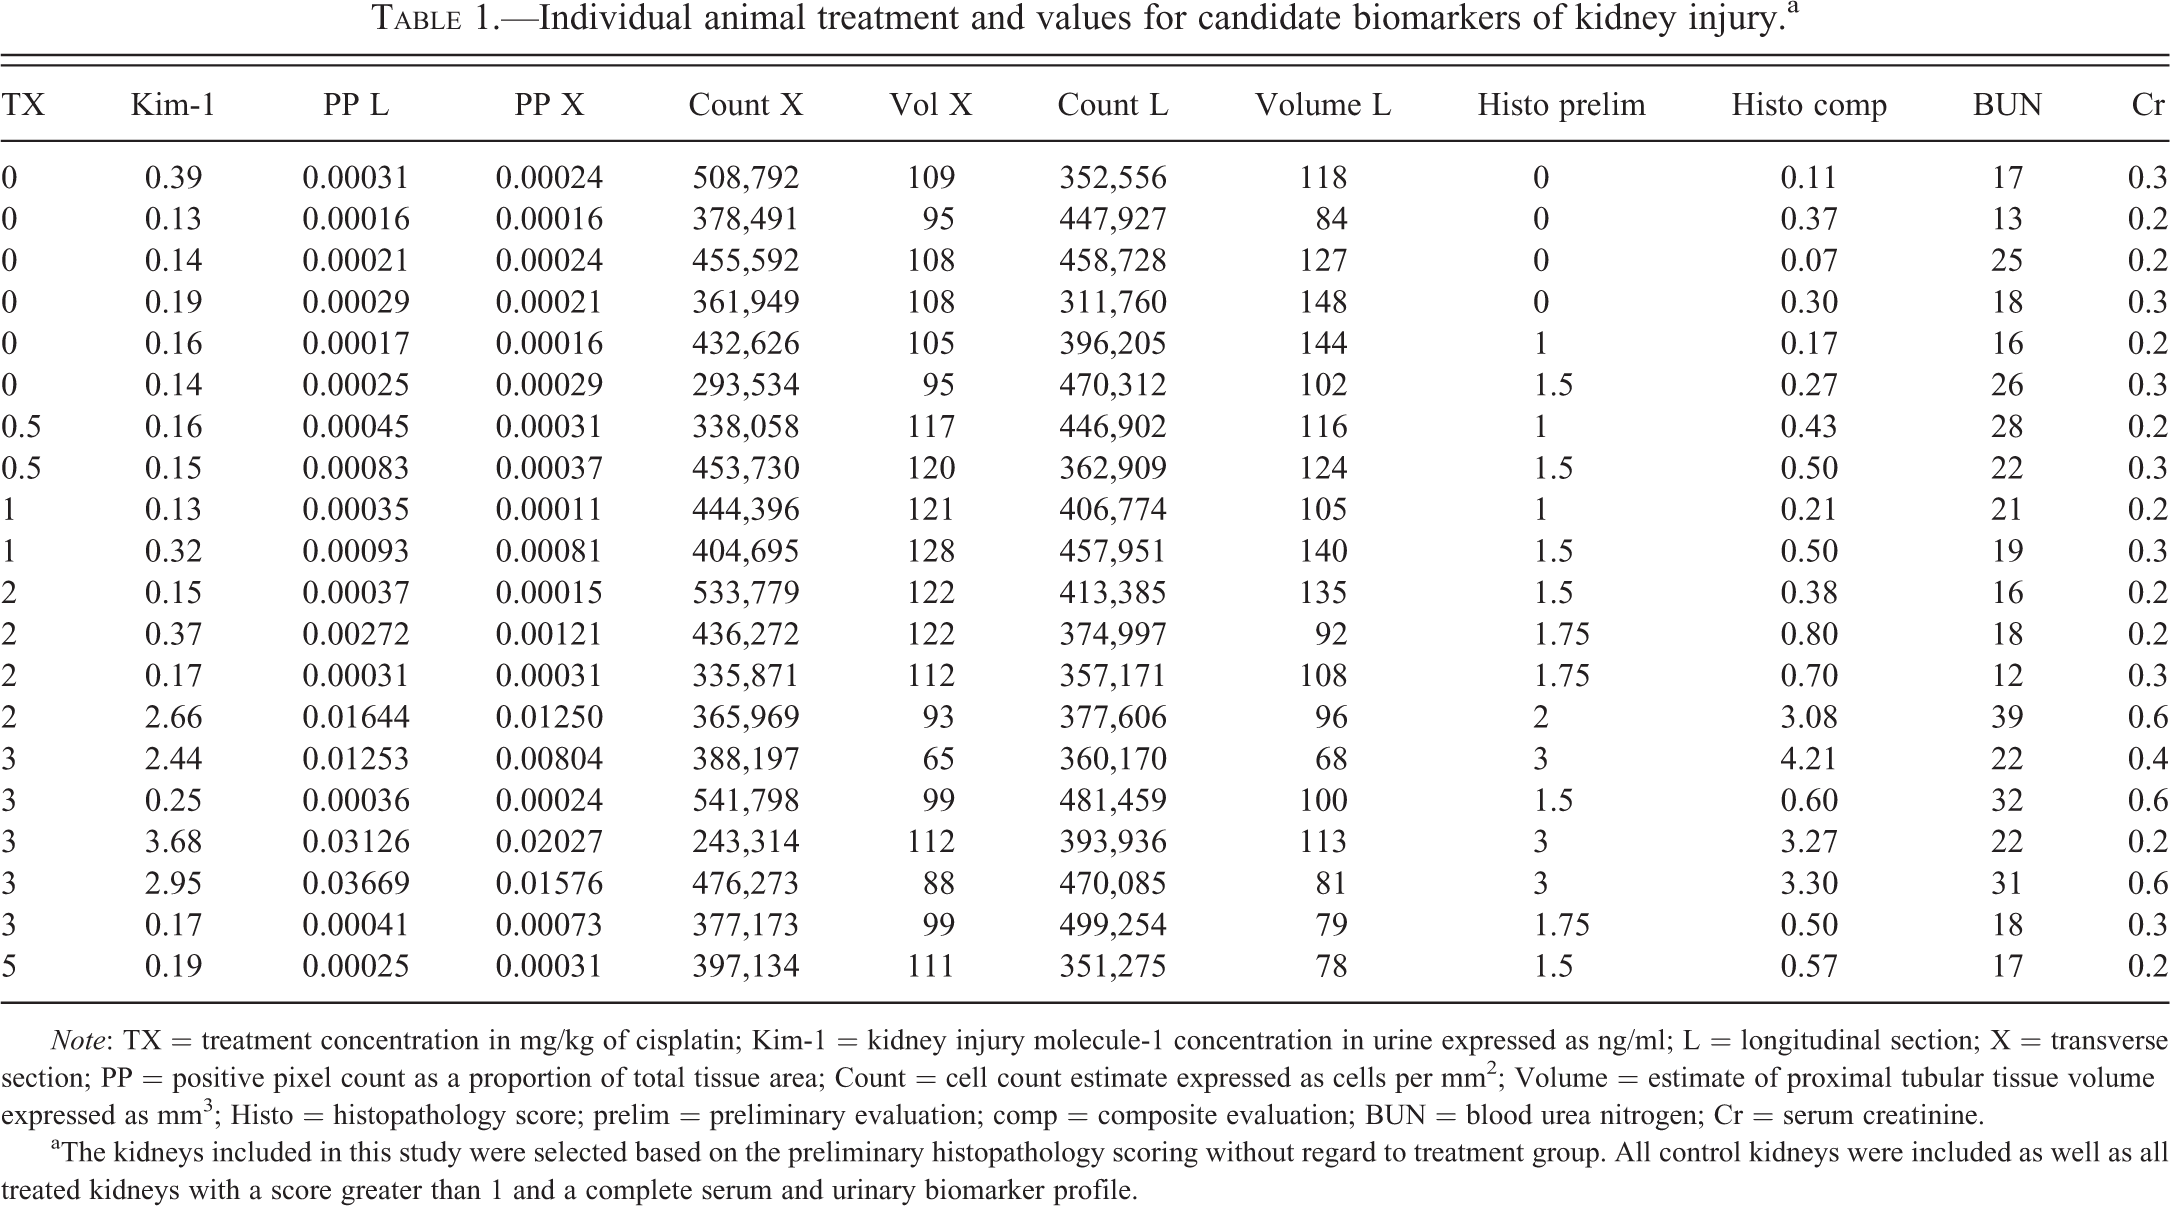
Note: TX = treatment concentration in mg/kg of cisplatin; Kim-1 = kidney injury molecule-1 concentration in urine expressed as ng/ml; L = longitudinal section; X = transverse section; PP = positive pixel count as a proportion of total tissue area; Count = cell count estimate expressed as cells per mm2; Volume = estimate of proximal tubular tissue volume expressed as mm3; Histo = histopathology score; prelim = preliminary evaluation; comp = composite evaluation; BUN = blood urea nitrogen; Cr = serum creatinine.
aThe kidneys included in this study were selected based on the preliminary histopathology scoring without regard to treatment group. All control kidneys were included as well as all treated kidneys with a score greater than 1 and a complete serum and urinary biomarker profile.
Correlation of candidate biomarkers.a
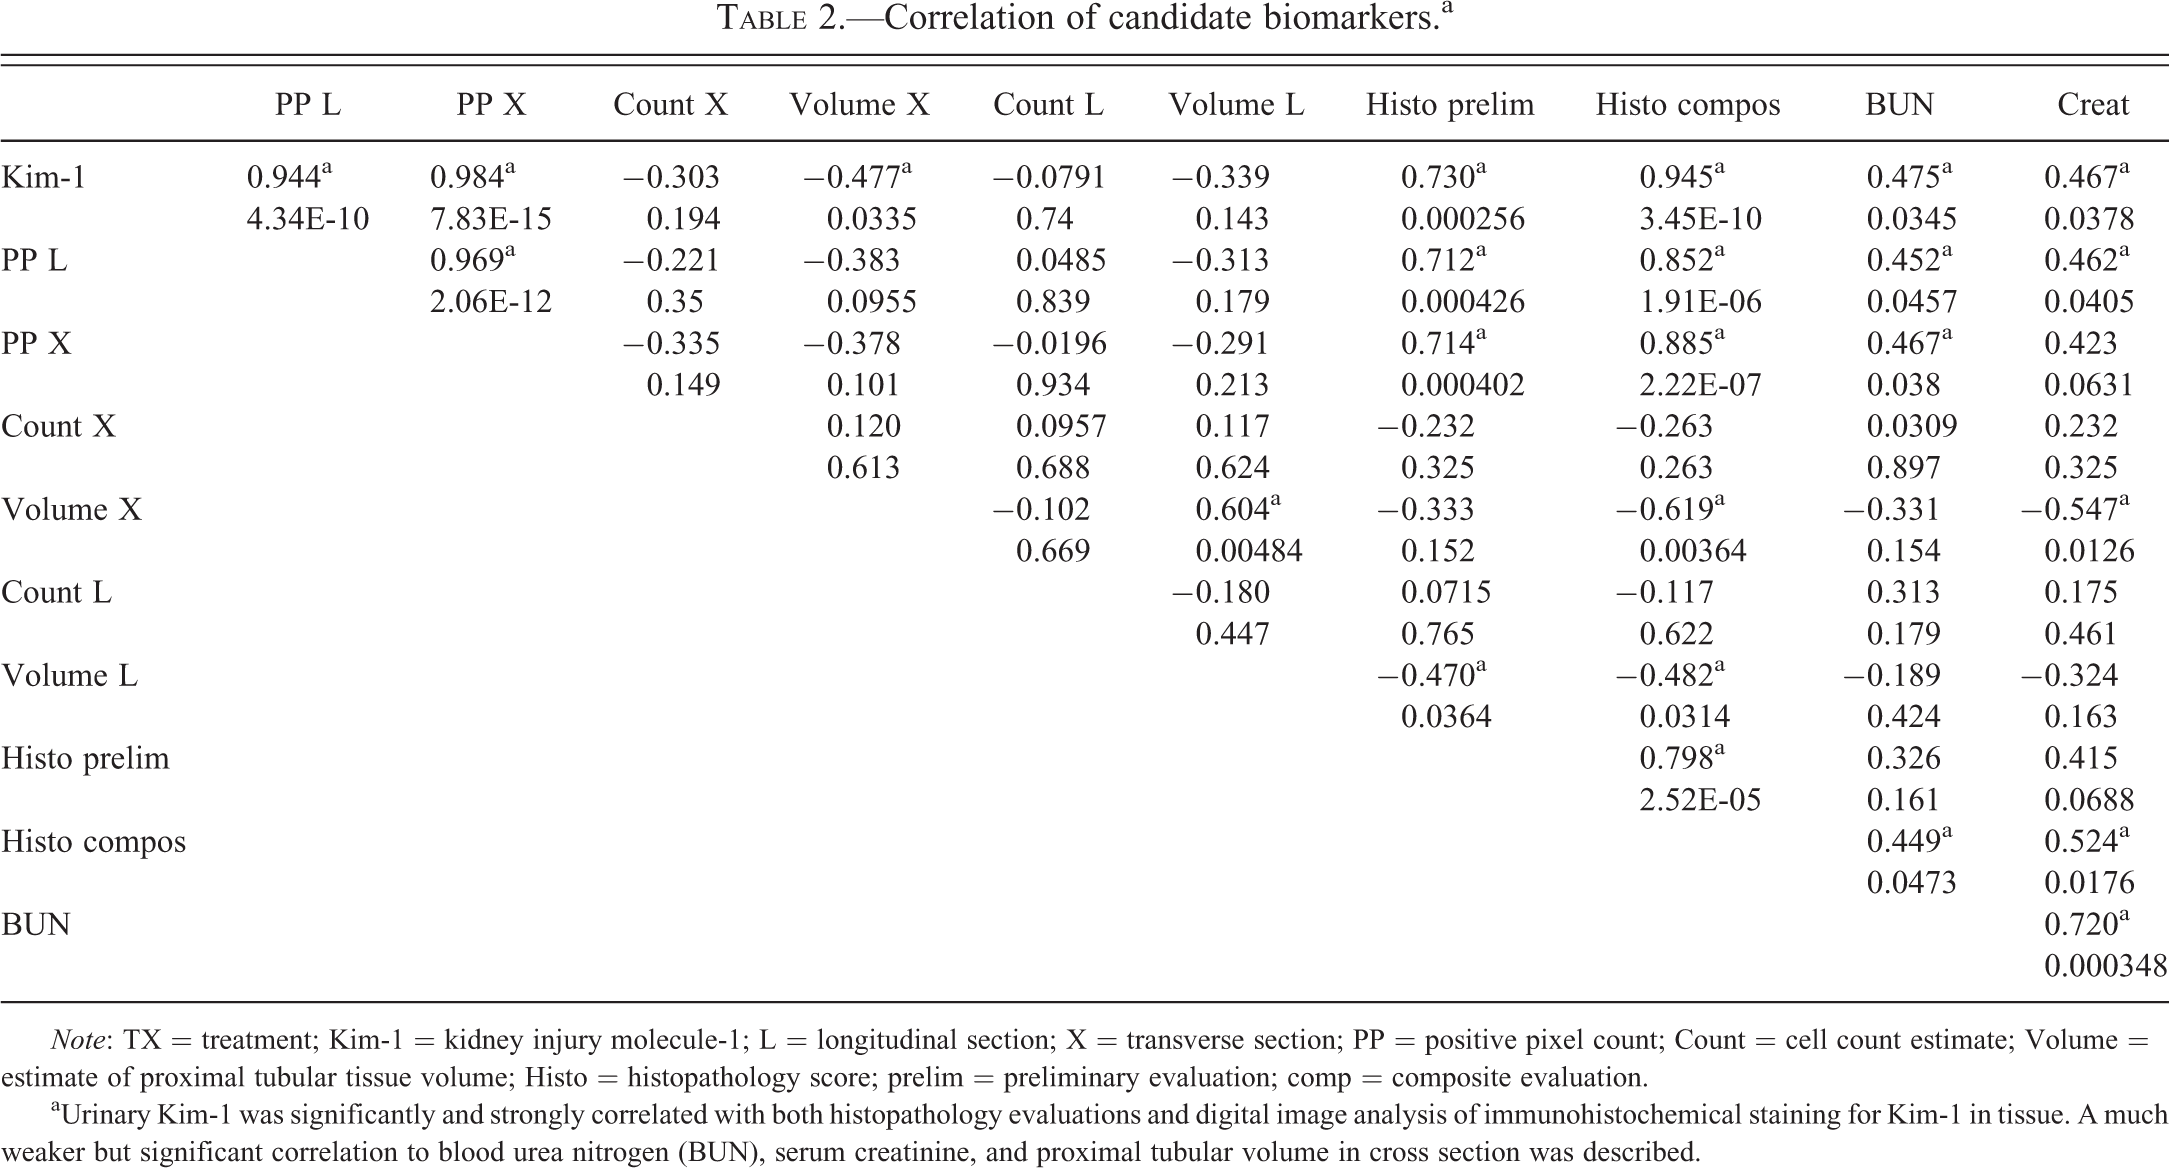
Note: TX = treatment; Kim-1 = kidney injury molecule-1; L = longitudinal section; X = transverse section; PP = positive pixel count; Count = cell count estimate; Volume = estimate of proximal tubular tissue volume; Histo = histopathology score; prelim = preliminary evaluation; comp = composite evaluation.
aUrinary Kim-1 was significantly and strongly correlated with both histopathology evaluations and digital image analysis of immunohistochemical staining for Kim-1 in tissue. A much weaker but significant correlation to blood urea nitrogen (BUN), serum creatinine, and proximal tubular volume in cross section was described.
When semiquantitative scoring from the preliminary histopathology evaluation was used traditionally (anything greater than 0 is a true positive) as the determinant to assess urinary Kim-1 performance, an AUC of 0.65 was derived. Table 3 shows the calculated mean and SD of each parameter in nontreated (control) animals (n = 6) as well as the cutoff for identifying true positives that was set as greater than either 2 or 3 SD above the mean of nontreated (control) animals. The control animals were used for this calculation to encompass spontaneous changes and define a normal or uninjured range. Significant outliers were not identified in the control animals. Using these calculations, the probability that a value in excess of 2 or 3 SD above the mean from an uninjured animal would be less than 2.5% (p < .025) or 0.2% (p < .002), respectively. Table 4 compares ROC AUC analyses assessing urinary Kim-1 performance using the various determinants of true positive defined in Table 3. This comparison reveals that image analysis–based interpretation of urinary biomarker performance is consistent whether from longitudinal or transverse sections and compared to semiquantitative histopathology methods provides a slightly smaller AUC. With stereology-based estimates of tubular volume as the determinant, urinary Kim-1 performance at 2 SD above the mean yields an AUC (0.66) only slightly above a random binomial guess (0.50). At 3 SD above the mean, ROC analysis cannot be completed because by that standard there are no positive responses. ROC curves generated using composite pathology scores and positive pixel counts as the determinants at cutoffs of 2 and 3 SD above the mean are presented in Figure 4 illustrating the difference in performance assessment provided by each determinant.

In ROC analyses, histopathology provides higher performance evaluations than digital image analysis for urinary Kim-1. ROC curves (A–D) demonstrating biomarker performance based on either digital image analysis (A, C) or histopathology evaluation (B, D) as the determinant of true positives and true negatives. (A) and (B) are using determinant cutoff at 2 standard deviations above the mean. (C) and (D) are derived from determinant cutoffs at 3 standard deviations above the mean. At both cutoff levels, histopathology provides a higher performance rating for urinary Kim-1 than does digital image analysis. ROC = receiver operator characteristic; Kim-1 = kidney injury molecule-1; L = longitudinal section image; X = transverse section image; PP = positive pixel count image analysis; Volume = estimate of proximal tubular tissue volume; Histo = histopathology score; prelim = preliminary evaluation; comp = composite evaluation; BUN = blood urea nitrogen; Cr = serum creatinine; proportions are area under the curve from the ROC analysis.
Descriptive statistics and determinant cutoff values based on means and standard deviations derived from nontreated, control animals.
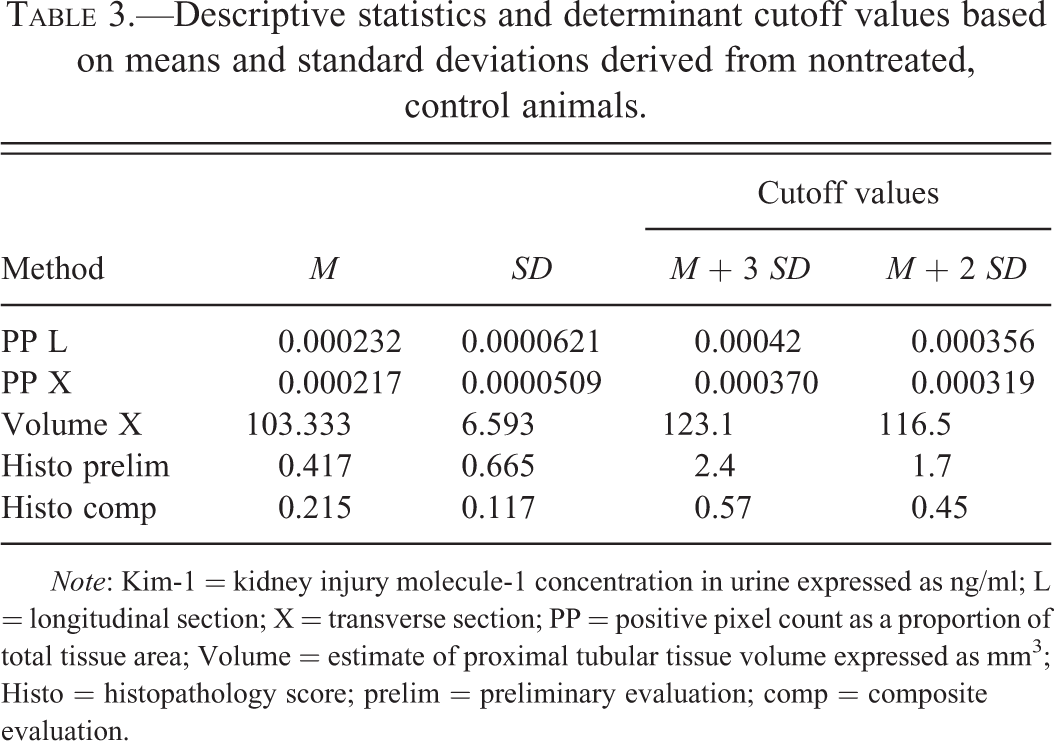
Note: Kim-1 = kidney injury molecule-1 concentration in urine expressed as ng/ml; L = longitudinal section; X = transverse section; PP = positive pixel count as a proportion of total tissue area; Volume = estimate of proximal tubular tissue volume expressed as mm3; Histo = histopathology score; prelim = preliminary evaluation; comp = composite evaluation.
Receiver operator characteristic (ROC) analyses area under the curve comparisons of urinary Kim-1 biomarker performance based on different determinants.
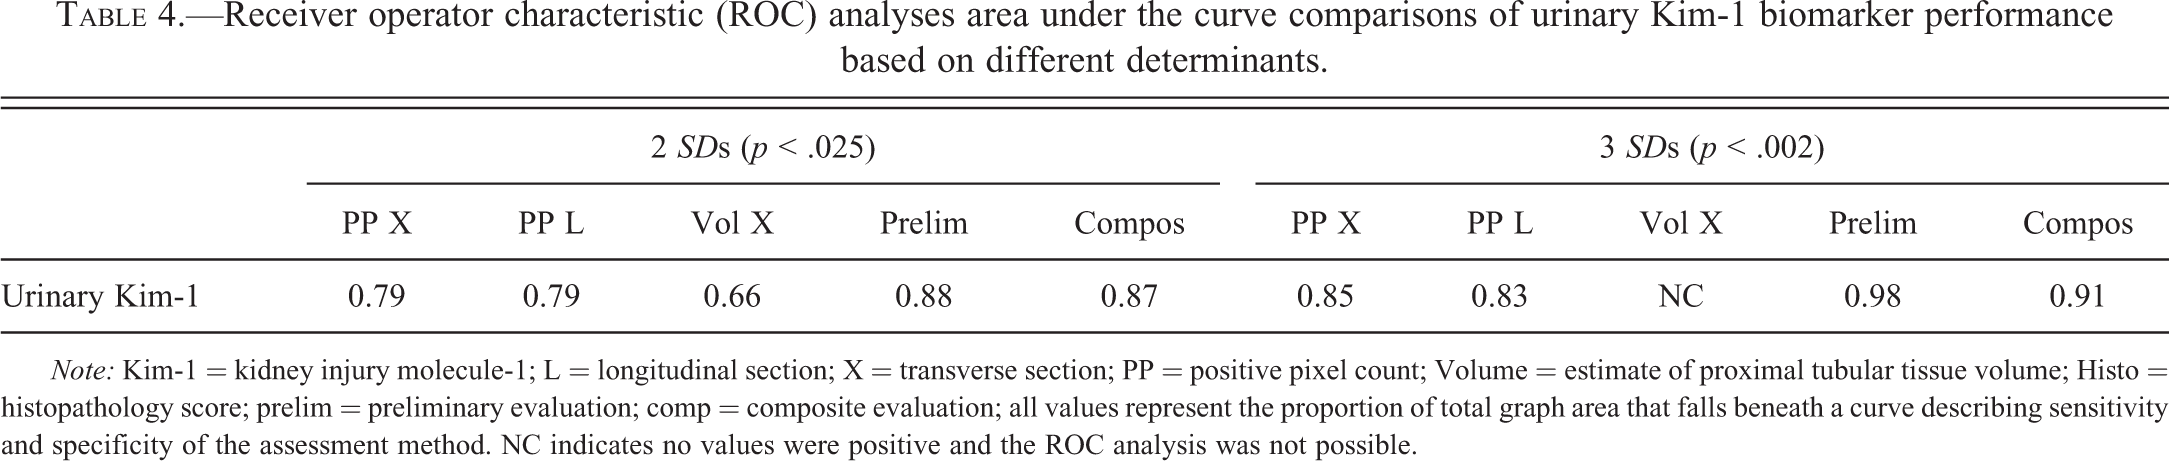
Note: Kim-1 = kidney injury molecule-1; L = longitudinal section; X = transverse section; PP = positive pixel count; Volume = estimate of proximal tubular tissue volume; Histo = histopathology score; prelim = preliminary evaluation; comp = composite evaluation; all values represent the proportion of total graph area that falls beneath a curve describing sensitivity and specificity of the assessment method. NC indicates no values were positive and the ROC analysis was not possible.
Discussion
In this study, kidney injury as determined by the presence of urinary Kim-1 was highly correlated with semiquantitative histopathology evaluation especially when the histopathology evaluation method was standardized and applied across the PWG of 3 pathologists in blinded as well as in nonblinded evaluations of samples from multiple locations within the kidney. The appearance of the urinary biomarker, Kim-1, was strongly associated with morphological changes in the kidney. The suggestion of biomarker change prior to histopathological changes in cisplatin-induced injury was not supported by this study. In every case of elevated urinary Kim-1, kidney injury was detected and elevated Kim-1 was detected in each kidney with detectable injury. A less sensitive histopathology evaluation could imply biomarker signaling and lead to a conflicting conclusion about the utility of the biomarker. The single preliminary semiquantitative histopathology evaluation suggested a somewhat weaker relationship between urinary biomarker levels and histopathology compared to the composite scoring evaluations. Treatment was more strongly correlated with this nonblinded preliminary evaluation than to the composite evaluation. This may be an example of overestimation from “expectation” bias (Burkhardt et al. 2011). A similar bias cannot be excluded from composite evaluation scores in which one-half of the contributing evaluations were done nonblinded.
Although IHC is frequently used as supporting data for quantified biomarkers, there have been minimal reports quantifying this staining and demonstrating correlation between 2 methods of biomarker quantification (Rizzardi et al. 2012). For biomarkers that might be actively secreted from a cell or released only when the cell membrane is markedly injured, IHC might not be expected to correlate particularly strongly to the urine concentrations of biomarker. However, when the biomarker is a cell surface protein that is expressed and released with injury, urinary biomarker and tissue biomarker (IHC) would be closely correlated indicating that the noninvasive (urinary) biomarker is closely reflecting the expression of the biomarker in tissue. This was the case with Kim-1 in this study. The same antibody was used to detect increased biomarker release into the urine and biomarker upregulation in the kidney tissue. These 2 measures approached a one-to-one correlation that likely reflects the movement of Kim-1 from tissue to biofluid. When proximal tubular cells in the kidney become injured, Kim-1 is shed from the apical surface of dilated proximal tubule cells directly into the urine (Han et al. 2002; van Timmeren et al. 2007; Vaidya et al. 2008; Lock 2010). Thus, Kim-1 levels in kidney tissue and urine essentially remain proportional to one another with detection of Kim-1 in tissue slightly preceding that in the urine (Vinken et al. 2012).
In different circumstances, such a strong relationship between a urinary biomarker and tissue biomarker may not be defined. As previously mentioned, a leakage or secreted biomarker might not be expected to correlate as well with tissues levels. Also the release dynamics would be likely to vary with secreted biomarker perhaps earlier in the process and leakage biomarkers later, following cellular necrosis. Specificity of the biomarker is also an issue. Kim-1 is highly specific to the kidney. Other biomarkers are less specific and additional investigation would be needed to differentiate the release of these biomarkers into the urine from their systemic release elsewhere with subsequent accumulation in the urine. Our unpublished experience with αGST has been that IHC does not correlate well with urine concentrations. In spite of that experience, αGst has been identified in proximal tubules (Bauchet et al. 2011) and clinically linked to cisplatin-induced, proximal tubular injury (Saleena et al. 2012), and it would be interesting to see if results similar to those obtained with Kim-1 could be derived with αGST. Undoubtedly, there will be no universal method for all biomarkers or all cellular biomarkers. Ultimately, an array of standard anchoring methodologies should probably be developed as novel biomarkers are developed.
When different Kim-1 antibodies were used for urinary detection and IHC staining in this study (individual data not shown), the correlations between urinary and IHC Kim-1 values were still very significant (p < .0005), but of lesser magnitude; longitudinal and transverse coefficients of .699 and .745, respectively, compared to the values reported in Table 2 of .943 and .983, respectively. In the case of Kim-1 and cisplatin-induced injury, digital image analysis of images generated from IHC-stained slide sections provided a stronger correlation to urinary Kim-1 than did a refined semiquantitative evaluation method for light microscopy.
Stereology-based, proximal tubular tissue volume estimates were significantly correlated with pathology, and in the case of transverse sections, with urinary Kim-1 levels as well. The correlation was negative as would be anticipated (increased injury would decrease normal tissue volume). However, these correlations were not as strong as the correlation to digital image analysis. Based on these data, IHC digital image analysis (positive pixel counts) and qualitative histopathology evaluation would both be better standards than stereology measurements for evaluation of urinary Kim-1 in cisplatin-induced injury. Electron microscopy (EM) is potentially an excellent alternative to light microscopy for anchoring cellular changes to biomarker release. However, EM requires equipment and resources that are not always readily available and EM is not amenable to retrospective study; the intention to process samples for EM needs to be integrated early on in the study plan so that samples can be collected and processed appropriately. For those reasons, EM was not interrogated as an anchoring methodology in this study, but it deserves investigation.
Aside from the previously discussed relationship to histopathology evaluations, treatment was significantly correlated only with volume estimates based on longitudinal images. These generally nonsignificant findings for treatment were not unexpected since many treated rats did not exhibit kidney injury at the 3-day sacrifice. The positive correlation with histopathology was attributed to the higher incidence of proximal cellular necrosis noted in treated rats, especially at higher doses. The negative correlation with longitudinal volume estimates is in the anticipated direction (negative) but was the only quantitative parameter correlated with treatment. An explanation of this phenomenon was not evident from this study. Speculatively, the larger area subject to injury (medulla) exposed on longitudinal sections may have enhanced the ability to detect treatment-associated changes. However, this finding is not consistent with correlation to comprehensive histopathology score that was greater in transverse as opposed to longitudinal sections. Stereology cell count estimates were not correlated with any of the other parameters examined suggesting that the total number of proximal tubular cells was not significantly altered early in cisplatin-induced injury. This would imply that the noted decrease in tissue volume was due to reduced proximal tubular cell volume (size) and not number.
The AUC data from ROC analyses demonstrated the effect of using different determinants of true positive on urinary Kim-1 performance assessment. With a cutoff value based on 2 SD above the mean, using semiquantitative histopathology evaluations (prelim and compos) and image analyses (positive pixel count [PP] X and PP L) as determinants provided similar assessment of urinary Kim-1 performance. Stereology evaluation (estimate of proximal tubular tissue volume [Vol] X) as the determinant indicated a weaker Kim-1 predictive performance. The cutoff of 3 SD above the mean increased the sensitivity (ability to minimize false positives) of all but the volume estimate for which no evaluation was possible. As expected, this increase in sensitivity was accompanied by a decrease in specificity (ability to minimize false negatives) for the determinants. As would be expected, the sensitivity and specificity characteristics of the determinants impacted the biomarker assessment in the same way: decreasing the specificity when the 3 SD determinants were used. Limitations of the ROC analysis, including its binary basis and the sensitivity and specificity of determinants, impact performance assessments and may diminish the ability to distinguish differences between newer assays. Some thought is required of the statistical community toward establishing additional standard metrics for assay performance assessment (Sistare et al. 2010; Pickering and Endre 2012).
In determining the utility of digital image analysis, there are several relevant considerations. The location and etiology of tubular injury may greatly influence the utility of this method. Previous experience has also indicated that the relationship between other novel urinary biomarkers and their respective tissue staining will differ from that of Kim-1. Kim-1 has proven to be a strong biomarker for tubular injury in many scenarios (Ichimura et al. 2004; Zhou et al. 2008; Fontanilla and Han 2011) and an antibody was available that could successfully be used for both IHC and an immune-based assay. One or more of these circumstances may not be applicable to other biomarkers. However, if a similar relationship can be established for Kim-1 IHC and histopathology evaluations in other cases of early tubular injury, IHC may be applicable as a quantifiable performance metric for urinary Kim-1.
The use of semiquantitative histopathology evaluation is the standard in most diagnostic histopathology applications (disease diagnosis, toxicity, and experimental change) and to date has been one of the key evaluative methods for biomarker performance assessment. Although the present study offers a fully quantitative alternative yielding similar performance assessments, semiquantitative evaluation as described here still provided the highest values for biomarker performance in a ROC analysis. In our use of semiquantitative evaluation, there were two critical points that might influence the replication of these results: (1) the preliminary evaluation was performed by a single pathologist with extensive experience in evaluating experimental kidney injury and more specifically cisplatin-induced kidney injury and (2) composite scoring was an average of blinded and nonblinded studies from pathologists with varying degrees and types of prior experience; however, this variation was tempered by several days of intense group training on the specific lesions to be evaluated. There are multiple sources of bias (Crissman et al. 2004; Burkhardt et al. 2011; Holland and Holland 2011) within histopathology evaluation methodology (experience of pathologist, peer review, and nonblinded evaluation) that might affect the outcome of semiquantitative evaluations and influence the relevance of those evaluations as a standard for assessing biomarker performance. This does not include bias and/or variability introduced by harvesting, sampling, and processing techniques prior to evaluation (Burkhardt et al. 2011). Nor, does this address the number of sections evaluated from harvested tissue.
Conclusion
Biomarker (Kim-1) change was only observed in conjunction with morphological change in this cisplatin-induced kidney injury study. There was no added value from stereology analyses although this may not be true with different etiologies and/or locations of kidney injury. Digital image analysis of IHC tissue staining for Kim-1 correlated more strongly with urinary Kim-1 levels than did histopathology evaluation. However, quantified parameters, regardless of stronger correlation, did not produce better performance standards than semiquantitative histopathology evaluations as determined by ROC analyses. Digital image analysis produced assessment results similar to those of semiquantitative evaluations, but also allowed quantification, yielded a continuous measure more amenable to statistical analysis, and controlled for sources of subjective, knowledge, or interpretation-based bias; factors holding varying degrees of relevance in different studies. As designed and conducted, this study supports semiquantitative histopathology evaluations as the current standard for biomarker qualification in regulatory decision making.
Footnotes
The author(s) declared no potential conflicts of interest with respect to the research, authorship, and/or publication of this article.
The author(s) received no financial support for the research, authorship, and/or publication of this article.
Abbreviations
Acknowledgments
The authors would like to acknowledge Dr. Rogely Boyce, Dr. Hans Gundersen, and Dr. Rosanna Mirabile for their kind assistance and guidance in experimental design of the stereology components of this study. The authors would particularly like to acknowledge Dr. Patricia Harlow, Dr. Elizabeth Hausner, and Dr. Melanie Blank who provided guidance in the conception and execution of this work. The participation of the FDA pathologists, Dr. Jun Zhang, Dr. Sabine Francke-Carroll, and Dr. Steven Mog made this study possible and the authors acknowledge their tremendous contribution to this work.
Authors’ Note
Vivian English and Shelley Gruntz provided technical assistance in the processing of tissues. Dr. Johnnie Bremholm Andersen provided invaluable assistance and support in the execution of the stereology protocols. Alan Knapton, Scott Pine, and Dr. David Peters were instrumental in completing the animal phase of this study. The findings and conclusions in this article have not been formally disseminated by the Food and Drug Administration and should not be construed to represent any Agency determination or policy.
References
Supplementary Material
Please find the following supplemental material available below.
For Open Access articles published under a Creative Commons License, all supplemental material carries the same license as the article it is associated with.
For non-Open Access articles published, all supplemental material carries a non-exclusive license, and permission requests for re-use of supplemental material or any part of supplemental material shall be sent directly to the copyright owner as specified in the copyright notice associated with the article.