
Abstract
Lersivirine is a nonnucleoside reverse transcriptase inhibitor (NNRTI) being developed for the treatment of HIV-1 infection. Like other NNRTIs, lersivirine is a potent enzyme inducer in rodents capable of inducing a number of hepatic enzymes including those involved in its own metabolism. Preclinically lersivirine has been associated with hepatocellular hypertrophy and thyroid gland follicular cell hypertrophy in rats, mice, and dogs. In rodents, we show that development of thyroid hypertrophy is related to the classic mechanism, namely increased thyroxine (T4) clearance secondary to induction of uridine-diphosphoglucuronosyltransferase (UDPGT) in the liver and a resulting increase in thyroid-stimulating hormone. Similarly, lersivirine-exposed dogs exhibit a significant increase in hepatic UDPGT enzyme activity along with increased T4 clearance although clear effects on serum thyroid hormone levels were less apparent. These effects on thyroid hormonal clearance in the dog suggest that thyroid gland hypertrophy in this species is due to the same mechanism shown to occur in rodents although, as expected, dogs better adapt to these effects and therefore maintain relatively normal thyroid hormonal balance. It is also notable that the minimal thyroid follicular hypertrophy that occurs in dogs does not progress as is seen in rodents. As is the case with rodents, these adaptive changes in the dog are not considered indicative of a human health risk.
Introduction
Hepatic enzyme induction following xenobiotic exposure can occur in any species. However, significant species-specific differences in this response are common as are the pharmacologic/toxicologic consequences of the induction (Hewitt, Lecluyse, and Ferguson 2007). Common changes associated with hepatic enzyme induction include increased liver weight and hepatocellular hypertrophy, which are generally considered adaptive changes (Greaves 2007). These effects were noted in all species used in the preclinical development of lersivirine (mouse, rat, and dog) with the rat being most sensitive followed by the mouse then dog. Lersivirine also exhibited autoinduction in rodents resulting in a marked reduction in drug exposure over time in multiple dose studies; however, this change in pharmacokinetics was expected based on effects known to occur with other compounds in this class such as efavirenz (Berruet et al. 2005). One consequence of autoinduction is that high doses of compound are needed to achieve sufficient systemic exposure in rodents, and as a result liver exposure following oral dosing is significantly higher than what is measured systemically, potentially leading to an exacerbation of liver-related effects associated with this compound.
Perhaps the best-known consequence of chronic hepatic enzyme induction is the development of thyroid follicular cell hypertrophy/hyperplasia in rodents. Induction of hepatic uridine-diphosphoglucuronosyltransferase (UDPGT) leads to accelerated thyroid hormone clearance with a compensatory elevation in circulating thyroid-stimulating hormone (TSH). Chronically, this results in thyroid follicular cell hypertrophy and hyperplasia with eventual development of thyroid neoplasia in rodents (Capen 1997). While drug-related hepatic enzyme induction and altered thyroid function are certainly not rodent-specific phenomena, nonrodent species have generally been considered relatively resistant to these thyroid-related effects; however, they are not completely resistant either as illustrated by dogs treated with phenobarbital (Gieger et al. 2000). Yet, even when thyroid function is altered, morphologic effects are only rarely documented in the thyroid gland of nonrodent species. Some of this may be based simply on the failure to evaluate the thyroid gland microscopically although the primary reason for this discrepancy is likely related to significant interspecies differences in thyroid hormone regulation (Capen 1997; Ferguson 1994; Kaptein, Hays, and Ferguson 1994; Lewandowski, Seeley, and Beck 2004). Rodents generally exhibit a much more dynamic and labile hypothalamic–pituitary–thyroid (HPT) system than nonrodent species and as a result are particularly susceptible to this mechanism. Nonetheless, because the basic function of the HPT system is similar between species, the possibility of a similar hypertrophic effect in the thyroid gland of a nonrodent species cannot be completely precluded given enough time and exposure to a potent enough inducer. In fact, there are some data (described herein) to suggest that dogs as compared to humans are slightly more susceptible to such a mechanism given the right conditions. In any case, the historic weight of evidence strongly supports the conclusion that this mechanism is unlikely to translate to humans (McClain 1995).
This article describes the results of 3 mechanistic studies designed to evaluate the effects of lersivirine on the liver and HPT axis with a particular focus on highlighting the similarity of these effects between the 3 different species used during the preclinical development of this compound (mouse, rat, and dog). In addition, results from several general toxicity studies are described. Although the severity and time of onset varies between species, the weight of evidence summarized here supports the conclusion that the same mechanism is behind the development of these preclinical findings in all 3 species.
Materials and Methods
Animals and Experimental Design
General Toxicity Studies
During the development of lersivirine, several repeat dose, oral gavage, general toxicity studies contributed to an understanding of the effects of hepatic enzyme induction (Table 1). Designs for these studies were generally consistent with those used in pharmaceutical drug development and therefore are not presented in detail. Animal characteristics, handling, and housing conditions were similar to those in the mechanistic studies described below. Three of these studies (2-week and 3-month studies in rats and a 2-week study in dogs) included characterization of hepatic P450 responses. In the 2-week rat general toxicity study, lersivirine was administered to young adult, male and female Sprague-Dawley rats (10/sex/dose) at daily dose levels of 0, 20, 70, or 300 mg/kg/day for 2 weeks. In the 3-month rat study, lersivirine was administered to young adult male and female Sprague-Dawley rats (10/sex/group) at doses of 0, 500, 1,000, and, 2,000/500/1,500 mg/kg/day for 13 weeks. In the 2-week general toxicity study in dogs, lersivirine was administered by oral gavage to young adult male and female Beagle dogs (3/sex/dose) at daily dose levels of 0, 5, 50, and 150 mg/kg/day for 2 weeks.
Summary pathology data from general toxicity studies—liver end points.
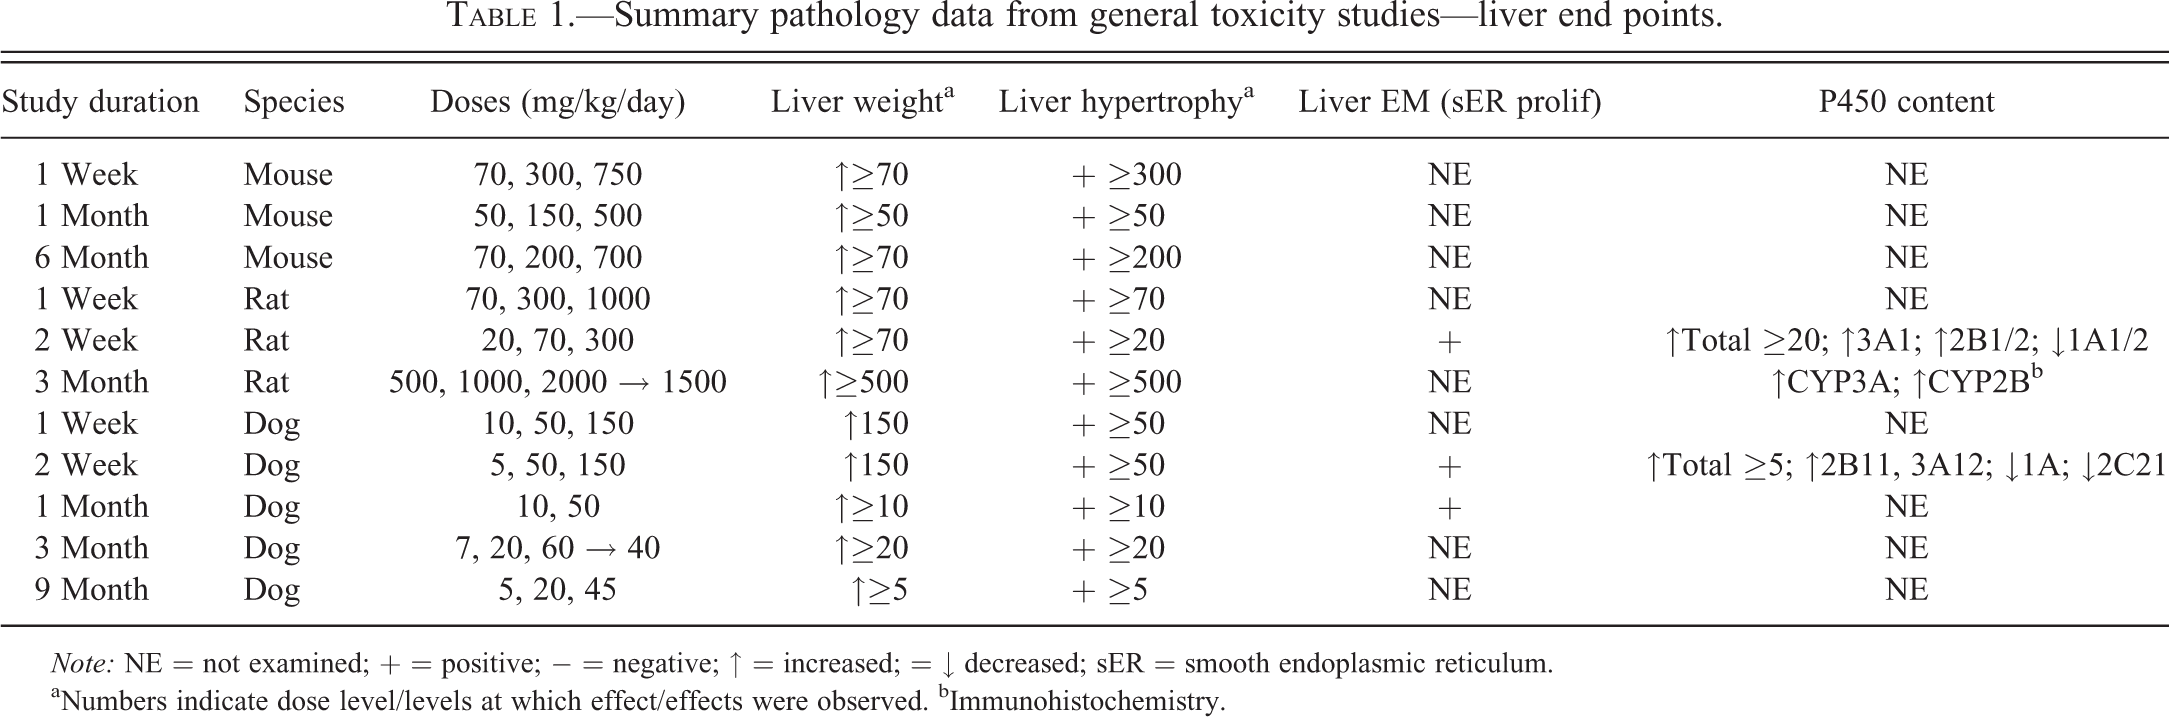
Note: NE = not examined; + = positive; − = negative; ↑ = increased; = ↓ decreased; sER = smooth endoplasmic reticulum.
aNumbers indicate dose level/levels at which effect/effects were observed. bImmunohistochemistry.
The remaining lersivirine oral gavage general toxicity studies used similar study designs and conditions but did not include detailed hepatic enzyme analyses. In CD1 mice, these were 1-week (70, 300, and 750 mg/kg/day), 1-month (50, 150, and 500 mg/kg/day), and 6-month (70, 200, and 750 mg/kg/day) studies. In Sprague-Dawley rats, this was a 1-week (70, 300, and 1,000 mg/kg/day) study. In Beagle dogs, these were 1-week (10, 50, and 150 mg/kg/day), 1-month (10 and 50 mg/kg/day), 3-month (7, 20, and 60 → 40 mg/kg/day), and 9-month (5, 20, and 45 mg/kg/day) studies.
Mechanistic Studies (Summarized in Table 2)
6-month Mouse Mechanistic Study
Male and female Crl:CD1(ICR) mice were received from Charles River Laboratories, (Portage, Michigan) and at initiation of treatment were between 7.5 and 8.4 weeks old with body weights ranging from 29.2 to 41.2 g for males and 21.2 to 32.5 g for females. Following randomization, each study animal was assigned a unique number by means of an implantable microchip identification device and/or cage card. Mice were housed individually in stainless steel cages and offered Certified Rodent Diet #8728C (Harlan Teklad) and water ad libitum. Environmental controls for the animal room were set to maintain 18 to 26°C, a relative humidity of 30 to 70%, a minimum of 10 room air changes/hour, and a 12-hr light/12-hr dark cycle. All animals were checked twice daily (a.m. and p.m.) for morbidity, abnormalities, and signs of pain or distress. Detailed observations were performed once during the predose phase, once before dosing on day 1, weekly thereafter, and on the day of scheduled sacrifice. Body weights were recorded once during the predose phase, prior to dosing on the first day of dosing, and weekly thereafter. Food consumption was measured weekly.
Summary of mechanistic study experimental design.
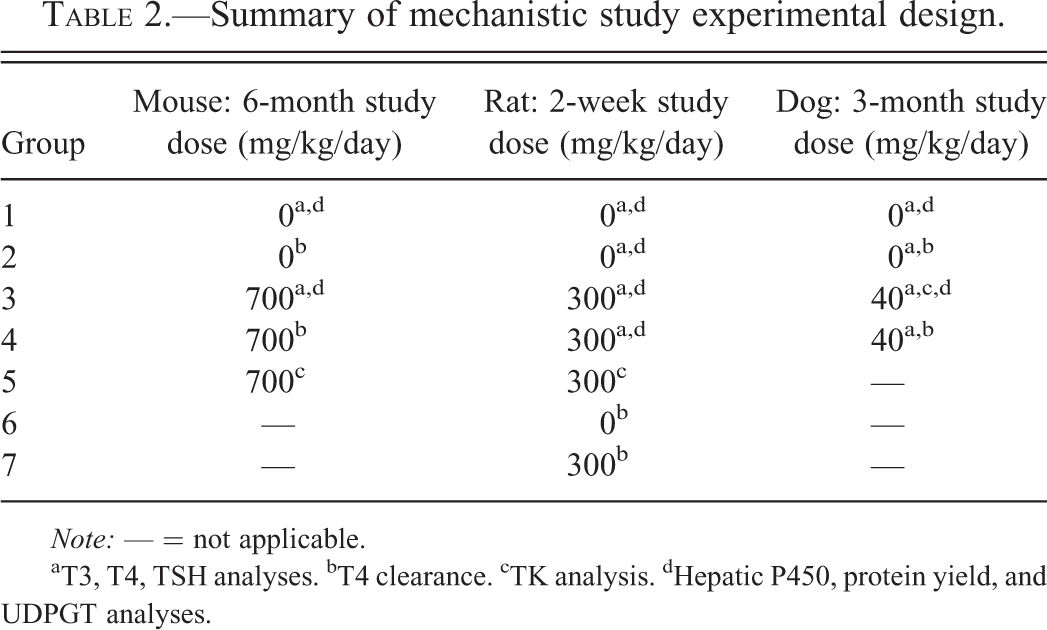
Note: — = not applicable.
aT3, T4, TSH analyses. bT4 clearance. cTK analysis. dHepatic P450, protein yield, and UDPGT analyses.
Four groups of mice were administered the control article or lersivirine by oral gavage. Groups 1 (20/sex) and 2 (24/sex) were control groups and groups 3 (20/sex) and 4 (24/sex) were treated with lersivirine. Lersivirine was given at 350 mg/kg/day for days 1 through 4 and then at 700 mg/kg/day for days 5 through 182. Animals in groups 1 and 3 were used to measure thyroid hormone levels (day 183) and underwent necropsy on day 183. Animals in groups 2 and 4 were designated for analysis of thyroxine (T4) clearance and administered radiolabeled thyroxine (125I-T4) on day 183. After collection of appropriate blood samples, animals in groups 2 and 4 were euthanized with no further evaluation. A fifth group of animals (12/sex) was dosed with 350 mg/kg/day of lersivirine for days 1 through 4 followed by 700 mg/kg/day for days 5 through 182 and served as a toxicokinetics (TK) group (group 5). In these animals, a single blood sample was collected via cardiac puncture while under carbon dioxide anesthesia on day 182. Blood samples (n = 3/sex/time point) were collected at 1-, 3-, 6-, and 24-hr postdose, placed in lithium heparin tubes, and processed to plasma via centrifugation. Animals were not fasted for sample collection.
2-week Rat Mechanistic Study
Male and female Crl:CD(SD) rats were received from Charles River Laboratories, (Raleigh, North Carolina) and at initiation of treatment were 6 to 8 weeks old with body weights ranging from 216 to 263 g for males and 163 to 211 g for females. Following randomization, each study animal was assigned a unique number by means of an implantable microchip identification device and/or cage card. Rats were housed individually in stainless steel cages and offered Certified Rodent Diet #8728C (Harlan Teklad) and water ad libitum. Environmental controls for the animal room were set to maintain 18 to 26°C, a relative humidity of 30 to 70%, a minimum of 10 room air changes/hour, and a 12-hr light/12-hr dark cycle. Animals were checked twice daily (a.m. and p.m.) for morbidity, abnormalities, and signs of pain or distress. Body weights were taken once during the predose phase and on days 1, 8, and 15. Food consumption was measured weekly.
Six groups of rats (7/sex/group) were administered control article (groups 1, 2, and 6) or lersivirine at a dose level of 300 mg/kg/day (groups 3, 4, and 7) by oral gavage. Animals in groups 1 and 3 were dosed for 14 days and used to measure thyroid hormone levels (day 15) and underwent necropsy on day 15. Groups 2 and 4 were dosed for 15 days and used to measure thyroid hormone levels (day 16) and underwent necropsy on day 16. Animals in groups 6 and 7 were dosed for 14 days and designated for analysis of T4 clearance. After the collection of appropriate blood samples, the animals in groups 6 and 7 were euthanized with no further evaluation. A seventh group of animals (3/sex) was designated for TK assessment and dosed orally with lersivirine at a dose level of 300 mg/kg/day for 14 days (group 5). In these animals, serial blood samples were collected on day 14 using lithium heparin as the anticoagulant at 1, 3, 6, and 24 hr after dosing.
3-month Dog Mechanistic Study
Male and female purebred beagle dogs were received from Covance Research Products, Inc. (Cumberland, Virginia) and at initiation of treatment were between 9 and 11 months old with body weights ranging from 9.1 to 12.0 kg for males and 6.5 to 9.4 kg for females. Animals were identified using a tattoo and an implantable microchip identification device and/or cage card. Dogs were housed individually in stainless steel cages and offered Certified Canine Diet #2027C (Harlan Teklad) ad libitum. The animals were given additional supplements as a form of environmental enrichment and various cage-enrichment devices. Water was provided ad libitum. Environmental controls for the animal room were set to maintain 18 to 29°C, a relative humidity of 30 to 70%, a minimum of 10 room air changes/hour, and a 12-hr light/12-hr dark cycle. Twice daily (a.m. and p.m.), animals were observed for morbidity, abnormalities, and signs of pain or distress. Cage-side observations for general health and appearance were done once daily and detailed observations were done 3 times during the predose phase, once before dosing on day 1, weekly thereafter, and on the day of scheduled sacrifice. Body weight was taken 3 times during the predose phase, on the first day of dosing, and weekly thereafter. Food consumption was measured weekly.
Dogs were randomly assigned to 4 groups (4/sex/group). Animals in groups 1 and 2 received daily doses of control article and animals in groups 3 and 4 received daily doses of lersivirine at 40 mg/kg/day. Animals in groups 1 through 4 were dosed via oral gavage for 91 days and used to measure thyroid hormone levels (days 8, 22, and 92). For assessment of TK, serial blood samples were taken from all animals in group 3 on day 91 at 1, 3, 6, and 24 hrs after dosing. All animals in groups 1 and 3 then underwent necropsy on day 92. Animals in groups 2 and 4 were designated for analysis of T4 clearance. These animals were given an intravenous dose of 125I-thyroxine (T4) on day 92. After collection of the appropriate blood samples, animals in groups 2 and 4 were euthanized without necropsy. Summary data for the studies described above are included in Tables 1, 3 through 6.
Summary pathology data from general toxicity studies—thyroid end points.
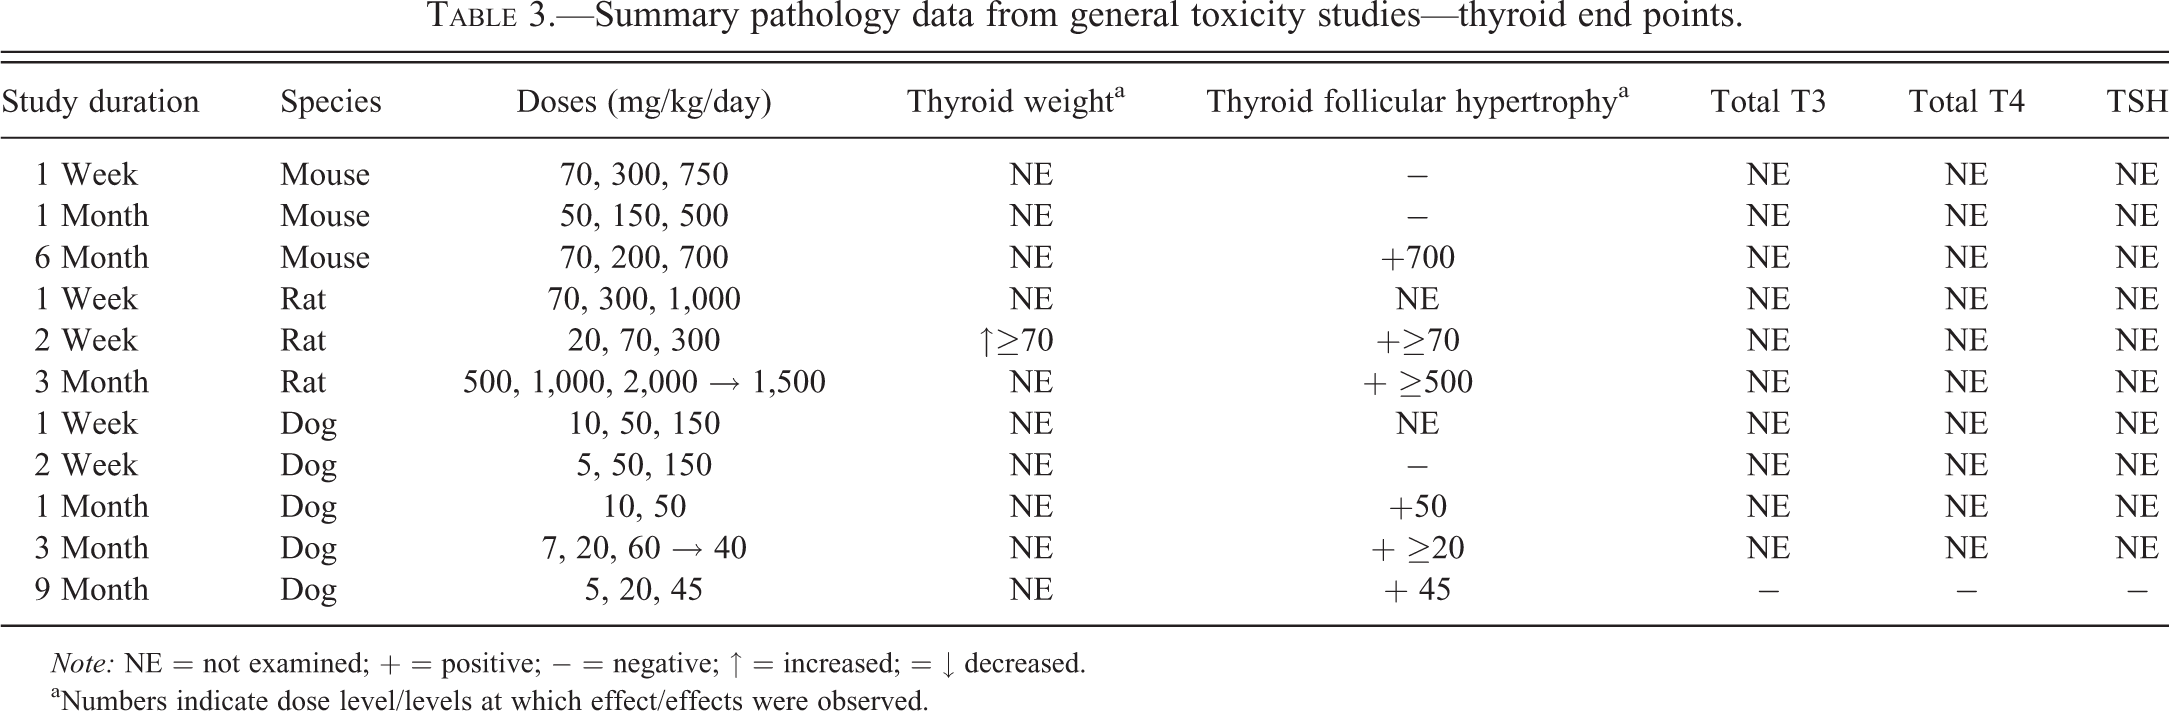
Note: NE = not examined; + = positive; − = negative; ↑ = increased; = ↓ decreased.
aNumbers indicate dose level/levels at which effect/effects were observed.
All in vivo studies complied with the Animal Welfare Act, the Guide for the Care and Use of Laboratory Animals, and the Office of Laboratory Animal Welfare guidelines.
Test and Control Articles
In all three species, the control article was 0.5% (w/v) methylcellulose and 0.1% (v/v) Tween 80 in reverse osmosis water and was prepared once weekly and stored at 2 to 8°C until used to prepare dosing formulations. Lersivirine in 0.5% (w/v) methylcellulose and 0.1% (v/v) Tween 80 in reverse osmosis water was stable for 31 days when stored at 5°C over a concentration range of 0.1 to 200 mg/ml. Dosing formulations were prepared once weekly and stored at 5°C until use. Dose preparations were stirred using a magnetic stir plate and stir bar for at least 5 min before and during dosing.
Necropsy and Histopathology
In the mechanistic mouse and dog studies, groups 1 and 3, and in the mechanistic rat study, groups 1 through 4, were anesthetized with sodium pentobarbital, exsanguinated, and necropsied. Dogs and rats were fasted overnight before necropsy. In all 3 species, terminal body weights were recorded, and macroscopic observations and organ weights of brain, liver, and thyroid gland were recorded. Samples of liver and the thyroid gland from each animal were preserved in 10% neutral buffered formalin, routinely processed, stained with hematoxylin and eosin (H&E), and examined microscopically. Unfixed portions of the liver from each animal were collected for biochemical analysis (P450 content, protein yield, and UDPGT activity). These samples were placed into labeled plastic bags, heat-sealed, flash-frozen in liquid nitrogen, and kept on dry ice until analyzed.
In general toxicity studies, terminal procedures were similar to those described above for the mechanistic studies. In all general toxicity studies, livers were weighed, preserved in 10% neutral-buffered formalin, routinely processed, stained with H&E, and examined microscopically. In most general toxicity studies, the thyroid gland was also processed as described for the liver and examined microscopically although thyroid gland weights were only evaluated in 1 general toxicity study (2-week rat study; Table 3).
Thyroid Hormone Analysis
In the mechanistic studies, serum samples were collected for thyroid hormone (TSH, T3, and T4) analysis from mice (groups 1 and 3) on day 183, rats on day 15 (groups 1 and 3) or 16 (groups 2 and 4), and from all group 1 through 4 dogs twice during the predose phase, once on days 8 and 22, and once on day 92 (prior to necropsy for groups 1 and 3, and prior to 125I-T4 administration for groups 2 and 4).
For mice, blood (approximately 0.5 ml) was collected into BD Vacutainers® (Product No. 367983) without anticoagulant via cardiac puncture from nonfasted animals anesthetized with sodium pentobarbital approximately 24 hr following the last dose of lersivirine (day 182). Samples were collected in the morning and were maintained at room temperature and allowed to clot completely prior to being centrifuged (approximately 1,750 g) for 10 to 15 min at 2 to 8°C within 1 hr of collection. Serum was transferred to polypropylene tubes and stored in a freezer set to maintain −60 to −80°C until analyzed.
For rats, blood (approximately 2.0 ml) was collected without anticoagulant from the jugular vein into BD Vacutainers® (Product No. 367983) approximately 24 hr following the last dose of lersivirine (day 15 for groups 1 and 3; day 16 for groups 2 and 4). Rats were not fasted prior to sample collection. Samples were collected in the morning and were maintained at room temperature and allowed to clot completely prior to being centrifuged (approximately 2,500 g) for 10 min at 2 to 8°C within 1 hr of collection.
For dogs, blood (approximately 2.0 ml) was collected without anticoagulant from the jugular vein into BD Vacutainers (Product No. 367983) approximately 24 hr following the last dose of lersivirine (day 91). Dogs were fasted prior to sample collection. Samples were collected in the morning and were maintained at room temperature and allowed to clot completely prior to being centrifuged (approximately 2,500 g) for 10 min at 2 to 8°C within 1 hr of collection.
Analysis of serum samples included total triiodothyronine (T3), total T4, and TSH. In mice, T3 was analyzed using a commercial radioimmunoassay kit for T3 from Diasorin Inc. (Stillwater, MN; Cat No. 1541), T4 was analyzed using a commercial radioimmunoassay kit for T4 from Siemens Medical Solutions Diagnostics, (Los Angeles, CA; Cat No. TKT41), and TSH was analyzed using a radioimmunoassay kit for TSH from ALPCO Diagnostics, (Salem, NH; Cat No. 29-AH-R001). All 3 assays were validated for use with mouse sera and all analyses were conducted on a Perkin Elmer Wizard Gamma Counter (Model 1470). In rats and dogs, all analyses were conducted on an Immulite® 2000 immunoassay system (Siemens Healthcare Diagnostics). Chemiluminescent enzyme immunoassays from Siemens were used for all thyroid hormone analyses in dog and rat; T3 was analyzed using the Immulite2 Total T3 kit (Cat No. L2KT32), dog T4 was analyzed using the Immulite 2000 Canine Total T4 Kit (Cat No. L2KCT2), rat T4 was analyzed using the Immulite2 Total T4 kit (Cat No. L2KT42), dog TSH was analyzed with the Immulite2 Canine TSH kit (Cat No. L2KKT2), and rat TSH was analyzed with the Immulite2 Rapid TSH kit (Cat No. L2KRT2).
In 1 general toxicity study (9-month dog), total T3, total T4, and TSH were also evaluated once pretest and on days 37, 87, 177, and 269 using similar methods to those described above (Table 3).
Hepatic Enzyme Evaluation
In all 3 mechanistic studies and several general toxicity studies (2-week rat, 3-month rat, and 2-week dog), hepatic microsomal fractions were prepared from liver samples collected at necropsy. In the mechanistic studies, this involved rats in groups 1 through 4 and mice and dogs in groups 1 and 3 and included an analysis for total cytochrome P450 content, UDPGT activity, and hepatic microsomal protein concentration. In addition, samples from the 3-month dog mechanistic study were evaluated for ethoxyresorufin O-deethylase (EROD, CYP1A), pentoxyresorufin O-dealkylase (PROD, CYP2B), and testosterone 16α– and 6β–hydroxylase (16α–OH, CYP2B/2C and 6β–OH, CYP3A). Liver samples from the 2-week dog general toxicity study were also evaluated for cytochromes P450 1A, 2B11, 2C21, and 3A12, whereas the 2-week general toxicity rat study included an evaluation of cytochromes P450 1A1/2, 2B1/2, 2C11, 2E1, and 3A1. Finally, the 3-month rat general toxicity study included an immunohistochemical evaluation of CYP 3A and CYP 2B protein expression in the liver.
Preparation of Hepatic Microsomes
In the mechanistic studies, homogenization buffer (ice cold 50 mM Tris-HCl buffer containing 150 mM KCl and 2 mM EDTA, pH 7.4) was added to a liver sample from each animal at a volume to yield an approximate 28% (w/v) homogenate, and microsomes were prepared based on the method of Lu and Levin (1972) by differential centrifugation and were stored at approximately −70°C until analysis. During preparation of hepatic microsomes, samples and glassware were kept on ice. In the general toxicity studies, 10% (w/v) liver homogenates were prepared in 1 mM Tris-HCl buffer (pH 7.5) containing 0.25 M sucrose using an Ultra-Turax homogenizer at minimal speed. Cell debris and mitochondria were removed by an initial centrifugation at 7,500 g for 10 min followed by a second centrifugation at 15,000 g for another 10 min. Microsomes in the supernatant fraction were precipitated by addition of CaCl2 to a final concentration of 8 mM and recovered by centrifugation at 36,000 g for 15 min. The pellets were resuspended in 0.15 M KCl and centrifuged at 36,000 g for 15 min. Microsomes were resuspended in 0.1 M phosphate buffer (pH 7.4) containing 20% glycerol (v/v). Microsomal samples were stored at −80°C until analysis.
Analytical Procedures
Total Protein
In the mechanistic studies, the concentration of protein in hepatic microsomes was determined by ultraviolet and visible absorption (UV/VIS) spectroscopy using a Bio-Rad DC Protein Assay based on the Lowry et al. (1951) method as reported by Peterson (1979). In general toxicity studies, the microsomal protein concentration was determined using the bicinchoninic acid protein assay purchased from Uptima (ref. UP40840A). Briefly, 2 ml of each solution of the bicinchoninic acid assay (solution A + solution B; 50:1 v:v) were added to 0.1 ml of each microsomal sample previously diluted 1/10 in phosphate buffer (pH 7.4) and incubated at 37°C for 30 min. Absorbance at 562 nm was then measured and protein concentration determined according to the standard curve established using bovine serum albumin.
Total Cytochrome P450 Content
In the mechanistic studies, the total cytochrome P450 content of the microsomes was determined spectrophotometrically using an assay procedure adapted from the dithionite difference method of Matsubara et al. (1976). In general toxicity studies (2-week rat and 2-week dog), the concentration of cytochrome P450 was determined spectrophotometrically according to Omura and Sato (1964).
In the mechanistic 3-month dog study, microsomal EROD, CYP1A activity was determined by quantitating resorufin formation with a 96-well spectrofluorimeter; microsomal PROD, CYP2B activity was determined by quantitating resorufin formation by high-performance liquid chromatography (HPLC) with fluorescence detection based on modifications of the method of Plopper et al. (1993); and microsomal 16α–OH, CYP2B/2C and 6β–OH, CYP3A activities were determined using a method that was based on modifications of the method of Sonderfan et al. (1987). This method involved the use of HPLC with radiometric detection to separate the metabolites of [14C]-testosterone.
In the 2-week dog general toxicity study, cytochromes P450 1A, 2B11, 2C21, and 3A12 were evaluated by immunodetection using rabbit monoclonal antidog cytochrome P450 antibodies purchased from Gentest. Liver microsomes from untreated male dogs were purchased from Gentest and used as a positive control. In the 2-week rat general toxicity study, cytochromes P450 1A1/2, 2B1/2, 2C11, 2E1, and 3A1 were evaluated by immunodetection using mouse monoclonal antirat cytochrome P450 antibodies purchased from Oxford Biomedical Research. Liver microsomes from untreated male and female rats and from males treated with phenobarbital (cytochrome P450 2B1/2, 3A1/2 inducer), pyridine (cytochrome P450 2E1 inducer), dexamethasone (cytochrome P450 3A1 inducer), or 3-methylcholanthrene (cytochrome P450 1A1/2 inducer) were purchased from Oxford Biomedical research and used as positive controls. In both the 2-week dog and 2-week rat general toxicity studies, protein electrophoresis was performed with a Mini Protean electrophoresis apparatus (Biorad). Briefly, 5 μg of denatured microsomal samples (2 animals of each group, microsome controls, and molecular weight marker) were loaded on a 12% polyacrylamide resolving gel and blotted onto a Hybond enhanced chemiluminescence (ECL) membrane (Amersham Pharmacia Biotech). After an overnight incubation in casein blocking buffer (Biorad), membranes were washed with Tris Borate Sodium-Tween 20 0.1% buffer and incubated with the primary antibodies for 1 hr. Further washing was performed before 1-hr incubation with donkey antirabbit immunoglobulin horseradish peroxidase linked secondary antibody in the dog samples and with sheep antimouse immunoglobulin horseradish peroxidase linked secondary antibody in the rat samples. Membranes were then washed with tris borate sodium-Tween 20 0.1% buffer and cytochrome P450 content was detected using ECL and Hyperfilm ECL (Amersham Pharmacia Biotech), allowing semiquantitative assessment of isoform content.
In the 3-month rat general toxicity study, CYP2B and CYP3A protein expression was evaluated by immunohistochemistry (IHC) on sections of liver collected at necropsy. Briefly, CYP3A staining was performed using a 1:3,000 dilution of rabbit antirat CYP3A polyclonal antibody PA1-343 (Thermo Scientific) incubated for 60 min followed by detection with the OmniMap rabbit HRP kit. CYP2B staining was performed using a 1:2,000 dilution of the rabbit antirat CYP2B polyclonal antibody Ab1283 (Millipore) incubated for 60 min followed by detection with a biotinylated goat antirabbit secondary antibody (Vector) and the Elite ABC kit (Vector). Both stains were performed using the Ventana Discovery XT automated staining system. Liver from a phenobarbital-exposed rat served as a positive control and a universal rabbit negative control serum (DAKO) was used for the negative control. All IHC stained slides were counterstained with hematoxylin and evaluated by light microscopy.
UDPGT Activity
Microsomal 4-methylumbelliferone (4-MU) glucuronosyltransferase activity was determined by monitoring the rate of 4-MU disappearance with a 96-well spectrofluorimeter, based on modification of the methods of Ullrich and Bock (1984) and Collier et al. (2000).
T4 Analysis—Mechanistic Studies Only
125I-T4 at a target volume of 2 ml/kg, or 10 µCi/kg was administered intravenously to mice in groups 2 and 4 on day 183, to rats in groups 6 and 7 on day 15, and to dogs in groups 2 and 4 on day 92 (Table 2). The 125I-T4 had a specific activity of approximately 1,250 µCi/µg (Perkin Elmer; Lot AU62080 for mouse study; GE Healthcare, Lot No. 0744 for rat study; Perkin Elmer, Lot AU32180 for dog study). In all three species, the volume of radiolabeled dose formulation administered to each animal was calculated based on the body weight taken on the day of radiolabeled dose administration. The intravenous dose was administered into a tail vein in mice and rats and the cephalic vein in dogs via a syringe and needle. After the dose was administered, but before the needle was removed from the animal, a gauze pad was placed over the injection site and slight pressure was applied as the needle was removed. The gauze pad was saved for radioanalysis. In mice, following the radiolabeled dose on day 183, blood samples were collected via cardiac puncture under isoflurane anesthesia at 0.03-, 0.5-, 1-, 2-, 3-, 6-, 24-, and 48-hr postdose. In rats (day 15) and dogs (day 92) following administration of the radiolabeled dose, blood samples were collected via the jugular vein at 0.05-, 0.5-, 1-, 2-, 3-, 6, 24-, and 48-hr postdose. In all species, blood samples were collected in tubes containing lithium heparin anticoagulant and placed in a chilled Kryorack until aliquoted and centrifuged to obtain plasma. After blood collection, all animals were euthanized without further evaluation. Each sample was homogenized before radioanalysis. Bovine serum albumin (1%) was added to each sample, followed by cold 50% trichloroacetic acid (TCA). Samples were mixed gently after each addition, then maintained on wet ice or stored at 4°C for 30 min. Cold 10% TCA was added and samples were centrifuged at 16,000 g at 4°C for 5 min. In all three species, the supernatants and pellets were analyzed for radioactivity by solid scintillation counting (SSC) in a Perkin Elmer Wallac 1480 WizardTM 3 automatic gamma counter for at least 5 min or until 1,000,000 counts accumulated. Radioanalysis data were generated by Debra, Version 5.6.2.60 (LabLogic Systems Ltd., Sheffield, UK).
Electron Microscopy
In 2-week rat, 2-week dog, and 1-month dog general toxicity studies, electron microscopy was performed on samples of liver collected at necropsy. These samples were fixed immediately in MacDowell fixative (1% glutaraldehyde + 4% paraformaldehyde in 0.1 M phosphate Millonig buffer at pH 7.2), for a minimum of 2 hr and washed in phosphate Sörensen buffer (0.15 M, pH 7.2–7.4) with 0.2% sodium chloride. The tissues were then postfixed in 2% osmium tetroxide, then washed, dehydrated, and embedded in epoxy resin using standard techniques. One-micron semithin sections were cut from control and high-dose animals of both sexes, stained with toluidine blue, and observed by light microscopy. Subsequently, ultrathin sections were cut on an Ultracut E Reichert microtome and stained with uranyl acetate and lead citrate. Observations were made using a JEOL EX II electron microscope, and micrographs were taken with Kodak sheet films.
Data Analyses
Values were compiled using Microsoft Excel Version 11.0. Organ weight data, thyroid hormone levels, cytochrome P450 levels and activity, and UDPGT levels were analyzed for homogeneity of variance using Levene’s (1960) test (Draper and Hunter 1969). One-way analysis of variance (Winer 1971) and Fisher’s least significant difference t-test (Miller 1980) were used for control versus treatment group mean comparisons. TSH, T4, T3, and thyroid organ weight data from the mechanistic studies were evaluated using a 2-sample t-test. T4 elimination data were analyzed using a 2-sample t-test on log-transformed data comparing treated to control values at each time point, and separately for each sex. T4 clearance (ml/hr/kg) was calculated by noncompartmental analysis using Pheonix WinNonlin (6.3.0.395). Individual clearance values were calculated using AUC 0-infinity values for dogs and rats and statistical analysis was performed using a 2-sample t-test. In mice, data were pooled and an average clearance calculated for each treatment group using AUC 0-t. No statistical analysis was done for the mouse data. Statistical significance was set at p ≤ .05 unless otherwise indicated.
Results
Data is summarized in Tables 1, 3 through 6.
Mouse
General Toxicity Studies (Tables 1 and 3)
In the 1-week study in mice, there were increases in absolute and/or relative liver weights at all doses (up to a 22% increase absolute weight in females at 750 mg/kg/day), which was associated with minimal to moderate centrilobular hepatocyte hypertrophy at ≥300 mg/kg/day. Thyroid gland was not weighed but was evaluated microscopically and did not reveal any test article–related alterations.
In the 1-month study, increases in absolute and relative liver weights were noted along with grossly enlarged livers at necropsy and centrilobular hepatocyte hypertrophy at ≥50 mg/kg/day in males and ≥150 mg/kg/day in females. Thyroid gland was not weighed but was evaluated microscopically and did not reveal any test article–related alterations.
In the 6-month general toxicity study, there were dose-related increases in absolute and relative liver weights in both sexes and at all dose levels (relative to body weight increases up to 98% in males and 116% in females). These increases in liver weights corresponded with grossly enlarged livers at 700 mg/kg/day. In addition, liver masses were identified in several animals at 700 mg/kg/day. Microscopically, these masses were identified as hepatocellular adenomas, which were considered test article related but secondary to chronic enzyme induction. Altered hepatocellular foci were also identified in all dose groups in males but only at 700 mg/kg/day in females. Additional microscopic findings included centrilobular hepatocyte hypertrophy in both sexes at ≥200 mg/kg/day and minimal thyroid follicular cell hypertrophy at 700 mg/kg/day in males and females.
Mechanistic Study
The 6-month mechanistic mouse study was conducted to better characterize lersivirine-related changes in liver and thyroid gland. Statistically significant (p ≤ .05) increases in absolute and relative thyroid gland weight (up to 35% relative to body weight; Table 4) and liver weight (up to 98% relative to body weight—data not shown) were noted as expected based on previous studies. At necropsy, liver masses were identified and enlarged thyroid glands were noted. The liver masses were confirmed to be hepatocellular adenomas microscopically and were considered test article related. The liver and thyroid weight increases correlated microscopically with mild to moderate hepatocellular hypertrophy (Figure 1A) and minimal thyroid follicular cell hypertrophy (Figure 1B), respectively. Increases (as compared to controls) in overall liver protein yield were noted in both sexes (1.1× in males and 1.4× in females—not statistically significant in males) as were increases in total P450 content (2.1× in males and 2.8× in females) and UDPGT activity (1.2× in males and 1.1× in females—not statistically significant in females; Table 5). T4 elimination was accelerated in both sexes as measured by disappearance of intravenously administered 125I-thyroxine (Figure 2A and B). Statistically significant (p ≤ .05) decreases in 125I-thyroxine-derived radioactivity were noted between the 0.5-hr and 6-hr time points in males and between the 0.5-hr and 3-hr time points in females. The overall mean T4 clearance (ml/h/kg) was also increased in lersivirine-treated males and females as compared to their respective control groups (Table 6). In addition, minimal increases in TSH (1.2×) were noted in both sexes (only statistically significant [p ≤ .05] in males; Figure 3E and F) correlating with the microscopic finding of thyroid follicular cell hypertrophy. Total T3 was slightly elevated (1.2×) in both sexes (Figure 3C and D) although there were no test article–related decreases in total T4 levels (Figure 3A and B) suggesting that after 6 months of treatment the HPT axis had adequately compensated for the treatment-related increases in thyroid hormone clearance.
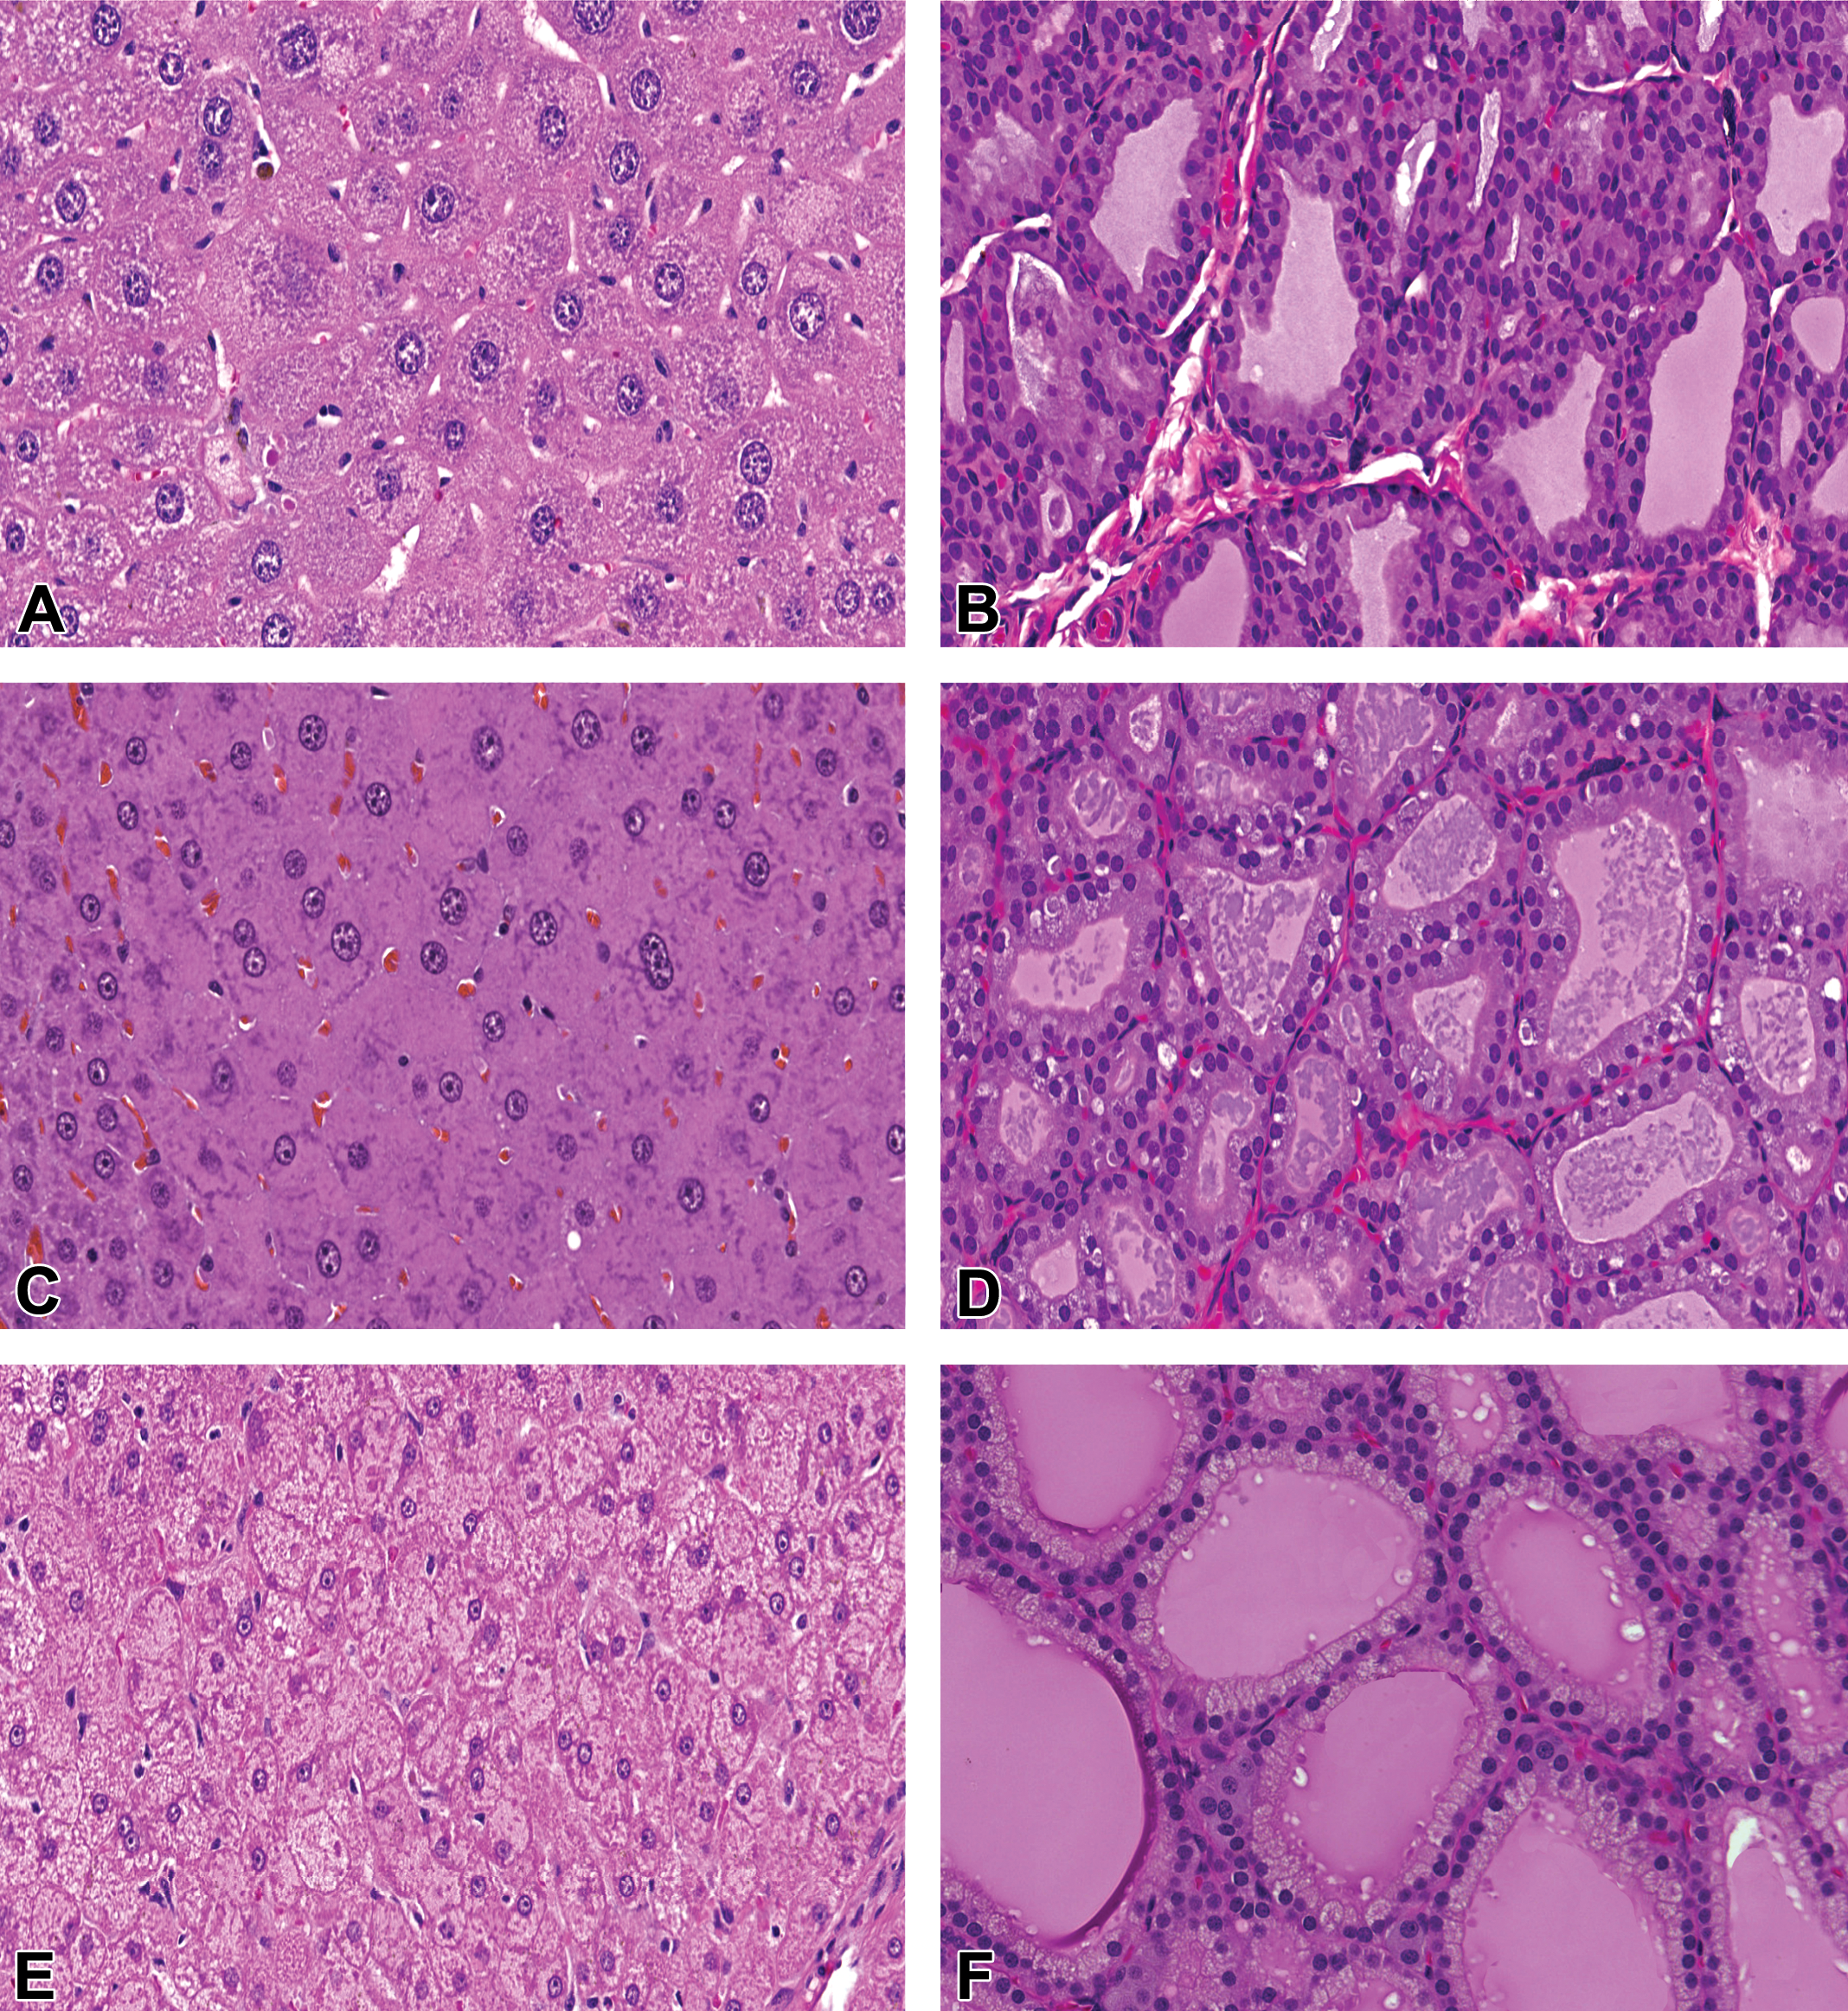
Liver (A, C, E) and thyroid gland (B, D, F) from lersivirine-treated mice from a 6-month mechanistic study (A, B); rats from a 3-month general toxicity study (C, D); and dogs from a 3-month mechanistic study (E, F) illustrating hepatocellular hypertrophy and thyroid follicular cell hypertrophy in each species. Hematoxylin and eosin (H&E) stain, 200× magnification for all figures.
I125 thyroxine elimination in male and female mice (A, B), rats (C, D) and dogs (E, F) treated with lersivirine for 6 months (mice), 2 weeks (rats), or 3 months (dogs).
Total T4 (A, B), Total T3 (C, D), and TSH (E, F) levels in male (n = 19–20/group; A, C, E) and female (n = 17–18/group; B, D, F) mice treated with lersivirine for 6 months. Control = dark, Treated = light. *p ≤ .05.
Thyroid organ weight changes—mechanistic studies.
a M ± SD. b17–20 mice/sex/group. c14 rats/sex/group. d4 dogs/sex/group. eThyroid follicular cell hypertrophy noted microscopically in both sexes.
*p ≤ .05 as compared to respective control group.
Liver protein yield, total cytochrome P450 content, and UDPGT activity—mechanistic studies.
Note: UDPGT = uridine-diphosphoglucuronosyltransferase.
a M ± SD. b17–20 mice/sex/group. c7 rats/sex/group. d4 dogs/sex/group. eDose associated with increased liver weights. fOverall increases associated with CYP3A isoform; notable decreases in CYP1A isoform also noted.
*p ≤ .05 as compared to respective control group.
Plasma clearance of 125I thyroxine in animals treated with lersivirine—mechanistic studies.
Note: — = Statistics were not performed on mouse data.
a M ± SD. bMouse samples were pooled for analysis—mean data from each group were used to calculate the clearance based on AUC (0 − t; 0–48 hr).
*p ≤ .05 as compared to respective control group.
Rat
General Toxicity Studies (Tables 1 and 3)
In the 1-week study, there were increases in absolute and relative liver weights at all doses (up to 134% relative to body weight) that correlated with grossly enlarged livers and microscopically with centrilobular hepatocyte hypertrophy. The thyroid gland was not evaluated in this 1-week study.
In the 2-week study, increases in absolute and relative liver weights were noted at ≥70 mg/kg/day (up to 49% relative to body weight in males at 300 mg/kg/day) and increases in absolute and relative thyroid gland weights occurred in males at ≥70 mg/kg/day and in females at 300 mg/kg/day (up to 65% relative to body weight in 300 mg/kg/day males). These changes in organ weights correlated with centrilobular hepatocyte hypertrophy at 300 mg/kg/day in females and at all doses in males and with minimal to moderate thyroid follicular cell hypertrophy in males at ≥70 mg/kg/day and in females at 300 mg/kg/day. Ultrastructural evaluation of the liver from animals at 300 mg/kg/day revealed proliferation of smooth endoplasmic reticulum in hepatocytes. Hepatic microsomal cytochrome P450 content was increased (as compared to controls) at all doses in males and at 300 mg/kg/day in females (up to 1.7× in 300 mg/kg/day males). This correlated with increases in isoforms 3A1 and 2B1/2. Decreases in hepatic cytochrome P450 1A1/2 were noted in both sexes although cytochrome P450s 2E1 and 2C11 remained unchanged.
The 3-month general toxicity rat study was conducted as a dose-range finder for a carcinogenicity study. In an effort to improve tolerability, all 3 treated groups were given lersivirine at 500 mg/kg/day for the first week (allowing time for autoinduction to occur) after which the mid- and high-dose groups were increased to the intended dose levels of 1,000 and 2,000 mg/kg/day, respectively. On day 13, poor toleration in the high-dose males necessitated lowering the dose in this group to 500 mg/kg/day for 7 days with a subsequent increase to 1,500 mg/kg/day thereafter. High-dose females continued receiving 2,000 mg/kg/day. Findings in the liver included increased absolute and relative liver weights in animals given ≥500 mg/kg/day, which correlated with macroscopically enlarged livers at necropsy and centrilobular hepatocellular hypertrophy at the microscopic level (Figure 1C). Immunohistochemical analysis of CYP3A and CYP2B in the liver revealed a test article–related increase in protein expression in treated males and females as compared to representative controls. Thyroid weights were not evaluated although thyroid follicular cell hypertrophy was noted microscopically at all dose levels (Figure 1D).
Mechanistic Study
The 2-week rat mechanistic study at 300 mg/kg/day resulted in statistically significant (p ≤ .05) increases (as compared to controls) in hepatic protein yield (1.1–1.2×), total P450 content (1.7–2.0×), and UDPGT activity (1.6–1.8×) in both sexes (Table 5). Thyroid hormonal evaluation revealed several statistically significant (p ≤ .05) differences between control and treated groups including moderately to markedly higher TSH (up to 6.4×; Figure 4E and F) and mildly higher T3 (up to 1.3×; only statistically significant [p ≤ .05] in males; Figure 4C). In males, group mean T4 concentration was slightly lower in the lersivirine-treated group although the differences were small and not statistically significant (Figure 4A). T4 elimination was accelerated in both sexes as measured by intravenously administered 125I-thyroxine (Figure 2C and D). Statistically significant (p ≤ .05) decreases in 125I-thyroxine-derived radioactivity were noted between the 0.5-hr and 48-hr time points in males and females. The overall mean T4 clearance (ml/h/kg) was also significantly increased in lersivirine-treated males and females as compared to their respective control groups (Table 6).
Total T4 (A, B), Total T3 (C, D), and TSH (E, F) levels in male (A, C, E) and female (B, D, F) rats (n = 14/sex/group) treated with lersivirine for 2 weeks. Control = dark, Treated = light. *p ≤ .05.
Dog
General Toxicity Studies (Tables 1 and 3)
In the 1-week study, lersivirine-induced hepatocellular hypertrophy at ≥50 mg/kg/day in males with associated liver weight increases up to 43% relative to controls. Females also had increased liver weights but lacked a microscopic correlate. The thyroid gland was not evaluated in this 1-week study.
In the 2-week study, lersivirine induced marked increases in absolute and relative liver weights in both sexes with up to a 70% increase in relative liver weight in males at 150 mg/kg/day. Marked enlargement of the liver was noted at necropsy in some of the animals at 150 mg/kg/day. These liver weight changes correlated with moderate to marked centrilobular hepatocellular hypertrophy in all dogs dosed with ≥50 mg/kg/day. Ultrastructural evaluation of the liver revealed proliferation of smooth endoplasmic reticulum in hepatocytes. Test article–related increases in total cytochrome P450 content were observed at all doses (up to 95% in males relative to controls) including specific increases in isoforms 2B11 and 3A12 in both male and female dogs at ≥50 mg/kg/day. Additionally, decreases in isoforms 1A and 2C21 were noted in both sexes at ≥50 mg/kg/day. Thyroid gland was microscopically normal.
In the 1-month study, there were absolute and relative (to brain and body weight) liver weight increases at both dose levels (10 and 50 mg/kg) with up to an 84% increase in relative (to body weight) liver weight in males at 50 mg/kg/day. These increases in liver weight correlated with macroscopically enlarged livers in all males given 50 mg/kg/day and with centrilobular hepatocellular hypertrophy of minimal to moderate severity at ≥10 mg/kg/day. Smooth endoplasmic reticulum proliferation in hepatocytes was confirmed as an ultrastructural correlate. Minimal thyroid follicular cell hypertrophy was noted microscopically in both sexes at 50 mg/kg/day.
In the 3-month study, the top dose of 60 mg/kg/day was reduced to 40 mg/kg/day after 2 weeks due to poor toleration. There were increases in absolute and relative liver weight at ≥20 mg/kg/day with absolute and relative group mean values ranging from 68 to 95% greater than controls. Grossly enlarged livers were noted at necropsy in the 60 → 40 mg/kg/day dose group. Microscopically, these changes correlated with minimal to mild centrilobular hepatocyte hypertrophy at ≥20 mg/kg/day with a dose-related increase in incidence and severity. Minimal thyroid follicular cell hypertrophy was noted at ≥20 mg/kg/day.
In the 9-month study, there were increased absolute and relative liver weights at all treated dose levels with mean absolute values increased up to 96% over controls. These changes correlated microscopically with centrilobular to panlobular hepatocellular hypertrophy of minimal to marked severity. Thyroid follicular cell hypertrophy of minimal to mild severity was noted at 45 mg/kg/day although no alterations in thyroid hormone levels (total T3, total T4, TSH) were noted at any time points (days 37, 87, 177, or 269; Table 3).
Mechanistic Study
The 3-month mechanistic dog study was conducted at 40 mg/kg/day to investigate the link between hepatic enzyme induction and thyroid follicular cell hypertrophy. Test article–related increases in mean absolute and relative liver (>50% in males and >60% in females—data not shown) and thyroid weights (Table 4) were identified in both sexes although in the thyroid gland only the relative to body weight increases in females were statistically significant (p ≤ .05). The increased liver weights correlated microscopically with diffuse minimal to mild hepatocellular hypertrophy (Figure 1E) and the increases in thyroid weights microscopically corresponded with multifocal to coalescing minimal thyroid follicular cell hypertrophy (Figure 1F). Levels of TSH, T3, and T4 measured on days 8, 22, and 92 revealed statistically significant (p ≤ .05) increases in TSH levels on day 22 in males (Figure 5E) and day 92 in females (Figure 5F) and statistically significant (p ≤ .05) decreases in T4 in females on day 8 (Figure 5B). A slight increase in T4 was noted on day 22 in males (Figure 5A) although there were no effects noted with T3 in either sex (Figure 5C and D). Hepatic enzyme analysis in this study revealed statistically significant (p ≤ .05) increases (as compared to controls) in microsomal protein yield (1.4–1.5×), total P450 content (2.1–2.4×), CYP3A activity (testosterone 6β-hydroxylase activity; 1.8–2.2×), and UDPGT activity (1.2–1.3×) in males and females (Table 5). Notable decreases in EROD, CYP1A activity, a marker for CYP1A activity in dogs, were observed in males and females (0.6×) compared with control animals. No overall change in PROD, CYP2B activity, a marker for CYP2B activity in dogs, was observed (data not shown). Slight, but not statistically significant, decreases in testosterone 16α-hydroxylase activity, a marker for CYP2B/2C activity in dogs, were observed in males and females (0.8× and 0.7×, respectively) compared with control animals (data not shown). T4 elimination was accelerated in both sexes as measured by intravenously administered 125I-thyroxine (Figure 2E and F). Statistically significant (p ≤ .05) decreases in 125I-thyroxine-derived radioactivity were noted between the 0.5-hr and 24-hr time points in males and between the 6-hr and 48-hr time points in females. The overall mean T4 clearance (ml/h/kg) was also significantly (p ≤ .05) increased in lersivirine-treated males and females as compared to their respective control groups (Table 6). Taken together, these findings indicate that in dogs, lersivirine administration at 40 mg/kg/day for 3 months resulted in liver hypertrophy and induction of hepatic microsomal enzymes with slight increases in T4 clearance; however, these changes had only minimal effects on the thyroid gland (minimal follicular cell hypertrophy) and the HPT axis and, therefore, did not result in dramatic changes in serum thyroid hormone levels that included only minimal transient increases in TSH in both sexes and slight transient decreases in T4 in females.
Total T4 (A, B), Total T3 (C, D), and TSH (E, F) levels in male (A, C, E) and female (B, D, F) dogs (n = 8/sex/group/time point) treated with lersivirine for 3 months. Time points include 2 predose times (day 12 and day 7) and 3 time points during the dosing phase (day 8, day 22, and day 92). Control = dark, Treated = light. *p ≤ .05.
Discussion
There are a number of species-specific differences with regard to thyroid hormone physiology. In fact, the known differences between normal rodent and human thyroid physiology are significant enough that certain xenobiotic-induced thyroid gland effects are often not considered to be of human health concern (McClain 1995). It is known that the plasma half-life of T4 in rats is nearly 10-fold shorter than in humans (Capen 2008) and this is in large part due to the considerable differences in thyroid hormone transport proteins between these species (Dohler, Wong, and Von Zur Muhlen 1979). In humans, circulating T4 is carried primarily by thyroxine-binding globulin (TBG), an avid T4-binding protein, whereas rats utilize proteins such as albumin and prealbumin (transthyretin), which are much less avid T4 binders. In humans, TBG serves as a stable reserve of T4 that may be used when additional amounts of thyroid hormone are required; however, without this high-affinity carrier, rats have little reserve capacity of circulating thyroid hormone (Lewandowski, Seeley, and Beck 2004). The overall effect is that humans are better equipped to compensate for sudden changes in thyroid hormone balance as compared to rodents. In contrast to the rat, dogs have a high-affinity thyroid hormone–binding protein comparable to TBG in humans (Larsson, Pettersson, and Carlström 1985). However, despite the presence of a TBG-like protein (canine TBG) in the dog, there are still considerable differences between dog and human thyroid hormone physiology. One notable difference is that the thyroid hormone turnover rate in the dog is rapid and is more in line with that of rodents despite the presence of canine TBG. The difference between dog and human thyroid hormone turnover is due to several species differences including canine TBG concentrations that are only 15% of those observed in humans (Daminet and Ferguson 2003; Ferguson and Hoenig 2003). In addition, the T4-binding affinity of canine TBG is 4-fold less than human TBG (Kaptein, Hays, and Ferguson 1994). Another major difference between the human and dog is the plasma half-life of canine T4, which is estimated to be between 8 and 16 hr as compared to about 5 to 9 days in humans (Daminet and Ferguson 2003). In this regard, dogs are more similar to rats (T4 half-life ∼12–24 hr) than humans (Capen 2008; Lewandowski, Seeley, and Beck 2004). Similarly, the serum clearance rate of T4 is estimated to be approximately 14-fold more rapid in dogs as compared to humans, and dogs also have a 6-fold higher T4 degradation rate (normalized by body weight) as compared to humans (Kaptein, Hays, and Ferguson 1994). All of these differences in thyroid hormone homeostasis are reflected in the serum levels of total T4 which are lower in the dog (1.5–3.6 µg/100 ml) than in humans (7.2 µg/100 ml; Lewandowski, Seeley, and Beck 2004). Overall, these canine–human differences in thyroid hormone homeostasis show that the canine is much less efficient in thyroid hormone utilization as compared to humans and even though serum T4 levels are considerably lower in dogs their production rate of T4 (and T3) is more than twice that of humans (Daminet and Ferguson 2003; Haschek, Rousseaux, and Wallig 2010).
Despite the documented species differences in thyroid hormone physiology, all species attempt to maintain circulating thyroid hormone levels within a set physiologic range. Although the ranges vary between species, the negative feedback system designed to maintain values within these physiologic limits is remarkably similar between species. All species will respond to decreased circulating thyroid hormone levels by increasing TSH thus stimulating increased thyroid hormone production and secretion from the thyroid gland. Over time, this results in the morphologic change of thyroid follicular cell hypertrophy. Species differences in this system may not become apparent until challenged, at which point it becomes possible to identify differences in the magnitude and speed of the response to maintain homeostasis. In this regard, the rat requires a greater response and higher production of thyroid hormone to maintain normal circulating levels within its physiologic range, as evidenced by its high basal TSH level, which is from 6- to 60-fold higher than humans (Feldman and Nelson 2004; Hill et al. 1989; Lewandowski, Seeley, and Beck 2004). Although dogs also have higher T4 turnover rates as compared to humans, they do not need higher baseline TSH levels simply because their baseline range for T4 is also much lower. However, the fact that the T4 turnover rate is higher in dogs as compared to humans suggests that they need to respond more vigorously to any type of perturbation in thyroid hormone balance such as what might occur following pharmacologic alteration of the HPT axis. In this regard, dogs likely fall between rats and humans in their ability to maintain hormonal balance.
Canine thyroid hormone homeostasis can be affected by a large number of different drugs representing a wide range of pharmacologic classes including glucocorticoids, sulfonamides, salicylates, phenytoin, furosemide, clomipramine, and phenobarbital (Chastain and Panciera 1995; Coles 1986; Feldman and Nelson 2004; Stockham and Scott 2002). Additionally, thyroid follicular cell hypertrophy has been reported to occur in dogs following exposure to xenobiotics (Gresham 1987). Although the mechanisms are variable, these examples demonstrate that drug-induced alteration of thyroid hormone homeostasis is not just a rodent-specific phenomenon. Phenobarbital is a well-known hepatic enzyme inducer that has been used clinically in dogs and humans for years. In rodents, chronic phenobarbital exposure results in thyroid follicular cell hypertrophy, hyperplasia, and neoplasia because of accelerated thyroid hormone metabolism due to hepatic UDPGT enzyme induction. In dogs, phenobarbital also causes alteration in thyroid hormone levels and, like rats, the mechanism is thought to be related to increased hepatic T4 clearance secondary to enzyme induction (Gaskill et al. 2000; Gieger 2000). This mechanism is similar to what we conclude occurs with lersivirine.
It should be noted that only small increases in serum TSH are needed to stimulate a morphologic effect in thyroid follicular cells (Hood et al. 1999). In addition, all species will adapt to thyroid hormone alterations over time by setting a new equilibrium with T4 and TSH levels returning close to or within the normal range even with continued treatment (Oppenheimer, Bernstein, and Surks 1968). Thyroid weights, however, may remain elevated throughout the treatment period (Capen 2008) suggesting that the morphologic changes indicative of increased activity in the thyroid gland (follicular cell hypertrophy) may remain even in the absence of an obvious imbalance in circulating hormones. Whereas rats with continued phenobarbital exposure go on to develop neoplastic lesions in the thyroid gland, the same does not occur in humans (Capen 2008; Curran and DeGroot 1991; McClain 1986). It is important to emphasize that the progression to neoplastic thyroid lesions is represented by a morphologic continuum from hypertrophy to hyperplasia to adenoma and eventually carcinoma. Notably, chronic (up to 9 months) high exposure to lersivirine in the dog only resulted in minimal to mild multifocal thyroid follicular cell hypertrophy (indicative of increased activity) without hyperplasia or other pathologic findings such as atrophy, degeneration, or inflammation. Nonetheless, the minimal follicular cell thyroid hypertrophy noted in these dogs is indicative of increased TSH exposure (Michaelson 1970; Turner 1966), only it is clear from our data that these increases are limited to a level where treatment effects are minimally apparent (only 1 time point per sex was minimally impacted), likely due to the wide individual animal variability noted with this parameter. Considering the minimal degree and lack of progression, this effect on the thyroid gland is not considered an adverse change but is instead thought to be an adaptive response necessary to maintain thyroid hormone levels within normal limits. Although we believe that the data generated by the mechanistic studies in the mouse, rat, and dog, as well as the literature-based evidence described herein, strongly support our conclusion that the mechanism leading to this identical thyroid change in all 3 species is the same, we cannot completely rule out the possibility of additional mechanisms being involved. For example, the data here indicate that mice exhibit more dramatic T4 clearance rates than dogs or rats; yet, they have similar or even slightly lower levels of UDPGT induction. This discrepancy could in part be artificial and more a reflection of the relatively nonspecific method used to measure overall UDPGT activity (using 4-MU) as opposed to a more specific method focused on specific UDPGT isoforms involved in T3 and T4 glucuronidation; however, the possibility of another mechanism being involved cannot be completely ruled out. Cross-species comparisons of data from the studies reported here is challenging, given the differences in lersivirine dose and study duration and is further complicated by other potentially confounding factors such as species differences in lersivirine pharmacokinetics or thyroid hormone physiology. As a result, additional investigative studies would be required to sort out many of these questions. Regardless, the result of any mechanism leading to this morphologic change in the thyroid gland (follicular cell hypertrophy), whether direct or indirect and regardless of the species involved, is increased circulating TSH levels (Tucker 1998). Not only is this a monitorable change in the clinic, it is also thought to be of limited clinical significance relative to thyroid carcinogenesis in humans (Curran and DeGroot 1991; Doniach 1970; McClain et al. 1989; McClain 1995). In fact, compounds in the same class as lersivirine (nonnucleoside reverse transcriptase inhibitor [NNRTI]) are being utilized in the treatment of thyroid tumors in humans because of their positive effects on restoring thyroid function and differentiation (Modoni et al. 2007).
In addition, other NNRTIs possess similar tendencies to promote hepatic enzyme induction in nonclinical species, and like lersivirine, some of these cause hypertrophic effects on the thyroid gland. This has been observed most notably in rodents; for example, etravirine (US FDA 2007) and efavirenz (US FDA 1998) induced hepatic enzymes and produced noteworthy effects in the livers and thyroids of rats, and rilpivirine (US FDA 2011) produced both a diffuse follicular hypertrophy in the thyroid gland in both male and female rats and hepatocellular adenomas and combined adenomas/carcinomas in mice. However, the thyroid effect has been noted in nonrodent species as well; efavirenz (US FDA 1998) produced thyroid follicular hypertrophy attributed to hepatic enzyme induction in both male and female cynomolgus monkeys. Altogether, these findings suggest that hepatic and thyroid effects due to enzyme induction are common across the NNRTI class and are not specific to lersivirine.
Overall, the weight of evidence supports the conclusion that the minimal thyroid follicular cell hypertrophy noted in lersivirine treated dogs was a secondary effect related to microsomal enzyme induction in the liver. Although we have demonstrated that lersivirine induces a number of different cytochrome P450 enzymes, induction of the UDPGT enzyme activity is the primary driving influence behind the secondary thyroid gland effects noted in all 3 species. The morphological changes in the thyroid gland (follicular cell hypertrophy) as well as the treatment-related increases in T4 clearance were comparable between species. Effects on the canine HPT axis may be blunted as compared to those noted in mice although that is to be expected based on the known differences in thyroid hormone physiology between these species. Although these species differences suggest that dogs are likely more resistant to such a mechanism as compared to rodents, the evidence reported here also indicates that dogs would likely be more susceptible than humans and would not be expected to be immune to such a mechanism. Most importantly, this adaptive response in the dog thyroid gland was generally minimal, exhibited no evidence of progression even after long-term dosing, and is not thought to represent a significant human health risk given the fact that humans are relatively resistant to such effects on the HPT axis.
Footnotes
The author(s) declared no potential conflicts of interest with respect to the research, authorship, and/or publication of this article.
The author(s) received no financial support for the research, authorship, and/or publication of this article.
Acknowledgment
The authors wish to thank all the technical staff for their excellent support that was critical for the successful execution of the studies reported herein.