
Abstract
In this study, male F344 rats were orally exposed to a single dose of aflatoxin B1 (AFB1) at 0, 50, 250, or 1,000 µg/kg body weight (BW) or repeated dose of 0, 5, 10, 25, or 75 µg/kg BW for up to 5 weeks. Biochemical and histological changes were assessed together with the formation of AFB1-lysine adduct (AFB-Lys) and liver foci positive for placental form glutathione S transferase (GST-P+). In single-dose protocol, serum aspartate transaminase (AST), alanine transaminase (ALT), and alkaline phosphatase (ALP) showed dose-related elevation, with maximal changes observed (>100-fold) at day 3 after treatment. Animals that received 250 µg/kg AFB1 showed concurrent bile duct proliferation, necrosis, and GST-P+ hepatocytes at 3 day, followed by liver GST-P+ foci appearance at 1 week. In repeated-dose protocol, bile duct proliferation and liver GST-P+ foci co-occurred after 3-week exposure to 75 µg/kg AFB1, followed by proliferation foci formation after 4 week and dramatic ALT, AST, and CK elevations after 5 weeks. Liver GST-P+ foci were induced temporally and in a dose-related manner. Serum AFB-Lys increased temporally at low doses (5–25 µg/kg), and reached the maximum after 2-week exposure at 75 µg/kg. This integrative study demonstrated that liver GST-P+ cells and foci are sensitive biomarkers for AFB1 toxic effect and correlated with bile duct proliferation and biochemical alterations in F344 rats.
Keywords
Introduction
Aflatoxins (AF) represent a major group of harmful mycotoxins commonly found as contaminants in grains and groundnuts. The contamination of foods by AF remains a significant public health problem worldwide, particularly in the developing world where AF exposure has been reported to be associated with approximately 40% of all disease burden (Williams et al. 2004). Acute AF poisoning (aflatoxicosis) of populations in Kenya during 2004 and 2005 resulted from the ingestion of heavily contaminated maize and maize products causing 125 deaths (Azziz-Baumgartner et al. 2005; Lewis et al. 2005). Recently, the adverse effects of AF on growth and development of children have become an increasing health concern for children predisposed to malnutrition (Khlangwiset, Shephard, and Wu 2011; Smith, Stoltzfus, and Prendergast 2012). One congener of AF, aflatoxin B1 (AFB1), is of particular importance in human health status. AFB1 is not only the most toxic but is also the most abundant of all the AF congeners.
The histopathological effects and biochemical changes induced by AFB1 exposure have been extensively studied in rats (Clifford and Rees 1967; Shank and Wogan 1966; Rastogi, Srivastava, and Rastogi 2001) and chicks (Chattopadhyay et al. 1985; Ostrowski-Meissner 1984). However, only a few studies (Yin, Kao, and Lee 1980; Dwivedi et al. 1993) reported the sequential biochemical and histological changes resulting from AFB1 exposure. In particular, no studies have been done to explore the correlations between biochemical and histopathological alterations with specific molecular targets via single- or repeated-treatment protocol using human relevant doses. Such data could be useful for delineation of functional and microstructural changes in liver and for evaluation of various intervention strategies to diminish the acute and chronic health effects due to AFB1 exposure.
AFB1 is metabolically activated by cytochrome P450 enzymes in liver to its reactive metabolite, AFB1-8,9-epoxide, which binds to macromolecules resulting in DNA adduct formation and carcinogenesis (Eaton and Groopman 1994). The AFB1-8,9-epoxide can further be converted to AFB1-8,9-diol that specifically binds to lysine in albumin and forms AFB1-lysine adducts (AFB-Lys), which has been validated as a biomarker of human exposure (Sabbioni et al. 1987). This adduct and other AFB1 biomarkers (e.g., AFB1-N 7-guanine adduct) have become critical tools for the evaluation of chemopreventive agents in animals and humans (Kensler et al. 2011).
Glutathione S transferases (GST) are a large family of metabolic enzymes comprised of several members, such as alpha, mu, pi, theta, and others (Ito et al. 1992). GST in the alpha and pi classes is abundant in rat livers and inducible by exogenous drugs. Because of their putative role in detoxifying carcinogens, these 2 isoenzymes have been the molecular target for the development of chemoprevention strategies (Chow et al. 2007; Gross-Steinmeyer and Eaton 2012). The pi form of GST was initially found in preneoplastic hepatocytes; in rat it was named GST-placental form (GST-P) as this isoenzyme is the only form abundant in rat placenta (Ito et al. 1992). The presence of rat liver GST-P positive (GST-P+) foci is a specific and reliable preneoplastic marker that has been widely used in animal carcinogenesis models (Tatematsu et al. 1985; Sato 1989). AFB1 has been shown to induce GST-P+ foci in hepatocytes both independently and in combination with other toxins, such as fumonisin and microcystin LR (leucine; Arginine; Gelderblom et al. 2002; Sekijima et al. 1999; Tsuji et al. 1992). However, the sequential development of GST-P+ foci and biochemical and histological changes caused by AFB1 in animal models remain largely unknown.
In this study, we take an integrative approach to assess the toxic effects of AFB1 in F344 rats following both single- and repeated-treatment protocols. The aims of this study are to validate the time course of development for liver GST-P+ foci, to evaluate the potential correlations of this biomarker with other histological and biochemical changes caused by AFB1 exposure, and to provide toxicopathological information for future intervention studies.
Materials and Methods
Chemicals and Reagents
AFB1 (≥98% purity), normal rat serum, and dimethyl sulfoxide (DMSO) were purchased from Sigma-Aldrich Inc. (St. Louis, MO). AFB1 stock solution (25 mg/ml) was prepared in DMSO and diluted to appropriate treatment concentrations. Rabbit antiglutathione S transferase pi antibody was purchased from Abbiotec (San Diego, CA). Vectastain Elite ABC Kit and diaminobenzidine (DAB) substrate kit for peroxidase were purchased from Vector Laboratories (Burlingame, CA). All solvents were of the highest grade commercially available.
Animals
Male F344 rats (100–120 g) were purchased from Harlan Laboratory (Indianapolis, IN). Animals were individually housed under controlled light/dark cycle (12 hr/12 hr) with a temperature of 22 ± 2°C and relative humidity of 50–70%. Purified AIN 76A diet and tap water were provided ad libitum. Since AIN 76A diet is a highly purified diet routinely used for AF research, we did not test the diet for AFB1 in this study. Animals were maintained on AIN 76A feed for 1 week before treatment. Animal husbandry and care, AFB1 treatment, and biological sample processing were reviewed and approved by the Institutional Animal Care and Use Committee at the University of Georgia.
Experimental Design
For single-dose treatment, a total of 140 male F344 rats were randomly divided into 4 treatment groups and gavaged with 0, 50, 250, or 1,000 µg AFB1/kg BW. Animals (5 in each treatment group) were sacrificed at time points, 2 hr, 1, 3, 5, 7, 14, and 21 days after treatment. For repeated-dose treatment, a total of 125 male F344 rats were randomly divided into 5 treatment groups: 0, 5, 10, 25, and 75 µg AFB1/kg BW. Animals were gavaged 5 days per week for 5 weeks and 5 rats from each group were sacrificed at weekly intervals 24 hr after the last dose. Gavage volume was set at 50 µl/100 g BW. Blood and liver tissues were collected for examination of serum biochemistry, liver histology, and the GST-P+ foci formation. Animals were euthanized by cardiac puncture and exsanguination under isoflurane anesthesia.
Serum Biochemistry
Serum samples were collected following centrifugation of the whole blood at 3,000 rpm for 20 min at 4°C and then stored at −20°C before analysis for serum biochemistry. All analyses were done with a Roche Hitachi 912 Chemistry Analyzer (Roche Diagnostics, Indianapolis, IN). The serum parameters measured were total serum protein (g/dl), albumin (g/dl), globulin (g/dl), albumin:globulin ratio (A/G ratio), serum calcium (mg/dl), phosphorus (mg/dl), glucose (mg/dl), blood urea nitrogen (BUN, mg/dl), creatinine (mg/dl), total bilirubin (mg/dl), alkaline phosphatase (ALP, U/L), creatine kinase (CK, U/L), alanine transaminase (ALT, U/L), aspartate transaminase (AST, U/L), g-glutamyl transpeptidase (GGT, U/L), amylase (U/L), cholesterol (mg/dl), serum sodium (mmol/L), potassium (mmol/L), Na/K ratio, and chloride (mmol/L).
Serum AFB-Lys Adduct Analysis
The method for analysis of serum AFB-Lys has been described previously (Qian et al. 2010). Briefly, aliquots of each serum sample (150 µL) were digested with pronase (pronase:total protein, 1:4, w:w) at 37°C for 3 hr. The digests were purified with Waters MAX cartridges, which were preprimed with methanol and equilibrated with water. The loaded cartridge was sequentially washed with water, 70% methanol, and 1% ammonium hydroxide in methanol at a flow rate of 1 ml/min. The purified AFB-Lys adducts were eluted with 2% formic acid in methanol, dried in a Labconco Centrivap concentrator (Kansas City, MO), and reconstituted for high-performance liquid chromatography-fluorescence detection. The adduct concentrations were adjusted with total serum albumin content to account for variations in volume. The average recovery rate was 90% and detection limit was 0.4 pg/mg albumin.
Liver Histology
Liver tissue samples were taken from the right portion of the median lobe. Liver tissue blocks of approximately 6 × 6 × 1.5 mm3 were routinely fixed in 10% neutral buffer formalin, dehydrated, and embedded. Liver sections were cut at 5 µm and stained with hematoxylin and eosin for light microscopic examination. Photographs were taken on an Olympus XC30 microscope with an Olympus UC30 digital camera (Olympus America Inc., Center Valley, PA) linked to a Cellsense image analysis system (Cellsense Inc., Pittsburgh, PA).
Liver GST-P Staining
Liver paraffin sections prepared as above were used for GST-P staining by the avidin–biotin–peroxidase complex (ABC) method (Hsu, Raine, and Fanger 1981). Briefly, liver sections were routinely hydrated and antigen was retrieved by heat. Sections were sequentially treated with primary rabbit anti-GST-P antibody (1:800), secondary goat antirabbit IgG (1:200), and ABC. The staining was done by adding DAB. These sections were finally counterstained with hematoxylin for light microscopic examination. A GST-P+ focus was defined as a cluster of ≥5 hepatocytes positively stained with brown color. Areas of each section were measured and the counting of GST-P+ cells or foci was based on section area.
Statistical Analysis
Data on body weights (BWs), serum biochemical parameters, and AFB-Lys adducts were expressed as mean ± standard deviation (SD). Statistical comparisons of these parameters were conducted using one-way analysis of variance (ANOVA) followed by Tukey’s multiple comparison procedures. The raw data of BW were used for statistical analysis while the biochemical parameters were analyzed following logarithmic transformation because of their right skewed distribution and nonequal variance. Correlation analysis was done through SigmaPlot 10.0 (San Jose, CA). A p value of less than .05 was considered statistically significant.
Results
Body Weight Changes
Animals that received 1 dose of 1,000 µg/kg AFB1 showed decreased BWs starting from 1 day following treatment (p < .05), when compared to the controls (Figure 1A). For the single 250-µg/kg treatment group, animals showed significantly decreased BW gain at 3 and 5 days after treatment (p < .05). Animals in the 1,000 µg/kg group died within 7 days and the liver tissues were examined for histopathological changes; animals in all other treatment groups survived through the end of the study protocol. A dose-dependent decrease of BW gain was found for animals that received repeated-dose treatments; however, only the 75 µg/kg BW group was significantly different from the control group, starting as early as the second week (p < .05, Figure 1B
Effects of aflatoxin B1 (AFB1) on body weight gain after single-dose or repeated-dose treatment with AFB1. *p < .05, the highest dose group versus control group; #p < .05, the highest dose group versus 50 µg/kg group.
Serum Biochemistry after Single-dose Treatment
Dose-dependent increases of serum AST and ALT were found at 1 and 3 days after single-dose treatment, respectively. These enzymes were approximately 2- to 7-fold higher in the 250 µg/kg group and 20- to 100-fold higher in the 1,000 µg/kg group, as compared to the control group (p < .05, Table 1). AST and ALT levels were decreased after 1 week of treatment in the 50 and 250 µg/kg groups (p < .05). While ALT returned to normal levels after 3 weeks, the AST levels remained low in these 2 treatment groups. ALP activities were also elevated in the 1,000 µg/kg group at time points 1 and 3 days (p < .05, Table 1), while at lower doses ALP activities were found to be decreased starting at 3 days following treatment (p < .05). Serum CK was significantly decreased in the 50 µg/kg group and elevated in the 1,000 µg/kg group 1 day after treatment when compared to controls (p < .05, Table 1). For all other treatment groups, CK was decreased in a dose-related manner and significantly lower than the control group (p < .05) by day 3. In addition, a dramatic elevation of total bilirubin was found in the 1,000 µg/kg group at day 3 with a mean ± SD value of 15.49 ± 0.26 mg/dl when compared to all other groups including controls that have < 0.1 mg/dl total bilirubin (data not shown in Table 1). Amylase activities were dose-dependently decreased at day 1 after treatment, followed by gradual recovery to normal by week 1. Total protein and albumin were decreased at days 1 and 3 after treatment in a dose-dependent manner, which returned to normal after 1 week. Serum glucose levels were decreased at high doses (≥ 250 µg/kg) but elevated at the low dose (50 µg/kg) at days 1 and 3. Other serum biochemical parameters were not significantly affected and the data are not shown here.
Selected alterations in serum biochemical parameters after single-dose treatment with AFB1.
Note. ALP, alkaline phosphatase; ALT, alanine transaminase; AST, aspartate transaminase; CK, creatine kinase.
Values are means ± SD for 5 rats. Values that do not share a label (a letter or blank) are significantly different (p < .05).
Serum Biochemistry after Repeated-dose Treatment
There were no obvious changes in profiles of serum biochemical parameters in animals after 1 or 3 weeks of treatment with AFB1 (Data not shown). However, repeated-dose treatment with 75 µg/kg AFB1 for 5 weeks significantly increased serum AST and ALT activities by 1.02-fold and 0.19-fold, respectively, compared to controls (p < .05, Table 2). Serum CK levels were decreased in the 25 µg/kg group and were dramatically elevated (approximately 3-fold) in the 75 µg/kg group after 5 weeks of treatment (p < .05, Table 2). ALP activities were significantly decreased in the 25 µg/kg group (p < 0.05). Amylase activities and phosphorus levels were significantly elevated in the 75 µg/kg group (p < .05). Glucose levels were significantly elevated at low doses (5 µg/kg and 25 µg/kg) but decreased at the high dose (75 µg/kg, p < .05). Bilirubin levels were less than 0.1 mg/dl in all groups after week 5 of treatment (data not shown).
Selected alterations in serum biochemical parameters after 5-week treatment with AFB1.
Note. ALP, alkaline phosphatase; ALT, alanine transaminase; AST, aspartate transaminase; CK, creatine kinase.
Values are means ± SD for 5 rats. Values that do not share a label (a letter or blank) are significantly different (p < .05).
Serum AFB-Lys Levels
The levels of serum AFB-Lys after single-dose treatment are shown in Table 3. Dose-dependent changes of serum AFB-Lys were present at all time points. A quick rise at 2 hr followed by decrease was found after single-dose treatment. Repeated-dosing treatments lasting for 5 weeks increased the adduct levels by approximately 1-fold at low doses (5–25 µg/kg); however, at the high dose (75 µg/kg), the levels of the adduct were increased from start to a peak after 2-week treatment, followed by a slow decrease over the 5-week experimental period (Table 4).
Serum concentrations of AFB-Lys adduct after single-dose treatment with AFB1.
Note. AFB-Lys, aflatoxin B1-lysine adduct; NA, not available (n = 5); ND, not detectable.
Serum concentrations of AFB-Lys adduct after repeated-dose treatment with AFB1.
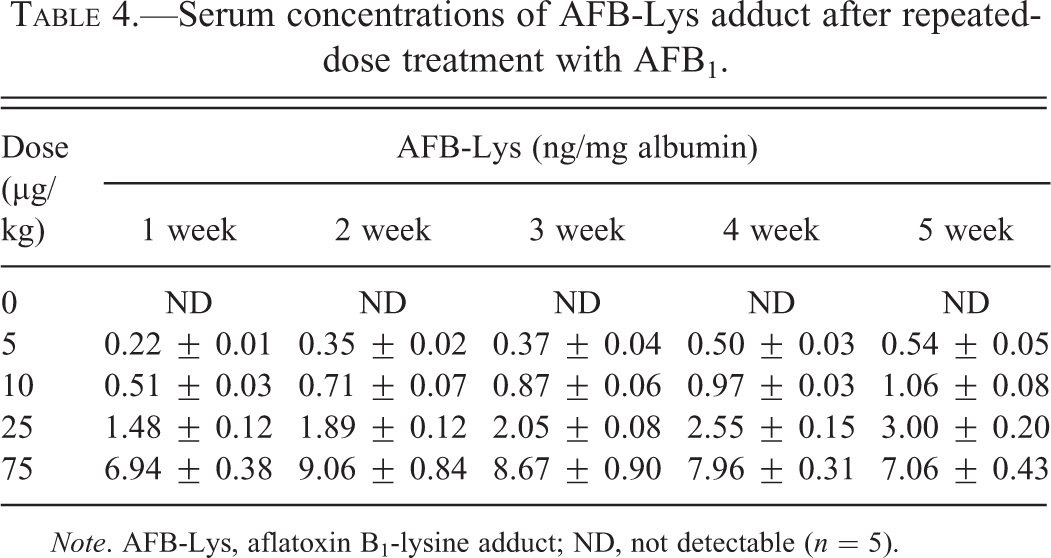
Note. AFB-Lys, aflatoxin B1-lysine adduct; ND, not detectable (n = 5).
Liver Histological Changes after Single-dose Treatment
The histological changes in rat liver induced by AFB1 occurred as a function of both dose and duration. Dramatic bile duct proliferation occurred in all animals at 250 and 1,000 µg/kg groups 3 days after treatment (n = 5). Massive periportal necrosis foci with inflammatory cell infiltration, excessive red blood cells appearing around hepatocytes, and destruction of liver lobes occurred only in the 1,000 µg/kg group (n = 5) at day 3 (Figure 2). Animals that died in the 1,000 µg/kg group showed severe liver damage, but these changes are not reported here. Bile duct proliferation and periportal necrosis persisted in all animals of the 250 µg/kg group throughout the 3 weeks (n = 5). However, no bile duct proliferation was found in the 50 µg/kg group throughout the experimental period (data not shown).
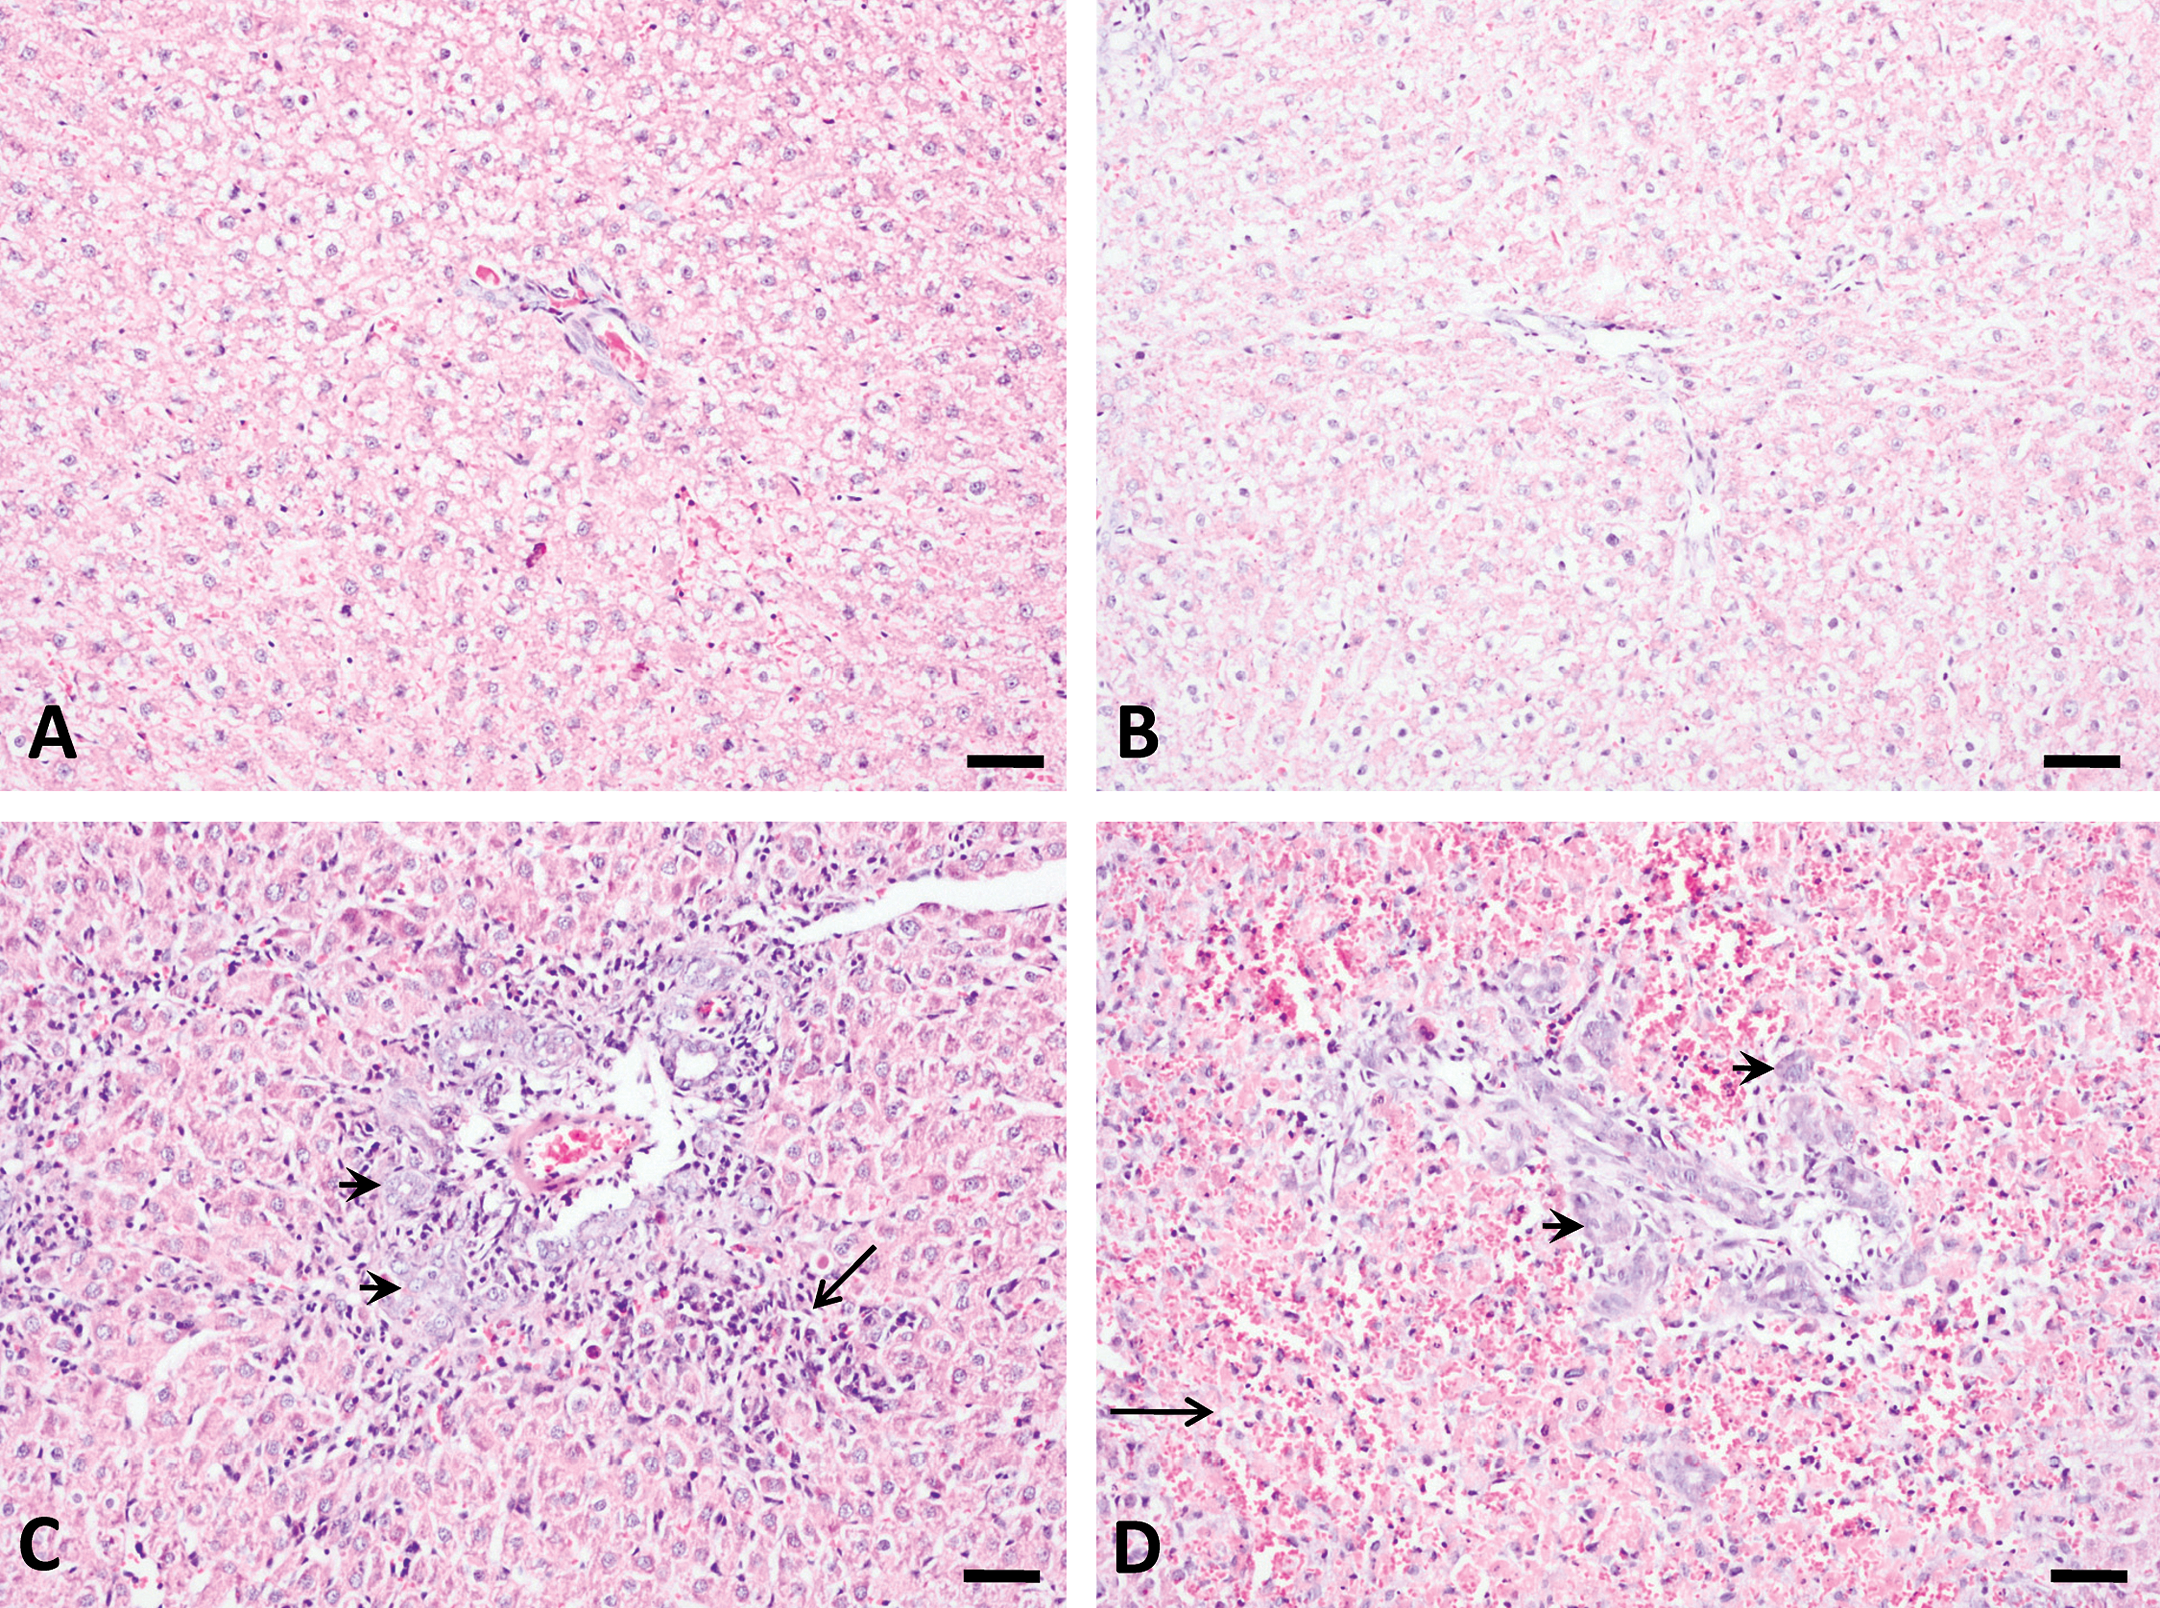
Bile duct proliferation and periportal necrosis induced by aflatoxin B1 (AFB1) at 3 days after single-dose treatment. No obvious histological changes occurred for control (A) and 50 µg/kg (B) groups. Dramatic bile duct proliferation (arrow head) and necrosis (arrow) were found at 250 µg/kg (C) and 1,000 µg/kg (D) groups. Hemorrhagic necrosis occurred only at 1,000 µg/kg (D, arrow). Bars represent 50 µm.
Liver Histological Changes after Repeated-dose Treatment
The major histological changes in rat liver after repeated-dose treatment with AFB1 included bile duct proliferation, periportal necrosis, and foci formation (Figures 3 and 4). Bile duct proliferation first appeared in all animals of the 75 µg/kg group after week 3 of treatment (n = 5), which progressed throughout the 5-week experimental period (n = 5; Figure 3B). Bile duct proliferation was also found in all animals at 25 µg/kg group (n = 5; Figure 3A) but not at lower doses after 5-week treatment (data not shown). Necrosis was present in the periportal zone at doses higher than 10 µg/kg group (n = 5; Figure 3C and D). Proliferation foci were found only in animals at 75 µg/kg group after 4-week and 5-week treatment (n = 5; Figure 4A and B).
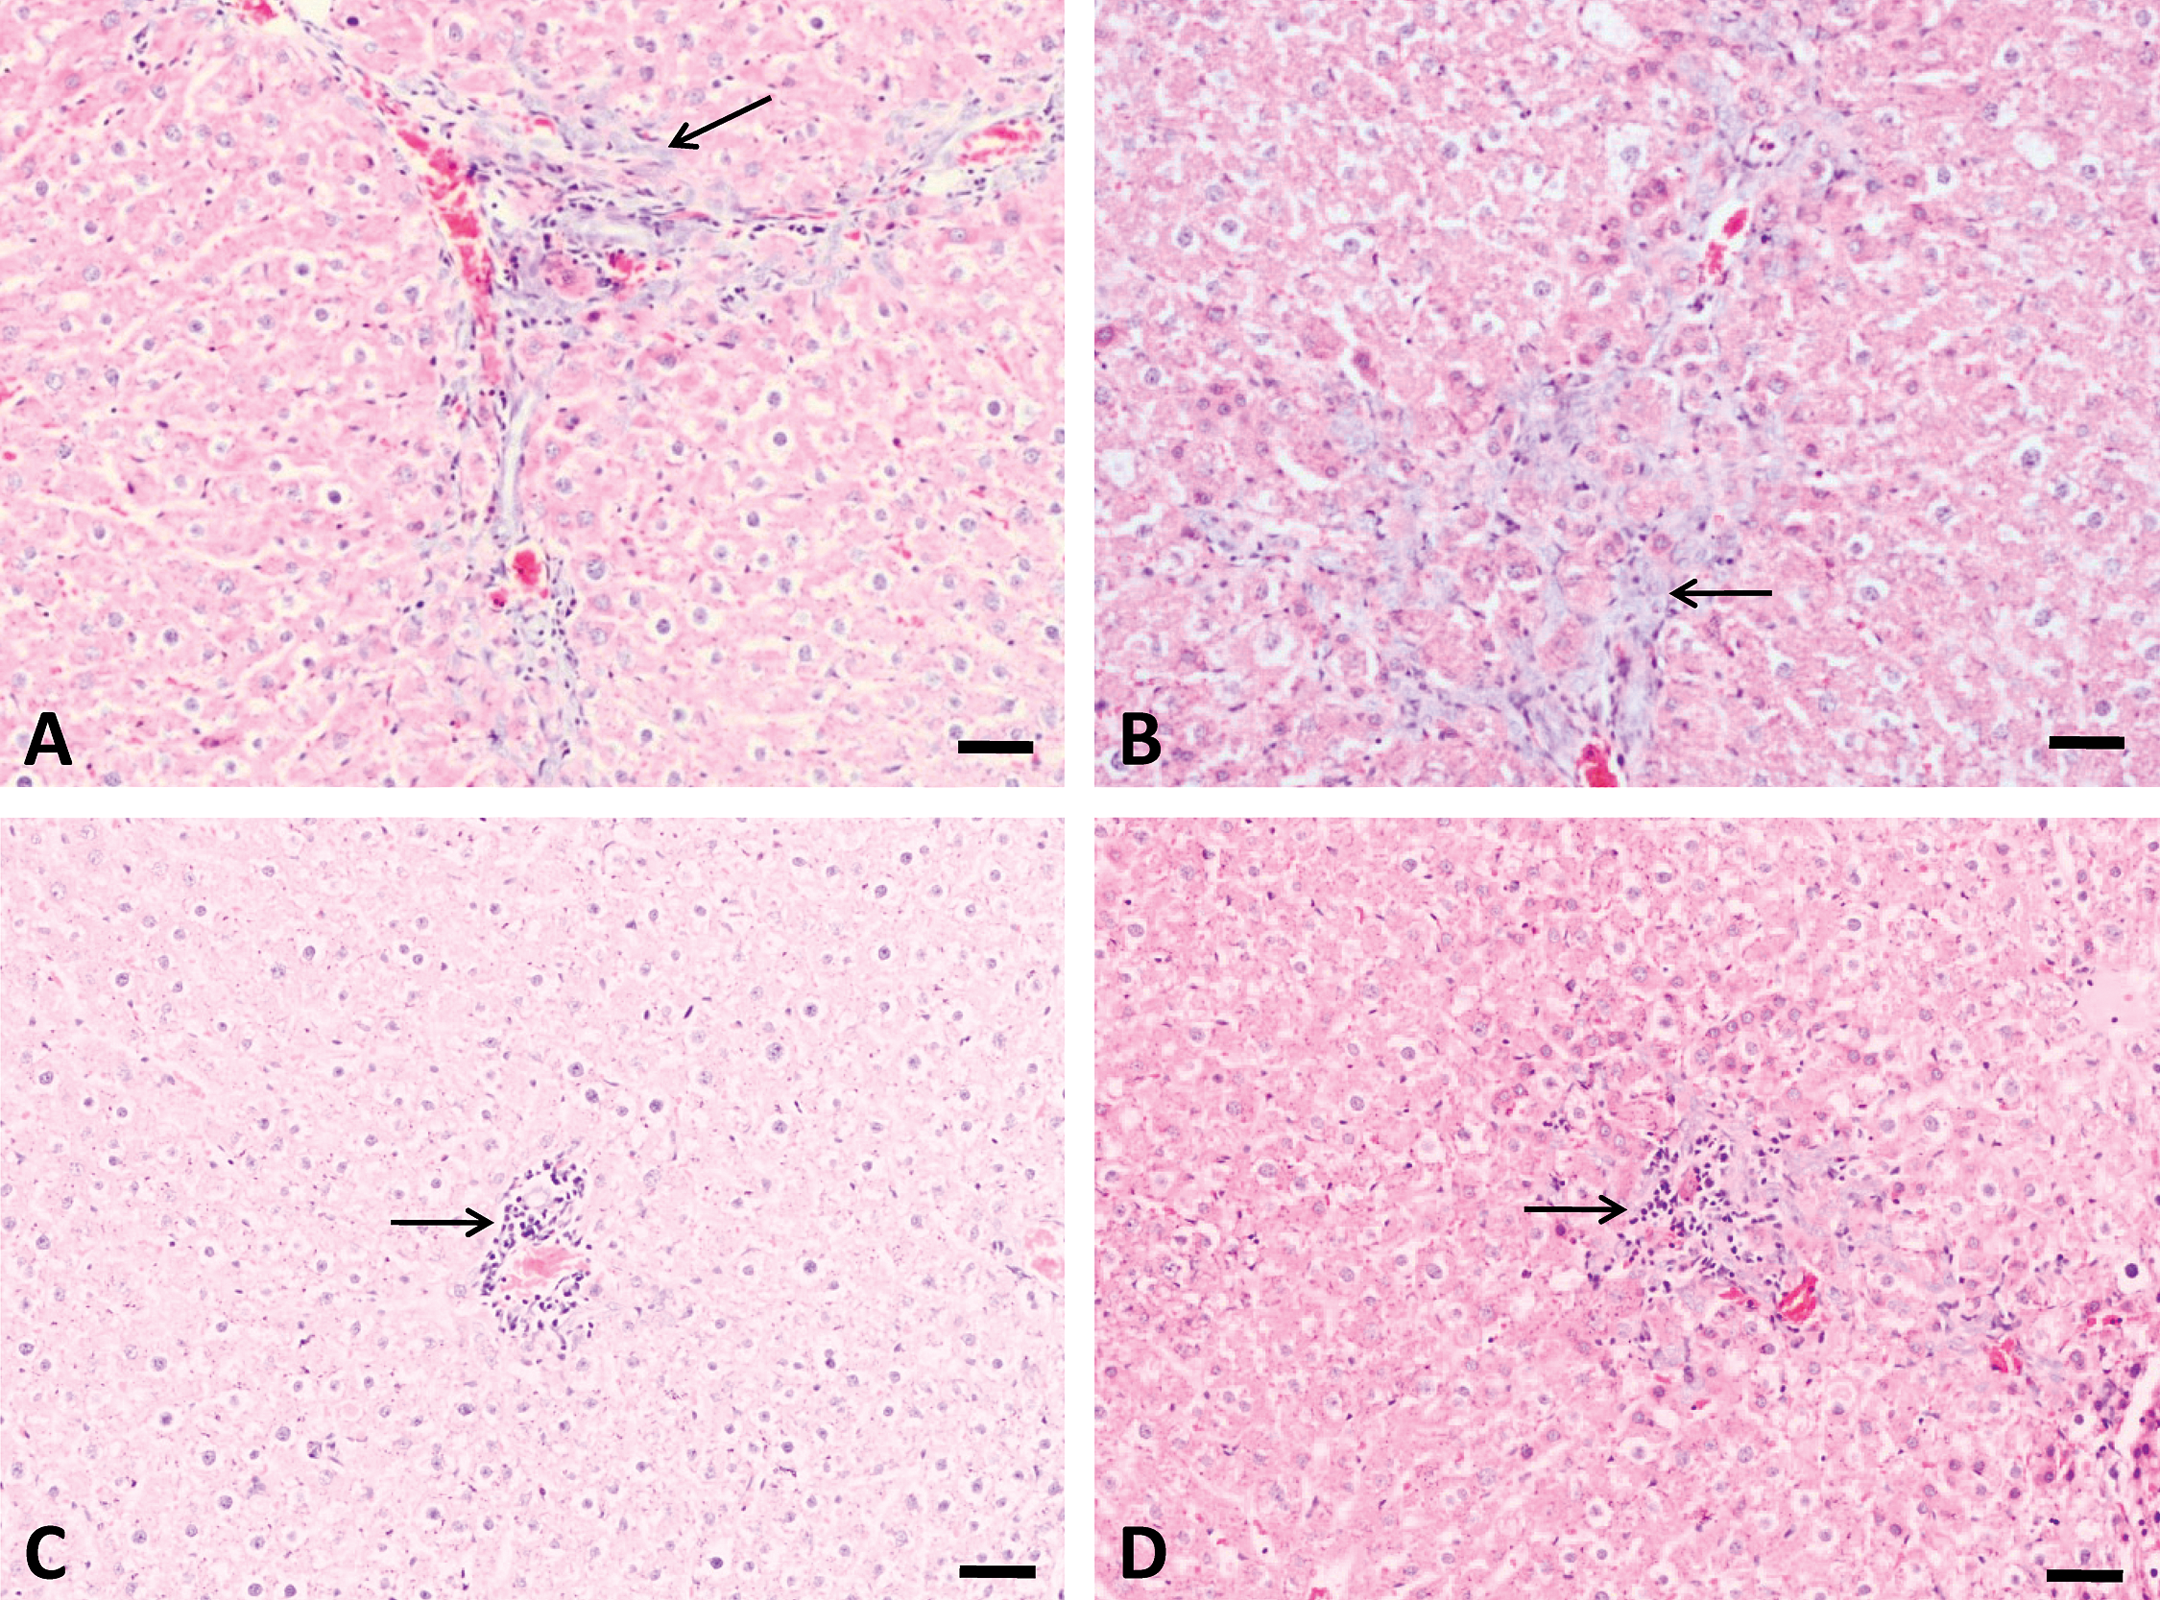
Bile duct proliferation and periportal necrosis induced by 5-week treatment with aflatoxin B1 (AFB1). Slight bile duct proliferation was found at 25 µg/kg group (A), and this change is more obvious at 75 µg/kg group (B). Periportal necrosis were also found at 10 (C) and 75 µg/kg (D) groups (arrow), necrosis at 25 µg/kg group was not shown here. Bars represent 50 µm.
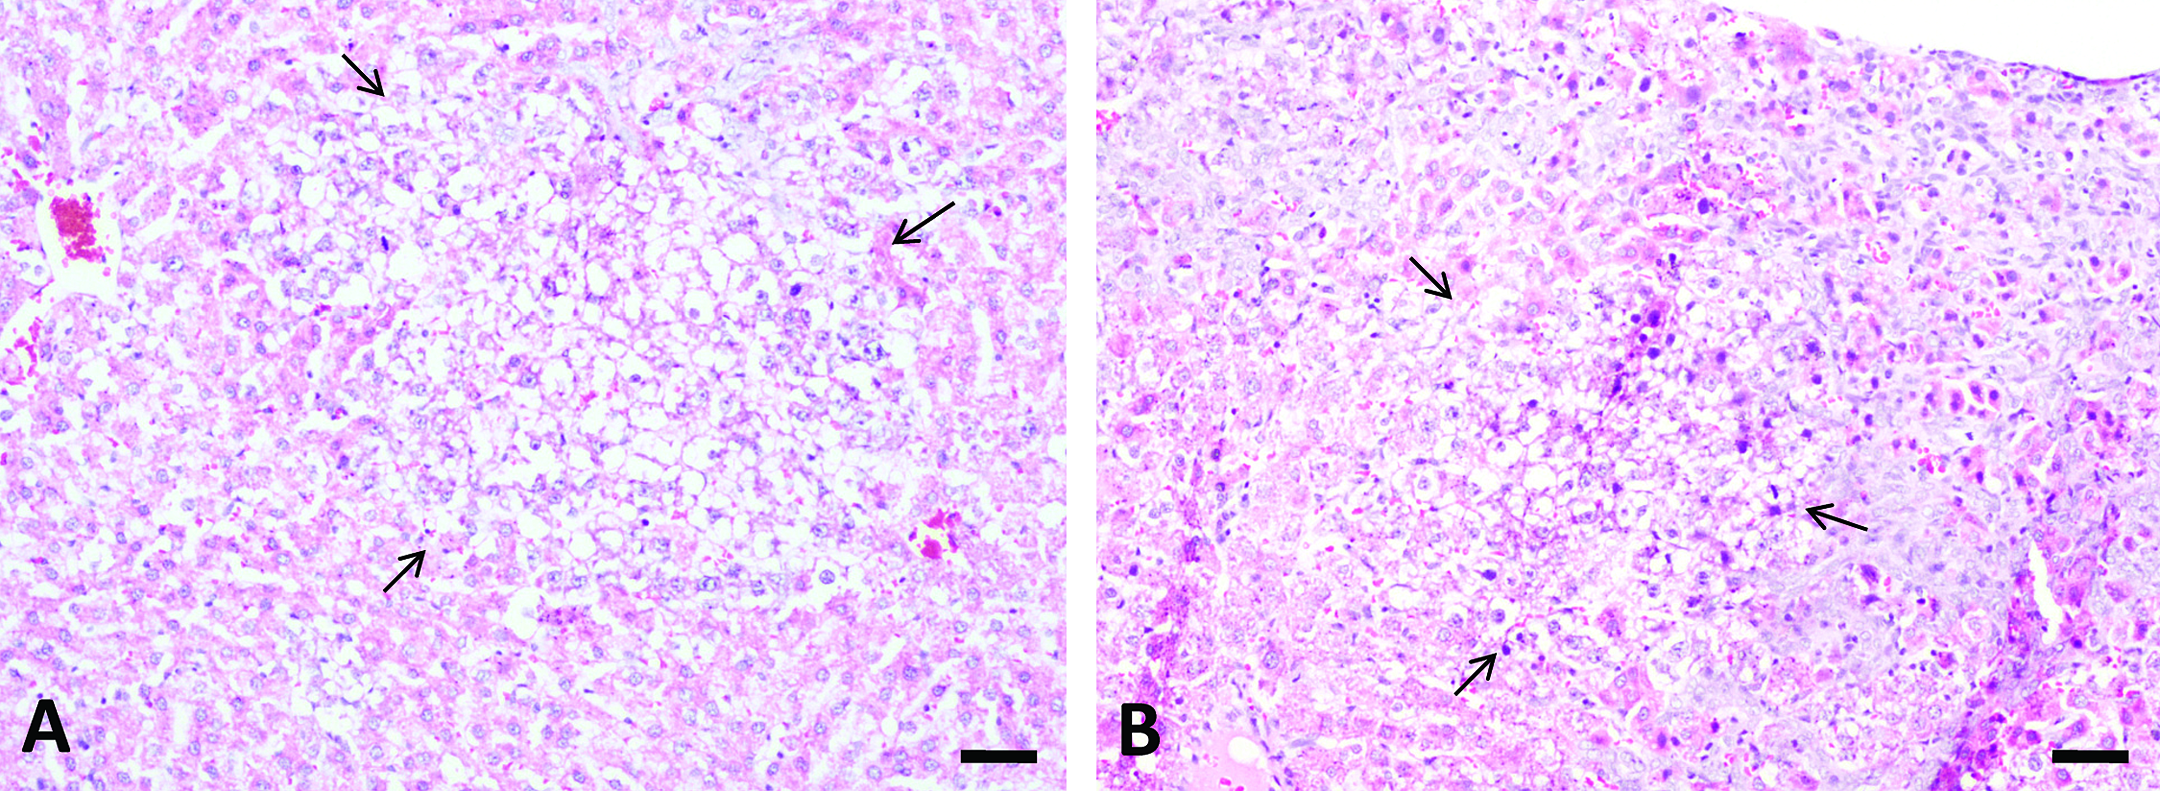
Aflatoxin B1 (AFB1) induced proliferation foci in liver after repeated-dose treatment. 75 µg/kg AFB1 treatment induced formation of proliferation focus after 4-week (A) and 5-week (B) treatment (arrow). The altered foci were characteristic of clear cytoplasm and many cells have a centrally located nucleus (clear cell foci). Bars represent 50 µm.
Liver GST-P+ Foci Formation after Single-dose Treatment
Liver GST-P+ cells and foci occurred in a dose- and time-dependent manner (Table 5 and Figure 5). Liver GST-P+ foci were not found in the 50 µg/kg group throughout the experimental period; however, single GST-P+ cells were found starting from 1 week after a single-dose treatment. In the 250 µg/kg group, GST-P+ cells first appeared on day 3 following treatment and foci formed by week 1. The GST-P+ foci persisted throughout the experimental period of 3 weeks. Interestingly, the highest dose of AFB1 (1,000 µg/kg) did not induce the formation of GST-P+ foci at the 1-, 3,- or 5-day time points. The liver GST-P+ foci observed in this study consisted of clear cells.
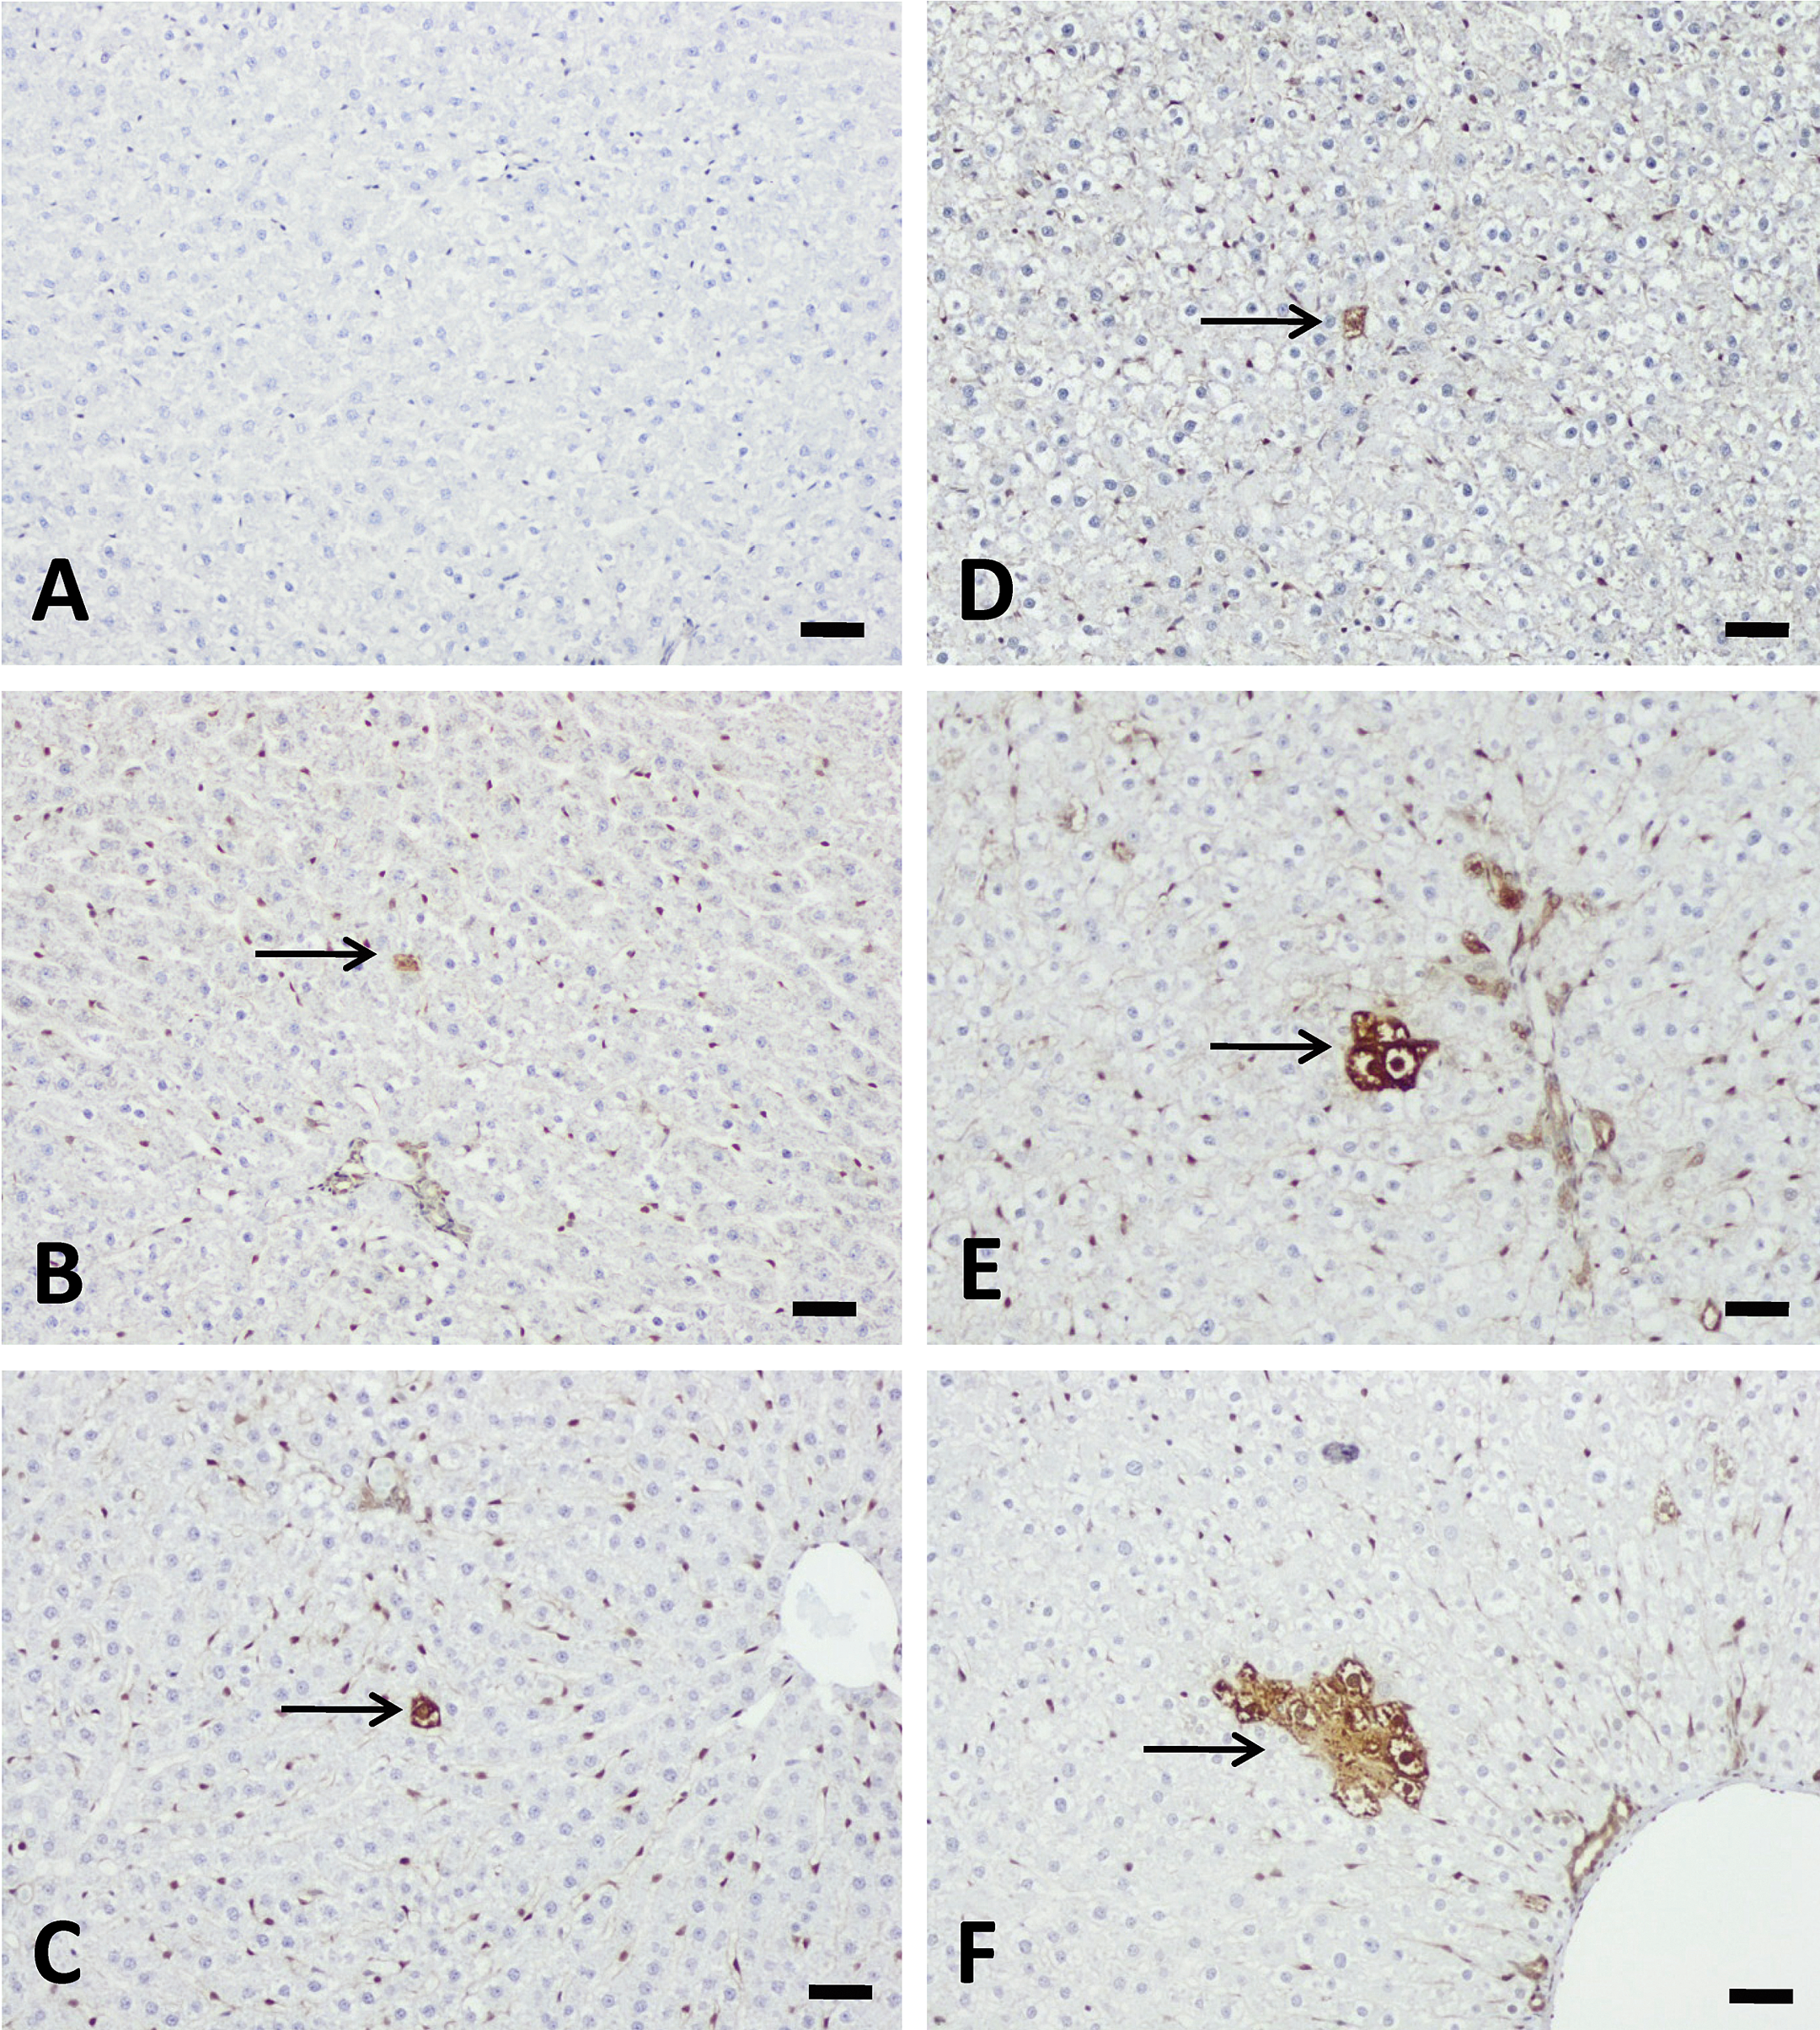
Aflatoxin B1 (AFB1) induced liver placental form glutathione S transferase (GST-P+) cells or foci formation after single-dose treatment with AFB1. GSP-P+ hepatocytes were not present at 3 days (A) but 5 days (B) and 1 week (C) after single-dose treatment with 50 µg/kg AFB1 (arrow). 250 µg/kg AFB1 treatment induced GST-P+ cells at 3 days (D), 5 day (E), and GST-P+ foci at 1-week (F) after single-dose treatment (arrow). Bars represent 50 µm.
Liver GST-P+ cells and foci induced by single-dose treatment with AFB1.
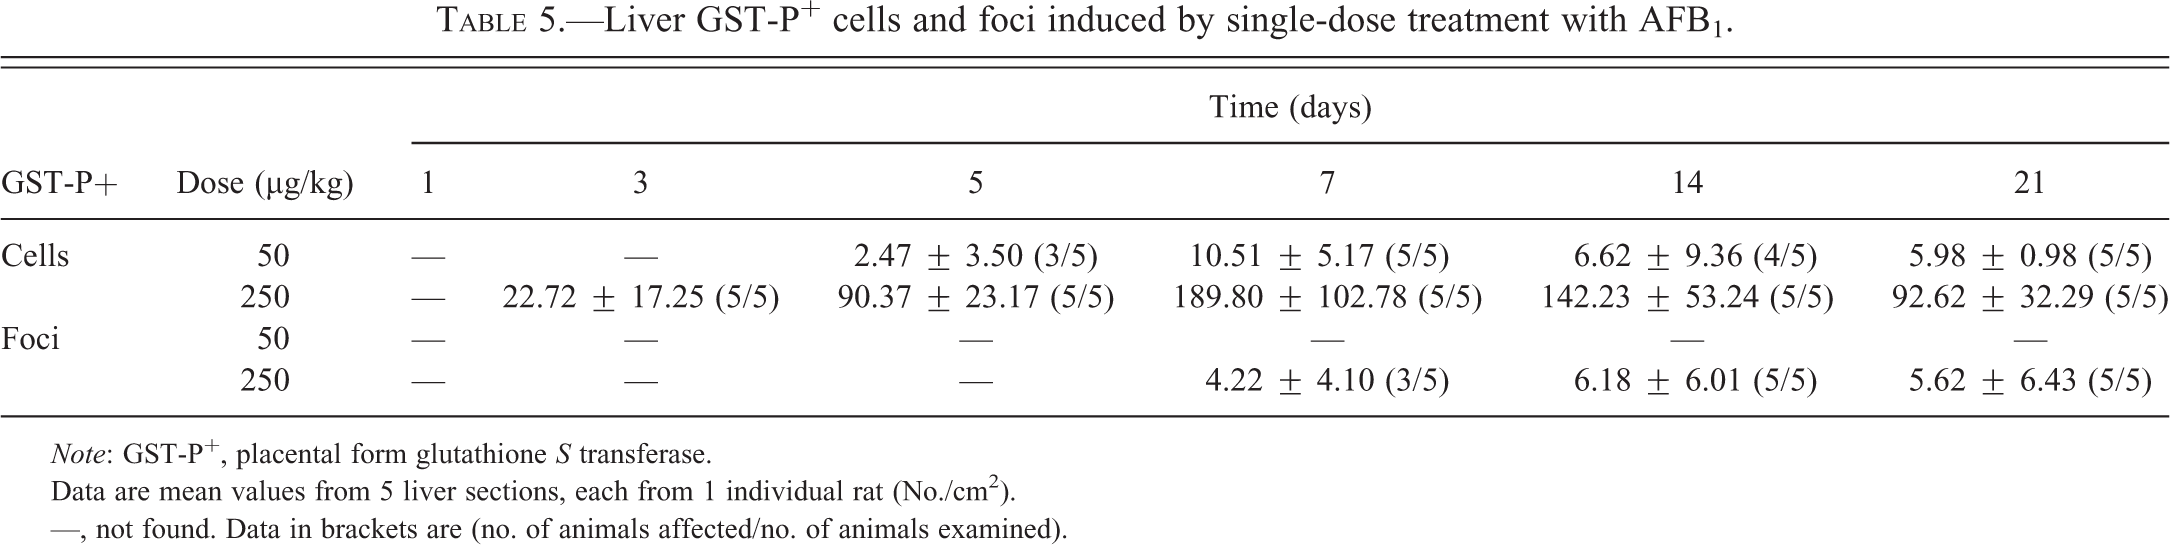
Note: GST-P+, placental form glutathione S transferase.
Data are mean values from 5 liver sections, each from 1 individual rat (No./cm2).
—, not found. Data in brackets are (no. of animals affected/no. of animals examined).
Liver GST-P+ Foci Formation after Repeated-dose Treatment
The development of liver GST-P+ foci after repeated-dose treatment with AFB1 exhibited a dose- and time-dependency (Table 6 and Figure 6). No liver GST-P+ cells or foci were found in the control group at any time points. Liver GST-P+ cells appeared in the 5 µg/kg group after 3 weeks of treatment, 10 µg/kg after 2-weeks of treatment, and in the 25 µg/kg and 75 µg/kg groups after 1 week of treatment, respectively. Liver GST-P+ foci appeared in the 10 µg/kg group after 5 weeks of treatment and in the 25 and 75 µg/kg groups after 3 weeks of treatment. There were no liver GST-P+ foci found in the 5 µg/kg group throughout the experimental period. A good correlation between serum AFB-Lys adduct levels and the numbers of GST-P+ cells (r = .99, p = .01) or foci (r = .97, p = .03) after 5 weeks of treatment was also found.
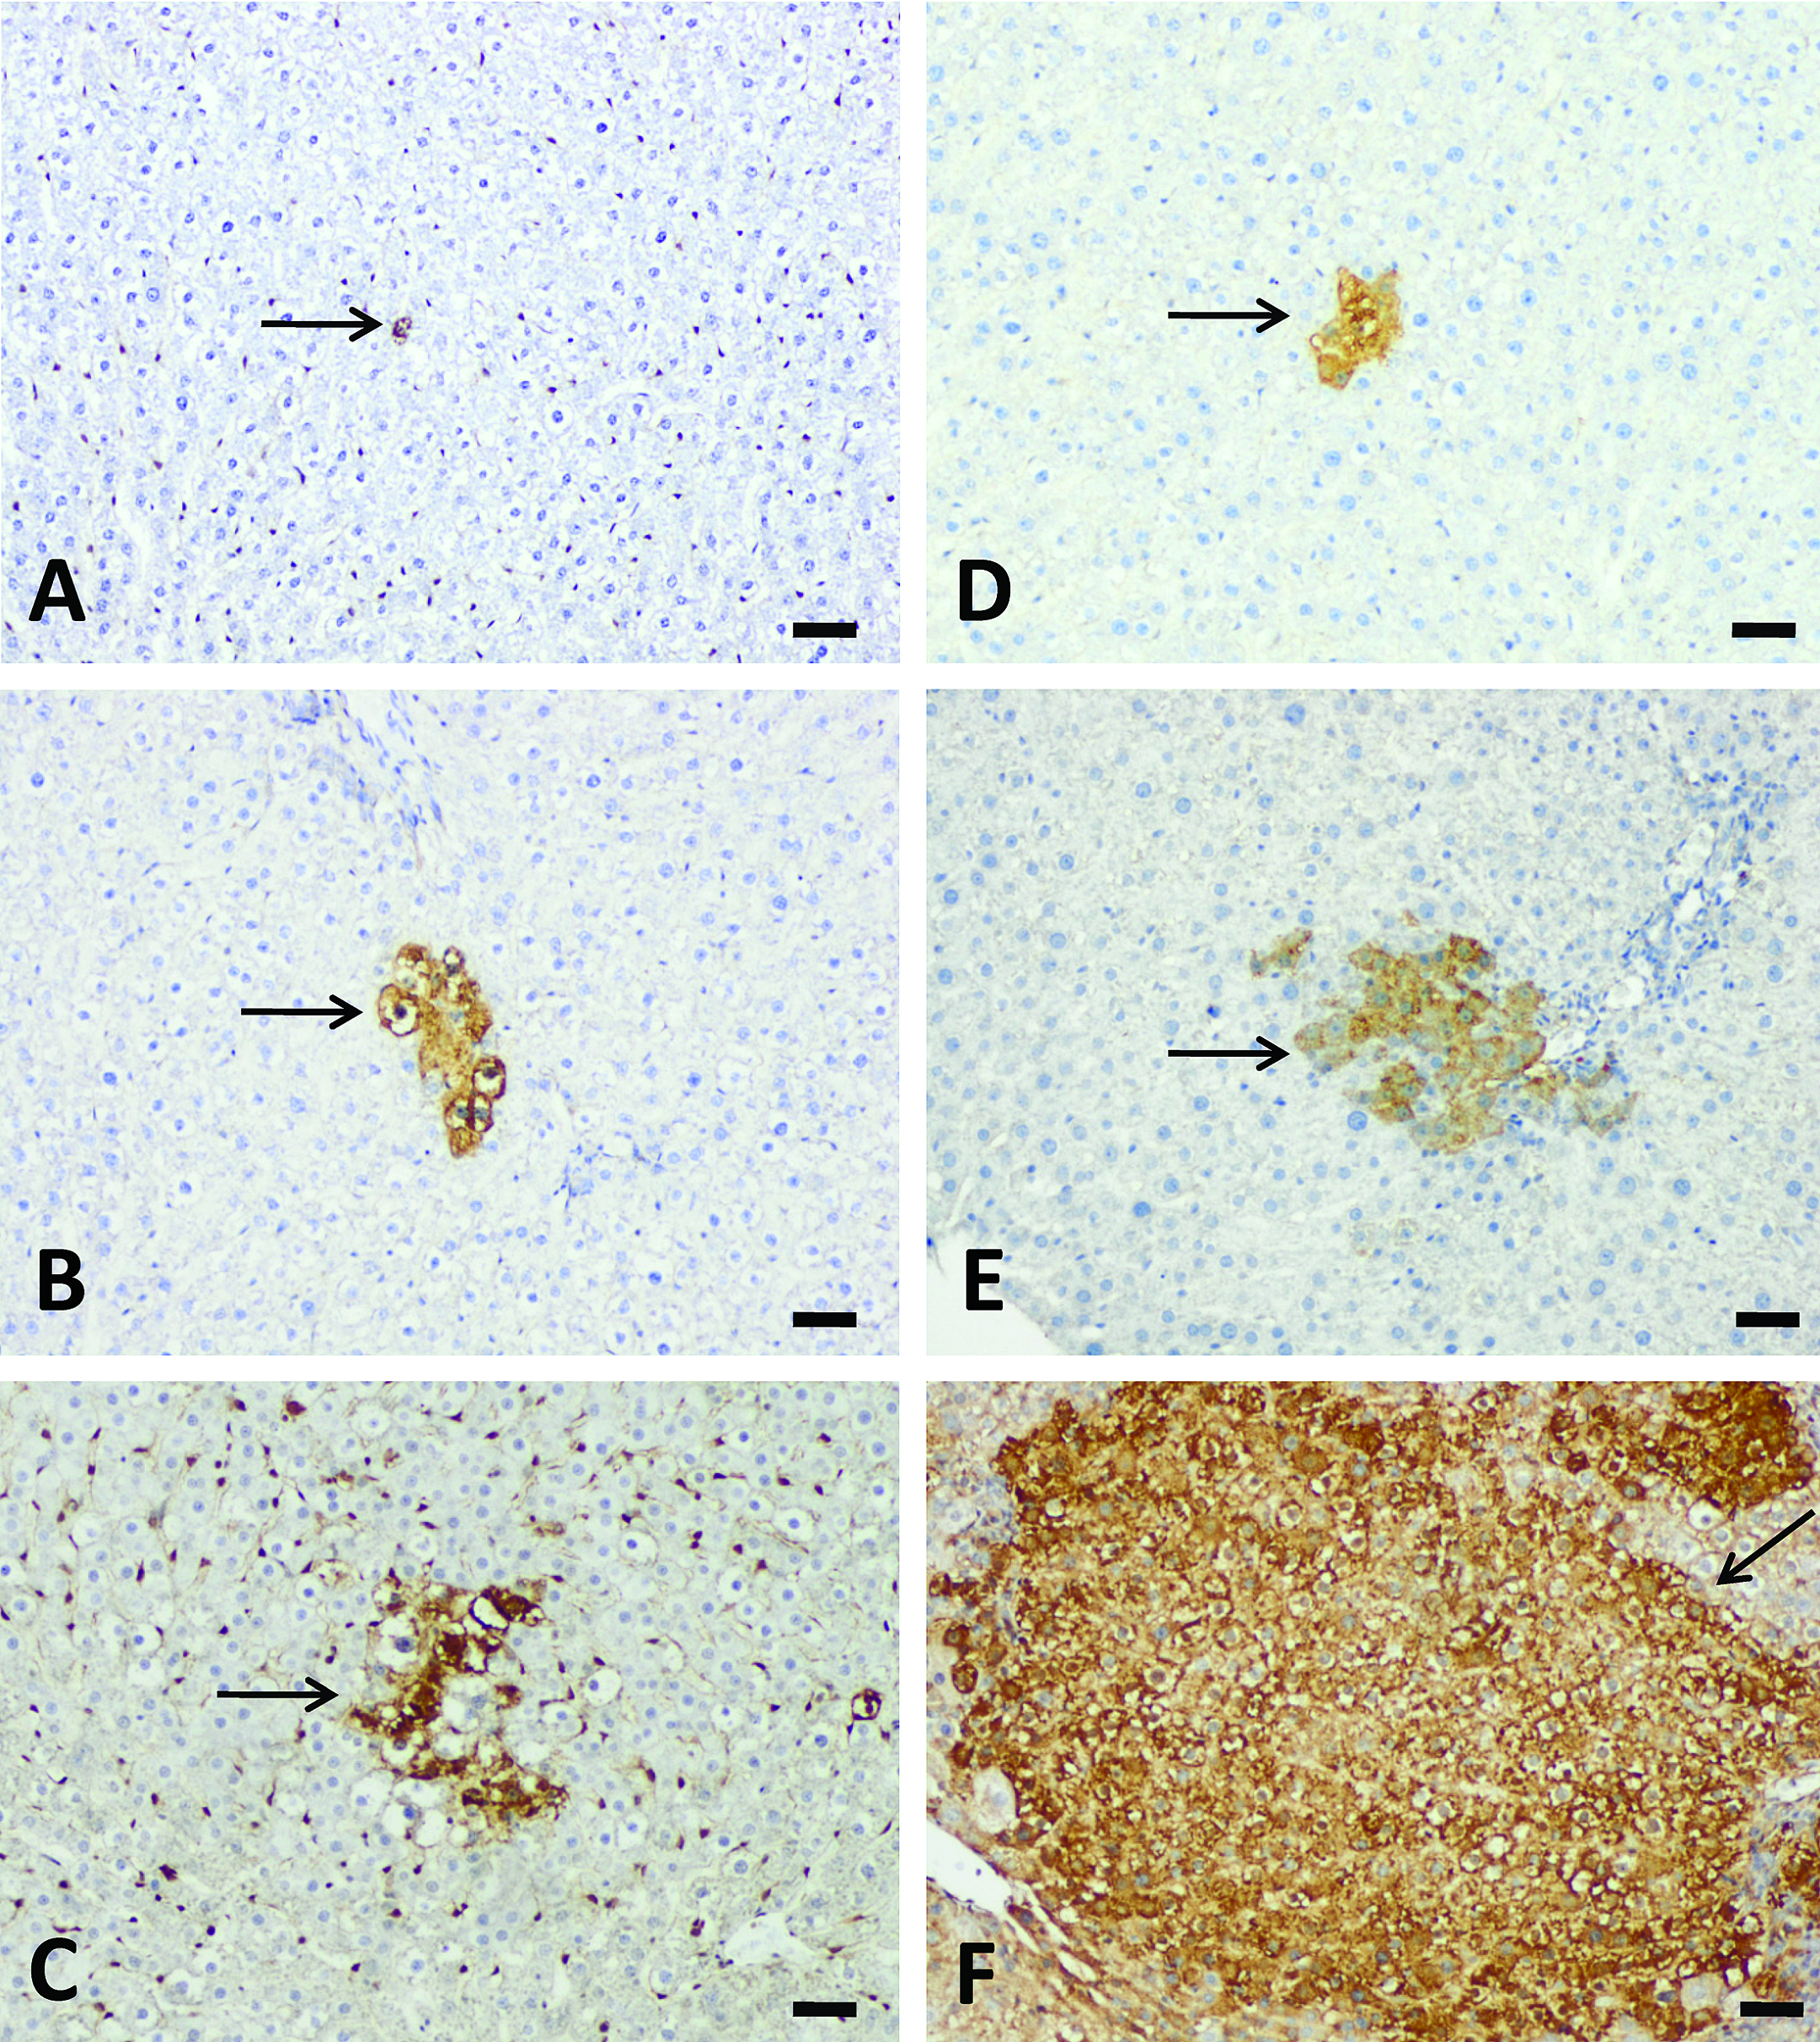
Aflatoxin B1 (AFB1) induced liver GST-P+ cells or foci formation after repeated-dose treatment with AFB1. Three-week treatment induced liver GST-P+ cells at 10 µg/kg group (A) and GST-P+ foci at 25 (B) and 75 µg/kg (C) groups (arrow). Five-week treatment induced GST-P+ foci at 10 (D), 25 (E), and 75 µg/kg (F) groups. Note the relative area of GST-P+ foci. Bars represent 50 µm.
Liver GST-P+ cells and foci induced by repeated-dose treatment with AFB1.
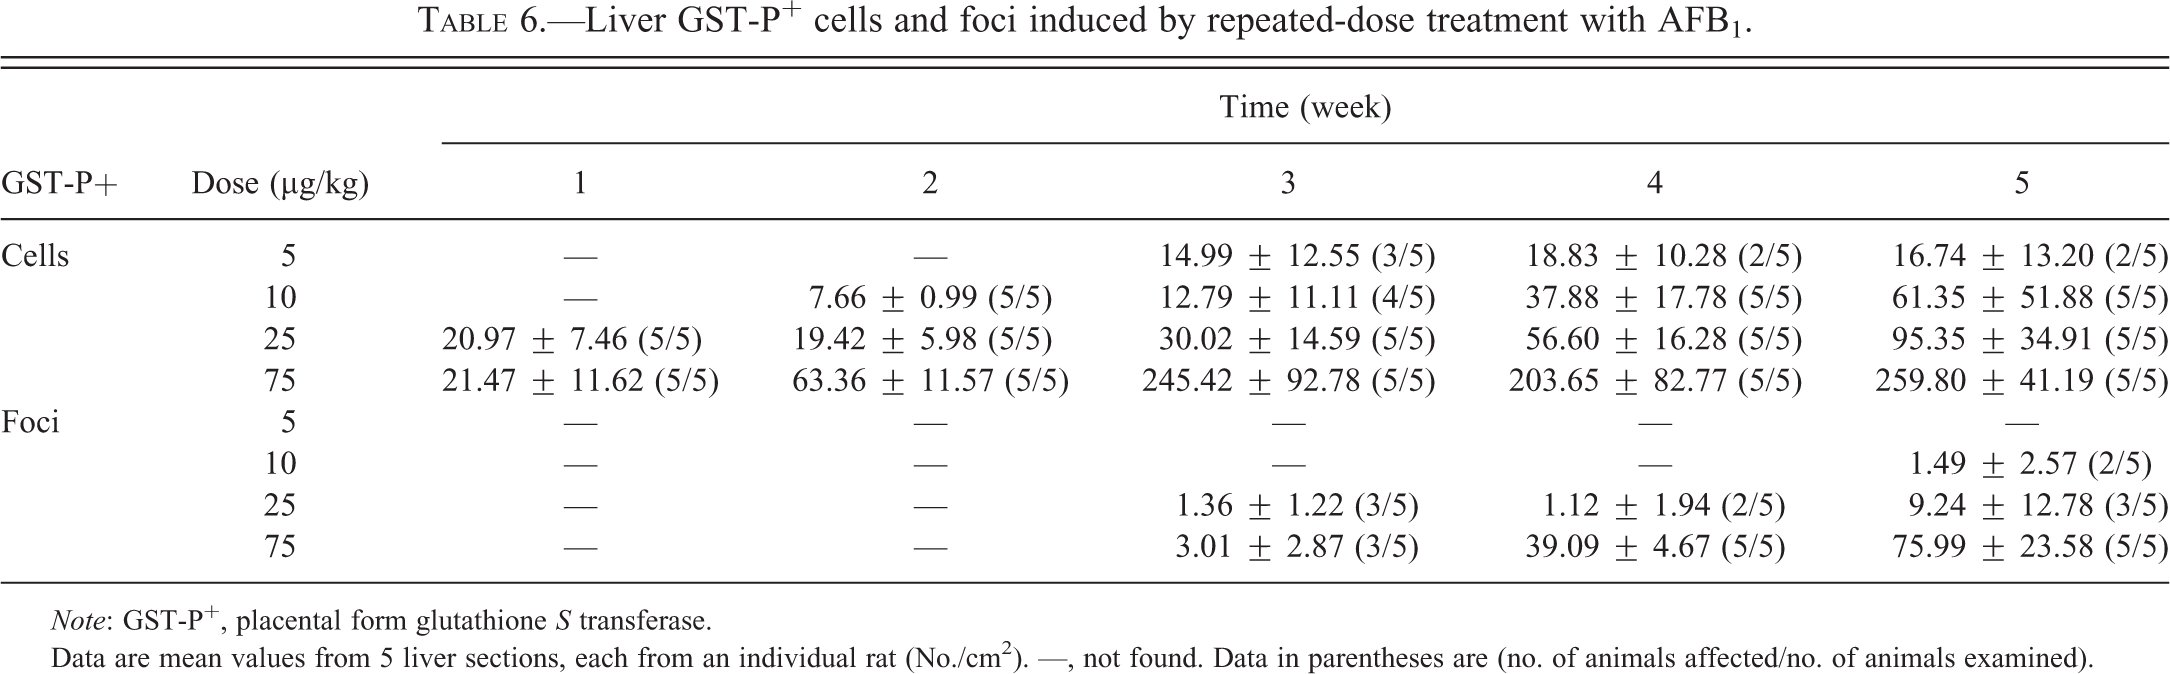
Note: GST-P+, placental form glutathione S transferase.
Data are mean values from 5 liver sections, each from an individual rat (No./cm2). —, not found. Data in parentheses are (no. of animals affected/no. of animals examined).
Discussion
In this integrative study, we demonstrate the time course of development of biochemical, histological, and immunohistological changes and serum AFB-Lys levels in both single-dose and repeated-dose treatment of AFB1 (Figure 7). This is the first animal study to investigate the time course of development of liver GST-P+ hepatocytes and foci caused by AFB1 exposure. Liver AST and ALT activities are early and sensitive indicators of acute hepatocyte injury or necrosis, which preceded the appearance of bile duct proliferation and periportal necrosis. The occurrence of GST-P+ hepatocytes was temporally correlated with bile duct proliferation after single-dose treatment, while liver GST-P+ foci formation was correlated with bile duct proliferation in rat liver upon repeated-dose exposure. Serum AFB-Lys adduct was demonstrated as a reliable exposure biomarker, particularly during repeated low doses exposures. The doses of AFB1 selected in this study were relevant to human exposure levels found in cases of acute poisoning (i.e., Kenya had up to 46.4 ppm AFB1 in maize; Lewis et al. 2005) and chronic dietary exposure (estimated AFB1 daily intake of 48.4 µg/male and 77.4 µg/female; Groopman et al. 1992). An estimation of AFB1 exposure, based on a 70-kg adult consuming 2-kg maize containing 1 ppm AFB1, would be 2 kg × 1 ppm/70 kg = 26.7 µg/kg BW. This is comparable to the selected doses in our study.
Summary of the integrative toxicopathological findings in this study.
The transitory rise of serum AFB-Lys at 2 hr was in agreement with the quick absorption and metabolism of AFB1 in rat liver (Butler and Clifford 1965). Compared to other parameters (amylase, proteins, and glucose), dramatic increases of serum enzymes (ALT, AST, and ALP) were found 3 days after single AFB1 treatment. These changes were in agreement with the massive liver necrosis observed 3 days after treatment. It has been reported that a temporary elevation of ALT and AST occurs 48 hr after 3 i.p. doses of AFB1 (150 µg/kg) in Sprague-Dawley rats (Kim et al. 2011). The discrepancy is likely due to differences in animal species, route of exposure, and/or examination period. Serum activities of AST and ALT returned to control group levels by week 3 for animals in the 50 but not 250 µg/kg group, indicating a dose-related and slow recovery process. The decreased CK after 1 day could be related to reduced muscle mass, evidenced by lowered BW, and similar findings have been reported in patients with alcoholic liver disease (Rosalki 1998).
Elevated serum AST and CK activities in the repeated-dose treatment groups were present only after 5 weeks of treatment with the 75 µg/kg AFB1 dose. These changes occurred after the appearance of bile duct proliferation, indicating that these parameters are not sensitive indicators of chronic AFB1 exposure. The finding that CK was decreased at the low dose (≤25 µg/kg) and elevated at the high dose (75 µg/kg) may suggest different modes of action. In contrast, serum glucose levels were elevated at low doses and decreased at high doses, similar to findings in the single-dose treatment protocol. These outcomes could reflect a balance of different modes of action, such as the decrease of glucose-6-phosphatase (G6P) activity (Rastogi, Srivastava, and Rastogi 2001) and the newly expressed G6P in proliferating bile duct–like cells (Lenzi et al. 1991).
Bile duct proliferation and periportal necrosis are characteristic of AFB1-induced liver injuries (Newberne and Wogan 1968; Kalengayi and Desmet 1975). These histological changes slowly reached a maximum in rat liver 3 days after a single dose of 250 or 1,000 µg/kg AFB1 in this study. Animals that received the highest dose (1,000 µg/kg AFB1) died within 7 days of treatment. A possible reason for death may involve the massive hemorrhagic necrosis and lobular dissolution of the liver that became irreversible. Bile duct proliferation was consistently found in animals receiving 250 µg/kg AFB1 after 1 week but not at lower doses, indicating a dose-related induction of this alteration. Among the 3 types of bile duct proliferation (typical, atypical, and oval cell), the proliferation observed here is restricted to the periportal zone and has a well-defined lumen, which are characteristics of “typical” proliferation (LeSage, Glaser, and Alpini 2001). In a ligated bile duct rat model, it was concluded that a distorted liver microstructure leading to biliary duct hypertension is the initiating factor for proliferation (Slott, Liu, and Tavoloni 1990). Arguably, the newly produced bile duct could also be derived from a metaplasia of the periportal hepatocytes or from the liver stem cells (or oval cells; Forbes et al. 2002). Although many studies have reported AFB1 induced bile duct proliferation, the exact mechanisms remain to be uncovered.
Similar histological changes were found in animals that received repeated doses of AFB1 treatment, such as bile duct proliferation and necrosis. In contrast to the “typical” bile duct proliferation, repeated low-dose treatment resulted in oval cell proliferation. This type of proliferation induces the formation of disorganized tubular structures with a poorly defined duct lumen (LeSage, Glaser, and Alpini 2001). However, because specific staining was not done to distinguish between cell types (bile duct epithelium vs. oval cell), it is likely that different types of proliferation may coexist. The clear cell foci caused by repeated-dose treatment were early preneoplastic changes, which could return to normal or progress to hepatocellular carcinoma (HCC). For instance, HCC was reported in rats receiving 0.015 ppm AFB1 for a period of 68 to 80 weeks with altered foci appearing within a few weeks’ treatment (Newberne and Wogan 1968).
Liver GST-P is a specific biomarker that is markedly increased in preneoplastic foci in rats (Ito et al. 1992). This enzyme can be induced by a variety of carcinogens, such as diethylnitrosamine (DEN) and 2-acetylaminofluorene (2-AAF; Tiwawech et al. 1991; Carthew et al. 1997). Hepatocytes heavily positive for both GST-P cells and GST-P foci have been used as markers of preneoplastic lesions in short-term carcinogenesis assays (Tatematsu et al. 1985; Moore et al. 1987). In this study, single GST-P+ hepatocytes were induced as early as 3 days after a single dose of 250 µg/kg AFB1, demonstrating the strong potency of AFB1 in initiating rat hepatocytes. A previous study demonstrated an earlier onset of positive staining with GST-P+ hepatocytes observed 48 hr after an i.p. injection of 2 mg/kg AFB1 to young Fischer rats (Tsuji et al. 1992). This difference in the onset of GST-P+ hepatocytes is most likely due to the much larger dose given by Tsuji et al. (1992) than in the present study. Liver GST-P+ foci were present in the 250 µg/kg but not the 50 µg/kg group, suggestive of a nonobserved effect level for liver GST-P+ foci formation. Results from other studies on DEN and n-nitrosomorpholine (Satoh et al. 1989; Enzmann et al. 1995) were consistent with this finding and the value of GST-P+ foci in dose-dependent carcinogenic studies has been reviewed (Tsuda et al. 2003). In contrast, liver GST-P+ hepatocytes or foci were not found in animals that received 1,000 µg/kg AFB1. One possibility for this negative finding is that the large dose of AFB1 overwhelmed the signaling pathways responsible for expression of GST-P, such as transforming growth factor β (TGF-β; Ichimura et al. 2010) and mitochondrial oxidative stress–mediated signaling pathways (Kakehashi et al. 2011). Also, at 1,000 µg/kg, the hepatocytes (including those that might have become GSTP+) were severely injured and underwent necrosis before the positive foci or cells would become evident.
The appearance of liver GST-P+ hepatocytes was correlated with the bile duct proliferation 3 days after 250 µg/kg AFB1 treatment, suggesting a synchronized onset. It was reported that 4-nitroquinoline 1-oxide induced placental GST expression was also correlated with cellular proliferation in a rat tongue carcinogenesis model (Silva et al. 2007). Therefore, it appears that a temporal overlapping exists between the acute toxicity (bile duct proliferation in particular) and the preneoplastic changes (liver GST-P+ cells and foci) at a nonlethal dose of AFB1. While increased biliary pressure has been proposed as the initiating factor in bile duct proliferation (Slott, Liu, and Tavoloni 1990), the mechanisms for GST-P expression might also involve epigenetic mechanisms (Satoh and Hatayama 2002). However, the exact mechanisms for these effects require more research. In addition, serum AFB-Lys adduct levels increased over the 5-week experimental period at low doses (≤25 µg/kg), demonstrating its value as a biomarker of chronic exposure. High AFB1 exposure (75 µg/kg) produced a plateau of this adduct after 2 weeks, which was consistent with the occurrence of bile duct proliferation and GST-P+ foci at week 3 and may imply a variation of metabolic balance between its formation and detoxification.
Wild et al. (1996) revealed a positive correlation between serum AFB1-albumin adducts and AFB1-DNA adducts in multiple species including rats. Their data provide evidence for the application of AFB1-albumin adducts as a biomarker of AFB1-induced HCC development. Our study highlights the correlation between AFB1-lysine adduct levels and formation of preneoplastic lesions (a strong correlation between serum AFB-Lys adduct levels and numbers of liver GST-P+ cells or foci was found after 5 weeks of repeated exposure). However, it is important to note that while liver GST-P+ foci formation and serum enzyme changes (e.g., ALT and AST) are sensitive to and can be correlated with AFB1 exposure, these markers are not specific to AFB1.
In conclusion, we demonstrated an AFB1-induced time course of development of liver GST-P+ foci and correlations between formation of liver GST-P+ foci and the bile duct proliferation in F344 rats. Given the early formation and the temporal correlation of liver GST-P+ foci with bile duct proliferation after single or repeated AFB1 treatment in F344 rats, liver GST-P+ foci may be used as an end point to evaluate the efficacy of interventions to reduce AFB1 exposure in animal experiments. Also, the simultaneous examination of serum AFB-Lys adducts and liver GST-P+ positive foci would be useful for the evaluation of possible chemopreventive agents to AFB1-induced HCC.
Footnotes
The author(s) declared no potential conflicts of interest with respect to the research, authorship, and/or publication of this article.
The author(s) disclosed receipt of the following financial support for the research, authorship, and/or publication of this article: This work was supported by the grants from the United States Agency for International Development (USAID) via Peanut Collaborative Research Support Program (CRSP; ECG-A00-0700001-00) and from the National Institute on Minority Health and Health Disparity (NIMHD; 1R01MD005819-01).