
Abstract
The authors investigated the toxic effects of simazine on mice spleen immune cells and the underlying mechanisms. Mice were given simazine at 0, 90, 200, or 400 mg/kg by gastric gavage for 3 weeks. The authors then measured immune cell proliferation and the expressions of apoptosis-related proteins (Bcl-2, Bax, Fas, and caspase-3), spleen cell intracellular [Ca2+], cellular oxidative stress level, and immune functions. After 3 weeks, mice exposed to simazine had reduced proliferation of both spleen T and B cells. The number of spleen CD4+ T lymphocytes decreased with simazine exposure, while CD8+ T cells remained unchanged. Exposure to simazine resulted in reduced immune function, higher intracellular [Ca2+], and oxidative stress. Finally, simazine induced spleen immune cells apoptosis by reducing Bcl-2, while increasing Fas and Caspase-3 level. Overall, the immunotoxicity of simazine may involve the induction of immune cell apoptosis and alterations in the immune and physiological functions of spleen cells.
Introduction
Simazine is a widely used triazine herbicide. Because of its high potency and broad-spectrum weed-killing activities, simazine is used extensively in agriculture and horticulture (Worthing and Walker 1983). Owing to its ability to control broadleaf weeds, simazine is one of the most widely used pesticides in the United States, with more than 33,800 metric tons applied to crops in 1997 alone (Gianessi and Marcelli 2000). After extending the application time, significant amounts of simazine can be detected in soil and water. Therefore, users and producers may be in direct contact with this herbicide through water and air, which may have significant health effects.
This herbicide has been shown to induce limited mutagenesis or carcinogenesis (Murink and Nash 1977; Pinter et al. 1990; Goldman 1994; Bogdanffy et al. 2000). To date, most studies of immune toxicity resulting from triazine herbicides have focused on atrazine (Filipov et al. 2005), and there have been only a few studies on simazine. Barshtein, Palii, and Persidskii (1991) found that simazine could impair T-lymphocyte function and inhibit the phagocytic activities of neutrophils. Kim et al. (2003) found that simazine reduced the production of nitric oxide and tumor necrosis factor (TNF) by mouse macrophages in vitro and interfered with the generation of interleukin-1 (IL-1), IL-6, and interferon. Furthermore, simazine could inhibit the activities of macrophages against tumors and viruses, suggesting that the herbicide may have immune toxicities.
It was shown that oral intake of simazine suppressed the immune function of male C57BI/16 mice (Kim et al. 2002) and inhibited T-dependent antibody response-dependent plaque formation and reduced the proliferation of T and B cells in the spleen. Additionally, simazine reduced natural killer (NK) cell activities in the spleen. However, these studies only investigated whether immune toxicities existed, and consequently, the mechanisms underlying these toxicities remain largely unknown.
The molecular mechanisms underlying the toxic effects of herbicides have been well investigated in plants. However, these mechanisms, particularly those related to immune system functions, have been sparsely investigated in animals. As one possible mechanism, Gao et al. (2008) found that oral exposure to dibromoacetic acid induced immunotoxity and cell apoptosis in the spleen and thymus of mice. Singh, Sandhir, and Kiran (2010) reported altered cell Ca2+ homeostasis in rats after exposure to atrazine. Another potential mechanism for the altered physiological responses, in particular in immune cell function, may be oxidative stress (Pruett et al. 2003; Pruett et al. 2009). While numerous pathways may be involved, changes in free radical production, which are detected via superoxide dismutase (SOD) activity or lipid peroxidation status (i.e., malondialdehyde [MDA]), reflect the overall alterations in oxidative stress.
In this study, BALB/c mice were exposed to simazine (90, 200, or 400 mg/kg) via gastric gavage for 3 weeks. After exposure, we evaluated the weight of the spleen relative to total body weight, proliferative activity of spleen lymphocytes, changes in lymphocyte subtypes in the spleen, spleen cell apoptosis, the expressions of apoptosis-related proteins (Bcl-2, Bax, Fas, and caspase-3) in spleen tissues, and spleen tissue germinal center morphology. In addition, we evaluated general immune cell functions, specifically NK cell activity and peritoneal macrophage phagocytosis. Finally, we also investigated spleen cell intracellular Ca2+ concentrations and oxidative stress responses via SOD activity and MDA levels as part of a preliminary investigation on the potential physiological alterations induced via simazine.
Materials and Methods
Mice
A total of 40 one-month-old healthy BALB/c mice (20 males and 20 females) were purchased from the Veterinary Institute of the Chinese Academy of Agricultural Sciences. The mice were allowed 1 week to adapt to their new environment. Mice were housed under environmentally controlled conditions (20 ± 3°C; 12 hr light/dark cycle with the light cycle from 6:00 to 18:00 and the dark cycle from 18:00 to 6:00; relative humidity of 50 ± 10%). The study protocol was approved by the local institutional review board of Harbin Medical University, Harbin, China.
Study Design
Based on body weight, BALB/c mice were randomly divided into four groups (10 mice in each group). Each group included five males and five females that were given either 0 (distilled water; negative control group), 90, 200, or 400 mg/kg of body weight of simazine via gastric gavage at 0.1 ml/10 g of body weight once a day for 3 consecutive weeks. The Material Safety Data Sheet data sheet provided by the supplier (MSDS no. 122-34-9) indicated that the acute oral LD50 for rats was >5,000 mg/kg of body weight. Based on 5,000 mg/kg as the oral LD50 in mice, the doses for the experimental groups were 400 mg/kg (highest dose, nearly 1/10 of LD50), 200 mg/kg (intermediate dose, nearly 1/20 of LD50), and 90 mg/kg (lowest dose, about 1/40 of LD50).
Materials
Simazine (99% purity) was purchased from Shanghai Kima Chemical Co., Ltd. ConA, lipopolysaccharide (LPS from Escherichia coli, serotype 055:B5), 3-(4,5-dimethylthiazol-2-yl)-2,5-diphenyltetrazolium bromide (MTT), and RPMI-1640 were purchased from Sigma (St. Louis, MO). Mouse fluorescein isothiocyanate (FITC) anti-CD3, R-phycoerythrin (PE) anti-CD4, and PE anti-CD8 antibodies, and the Annexin-V Apoptosis Detection Kit were all purchased from Pharmingen (Becton Dickinson Company, Franklin Lakes, NJ). Mouse Bcl-2 polyclonal, Bax monoclonal, Fas polyclonal, caspase-3 polyclonal, and β-actin polyclonal antibodies were purchased from Santa Cruz Biotechnology (Santa Cruz, CA). Alkaline phosphatase–labeled antimouse immunoglobin G and an alkaline phosphatase color visualization kit were purchased from Promega Biotech Co., Ltd (Madison, WI).
Measurements of Spleen-Relative Weights
During the course of the experiment, the body weights of BALB/c mice in each group were measured weekly. At the end of the experiment, mice were sacrificed by cervical dislocation and their spleens were removed. After the spleen weight was measured, its relative weight was determined using the following formula: relative weight = organ weight (mg)/body weight (g). After weighing the spleen, the spleen of each animal was cut into two pieces, one for histopathological analysis (details described below) and another piece for preparing cell suspensions.
Preparation of Spleen Cell Suspensions and in vitro Lymphocyte Proliferation Assays
Mice were anesthetized with intraperitoneal injections of sodium-pentobarbital (50 mg/kg). A part of the spleen was removed, teased apart using a steel mesh, filtered, and suspended in sterile saline. A part of the cell suspension (100 µl) was used for cell counting, and the remainder was centrifuged at 1,500 rpm/min for 5 min. The pellet was resuspended in RPMI-1640, supplemented with 10% fetal bovine serum and 1% antibiotics, and diluted to a concentration of 2 × 10⁶ cells/ml. ConA and LPS were used to stimulate T and B lymphocyte proliferation. A splenocyte suspension (100 µl) was exposed to the mitogens in a 96-well culture microtiter plate containing either LPS (1 µg/ml) or ConA (5 µg/ml). All of these experiments were done in triplicate. PRMI1640 medium without LPS and ConA was used as the control. The cells were cultured in a 37°C incubator with 95% air and 5% CO2 for 48 hr. At 4 hr before the end of cell culture, 5 mg/ml of MTT, 3-(4,5-Dimethylthiazol-2-yl)-2,5-diphenyltetrazolium bromide, solution (50 µl/well) was added. After a 4-hr culture at 37°C, 100 µl of Dimethyl sulfoxide (DMSO) was added to each well to dissolve the converted dye formazan. After 30 min, the plates were read for optical density (OD) values at a wavelength of 570 nm using a spectrophotometer.
Determination of T-Cell Subtypes
A monoclonal FITC-CD4 or CD8 antibody (20 µl) was added to 100 µl of a spleen cell suspension and incubated at room temperature for 15 min in the dark. After centrifugation, the cell suspension was washed twice in phosphate buffered saline (PBS). A total of 10,000 cells from each sample were analyzed by flow cytometry (BeckmanCoulter FC500) at 488 nm laser excitation. Cell Quest software was used for data acquisition. The assay was conducted in triplicate, and the percentage of positive cells was determined via comparisons with antibody isotype controls.
Analysis of Spleen Cell Apoptosis
An Annexin-V Apoptosis Detection Kit from Pharmingen (Becton Dickinson Company) was used according to the manufacturer’s instructions. Spleen cell suspensions were diluted to 1 × 10⁶/ml using Annexin-V binding buffer. Annexin V-FITC (5 µl) and propidium iodide (5 µl) were added to 200 µl of a cell suspension and incubated at room temperature for 15 min in the dark. After 400 µl of binding buffer was added, the cell suspension was examined with flow cytometry within 1 hr. A total of 10,000 cells per sample were analyzed using dual lasers at wavelengths of 488 nm and 635 nm. These experiments were done in triplicate.
Examinations of Germinal Centers in Spleen Tissue
Spleens were fixed in 10% formaldehyde overnight, dehydrated in an ethanol series, and embedded in paraffin. Coronal paraffin sections (7 µm thick) were deparaffinized with xylene and rehydrated. Tissue slides were then immersed in a Coplin jar containing fresh 15% H2O2 for 10 min, and then washed thoroughly in tap water. Tissue slides were stained with Harris’s hematoxylin for 15 min, and then washed in tap water. Counterstaining was achieved with 1% aqueous eosin Y and two drops of concentrated acetic acid for 5 min. Tissue slides were washed and air dried. Subsequently, samples were washed, dehydrated, and placed on cover slips with Permount (Fischer Scientific, Pittsburgh, PA). For observations of germinal center morphologies, tissue slides were photographed with a Leica TCS-2 microscope equipped with a D1X digital camera.
Western Blot Analysis of Apoptosis-Related Proteins
Mouse spleens were cut into pieces and homogenized in prechilled PBS. Spleen tissue (100 mg) was lysed in 500 µl of lysis buffer (50 mM Tris, pH 7.4; 1% Igepal; 150 mM NaCl; 1mM Ethylenediaminetetraacetic acid [EDTA]) and protease inhibitors (1 mg/ml protease inhibitor peptides, 1 mg/ml leucine aprotinin, 1 mg/ml pepstatin, 1 mM phenylmethanesulfonylfluoride (PMSF), 1 mM sodium vanadate, and 1 mM sodium fluoride). After the cellular lysate was centrifuged at 12,000 g for 5 min, the supernatants were separated, and protein concentrations were determined using the Bradford method. The supernatants were then mixed with 4× SDS (sodium dodecyl sulfate) loading buffer and boiled for 5 min. After the samples (40–60 µg per lane) were loaded and resolved on a10% polyacrylamide gel electrophoresis, the proteins were transferred to 0.22 µm nitrocellulose membranes. At room temperature, the membranes were blocked with 5% nonfat milk for 1 hr and incubated in TBST (Tris-Buffered Saline and Tween 20 mixture) (0.1% Tween-20) for 1 hr. The membranes were then incubated with antibodies against the following proteins: β-actin (diluted to 1:400); Bcl-2, Bax, Fas, and caspase-3 (each diluted to 1:300). The membranes were placed on a shaker at 4°C overnight. Finally, the membranes were incubated with Horseradish peroxidase-conjugated secondary antibodies (diluted to 1:5,000). Target bands were visualized using an enhanced chemiluminescence detection system (GE Healthcare, Little Chalfont, Buckinghamshire, UK). Western blots were scanned and quantified using GIS1000 software. The relative expressions of the target proteins were determined by their density and normalized against β-actin expression (i.e., OD ratio of the target protein = density of target protein band/ density of β-actin band).
Mouse Peritoneal Macrophage Phagocytosis of Chicken Red Blood Cells (RBCs)
Anticoagulated (0.1% heparin) venous blood was obtained from a chicken and washed 3 times with saline. Preparations of 2% chicken RBCs were made with saline and stored in Alsever’s solution (1:1) at 4°C. The sterile and filtered Alsever’s solution contained glucose (2.05 g), sodium citrate (0.80 g), and NaCl (0.42g) in 100 ml of distilled water.
Two ml of a 0.8% starch solution prepared in saline was injected intraperitoneally into mice to induce aseptic inflammation and the production of peritoneal macrophages. After 24 hr, a 2% chicken RBC suspension (1 ml) was also injected intraperitoneally. The mice were then decapitated after 30 min, and their abdomens were gently massaged. The abdomens were cut open, and peritoneal fluid was aspirated with a suction pipette. One drop was placed on a microscope slide, spread with a capillary tube, and air dried for 1 hr. The slide was then washed with distilled water to remove nonadherent cells, dried, fixed with a methanol solution, and dried again. The slide was then stained with Giemsa stain in a PBS.
Two hundred macrophages were counted using an oil immersion microscope lens. The number of macrophages that had phagocytosed chicken RBCs and the number of chicken RBCs phagocytosed by macrophages were recorded. Phagocytic rate = (number of macrophages that phagocytosed chicken RBCs/total number of counted macrophages) × 100%. Phagocytic index = (number of chicken RBCs phagocytosed by macrophages/total number of counted macrophages) × 100%.
Determination of NK Cell Activity by Lactate Dehydrogenase (LDH) Release by Target Cells
Target cells were YAC-1 cells that were passaged 24 hr before an experiment. These were washed three times with Hank’s balanced salts solution, and the cell concentration was adjusted to 4 × 10⁵ cells/ml using complete RPMI-1640 medium. Effector cells were from mouse spleens prepared as follows. Mouse was decapitated and the spleen was harvested under aseptic conditions. The spleen was gently ground with forceps to make a single cell suspension. The sample was filtered through a 200-mesh sieve and centrifuged at 1,000 rpm for 10 min. The supernatant was discarded, and the cells were resuspended. That is, 0.5 ml of sterile water was added initially, and 8 ml of Hank’s solution were added after 20 sec. The sample was centrifuged at 1,000 rpm for 10 min, and cells were resuspended in 1 ml of complete RPMI-1640. Cell viability was determined by trypan blue exclusion, with the number of viable cells required to be >95%. The cell concentration was adjusted to 2 × 10⁷cells/mL using RPMI-1640.
An LDH substrate solution was prepared with 2.5% Triton-X100. Lithium lactate (50 mM), nitrotetrazolium chloride (0.66 mM), 5-methylphenazinium methyl sulfate (0.28 mM), and oxidized coenzyme I (NAD [oxidized coenzyme A]; 1.30 mM) were dissolved in 0.2 M Tris-HCl buffer (pH 8.2). To detect NK cell activity by target cell LDH release, 100 µl each of target cells and effector cells were added to wells of a 96-well plate. For spontaneous LDH release, 100 µl each of target cells and medium were added to a well. For maximum LDH release, 100 µl each of target cells and 2.5% Triton-X100 were added to a well. All conditions were done in triplicate. The plates were incubated at 37°C with 5% CO2 for 4 hr, after which the 96-well plate was centrifuged at 1,500 rpm for 5 min. Supernatants (100 µl/well) were aspirated and transferred to wells of a flat-bottomed 96-well plate. At the same time, LDH substrate solution (100 µl) was added for 5 min. To stop the reaction, 1 M HCl (30 µl) was added and the OD was measured with a microplate reader at 490 nm. NK cell activity was determined by: NK cell activity (%) = [(test OD − spontaneous release OD)/(maximum release OD − spontaneous release OD)] × 100%.
Measurement of MDA Levels
MDA levels in spleen cells were determined using a kit (Nanjing Jiancheng Biotech, China) employing the thiobarbituric acid method. MDA levels were determined in accordance with the kit instructions. MDA levels (nmol / ml) = [(test tube OD – blank test OD)/(standard OD – blank test OD)] × concentration of standard × dilution.
Measurement of SOD Activity
SOD activity in spleen cells were determined using a kit (Nanjing Jiancheng Biotech) employing the xanthine oxidase method, according to the kit instructions.
Measurement of Spleen Cell Intracellular [Ca2+]i
A spleen cell suspension at 2 × 10⁶ cells/ml was prepared in 10% RPMI-1640 and 1.5 ml of this suspension was centrifuged. After the supernatant was discarded, 10% of 1,640 medium (1.5 ml) was added. The sample was preheated at 37°C for 5 min, and 30 µl of Fura-2/AM was added (0.25 mg of Fura-2/AM dissolved in 0.5 ml of DMSO; final concentration 5 µmol). The sample was mixed on an oscillator and incubated at 37°C for 45 min, and then washed twice with 10% of 1,640 medium. Finally, the cell suspension was adjusted to 106 cells/ml. A similar cell suspension was used as a blank control without Fura-2/AM loading. Intracytoplasmic esterase will hydrolyze Fura-2/AM into Fura-2, which binds to intracytoplasmic free Ca2+ to form Fura-2-Ca2+ complexes. The maximum excitation wavelengths of Fura-2 and Fura-2- Ca2+ are 380 nm and 340 nm, respectively, and their fluorescence intensity is proportional to Ca2+ concentration, from which intracellular [Ca2+]i can be determined.
Statistical Analysis
Results were presented as means ± standard deviations (SD) and group comparisons were by one-way analysis of variance followed by a Tukey’s post hoc test. Statistical significance was set at p < .05. Statistical analyses were performed with Statistical Package for the Social Science (SPSS) 15.0 statistics software (SPSS Inc., Chicago, IL).
Results
Changes in Body and Relative Spleen Weights after Simazine Exposure
BALB/c mice (10 mice/group) were exposed to simazine doses of either 0 (distilled water), 90, 200, or 400 mg/kg by gastric gavage for 3 weeks. During the 3 weeks of exposure, a trend for increasing body weight was noted in each group, but there were no significant differences in body weight between the four groups (Figure 1A). After 3 weeks of treatment, there was an apparent dose-dependent decrease in relative spleen weight. The relative spleen weight of the 400 mg/kg of simazine exposure group was significantly lower than that of the control group (0.32 vs. 0.44; p = .011; Figure 1B).
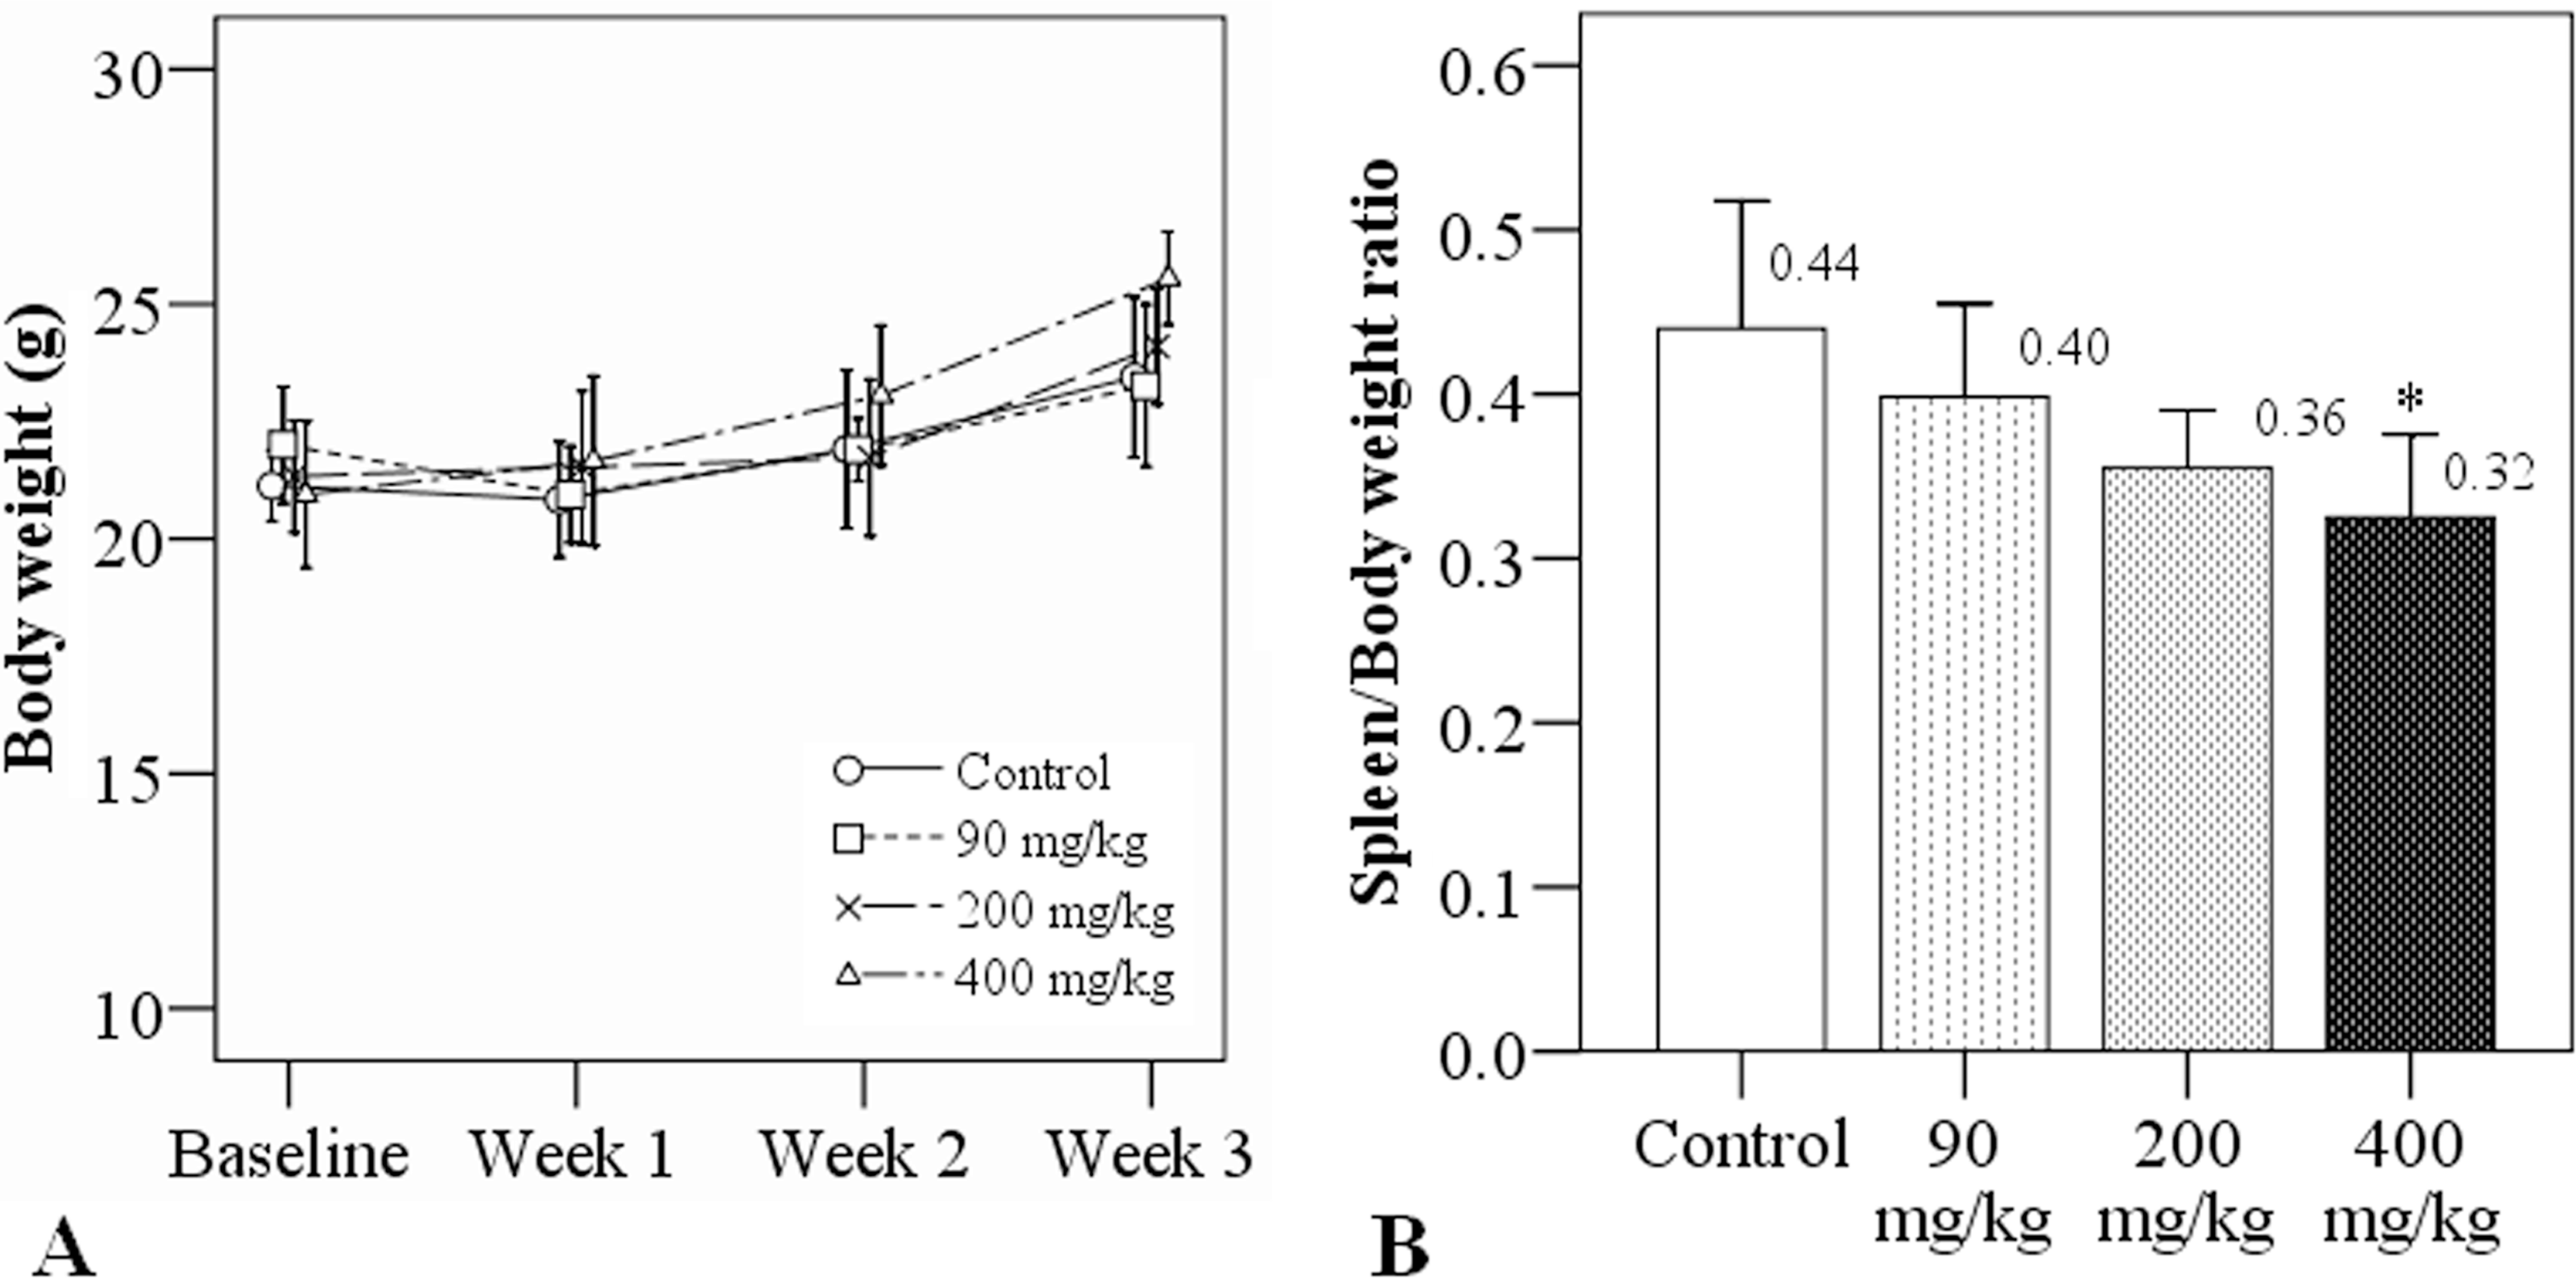
Body weights and relative spleen weights of mice after 21 days of oral exposure to simazine. (A) Weekly body weights during the course of simazine exposure. (B) Relative spleen weights after 3 weeks of simazine exposure. Relative spleen weight = spleen weight (g)/body weight (g). N = 10 mice/group. *indicates a significant difference as compared to the control group.
Spleen Lymphocyte Proliferation after Simazine Exposure
After 3 weeks of treatment, there were no significant differences in splenic cellularity between the control and simazine at 90 mg/kg groups (Figure 2A). However, splenic cellularity was significantly reduced in the two groups that received simazine at 200 and 400 mg/kg, as compared to the control and simazine at 90 mg/kg (p ≤ .01; Figure 2A). Additionally, splenic cellularity was significantly decreased in the simazine at 400 mg/kg group as compared to the simazine at 200 mg/kg group (p < .001).
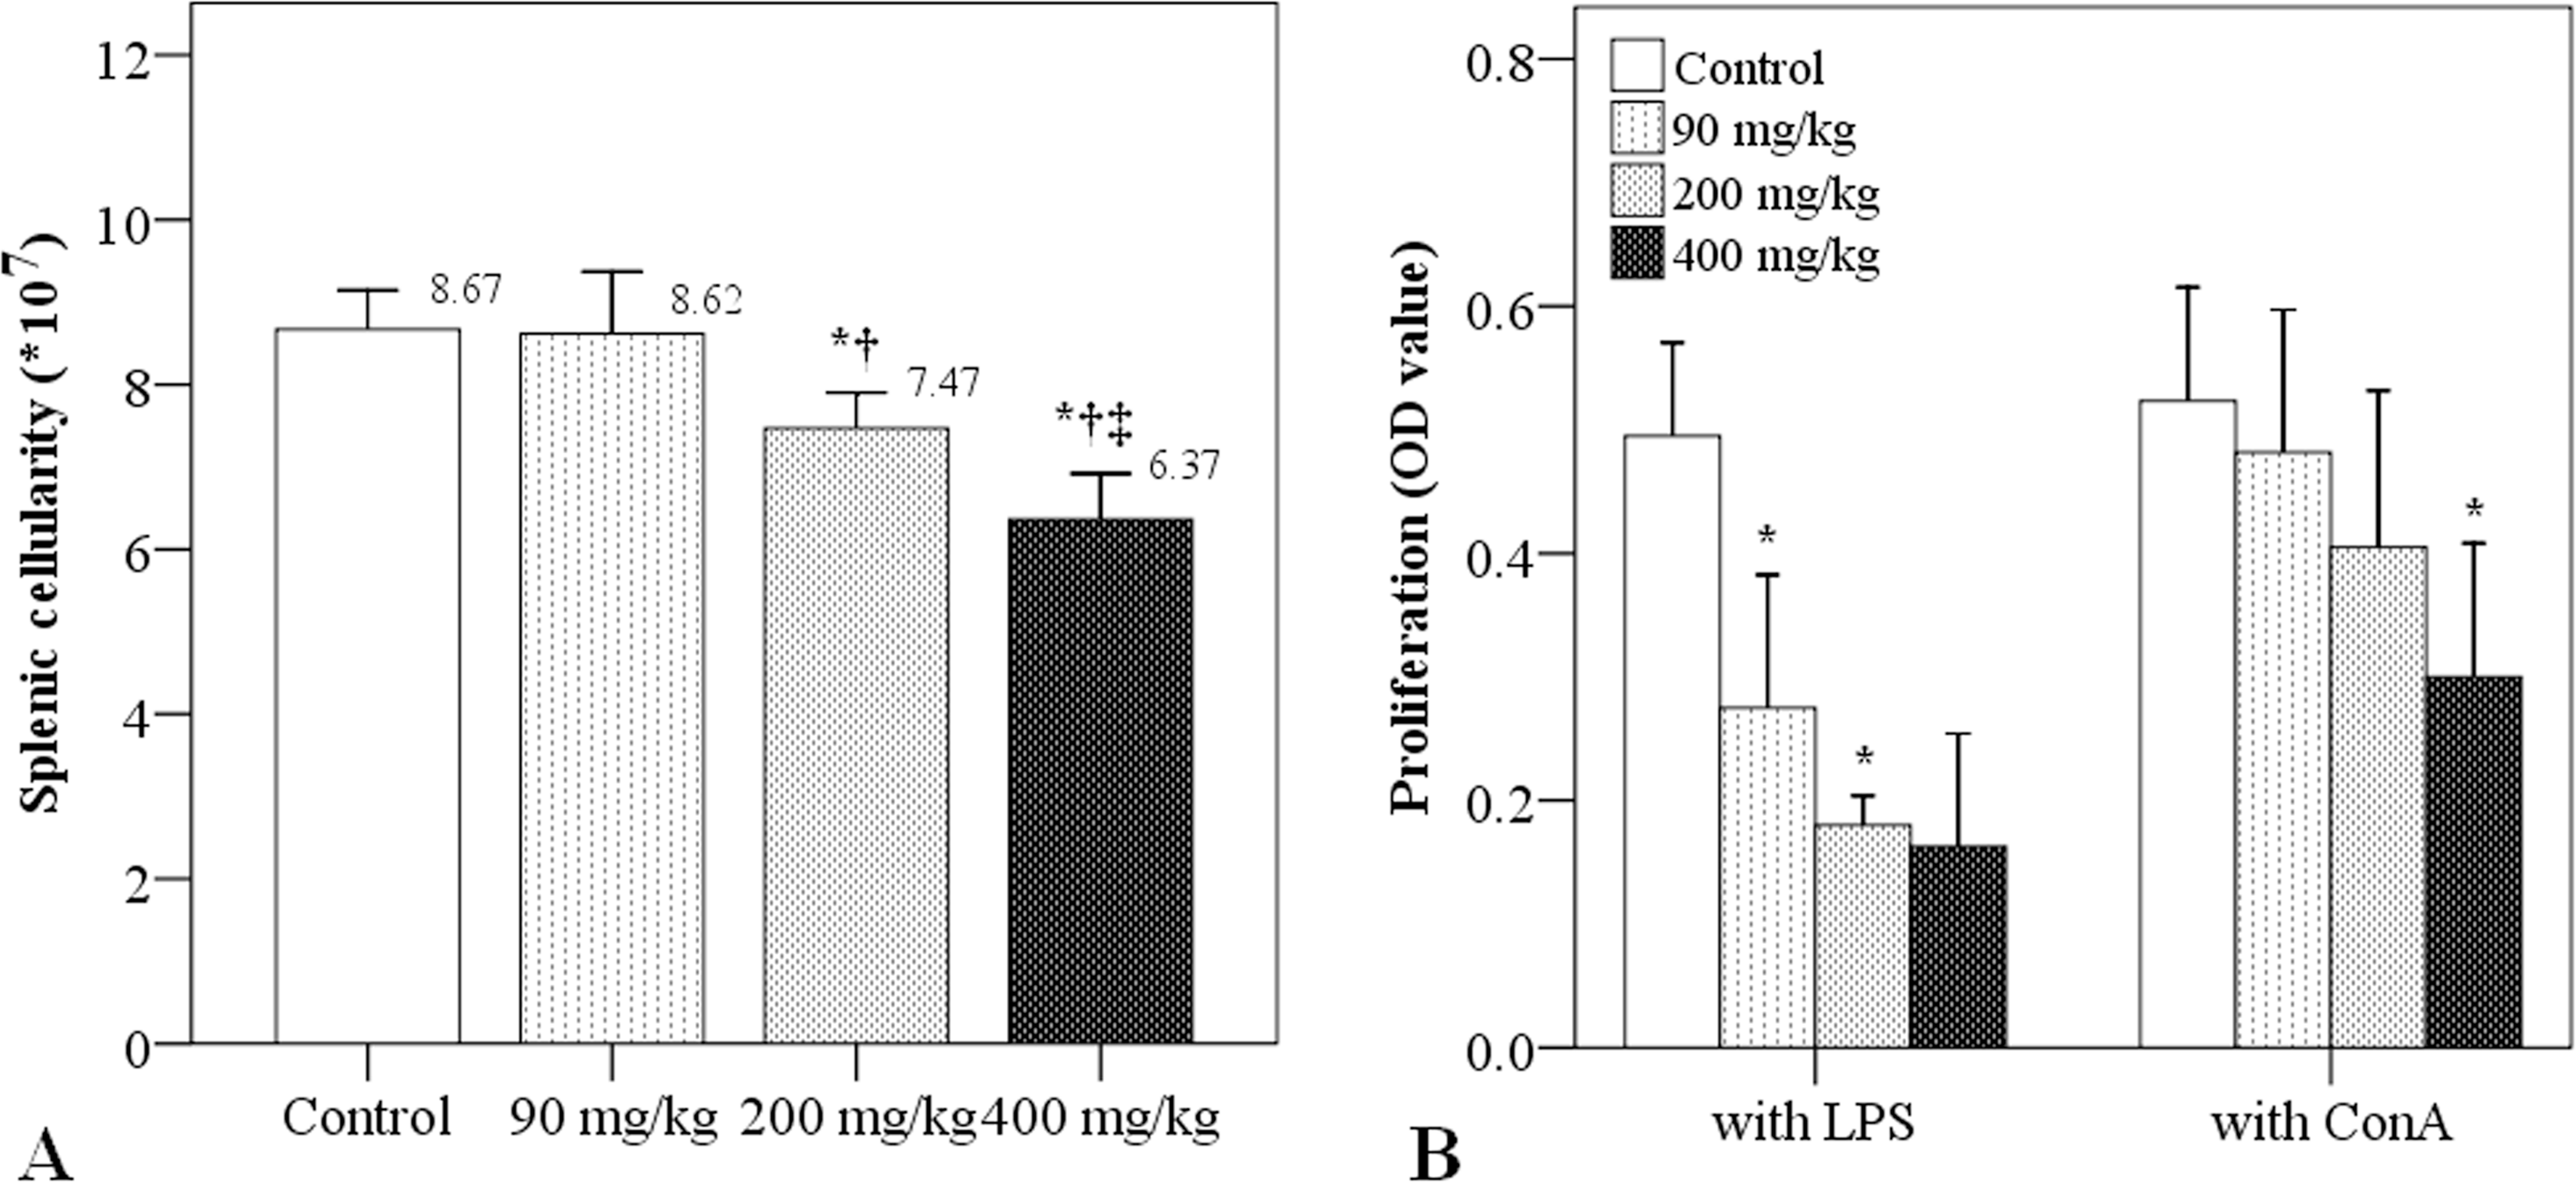
Effects of simazine on splenic cellularity and proliferation of splenic T and B cells. (A) Splenic cellularity after 3 weeks of simazine exposure. (B) Spleen lymphocyte proliferation after 3 weeks of simazine exposure. B-cell proliferation was stimulated by lipopolysaccharide (LPS; 1 µg/ml) and T-cell proliferation was stimulated by ConA (5 µg/ml). N = 10 mice/group. *indicates a significant difference as compared to the control group. †indicates a significant difference as compared to the simazine at 90 mg/kg group. ‡indicates a significant difference as compared to the simazine at 200 mg/kg group.
MTT assays were used to evaluate proliferation of splenic lymphocytes. LPS was used to stimulate B lymphocyte proliferation and ConA was used to stimulate T lymphocyte proliferation. Both spleen B and T lymphocyte proliferation decreased in a simazine dose-dependent manner (Figure 2B). B lymphocyte proliferation was significantly lower in the simazine at 90 and 200 mg/kg groups, as compared to the control group (0.28 and 0.18 vs. 0.50; p < .01), whereas T lymphocyte proliferation was significantly lower in the simazine at 400 mg/kg group, as compared to the control group (0.30 vs. 0.52; p < .001).
Changes in Spleen T Lymphocyte Subsets after Simazine Exposure
The percentages of different T lymphocyte subtypes in the spleen after simazine exposure were determined via flow cytometry (Figure 3). There was an apparent dose-dependent increase in the percentages of spleen CD3+ T lymphocytes contents, where the percentage of CD3+ cells was significantly higher in the simazine at 400 mg/kg group, as compared to the control group (60.62% vs. 46.13%; p = .012; Figure 3A). In contrast, in regard to spleen CD4+ T lymphocytes, there was a dose-dependent decrease in the percentages of positive cells, while the percentages of CD8+ T cells were not affected by simazine exposure (Figure 3A).
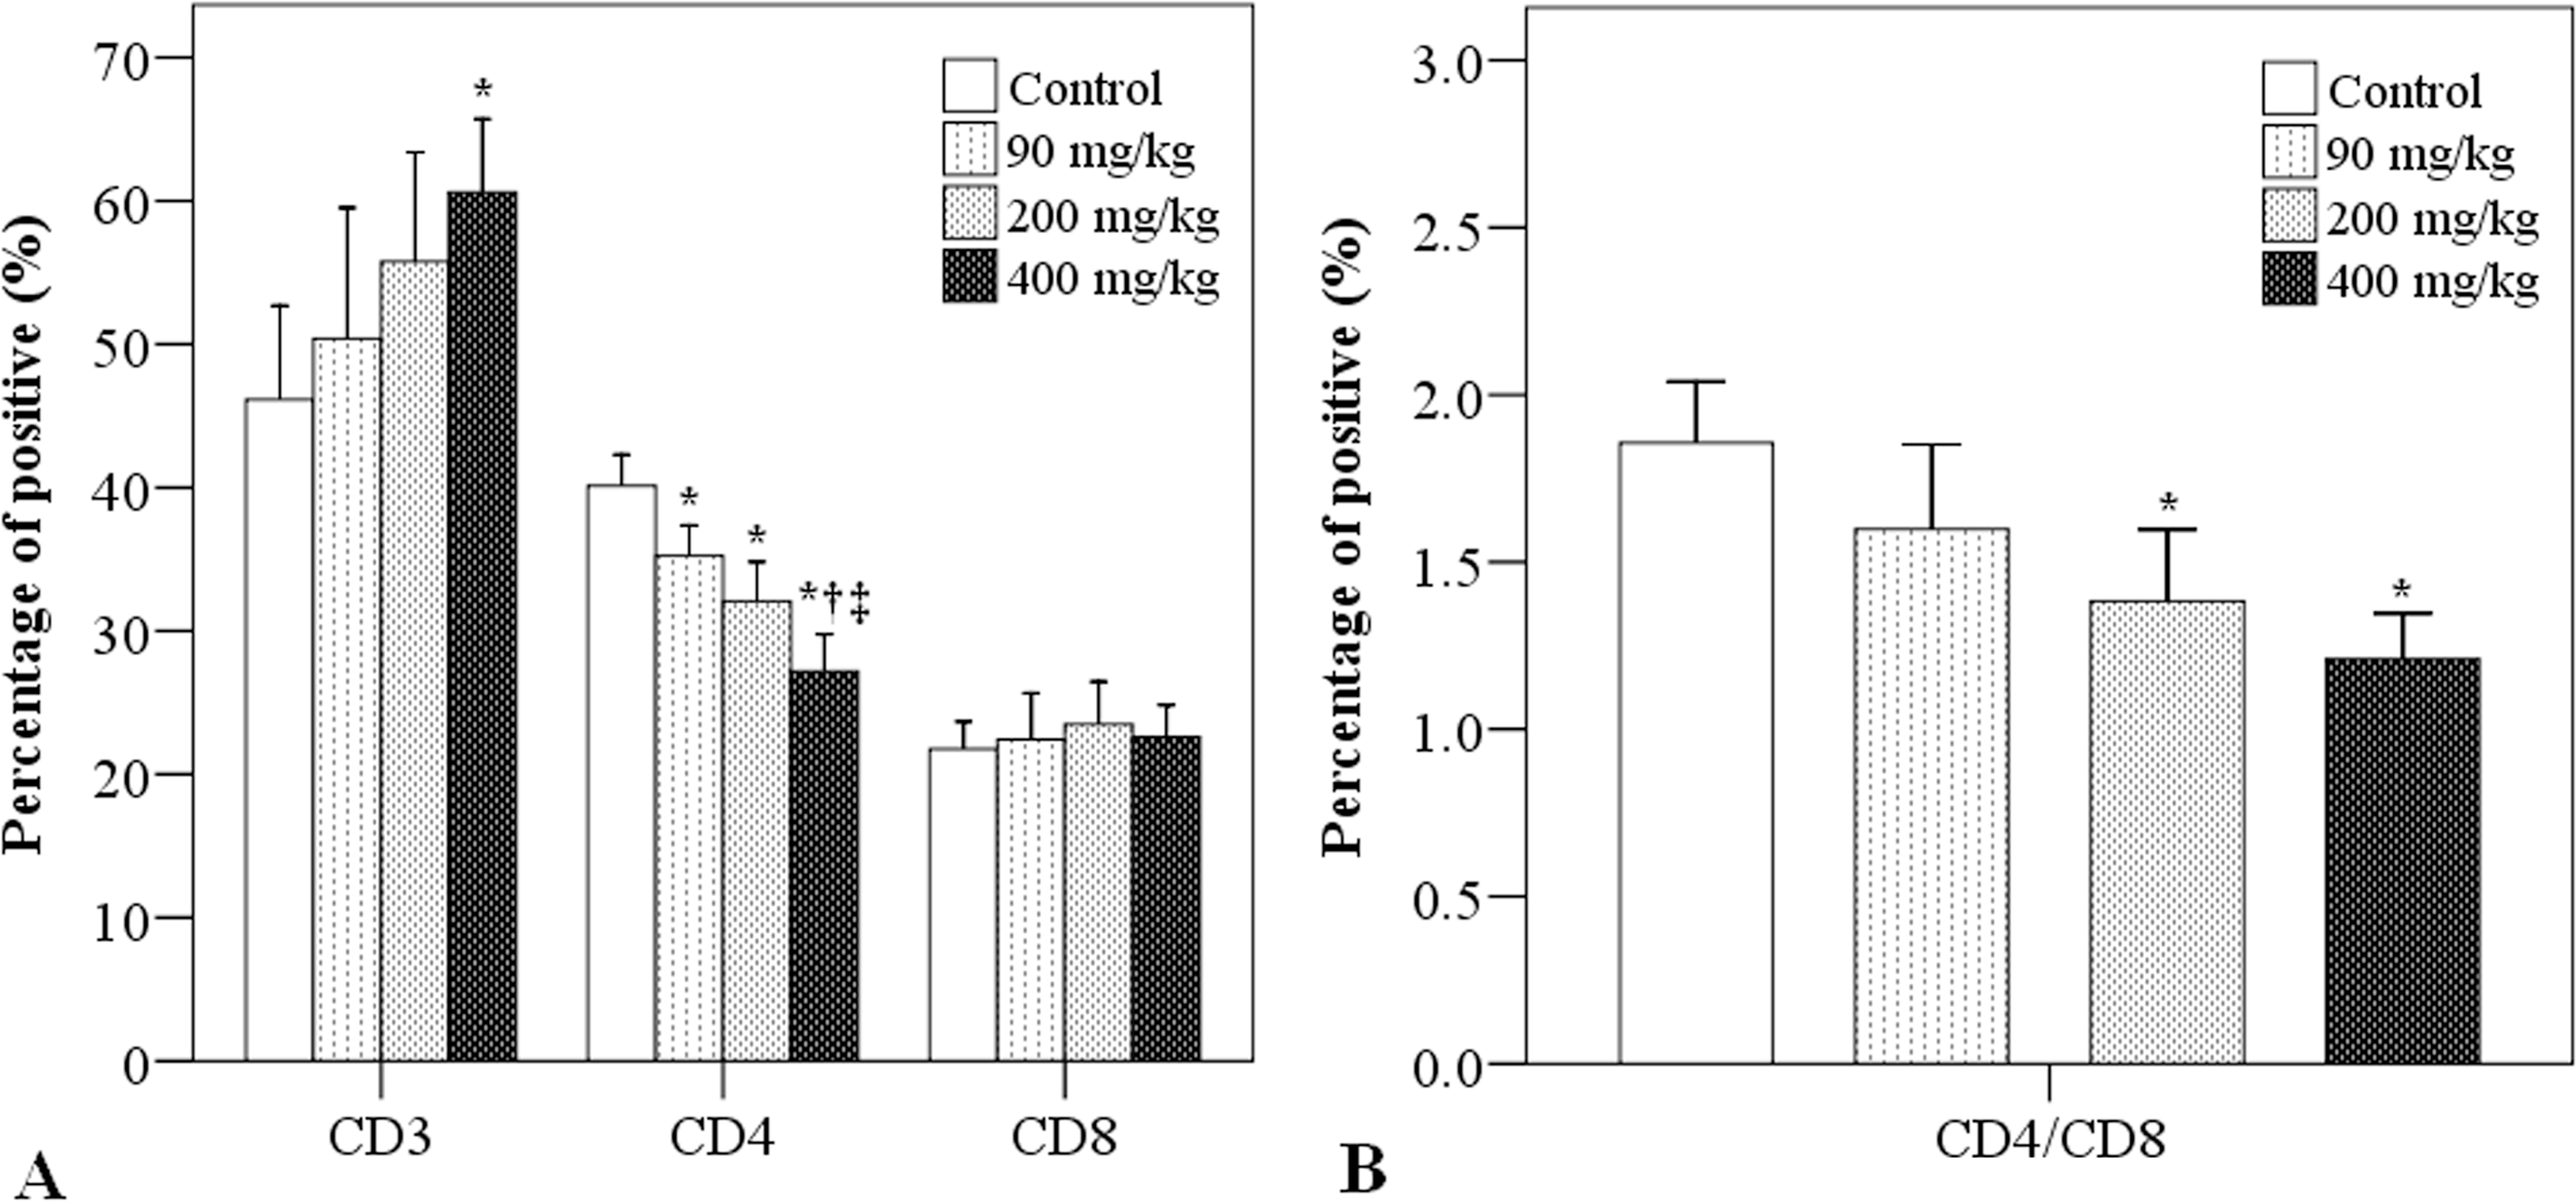
Effects of simazine on spleen T-cell subtypes. After 3 weeks of simazine exposure, flow cytometry was used to determine (A) the percentages of spleen CD3+, CD4+, and CD8+ T cells and (B) CD4/CD8 T-cell ratios. N = 10 mice/group. *indicates a significant difference as compared to the control group. †indicates a significant difference as compared to the simazine at 90 mg/kg group. ‡indicates a significant difference as compared to the simazine at 200 mg/kg group.
The ratio of spleen CD4+/CD8+ T cells decreased with increasing doses of simazine (Figure 3B). The CD4+/CD8+ ratios in the simazine at 200 and 400 mg/kg groups were significantly lower than in the control group (1.38 and 1.21 vs. 1.86, p < .01).
NK Cell Cytolytic Activity
Spleen NK cell cytolytic activity toward YAC-1 target cells decreased in a simazine dose-dependent manner (Table 1). The level of NK cell cytolytic activity was significantly lower in the three simazine groups as compared to the control group. The NK cell cytolytic activities in the simazine at 200 and 400 mg/kg groups were significantly lower than that of the simazine at 90 mg/kg group (p < .001), and the NK cell activity in the simazine at 400 mg/kg group was significantly lower than in the simazine at 200 mg/kg group (p < .001).
Effects of simazine on apoptosis rate, natural killer (NK) cell activity, Ca2+, superoxide dismutase (SOD), and malondialdehyde (MDA).
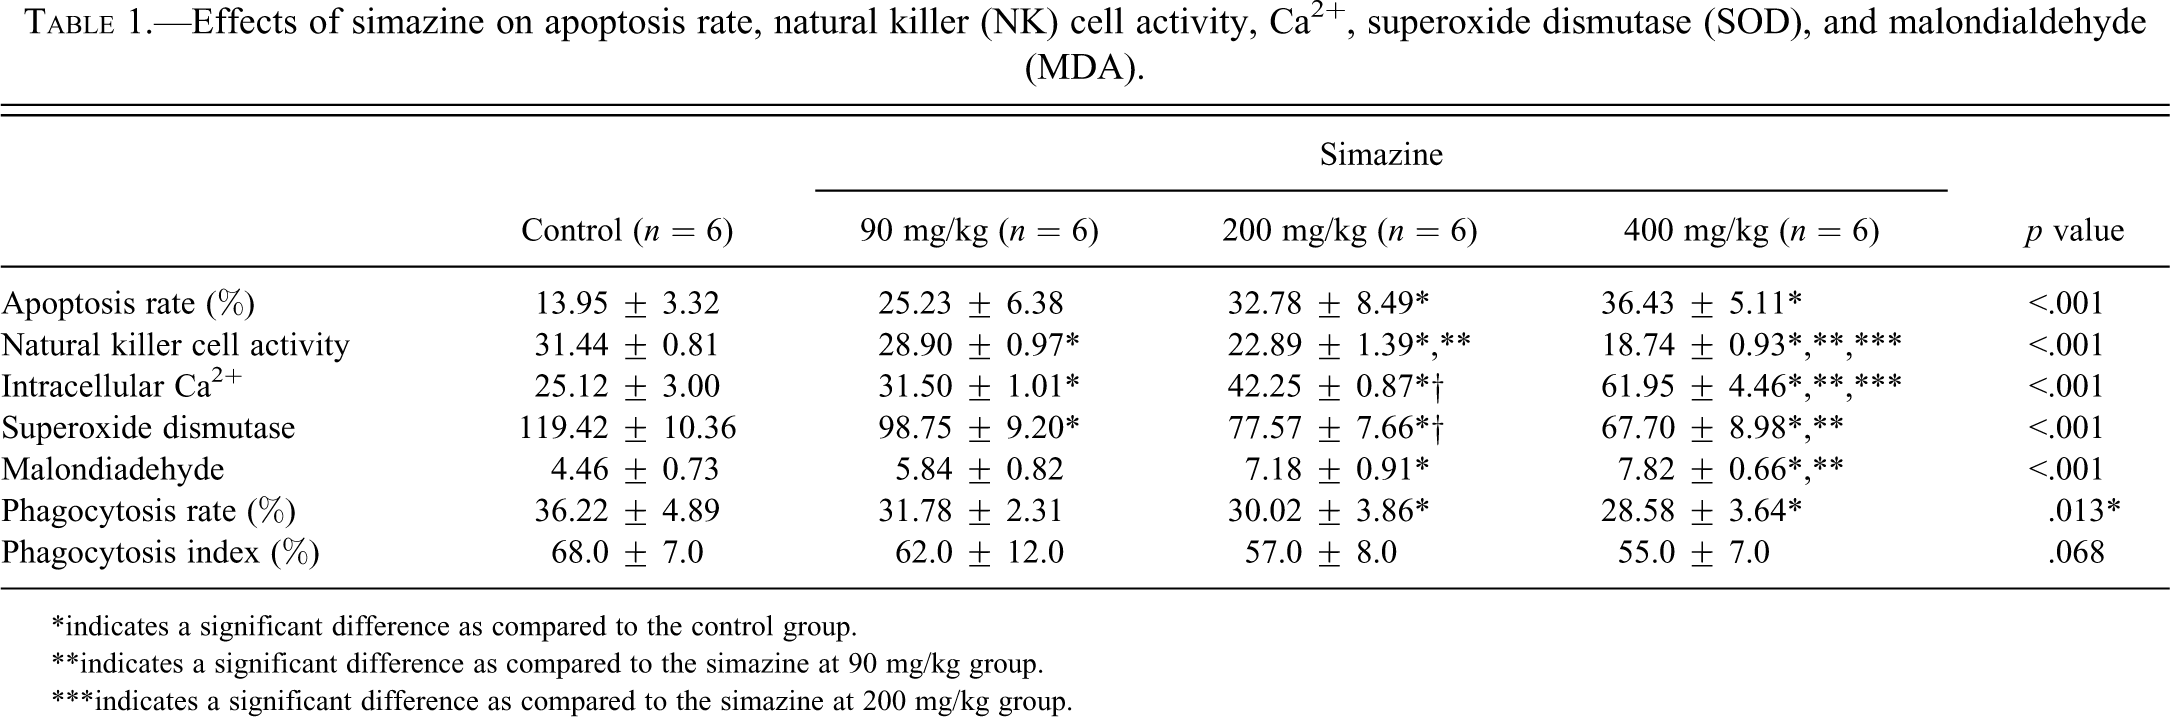
*indicates a significant difference as compared to the control group.
**indicates a significant difference as compared to the simazine at 90 mg/kg group.
***indicates a significant difference as compared to the simazine at 200 mg/kg group.
Spleen Cell Intracellular Ca2+
Spleen cell intracellular concentrations of Ca2+ increased in a simazine dose-dependent manner (Table 1). The intracellular concentration of Ca2+ was significantly higher in the three simazine groups, as compared to the control group (p < .01). The concentrations of Ca2+ in the simazine at 200 and 400 mg/kg groups were significantly higher than that of the simazine at 90 mg/kg group (p < .001), and the concentration of Ca2+ in the simazine at 400 mg/kg group was significantly higher than that of the simazine at 200 mg/kg group (p < .001).
Spleen Cell SOD and MDA Levels
Spleen cell SOD activity decreased in a simazine dose-dependent manner (Table 1). SOD activity was significantly lower in the three simazine groups, as compared to the control group (p < .01). Also, SOD activity in the simazine at 200 and 400 mg/kg groups were significantly lower than that of the simazine at 90 mg/kg group (p < .01).
In contrast, spleen cell MDA levels increased with increasing doses of simazine. MDA levels in the two higher simazine dose groups were significantly higher than that of the control group (p < .001; Table 1). Additionally, the MDA level was significantly higher in the simazine at 400 mg/kg group, as compared to the simazine at 90 mg/kg group (p < .001).
Spleen Cell Phagocytosis
We determined both the phagocytosis rate and the index for mouse peritoneal macrophages, where the rate reflected the percentage of macrophages that phagocytosed chicken RBCs, whereas the index reflected the number of RBCs phagocytosed per macrophage. As shown in Table 1, the phagocytosis rates in the simazine at 200 and 400 mg/kg groups were significantly lower than that of the control group (30.02% and 28.58% vs. 36.22%). However, there were no apparent changes in the phagocytosis indices due to simazine exposure (Table 1).
Apoptosis of Spleen Cells
As shown in Table 1, the apoptosis rate of spleen cells (expressed as a percentage of apoptotic cells) increased in a simazine dose-dependent manner. The apoptosis rates in the simazine at 200 and 400 mg/kg groups were significantly higher than that of the control group (p < .001).
Apoptosis-Related Proteins in Spleen Tissue after Simazine Exposure
Using Western blot analysis, the expression levels of Bcl-2 protein in mouse spleens were found to be decreased with increasing simazine dose (Figure 4). In the 400 mg/kg group, the expression of Bcl-2 protein was significantly lower than that of the control group (0.71 vs. 0.94; p = .008). In contrast, the expression of Fas protein increased with increasing simazine dose and was significantly higher in the 400 mg/kg group compared to the control group (1.08 vs. 0.73, p = .002). Expression of the caspase-3 protein was also increased with increasing simazine dose, and was significantly higher in the 400 mg/kg group than the control group (0.86 vs. 0.60; p = .001).
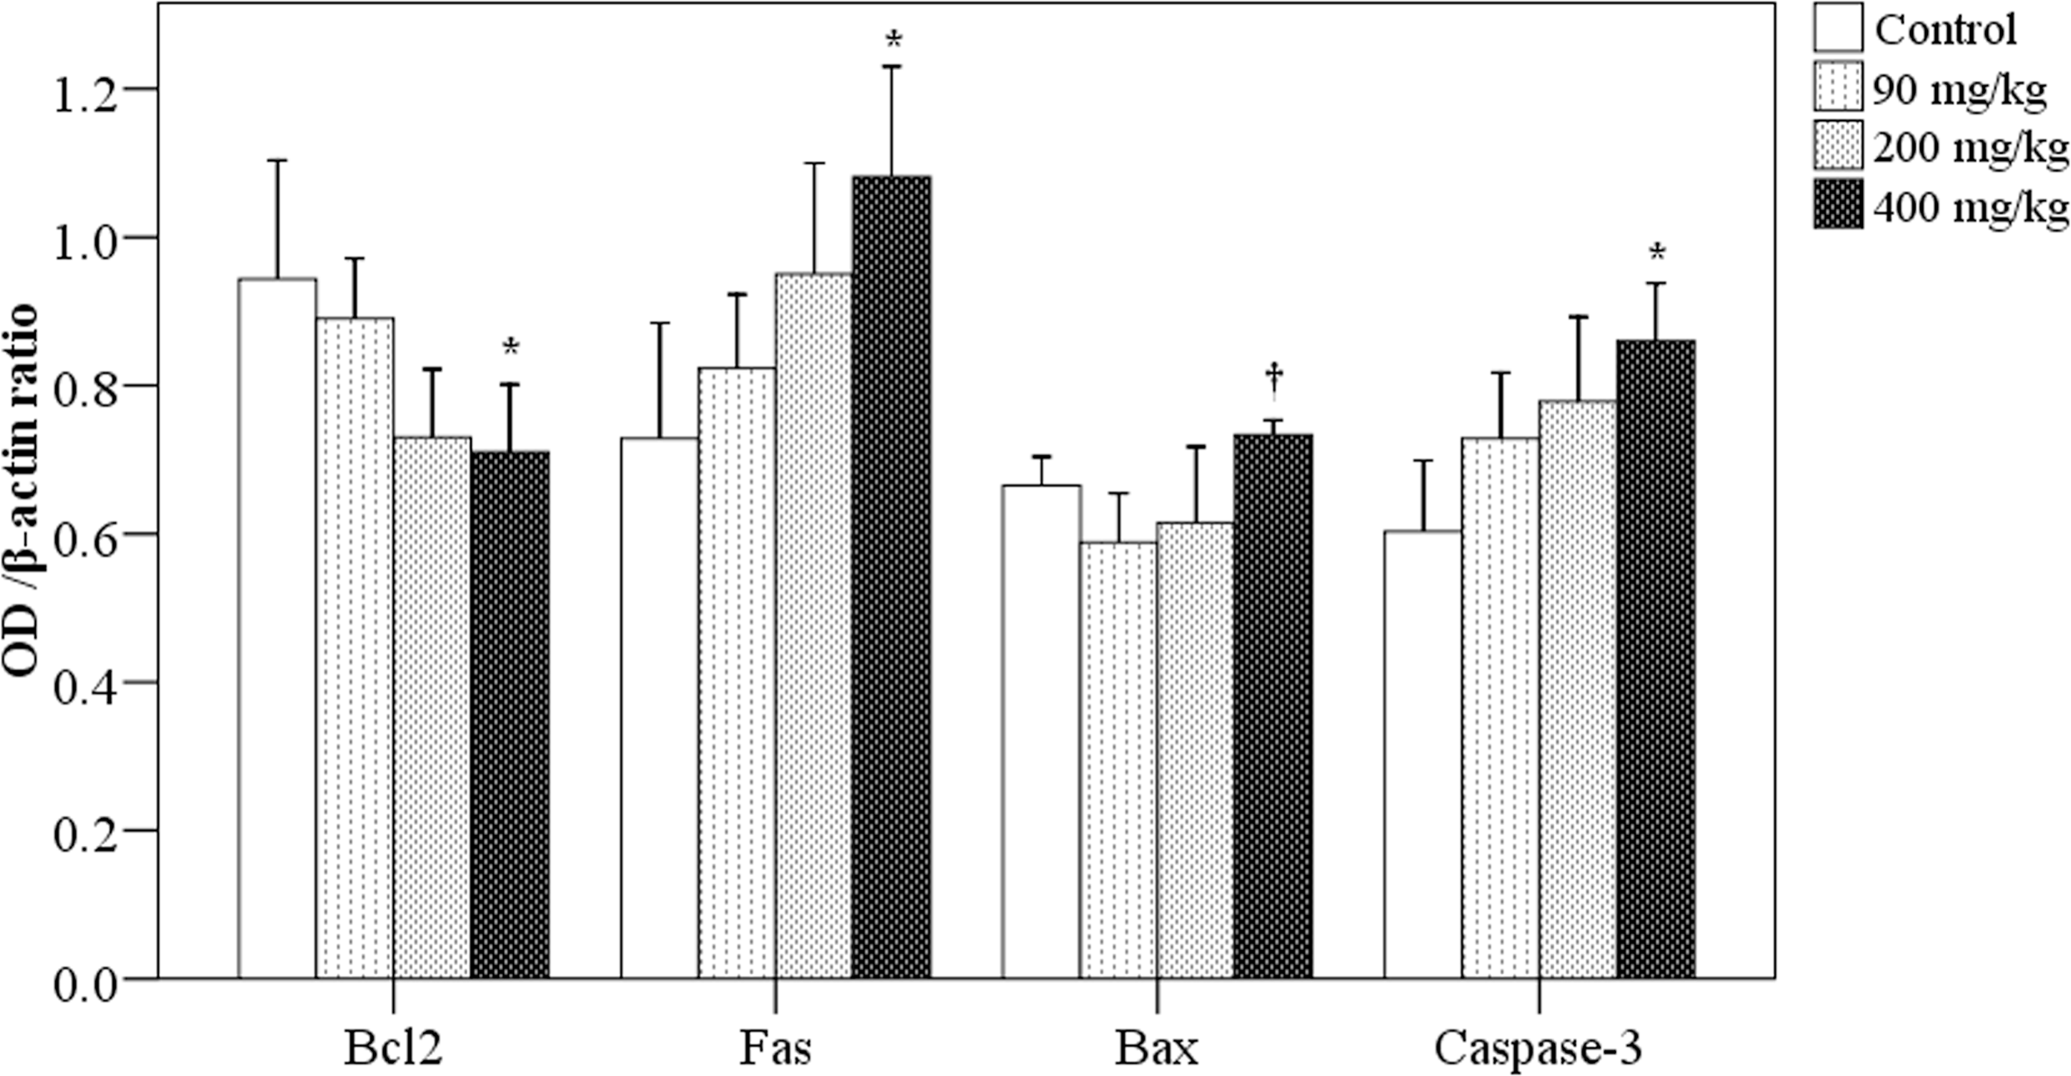
Effects of simazine on apoptosis-related protein expressions in spleen tissue. By Western blot analysis, the ratios of target protein/β-actin were determined in each group for Bcl-2, Fas, Bax, and Caspase-3. N = 10 mice/group. *indicates a significant difference as compared to the control group. †indicates a significant difference as compared to the simazine at 90 mg/kg group.
Alterations in Spleen Germinal Centers and Germinal Center Cells after Simazine Exposure
Spleen tissue sections were stained to evaluate the potential changes in spleen germinal center morphology after exposure to simazine. Figure 5 presents the representative micrographs of germinal centers in the four exposure groups of mice (0, 90, 200, and 400 mg/kg). It was found that with increasing simazine dose, germinal centers (arrows) significantly reduced in size. These data corroborate our findings that higher simazine doses are associated with increased apoptosis in spleen cells.
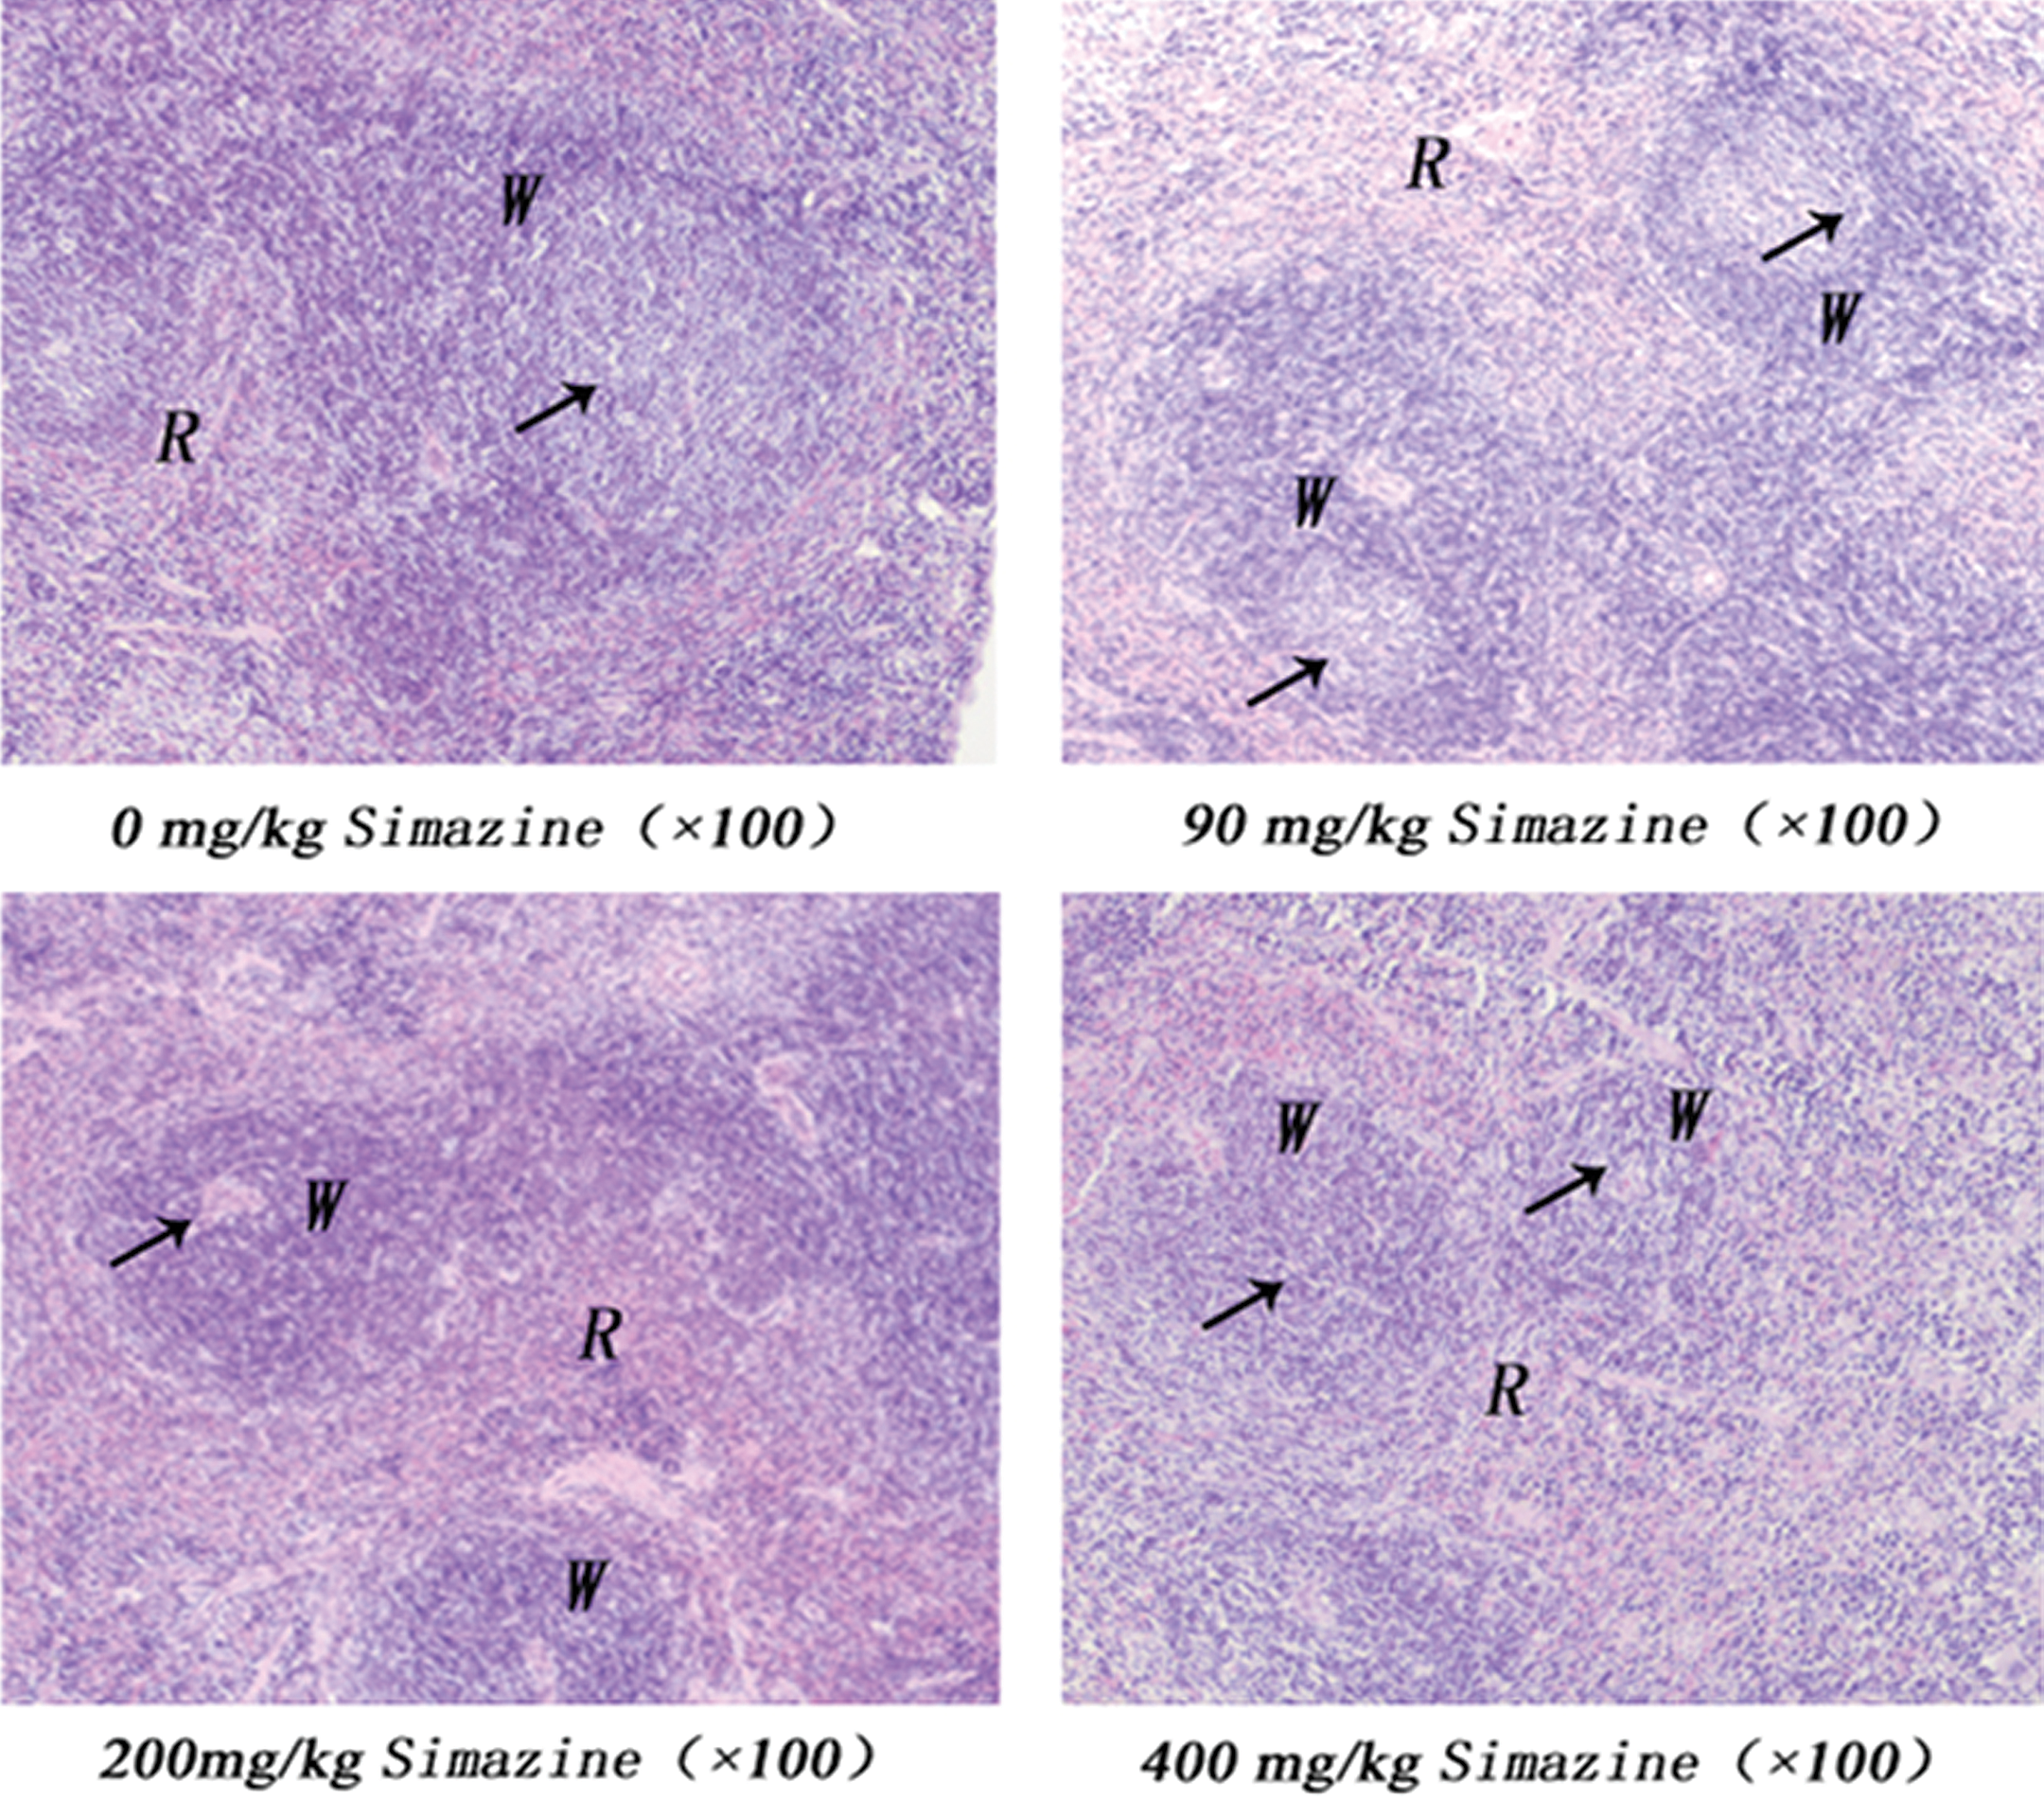
Effects of 0, 90, 200, and 400 mg/kg of simazine on germinal center morphology. Spleen tissue sections were prepared and stained, as described in the Materials and Methods section, to evaluate germinal center morphology via light microscopy. R: spleen red pulp; W: white pulp; arrows indicate germinal centers. Germinal centers reduced in size with increasing simazine dose.
Discussion
Simazine is one of the most commonly used triazine herbicides in agriculture. The wide use and potential cumulative effects of these chemicals have raised concerns regarding the potential human health risks associated with these herbicides. However, there is limited information available about the potential adverse health effects of simazine. Most studies on simazine toxicity have focused on identifying its general toxic effects, while little research has been done on its possible immunotoxicological effects. In humans, the immune system plays pivotal roles in both maintaining the general physiological condition and providing defense against harmful agents and pathogens.
Many chemicals from the environment can disturb immune system function via multiple mechanisms. Previous studies have reported that a number of chemically induced immunotoxic effects were immunosuppressive (Tryphonas et al. 1991; Wood et al. 1992; Karrow et al. 2005; Rowe, Brundage, and Barnett 2008). In animals, immune suppression due to chemicals/herbicides can cause pathological changes in the spleen and may even lead to apoptosis of immune cells (Gao et al. 2008). In the present study, we investigated whether simazine could cause generalized immunotoxicity and, in particular, induce apoptosis of splenic lymphocytes in BALB/c mice.
After 3 weeks of oral exposure to simazine (90, 200, or 400 mg/kg), the body weights of exposed mice were relatively unchanged compared to control group mice (0 mg/kg). However, Kim et al. (2003) found that 300 mg/kg simazine reduced the body weights of C57BL/6 mice and the relative weights of immune organs (i.e., the thymus and spleen). Consistent with this, we found that simazine at 200 and 400 mg/kg also significantly reduced the relative spleen weight of BALB/C mice (Figure 1).
One of the pioneering studies in immunotoxicology by Luster et al. (1992) reported that spleen weights outside the normal reference ranges could be considered an important indicator of potential immunotoxicity, possibly due to the inhibition of lymphocyte proliferation and induction of lymphocyte apoptosis (Kamath et al. 1997). The spleen weights relative to the body weights of mice in our 200 and 400 mg/kg simazine exposure groups were significantly lower than that of the control group. Thus, our results for spleen weights relative to the body weights indicate simazine-induced immunotoxicity.
As general indicators of simazine-induced immunotoxicity, we found that both spleen NK cell cytotoxic activity and peritoneal macrophage phagocytosis were significantly reduced, particularly at the higher doses of simazine exposure (200 and 400 mg/kg; Table 1). While we did not explore the specific mechanisms that may be associated with these immune functional declines, simazine appears to have an effect on both innate and specific immune functions.
In spleen immune cells, higher doses of simazine exposure (200 and 400 mg/kg) resulted in increased intracellular [Ca2+] (Table 1), suggesting that these increases may be limited to alterations in cell membrane permeability, as previously reported in rat RBCs (Scott et al. 1985; Singh et al. 2010). We also found abnormal responses to oxidative stress. These included decreased SOD activity, which moderates the generation of free radical species, and increased levels of MDA, which is a marker of lipid peroxidation (Table 1). These findings are in general agreement with abnormal responses to environmental stressors and the induction of immunotoxitiy (Pruett et al. 2003; Pruett et al. 2009). Additional investigations are needed to determine whether these abnormal physiological responses are linked to the general immunosuppressive effects associated with simazine exposure.
In addition to these general immunotoxic effects of simazine exposure, we found simazine-induced effects on lymphocytes. The spleen contains both mature B cells and T cells, which play important roles in cell-mediated immune responses. Some studies have shown that the inhibition of lymphocytic proliferation in the spleen can induce immunotoxicity (Kamath et al. 1997; Karrow et al. 2005; Gao et al. 2008). In the present study, the inhibitory effects of simazine on cell proliferation were confirmed via MTT reduction assays. After in vivo simazine exposure, we found significant reductions in both spleen T- and B-cell proliferation after stimulating these cells in vitro with the mitogens ConA and LPS, respectively (Figure 2). These results suggested that simazine could inhibit the proliferation of T and B lymphocytes in mice.
We also analyzed spleen T lymphocyte subsets after exposure to simazine with flow cytometry. The CD4+ and CD8+ subsets of CD3+ T lymphocytes are primarily involved with the immune responses to specific antigenic challenges and in immune regulation. Filipov et al. (2005) found that the triazine pesticide, atrazine, reduced the number of spleen CD4+ and CD8+ cells, suggesting that triazine herbicides may influence cellular immune function. However, we found that simazine had little impact on spleen CD8+ T cells, but it did significantly decrease the number of CD4+ cells (Figure 3). This resulted in a change in the ratio of CD4+/CD8+ cells in the spleen. CD4+ T cells are essential for both cell-mediated and antibody-mediated acquired immune responses. These results suggest that simazine may selectively suppress CD4+ T cells function.
In addition, simazine could cause some morphological changes in the spleen of treated mice. We found that germinal centers in the spleens of simazine-exposed mice were significantly reduced in a dose-dependent manner compared to those in the control group. These findings are in accordance with our other finding that higher simazine doses are associated with increased apoptosis in spleen cells. Together with the results of reduced spleen weights, simazine may act as an immune toxic agent by inducing apoptotic processes.
Apoptosis plays an essential role in lymphoid development and homeostasis in vertebrates (Steller 1995), and it also appears to be involved in the regulatory processes within the immune system. As a peripheral lymphoid organ, the spleen stores activated immune cells, and spleen lymphocytes are very sensitive to apoptotic signals. We observed early microscopical changes associated with apoptosis in the spleens of mice treated with simazine (results not shown) and also found evidence for an increased rate of apoptosis for spleen immune cells in vitro (Table 1), indicating that simazine may act as an apoptotic stimulus. We also found altered expressions of apoptosis-related proteins in spleen cells (Figure 4).
The Bcl and Fas gene families are closely related to the development of the immune system and the regulation of immune responses (Steller 1995). The Bcl-2 family proteins are major suppressors of apoptosis. Among them, Bcl-2 is one of the most active and can inhibit apoptosis caused by many factors (Steller 1995). Bcl-2 functions as both an ion channel and a docking protein. Enhanced expression of Bcl-2 can prevent increased mitochondrial permeability induced by apoptotic stimulus, which inhibits apoptosis by stabilizing the mitochondrial membrane (Deng, Lin, and Wu 2003). In contrast, Bax is a proapoptotic protein, which can regulate apoptotic signal transduction to the mitochondria (Moroy et al. 1993).
We found decreased levels of Bcl-2 in simazine-exposed spleen cells compared to the control group. However, there were no significant changes in Bax expression. These results suggested that simazine may downregulate Bcl-2 expression and, thus, increase the proportion of immune cells undergoing apoptosis.
Fas is a typical glycosylated membrane protein that belongs to the nerve growth factor/TNF receptor superfamily (Castro et al. 1996). After binding to its ligand (FasL), Fas can form a trimer that mediates signal transduction and leads to apoptosis. Fas-mediated apoptosis may be partly inhibited by Bcl-2 (Castro et al. 1996). We found that simazine upregulated the levels of Fas in spleen cells, suggesting that simazine may increase apoptosis by increasing Fas expression.
Caspases, represented by a family of cysteine proteases, are also key proteins for modulating the apoptotic response. Caspase-3 is the key inducer of apoptosis, which is activated by an initiator caspase, such as caspase-9. These activated caspases cleave numerous cellular substrates, ultimately leading to cell death (Earnshaw, Martins, and Kaufmann 1999; Wang et al. 2007). Activated caspase-3 can trigger a self-amplification cascade, which may directly act on cytoskeletal proteins in the cytosol or directly activate nuclear DNAase and lead to DNA breakage and apoptosis. Therefore, caspase-3 plays a key role in the induction of apoptosis. We also showed that the expression of caspase-3 in the spleen was increased with an increasing dose of simazine, suggesting that simazine may induce apoptosis by enhancing expression of caspase-3. However, more studies are needed to investigate the specific mechanisms of simazine-altered apoptosis of splenic lymphocytes.
Conclusion
In summary, we found that oral simazine exposure may influence immune functions of mice. Simazine could reduce the relative weights of the spleen (i.e., relative to body weight), decrease the proliferation of T and B lymphocytes, alter the ratio of splenic T lymphocyte subtypes, inhibit the cytolytic activities of NK cells, and inhibit the phagocytotic capabilities of peritoneal macrophages. In regard to general physiological responses, simazine altered Ca2+ metabolism, SOD activity, and MDA levels of mouse spleen cells, which reflect the altered responses to physiological and oxidative stress. Importantly, simazine increased the rate of apoptosis among spleen immune cells and concomitantly upregulated the expressions of caspase-3 and Fas, and downregulated the expression of Bcl-2, which may trigger apoptosis of immune cells. However, more studies on the immune toxic mechanisms of simazine and other triazine herbicides are warranted.
Footnotes
The author(s) declared no potential conflicts of interest with respect to the research, authorship, and/or publication of this article.
This work was supported by the National Nature Science Foundation of China (NO. 30571580).
Abbreviations
Acknowledgments
This work was supported by the National Nature Science Foundation of China (NO. 30571580). The authors thank the staff of the Key Lab of Etiological Epidemiology of Ministry of Public Health in the Centre for Endemic Disease Control, Chinese Centre for Disease Control and Prevention.