
Abstract
Novel urinary protein biomarkers for the detection of acute renal damage, recently accepted by the U.S. Food and Drug Administration, European Medicines Agency, and Pharmaceuticals and Medical Devices Agency (Japan), now have to be validated in practice. Limited data regarding the performance of these acute markers after subacute or subchronic treatment are publicly available. To increase the area of applicability of these markers, it is important to evaluate the ability to detect them after 28 days of treatment or even longer. Wistar rats were treated with three doses of cisplatin, vancomycin, or puromycin to induce renal damage. Twelve candidate proteins were measured by Luminex xMAP–based WideScreen assays, MesoScale Discovery–based MULTI-SPOT technology, or RENA-strip dipstick assay after 28 days. Treatment with all three model compounds resulted in a dose-dependent increase in urinary biomarkers, specific for the observed areas within the nephron, determined histopathologically. The most promising biomarkers in this study were NGAL, Kim-1, osteopontin, clusterin, RPA-1, and GSTYb1, detected by multiplexing technologies. The RENA-strip dipstick assay delivered good diagnostic results for vancomycin-treated but not for cisplatin- or puromycin-treated rats. Taken together, the data show that these new biomarkers are robust and measurable for longer term studies to predict different types of kidney toxicities.
Keywords
Introduction
In the pharmaceutical and chemical industries, the kidney is routinely assessed during preclinical safety evaluations. The importance of the kidney as a central detoxification organ means that there is an extraordinary exposure of renal tissue to drugs, reactive metabolites, or environmental compounds. This exposure can lead to cell damage, primarily due to high blood flow, xenobiotic metabolism, and clearance (Werner and Costa 1995). It has been reported that the frequency at which drug-induced nephrotoxicity occurs, relative to other drug-induced toxicities, is 2% to 20% (Khan 2002). The reason for this variation may be due to the difficulty of assessing renal toxicity using traditional markers, which are insensitive, as is the case with blood urea nitrogen (BUN) and serum creatinine. Although both are direct measurements of renal function, increases in serum concentrations of these biomarkers occur only after substantial renal injury, generally after loss of two thirds of the nephrons’ functional capacity (Pfaller and Gstraunthaler 1998). In the case of acute kidney injury (AKI), the degeneration of renal tissue can appear between days and weeks (Bellomo et al. 2004; Lameire, Van Biesen, and Vanholder 2005).
For improved detection of acute nephrotoxicity, a panel of novel urinary kidney biomarkers was recently approved by the U.S. Food and Drug Administration, European Medicines Agency, and Pharmaceuticals and Medical Devices Agency (Japan). An investigation of leading pharmaceutical companies, together with the nonprofit Critical Path Institute (C-Path), led to the discovery and subsequent evaluation of 23 urinary proteins and a large number of transcriptional biomarkers in the rat (Dieterle et al. 2010; Ozer et al. 2010). Only eight of these markers have been accepted for the detection of AKI in preclinical studies up to 14 days. Table 1 gives an overview of the measured biomarkers in this study. Because the majority of the studies performed by Predictive Safety Testing Consortium (PSTC) members included study time points of 1, 3, 7, and 14 days, for an improved risk assessment, it is absolutely necessary to generate further information about the kinetics of the markers, as well as to test the ability to use them in subacute (28 days) or subchronic (commonly 90 days) preclinical rodent studies. Therefore, the following work is focused on addressing if and how several urinary biomarkers perform after 28 days of treatment with model nephrotoxic compounds. There is also little information about the quality of commercially available assays for the detection of these biomarkers (Fuchs and Hewitt 2011).
Overview of the measured biomarkers, the presumed prediction of the damage location, and their status of acceptance by the U.S. Food and Drug Administration (FDA) and European Medicines Agency (EMA).
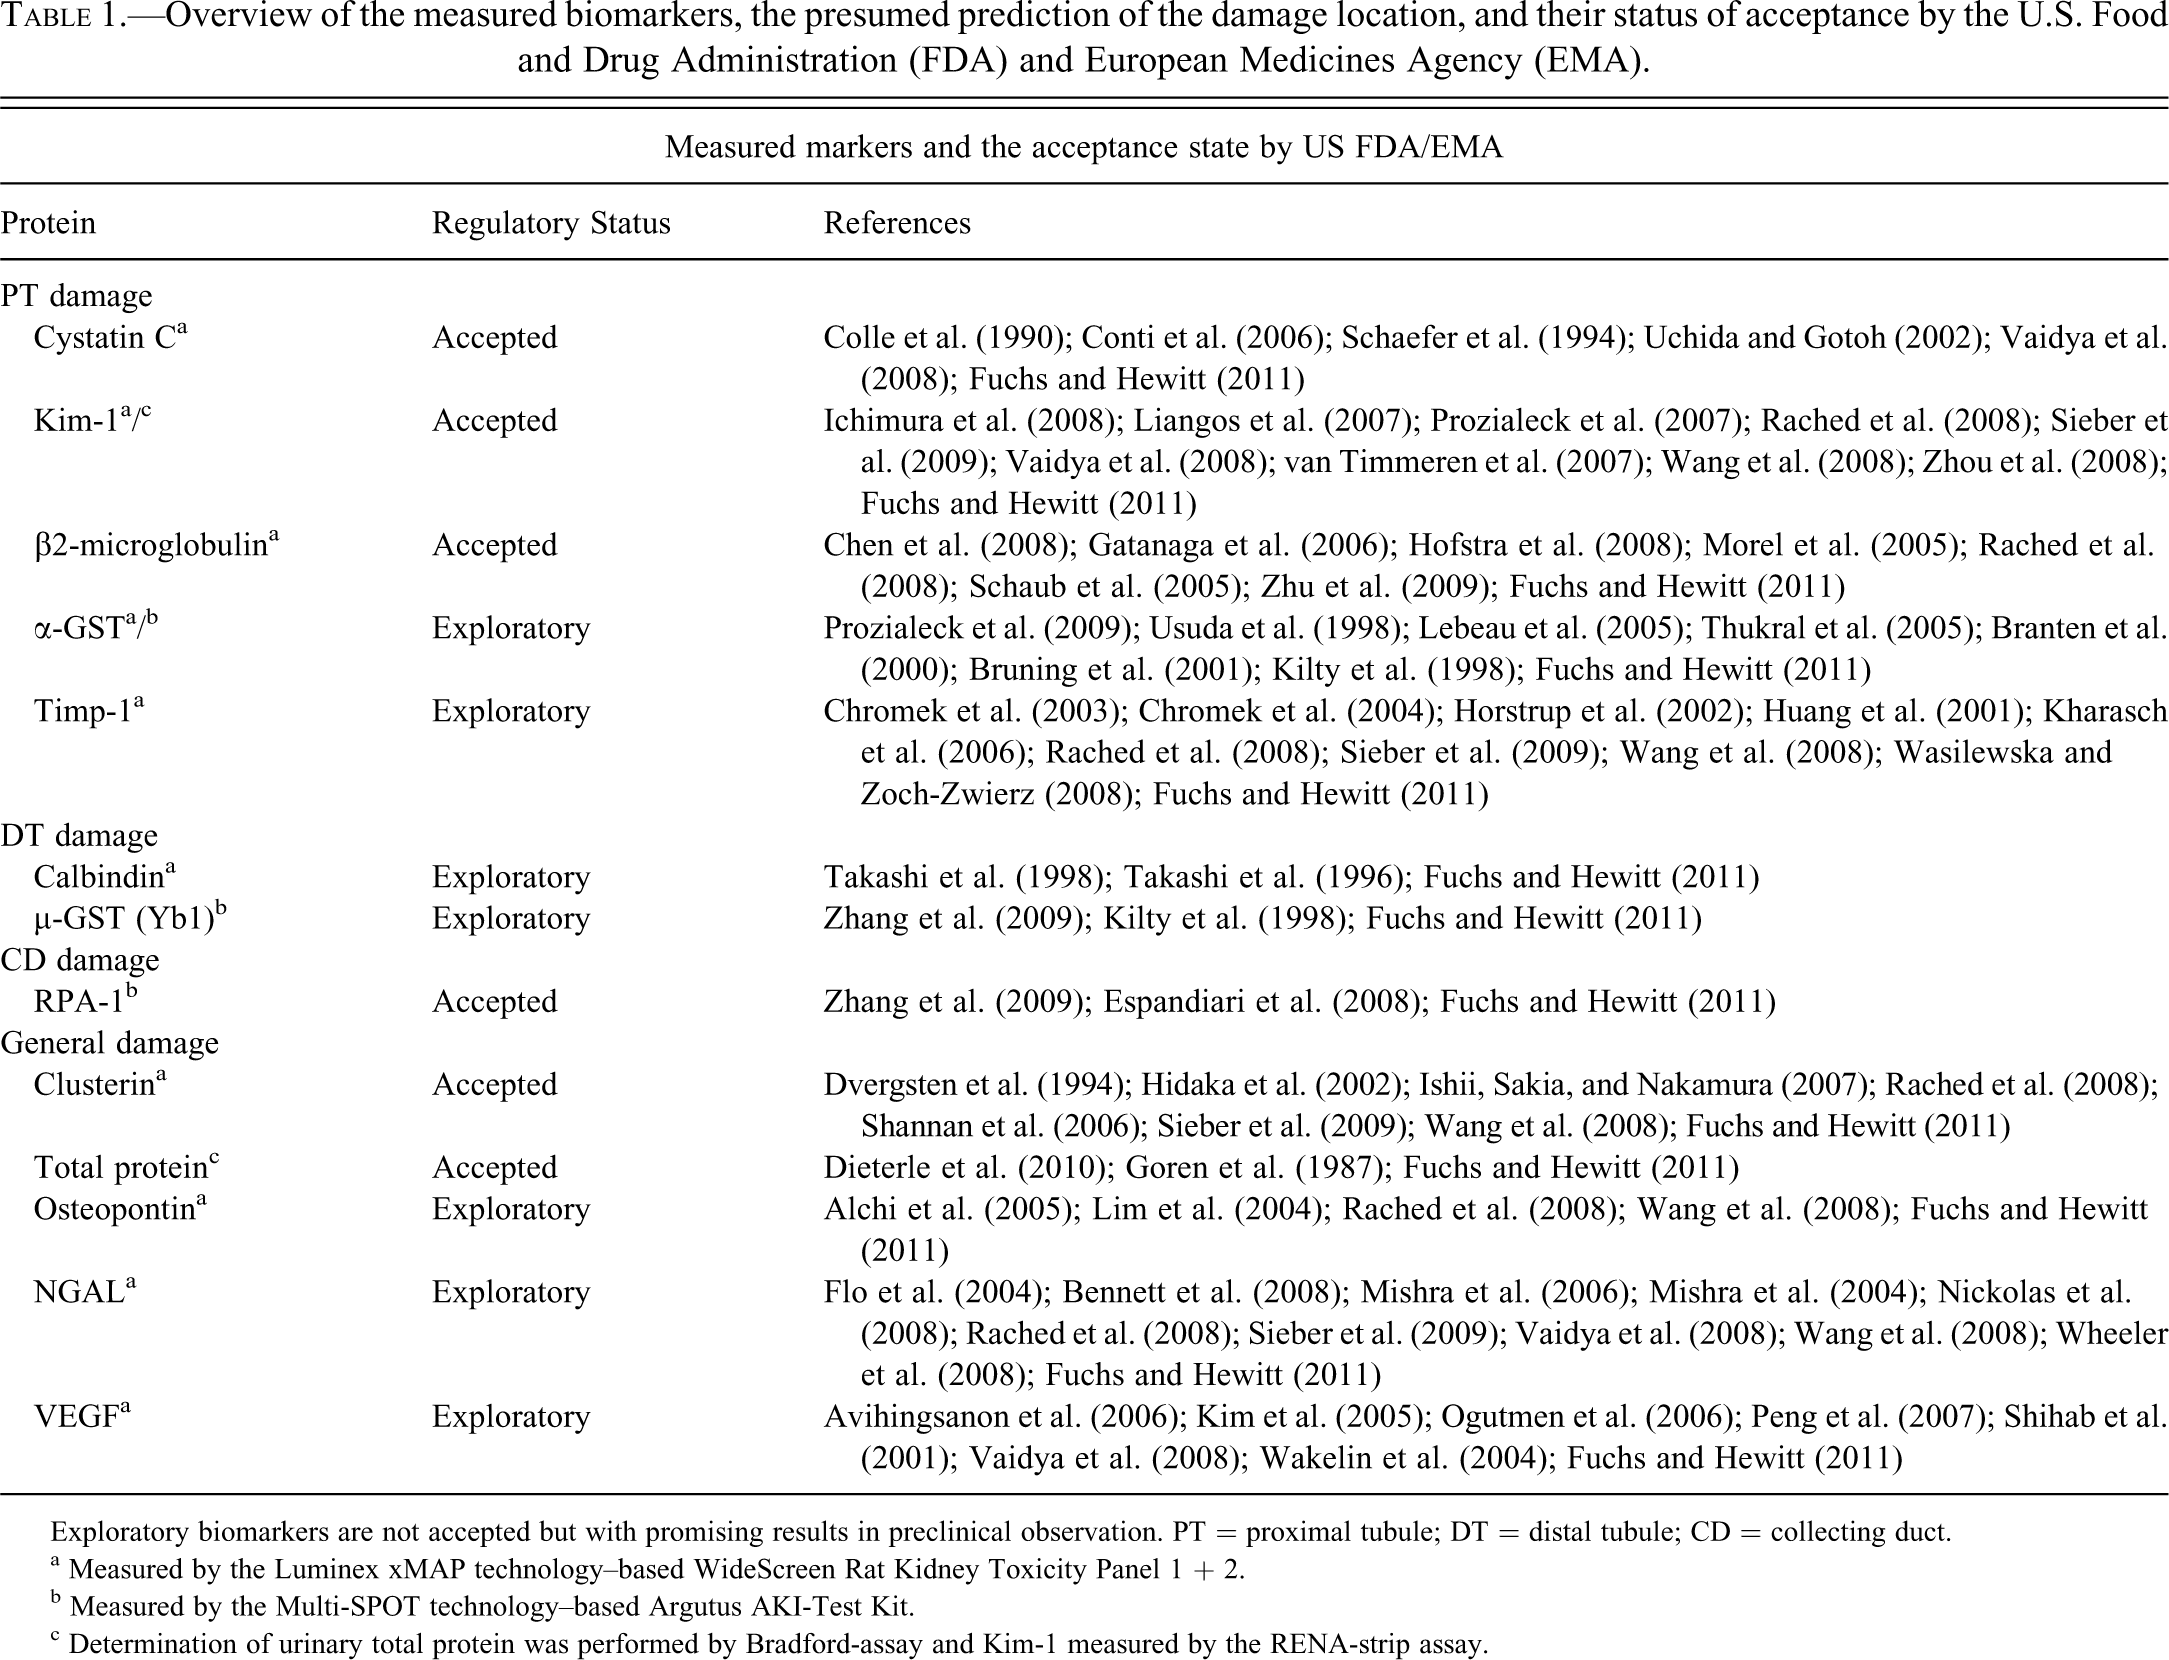
Exploratory biomarkers are not accepted but with promising results in preclinical observation. PT = proximal tubule; DT = distal tubule; CD = collecting duct.
a Measured by the Luminex xMAP technology–based WideScreen Rat Kidney Toxicity Panel 1 + 2.
b Measured by the Multi-SPOT technology–based Argutus AKI-Test Kit.
c Determination of urinary total protein was performed by Bradford-assay and Kim-1 measured by the RENA-strip assay.
In this study, six Wistar rats (3 female, 3 male) were treated with three well-described model compounds (cisplatin, vancomycin, puromycin) at three doses (Table 2) for up to 28 days. The candidate proteins were measured in urine on day 28 by the WideScreen Rat Kidney Toxicity Assays and the Argutus Medical AKI-Test Kit. In addition, the RENA-strip dipstick assay for Kim-1 was tested. These commercially available test systems are designed for the early detection of AKI and based on different biomarker sets with only limited overlapping proteins. Consequently, the focus here is not the direct comparison of the technologies but their ability to detect drug-induced renal damage. A direct comparison was performed only for Kim-1 by linear regression and Bland-Altman analysis to identify the potential overall comparability of different technologies and to determine if it is possible to define a threshold of effect. For interpretation of the data, standard clinicochemical and histopathological observations were performed. The ability to predict compound-dependent renal damage and distinguish it from acute renal failure associated with other risk factors has the potential to positively affect the attrition rate during drug development.
Overview of the low, mid, and high doses used for the treatment of rats with cisplatin, vancomycin, and puromycin.
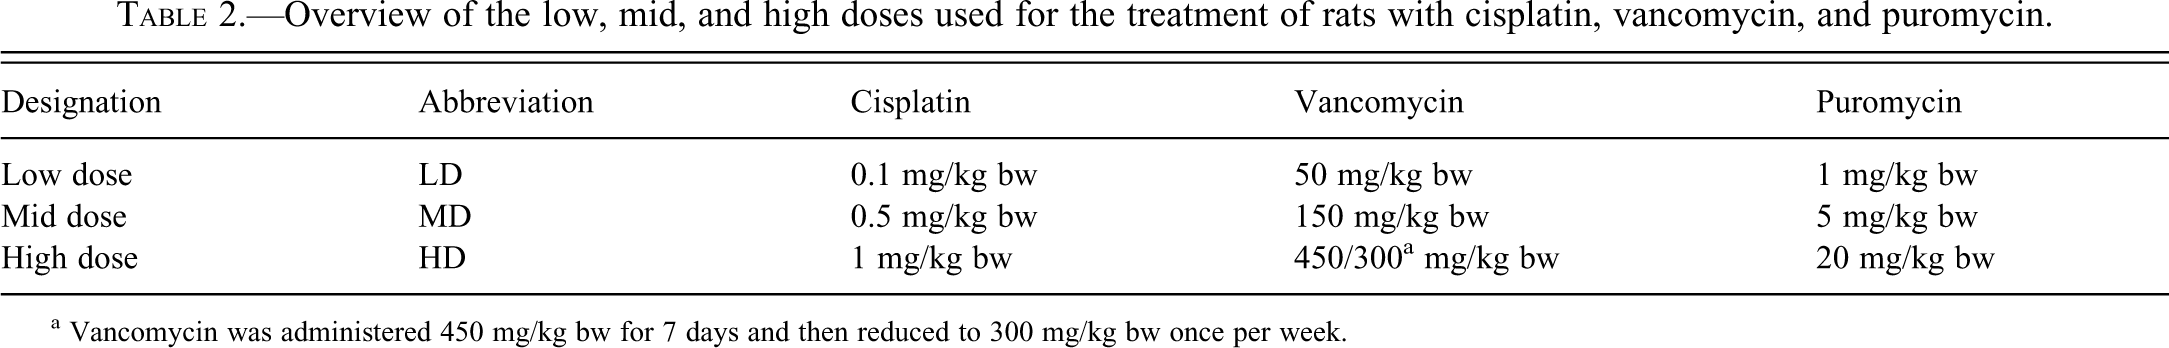
a Vancomycin was administered 450 mg/kg bw for 7 days and then reduced to 300 mg/kg bw once per week.
Materials and Methods
Animal Studies
The 28-day rat study was performed according to Good Laboratory Practice and in compliance with the German Law on the Protection of Animals (German Animal Welfare Act, Article 8a). Wistar rats, 10 weeks old, purchased from Charles River Laboratories (Sulzbach, Germany), were randomly divided into 10 groups of six animals (3 females, 3 males). Animals were individually housed in type III isolated ventilated Makrolon cages with a 12-h light-dark cycle. Standard laboratory chow (Provimi Kliba 3433.0, Aalen, Germany) and tap water were provided ad libitum. Before treatment, male rats weighed 287 ± 9.0 g and female rats weighed 195 ± 5.8 g. Rats were treated with either cis-diamindichloridplatinum (II) (cisplatin; medac GmbH, Hamburg, Germany) at dose levels of 0.1, 0.5, and 1 mg/kg; vancomycin (Ratiopharm, Ulm, Germany) at 50, 150, and 450/300 mg/kg; or puromycin (Invivogen, Toulouse, France) at 1, 5, and 20 mg/kg (Table 2). Cisplatin and puromycin were diluted in 0.9% saline, while vancomycin was diluted in water for injection. Cisplatin and vancomycin were administered intraperitoneally (i.p.) daily for 7 days and thereafter only once per week. Because of tolerability issues, the dose of vancomycin was reduced from 450 mg/kg to 300 mg/kg after 7 days because of diverse side effects including body weight reduction, incomplete eyelid closure, sunken flanks, and high-legged gait movement. Puromycin was administered i.p. daily for 14 days and thereafter twice weekly. The shared control animals received an equal volume of 0.9% saline for 7 days by daily i.p. injection, followed by administration twice per week. The animals were housed in individual metabolism cages on day 28 for 18 h (fasted with free access to water). Urine was collected under cooled conditions and stored at –80 °C until measurement of the urinary biomarkers. Blood samples were taken by puncture of the sublingual vein, the standard method used in house at the Department of Toxicology of Merck Serono Germany, under light isofluorane anesthesia on days 7, 14, and 28, and directly afterward urine was collected for clinical chemistry measurements. Blood samples and aliquots of urine were immediately used for routine clinical chemistry analyses. Frozen aliqouts of urine for the determination of urinary protein biomarkers were all measured in parallel. The animals were sacrificed by CO2 asphyxiation, and organs were collected and fixed in formalin for histopathological examination.
Clinical Pathology
Urine and plasma analyses were carried out on an ADVIA 1650 Autoanalyzer and Clinitek 100 Reflection Spectrophotometer (Siemens Medical Solution Diagnostics GmbH, Bad Nauheim, Germany) using standard protocols for the determination of multiple parameters, based on the recommendations from Weingand and colleagues (1996, 1992) and according to the manufacturer’s instructions. Urinary total protein was determined by a standard Bradford assay. Quantification was performed by a bovine serum albumin standard curve in water with a range from 0 to 500 µg/mL. Samples were diluted in ultrapure water, 1:10 to 1:100, as needed. Ten microliters of sample was measured by adding 200 µL Coomassie-brilliant blue solution, and the absorption was determined at a wavelength of 595 nm.
Determination of Urinary Kidney Toxicity Markers by Multiplexing Technologies
Urinary β2-microglobulin, α-GST, KIM-1, Timp-1, vascular endothelial growth factor (VEGF), Calbindin28 k, clusterin, cystatin C, NGAL, and osteopontin were determined using the WideScreen Rat Kidney Toxicity Panels 1 and 2. Both assays are based on the Luminex xMAP technology, which is a combination of a sandwich enzyme-linked immunosorbent assay (ELISA) and flow cytometry. For panel 1, the recommended sample dilution of twofold was used. For some samples, a dilution of 1:100 was necessary. For panel 2, a sample dilution of 1:10 and 1:100 was used. Some samples needed a dilution of 1:1000. For all measurements, 30 µL of diluted urine sample was analyzed in duplicate. On each plate, a high- and a low-concentration control were also included. The assay was performed as previously described (Hoffmann et al. 2010).
For the MULTI-SPOT technology–based assays, provided by MesoScale Discovery, the Argutus AKI-Test Kit was used, which measured α-GST, GSTY1b, and RPA-1. The recommended dilution factors of 1:10 were followed. A high dilution for the optimal detection of RPA-1 of 1:20 was performed. For the Argutus AKI-Test Kit, an eight-point standard curve was prepared. For the standard curve, the provided calibrator blend was diluted threefold in a serial dilution with Diluent 31 antibody (Argutus Medical, Dublin, Ireland). The plate was blocked with 150 µL of 3% (w/v) Blocker B (Argutus Medical) in phosphate-buffered saline (PBS). Sixty microliters of the used detection antibody, also provided as a blend at 50× concentration, was mixed with 30 µL of the 10% stock of Blocker D-R and 2910 µL of Diluent 31.
The blank was subtracted from all values and multiplied by the appropriate dilution factor to represent the undiluted sample concentration.
Detection of Urinary Kim-1 by the RENA-strip Dipstick Assay
The lateral flow–based RENA-strip dipstick assay is quick and easy to use and is based on thin layer chromatography (Vaidya et al. 2009). The strips were loaded in a cassette for the automatic read out via the Lateral-Flow Reader (BioAssay Works). The urine was diluted 1:2 in borosilicate glass test tubes by adding 75 µL urine sample to 75 µL sample diluent, provided with the test kit. One hundred microliters of the diluted samples was transferred to the sample well on the strip cassettes. The strips were incubated in duplicate for 15 min before being transferred within 5 min into the reader for detection. Using the sandwich assay protocol, the reader works by comparing the intensity of the test line with that of the control line and displaying a percentage value. The resulting values were multiplied with the lot-specific multiplier to get a final concentration in nanograms per milliliter.
Statistical Analysis
Urinary Multiplexing Assays
Results calculated from an eight-point standard curve were normalized against the appropriate urinary creatinine value. Data are presented as individual animals (means are indicated by a black line). Statistical analysis was performed by analysis of variance (ANOVA) and Tukey test. Values significantly different from control are indicated as *p < .05, **p < .01, and ***p < .001.
Bradford Assay
The concentration values determined from an eight-point standard curve were subtracted by a blank value and multiplied by the dilution factor. Both genders were represented separately and analyzed against the corresponding control group as well as the other gender of the same group by ANOVA and Tukey test using the Graph Pad Prism 5 software package (GraphPad Software Inc., La Jolla, CA).
Urinary Kim-1 Dipstick Assay
The concentration values calculated from the relative intensity values measured by the lateral flow reader were presented as individual animals (means are indicated by a black line). Statistical analysis was performed by ANOVA and Tukey test using the Graph Pad Prism 5 software package (GraphPad Software Inc.). Values significantly different from control are indicated as *p < .05, **p < .01, and ***p < .001. Receiver-operator characteristic (ROC) curves were plotted as described for urinary multiplexing assays.
Clinical Pathology
Concentrations determined for clinical-chemical parameters are represented as mean ± standard deviation of all animals (n = 6). Only body weight was calculated individually for both genders. Statistical analysis was performed by ANOVA and Tukey test. Values significantly different from control are indicated as *p < .05, **p < .01, and ***p < .001. ROC curves for serum creatinine and BUN were plotted as described below.
ROC Analyses
ROC curves were plotted to compare the performance of the urinary biomarkers, whereby the area under the ROC curve serves as a measure for the overall ability to discriminate healthy animals versus animals with toxicity (Table 3). Data obtained from animals without histopathological findings in the kidney and those with signs of tubular/glomerular alteration across all animals were entered. No further discrimination of the groups was performed. This procedure enables the determination of the diagnostic accuracy of urinary biomarkers after 28 days, independent of designation of a diagnostic threshold. ROC curves were plotted using the Graph Pad Prism 5 software package (GraphPad Software Inc.).
Area under the receiver-operator characteristic curve (AUROC) for detection of subacute cisplatin-, vancomycin-, and puromycin-induced nephrotoxicity. The area under the curve is used as a measure for the overall ability of a biomarker to discriminate animals without histopathological findings in kidney from those with signs of tubular/glomerular damage. In addition, the 95% confidence interval and the p value are displayed.
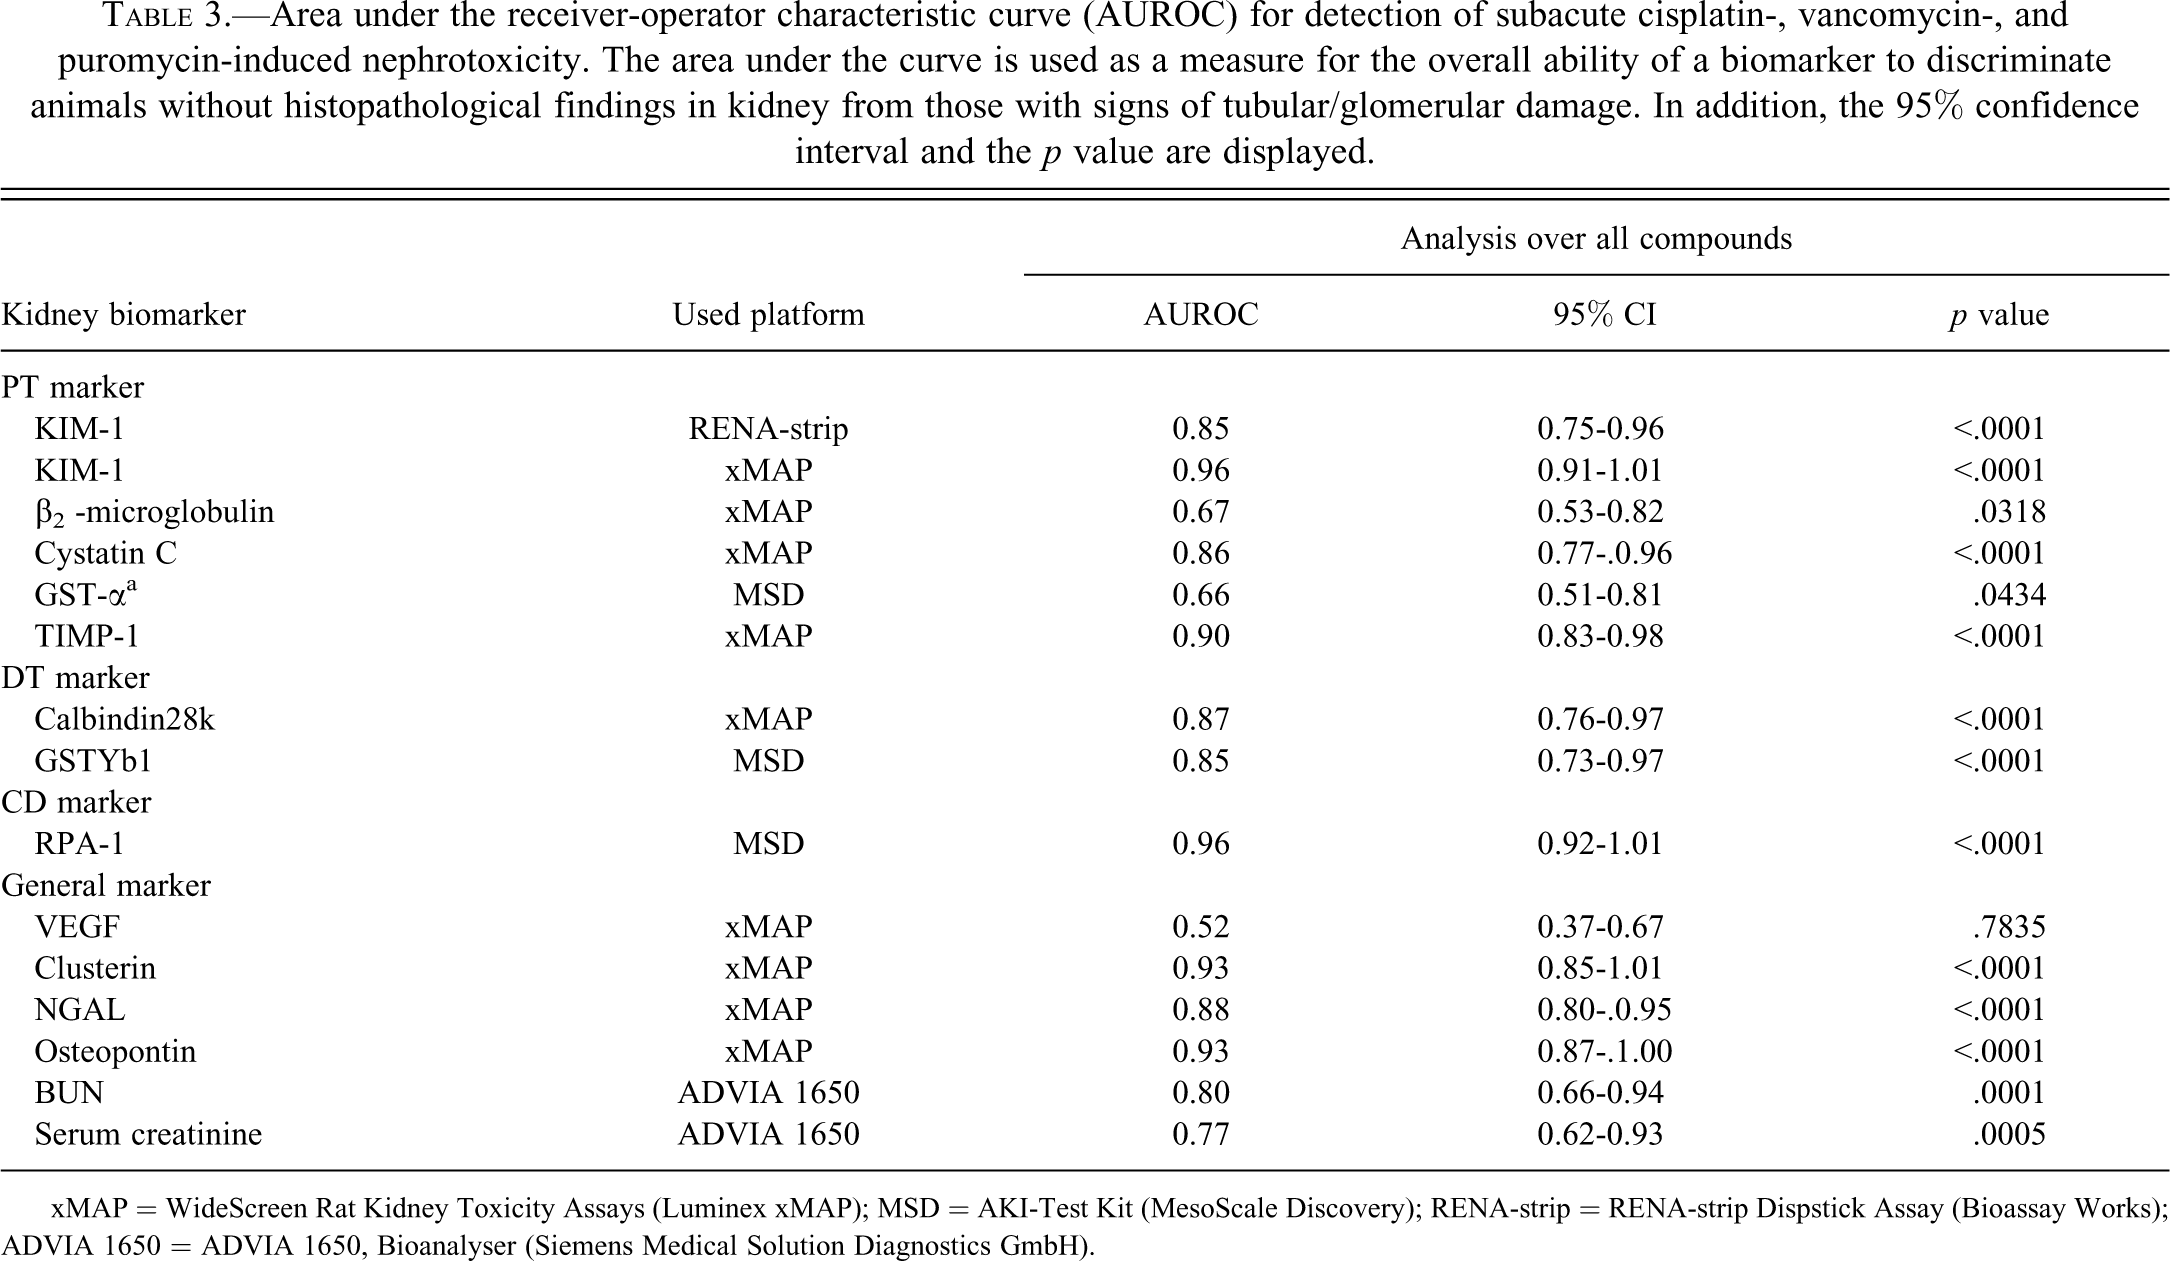
xMAP = WideScreen Rat Kidney Toxicity Assays (Luminex xMAP); MSD = AKI-Test Kit (MesoScale Discovery); RENA-strip = RENA-strip Dispstick Assay (Bioassay Works); ADVIA 1650 = ADVIA 1650, Bioanalyser (Siemens Medical Solution Diagnostics GmbH).
Linear Regression and Bland-Altman Analysis
For the comparison of urinary Kim-1 determined by the WideScreen Rat Kidney Toxicity Assay and the RENA-strip dipstick assay, fold-changes were calculated by dividing the individual, normalized values of each animal by the average of the control animals. The analysis was performed (1) using all animals and (2) using only the vancomycin-treated animals. The linear regression analysis was used to show the tendency of both assays to overlap. The Bland-Altman plot was used to identify the compliance of fold-change values and the discrepancy over the whole range of fold increases. The Bland-Altman method plots the mean differences (bias) within the data, ±1.96 × SD of the differences. The 95% confidence limits are ±1.96 × SD of the differences (Bland and Altman 1986). Graphs were plotted using the Graph Pad Prism 5 software package (GraphPad Software Inc.).
Results
Histopathological observation of tissues from all rats in all three studies showed compound-specific alterations in different areas within the nephron. Vancomycin caused general tubular alterations, while cisplatin showed primarily tubular damage of the S3 segment of the proximal tubule. In contrast, puromycin showed predominantly glomerular damage with mild changes of the proximal tubule as a secondary effect. Several urinary protein biomarkers, such as osteopontin, were observed after general renal alterations, while others delivered more specific localization information, for example, Kim-1. Diagnostic performance of all biomarkers tested, as well as the standard clinical pathological parameters, serum creatinine and BUN, evaluated by ROC analysis, demonstrated clear benefits of the novel markers. The impact of the technologies used was not studied in more detail because of the lack of overlap of urinary biomarkers. However, the data show that all technologies can serve as tools for the identification and monitoring of renal insult with unique advantages and disadvantages.
Renal Histopathology Assessment
Cisplatin
Male animals treated with high-dose (HD) cisplatin died on study day 10, whereas females survived until the end of the study. A treatment-related effect was observed in animals treated with 0.5 (MD) and 1 mg/kg (HD) cisplatin (Table 4a). Relative kidney weight doubled from 0.73% ± 0.06% to 1.35% ± 0.23% in the HD group. A nonsignificant reduction of 7% in body weight was observed for the male rats, while the weight of the female group showed no alteration. Male animals of the MD group showed multifocal, mild to moderate basophilic tubules with tubular single cell necroses. The HD animals (male and female) showed massive tubular degeneration, with signs of regeneration (Figure 1A-C). They were accompanied by moderate to massive tubular necrosis. In addition, minimal to moderate eosinophilic casts were found in animals treated with 1 mg/kg (HD), with the incidence and severity increasing with dose.
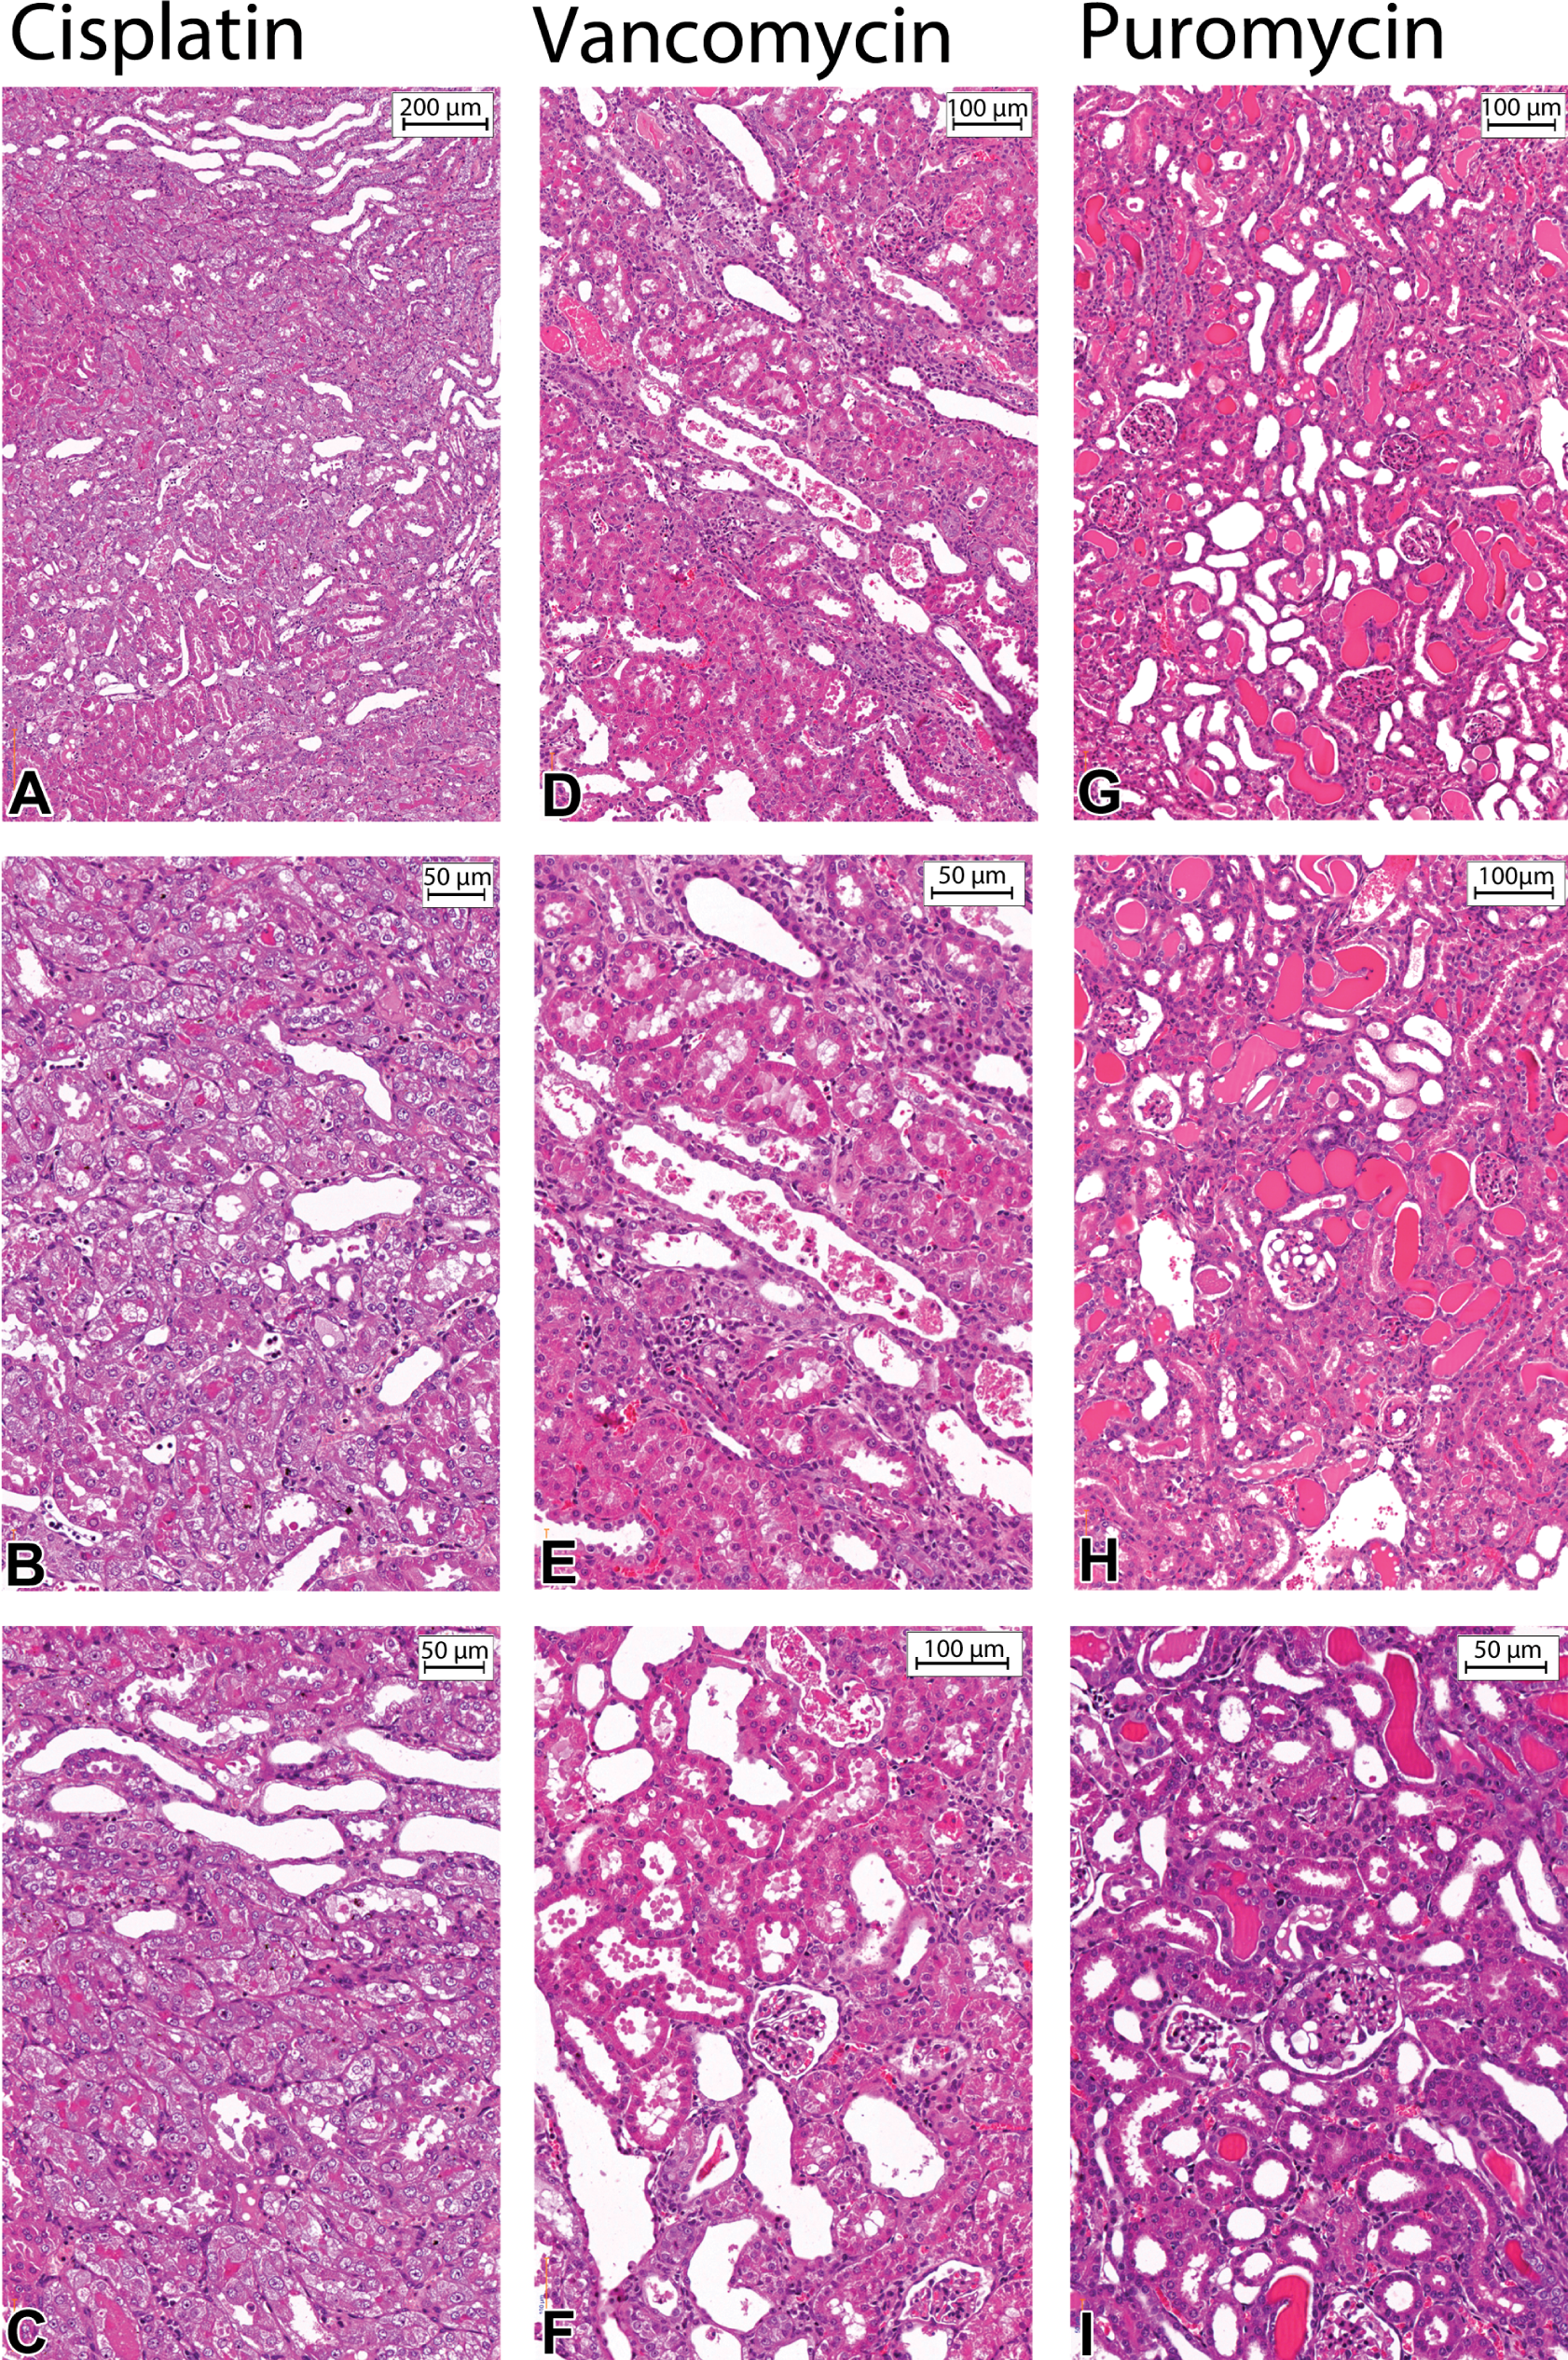
Shown are renal tissue slides prepared from FFPE blocks (hematoxylin/eosin stained) of HD-treated animals (Cisplatin: 1 mg/kg body weight [bw]; vancomycin: 450/300 mg/kg bw [Table 2]; puromycin: 5 mg/kg bw) after 28 days of treatment. Histopathological renal alterations induced by cisplatin (A-C): Typical necrosis of the S3 segment of the proximal tubule in the outer stripe of the outer medulla. Vancomycin (D-F): Moderate to marked tubular degeneration in combination with tubular dilation. Eosinophilic casts and massive necrosis, characterized by
Summary of histopathological observations involving the proximal tubule epithelium following treatment of rats with (a) cisplatin, (b) vancomycin, or (c) puromycin.
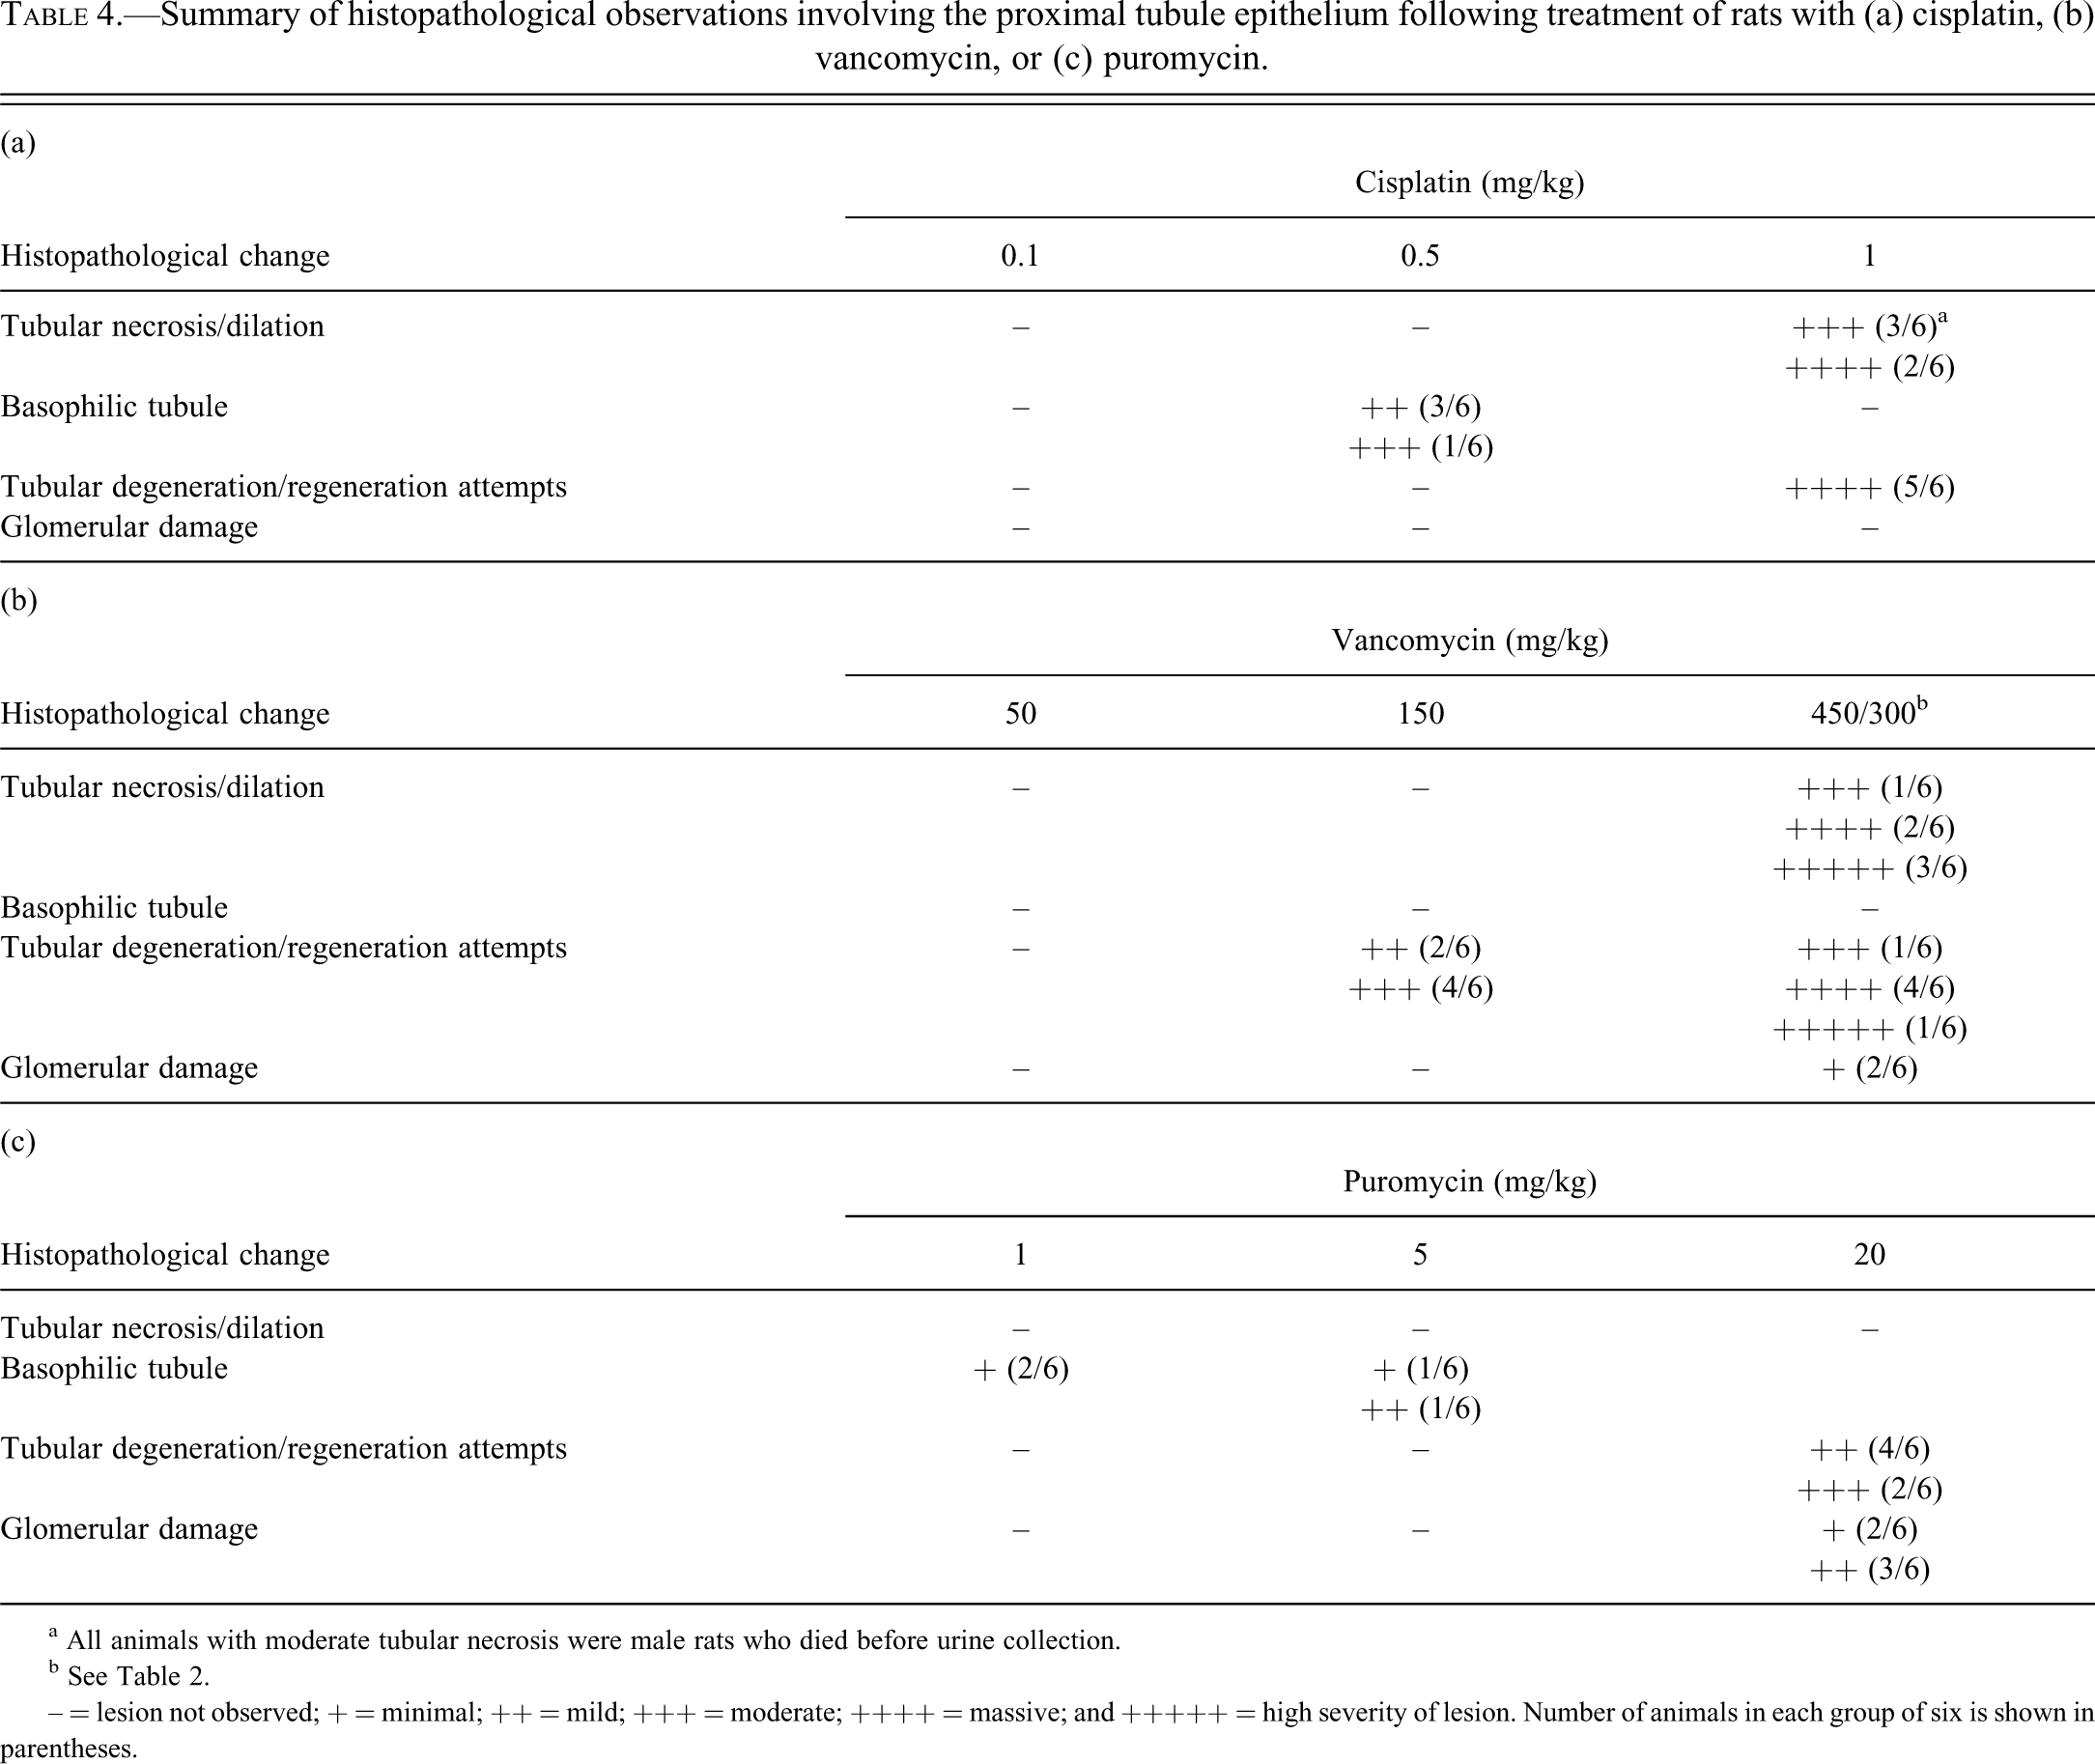
a All animals with moderate tubular necrosis were male rats who died before urine collection.
b See Table 2.
– = lesion not observed; + = minimal; ++ = mild; +++ = moderate; ++++ = massive; and +++++ = high severity of lesion. Number of animals in each group of six is shown in parentheses.
Vancomycin
Macroscopic enlargement of kidneys in HD animals was observed (Table 5b). A treatment-related histopathological effect was found in MD and HD animals (Table 4b), with the severity of the findings increasing with dose. Animals treated with 150 mg/kg (MD) revealed multifocal, mild to moderate tubular degeneration. This tubular degeneration was characterized by tubules showing slight dilation, a flattened basophilic stained tubular lining epithelium, and intraluminal sloughing cells. HD animals showed multifocal, massive to severe tubular degeneration in combination with a moderate to severe tubular dilation (Figure 1D-F). In addition to the sloughing of tubular epithelium cells, mild to massive cellular cast formation was found mainly in animals treated with 450/300 mg/kg vancomycin (HD). Concomitant eosinophilic casts were diagnosed with a dose-dependent increase in MD and HD groups. Some glomeruli of HD animals had dilated Bowman’s capsules, with eosinophilic droplets. In addition, males had moderate to massive infiltrates of mononuclear inflammatory cells.
Summary of the clinical pathology parameters determined for the (a) cisplatin-, (b) vancomycin-, and (c) puromycin-treated animals after 28 days.
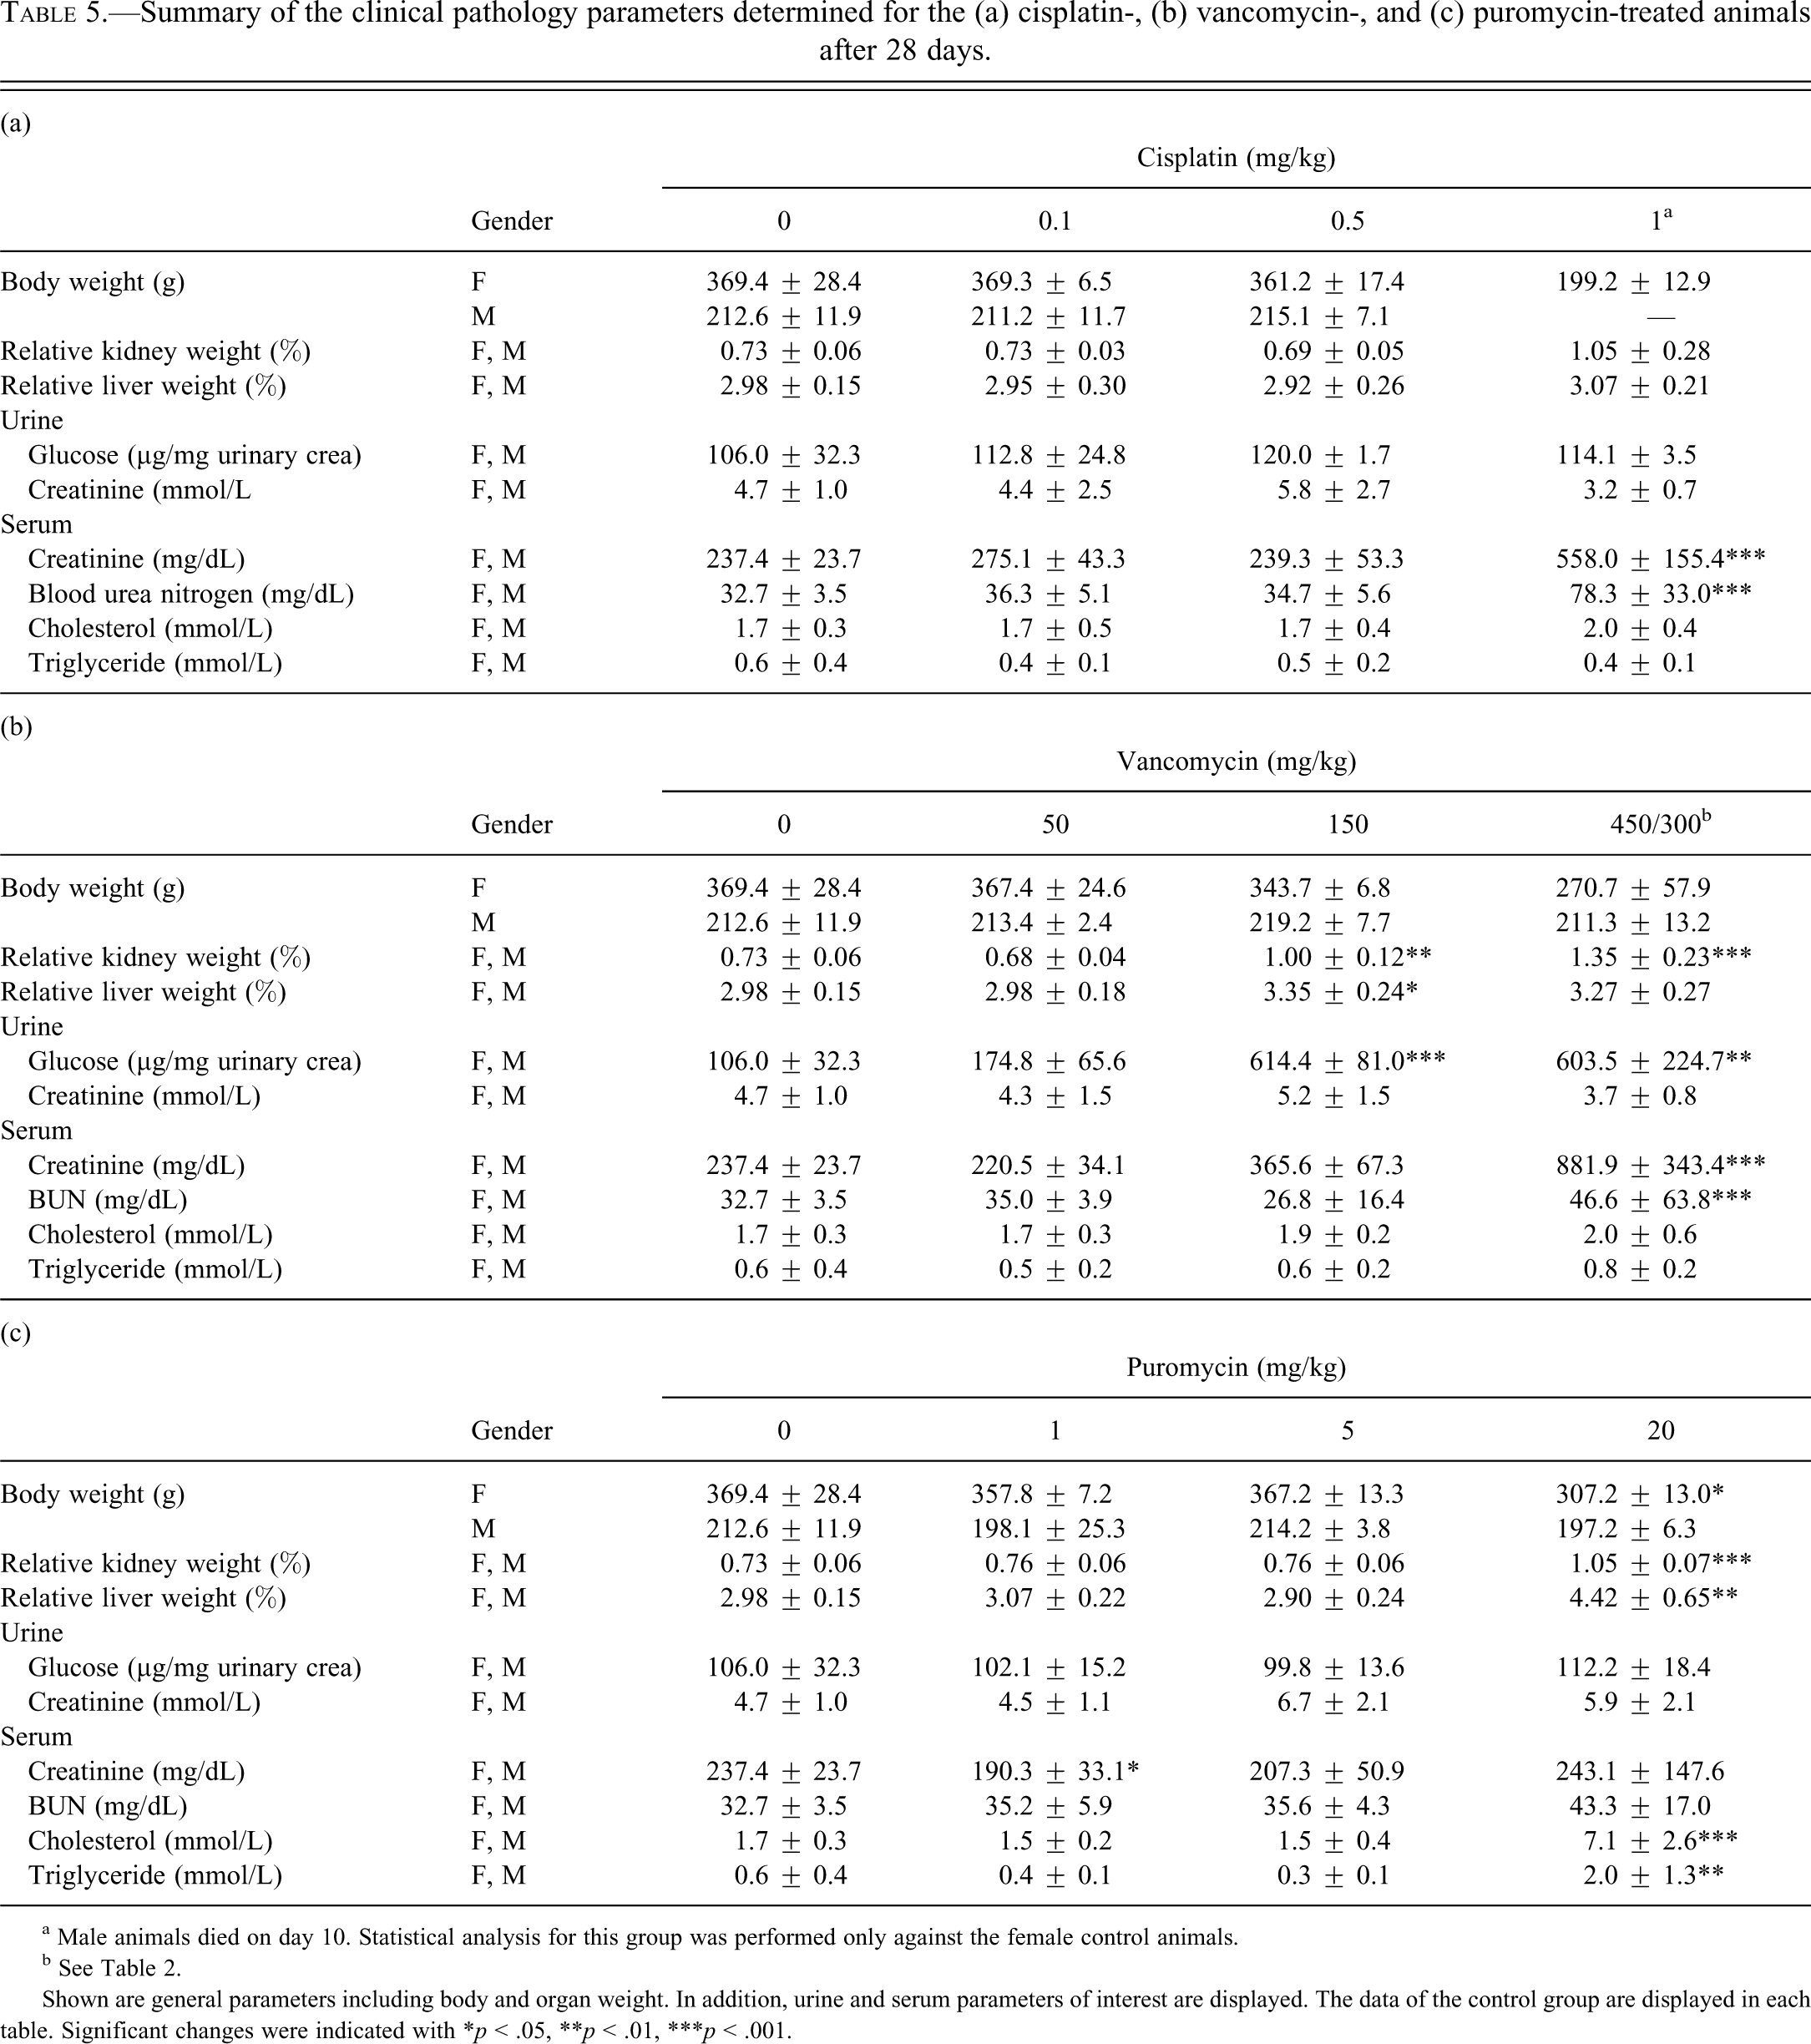
a Male animals died on day 10. Statistical analysis for this group was performed only against the female control animals.
b See Table 2.
Shown are general parameters including body and organ weight. In addition, urine and serum parameters of interest are displayed. The data of the control group are displayed in each table. Significant changes were indicated with *p < .05, **p < .01, ***p < .001.
Puromycin
A significant body weight reduction in male rats after treatment with 20 mg/kg (HD) puromycin was observed. In addition, an increase in relative kidney and liver weights was observed. HD animals revealed multifocal, mild to massive tubular degeneration (Table 4c). This tubular degeneration was characterized by tubules showing dilation, a flattened basophilic stained tubular lining epithelium without prominent intraluminal sloughing cells. Minimal to massive eosinophilic casts were present. They were located not only in distal segments and collecting tubules but also in the cortex. Specific to puromycin, treated animals showed minimal to massive vacuolation of glomerular tufts (Figure 1G-I). In addition to the glomerular and tubular damage observed, an increase in liver weight, lobular entangling, and damage of the liver were observed.
Analysis of Clinical Pathology Findings
Changes in clinical parameters after cisplatin treatment were limited to an increase in serum creatinine and BUN at day 7 (data not shown) and 28 in the 1-mg/kg (HD) treatment group. However, this strong increase in serum creatinine and BUN was very variable between animals, which led to no statistical significance.
In contrast to cisplatin, most clinical pathology parameters after treatment with vancomycin (Table 5b) showed significant changes in the 150mg/kg (MD) and 450/300mg/kg (HD) treatment groups. The classic serum markers for the detection of the loss of renal function, serum creatinine and BUN, showed strong effects after 7 and 28 days of 450/300 mg/kg (HD) vancomycin treatment. In addition, a strong increase in urinary glucose, up to six-fold, was detected in animals treated with 150 mg/kg (MD) and 450/300 mg/kg (HD), while the blood glucose level showed no significant changes (data not shown). Serum cholesterol and triglyceride showed no changes over time and dose.
Puromycin treatment resulted in several changes after 20 mg/kg (HD) exposure (Table 5c). The classic serum marker BUN showed a significant increase after 14 days of HD treatment (data not shown), while serum creatinine showed only a drop after 28 days of 1 mg/kg (LD) treatment. In addition to the increase in liver weight, serum cholesterol and triglyceride levels increased significantly in animals treated with HD. Urinary total protein was significantly increased in HD puromycin-treated animals.
In the control group and all treatment groups of all three model compounds, except for the puromycin HD group, a strong variation between male and female rats (up to a sevenfold higher excretion in male rats) was observed for total urinary protein (Figure 2).
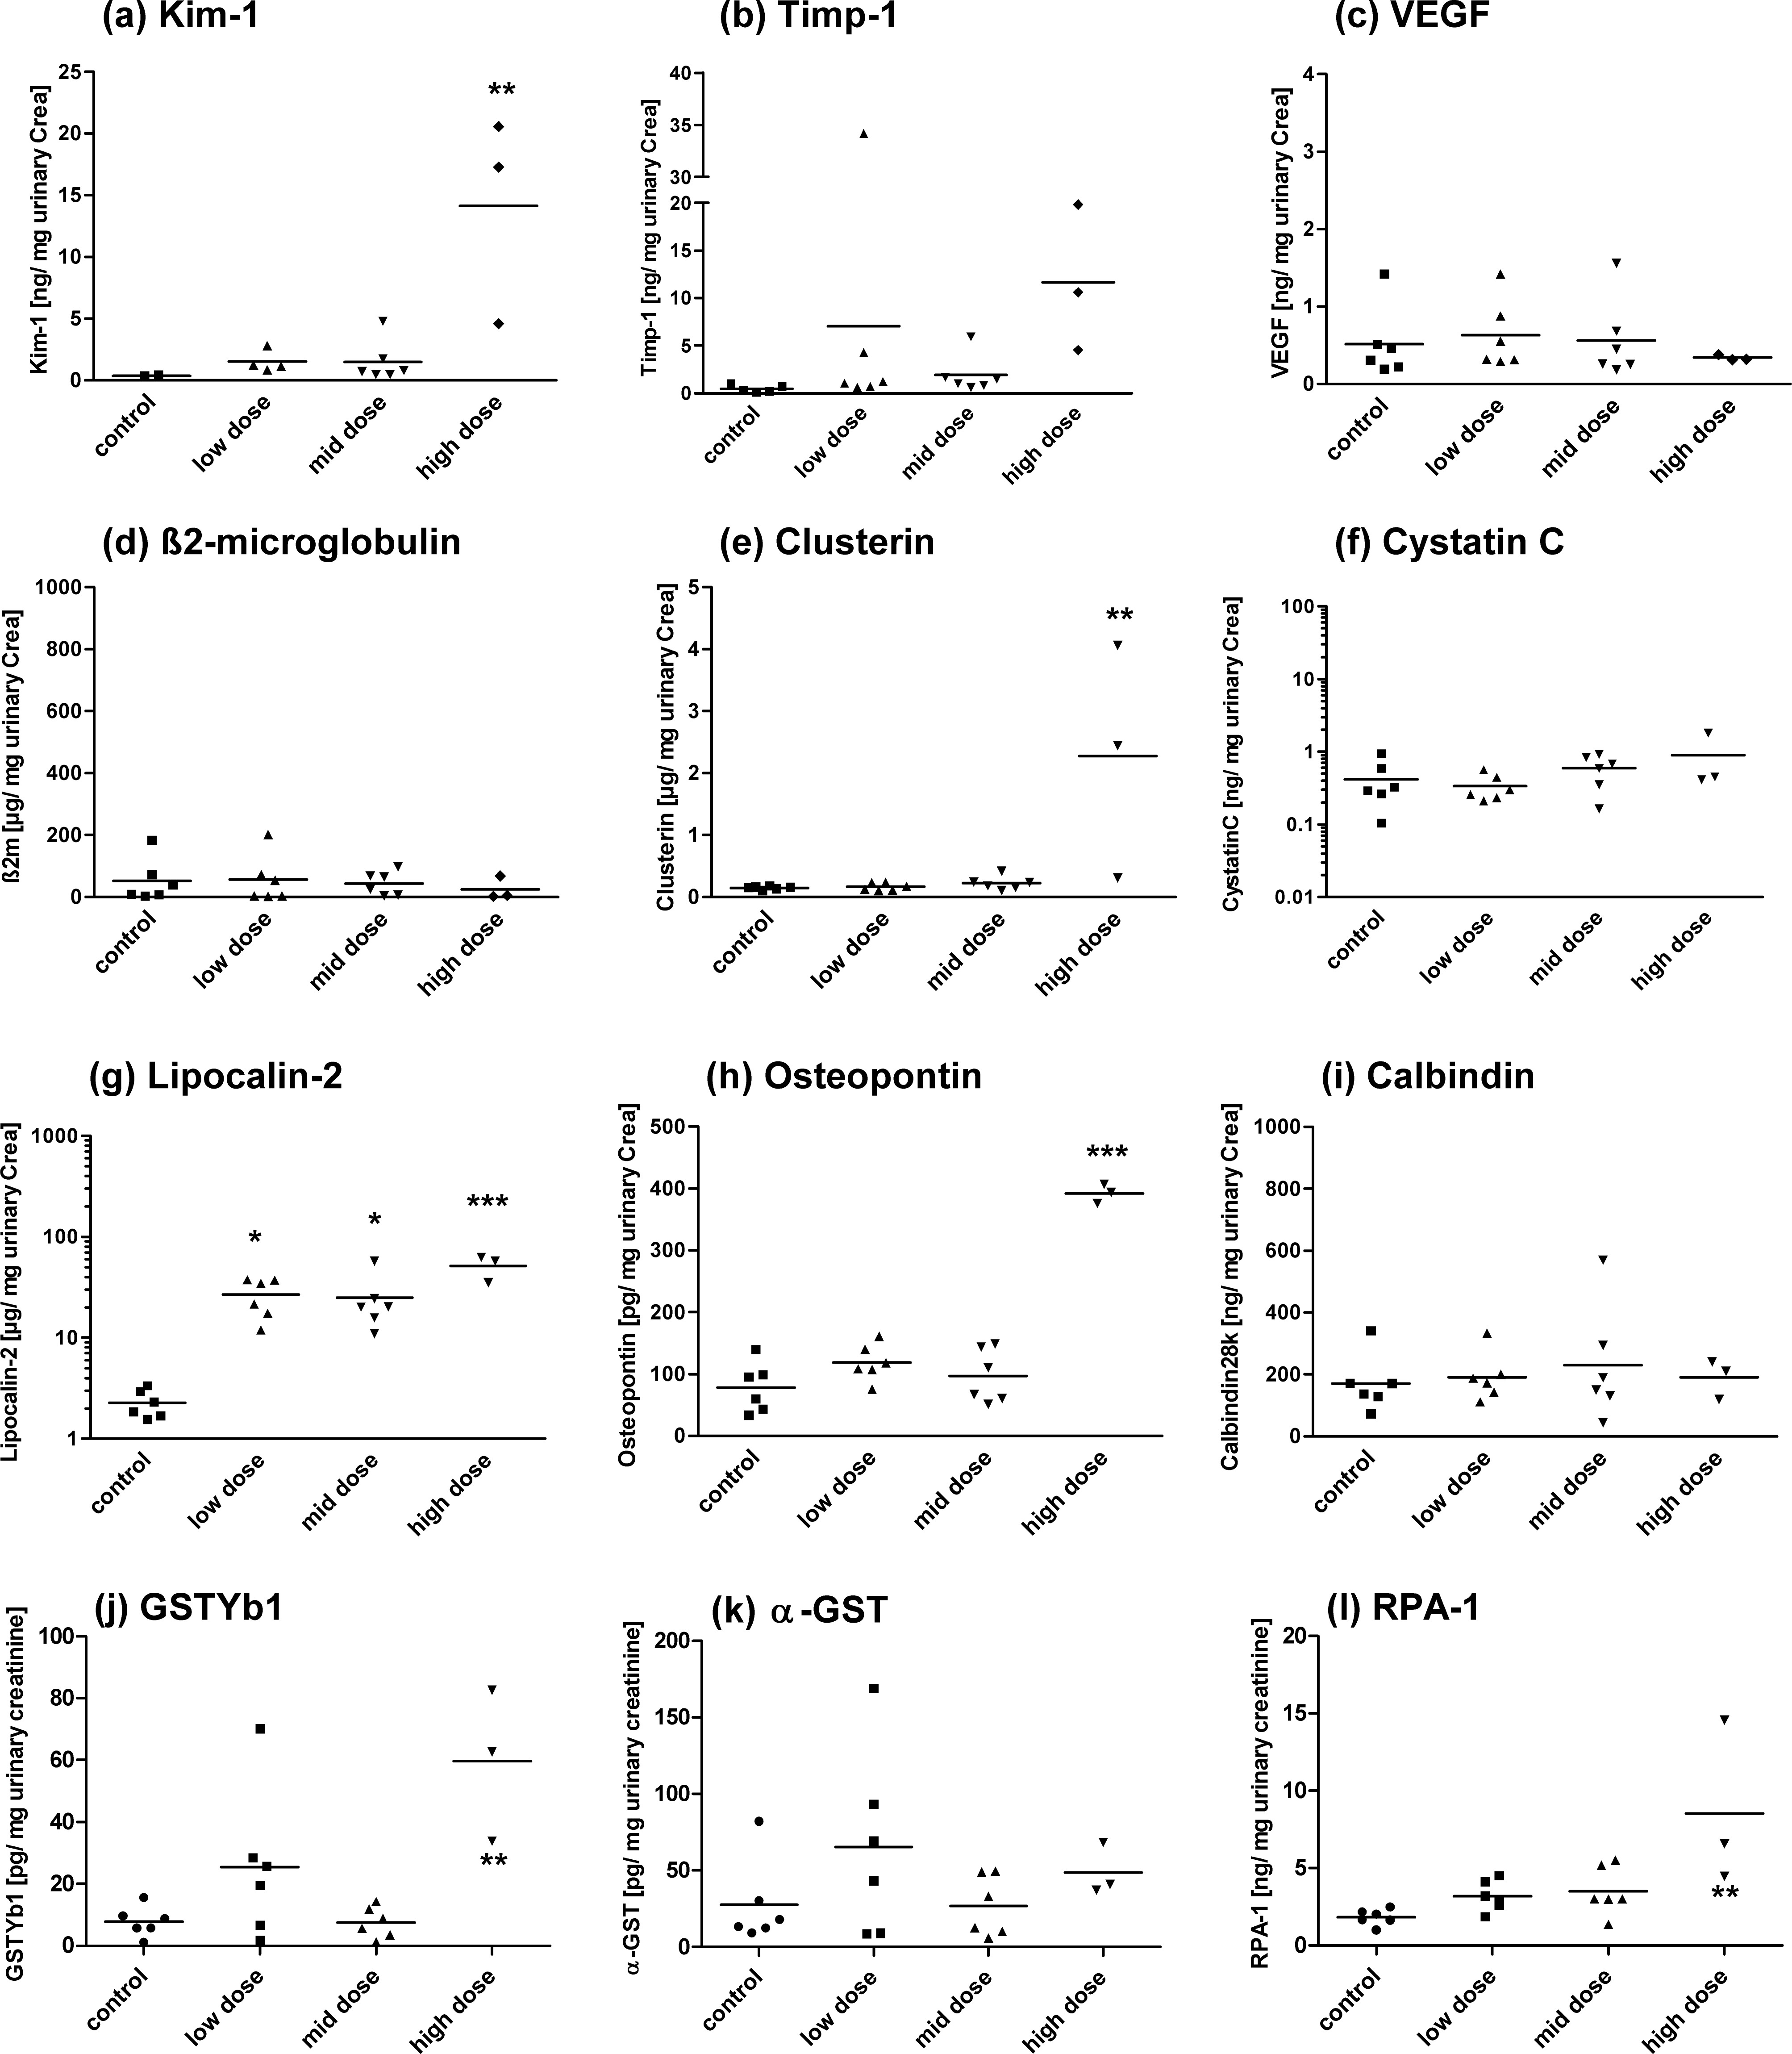
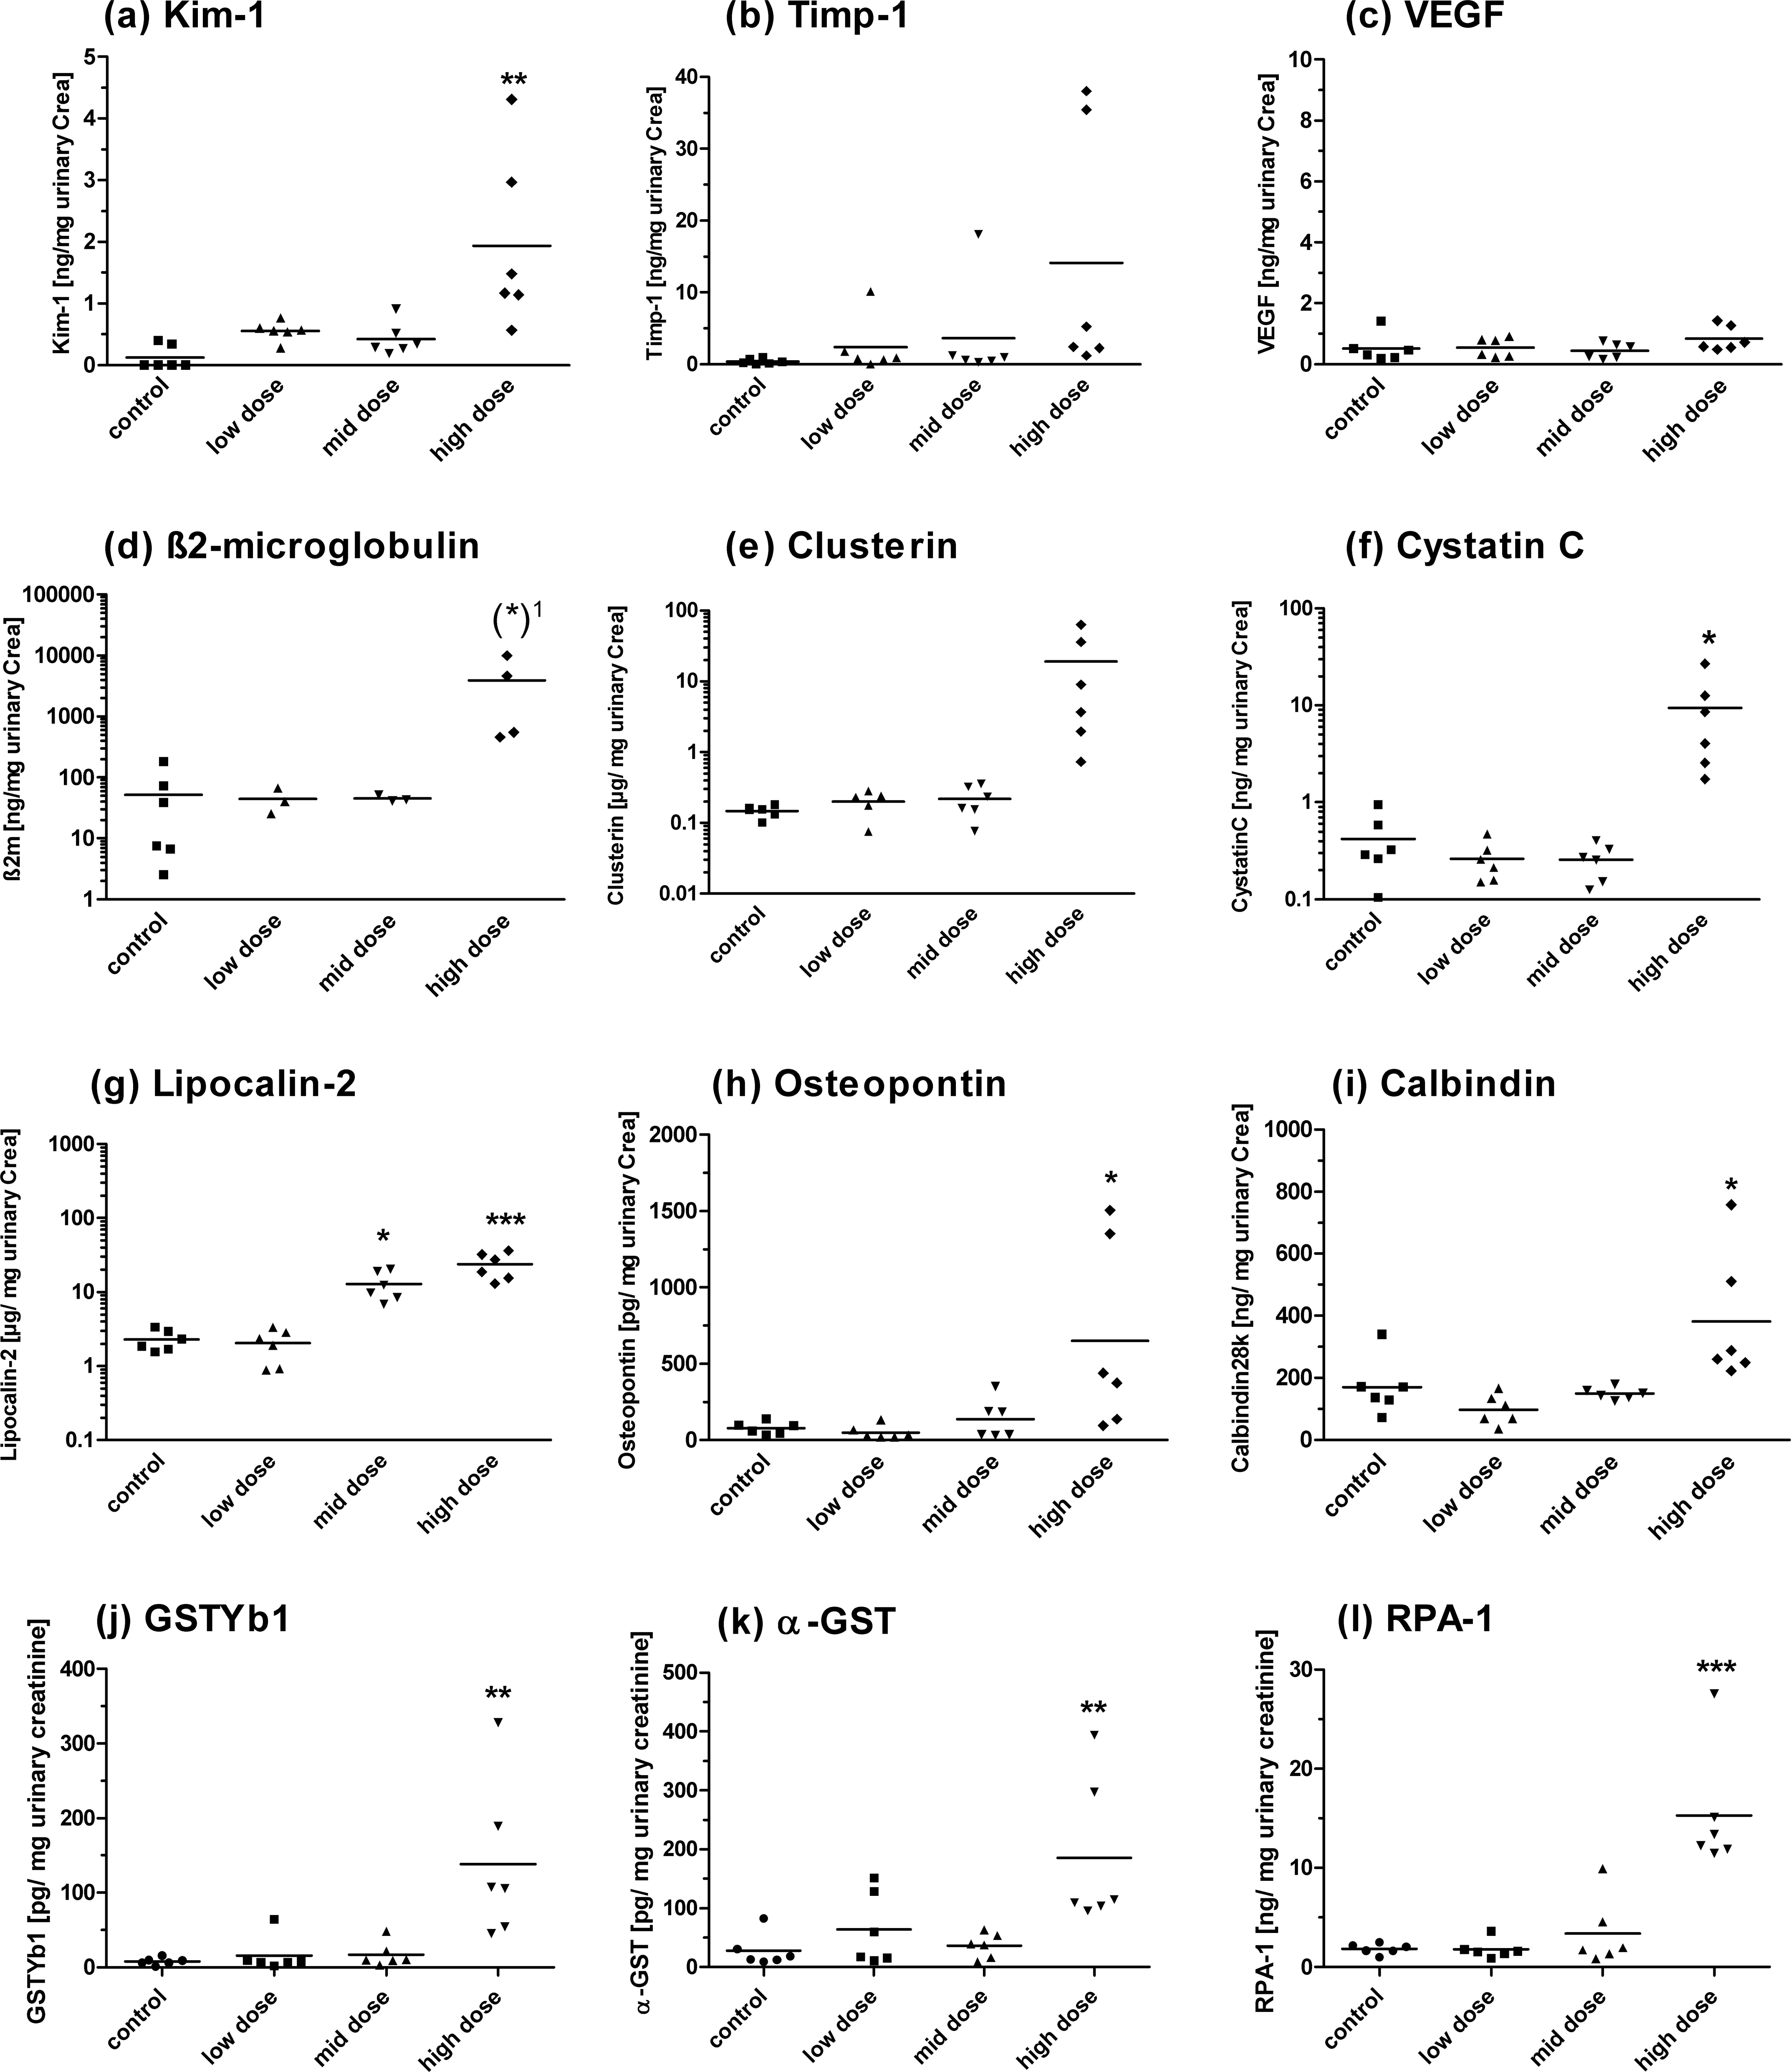
Excretion of (a) Kim-1, (b) Timp-1, (c) VEGF, (d) b 2m, (e) Clusterin, (f) Cystatin C, (g) Lipocalin-2, (h) Osteopontin, (i) Calbindin, (j) GSTYb1, (k) a-GST, and (l) RPA-1 in urine of rats treated with cisplatin for 28 days. Measurements (a) to (i) were performed by the Luminex-basedWideScreen assay. Measurements (j), (k), and (l) were performed by the MesoScale Discovery platform using the ArgutusMedical AKI-Kit. Data are presented as individual animals and as the mean (bar; n = 6). *p < .05, **p < .01, ***p < .001 (ANOVA, Tukey).
Analysis of Urinary Kidney Biomarkers
Urinary protein biomarkers were measured using the WideScreen Rat Kidney Toxicity Assay, the Argutus AKI-Test Kit, and the RENA-strip dipstick.
WideScreen Rat Kidney Toxicity Assay
A dose-dependent increase in urinary Kim-1, NGAL, clusterin, and osteopontin was detected after 28 days of treatment with cisplatin, vancomycin, and puromycin (Figures 3–5). A significant increase of clusterin and osteopontin was also observed for the HD groups of cisplatin and vancomycin. In addition, the MD group of vancomycin showed a significant increase in osteopontin as well as in Timp-1 secretion. The variance within the single-dose groups showed marker-dependent differences. No significant changes in Timp-1 after cisplatin and puromycin treatment were observed. Even without statistical significance, the relevance for the histopathological findings of Timp-1, calculated by the area under the ROC (AUROC; plus the 95% confidence interval) over all compounds, showed a good diagnostic value of 0.90 (0.83-0.98; Table 3).
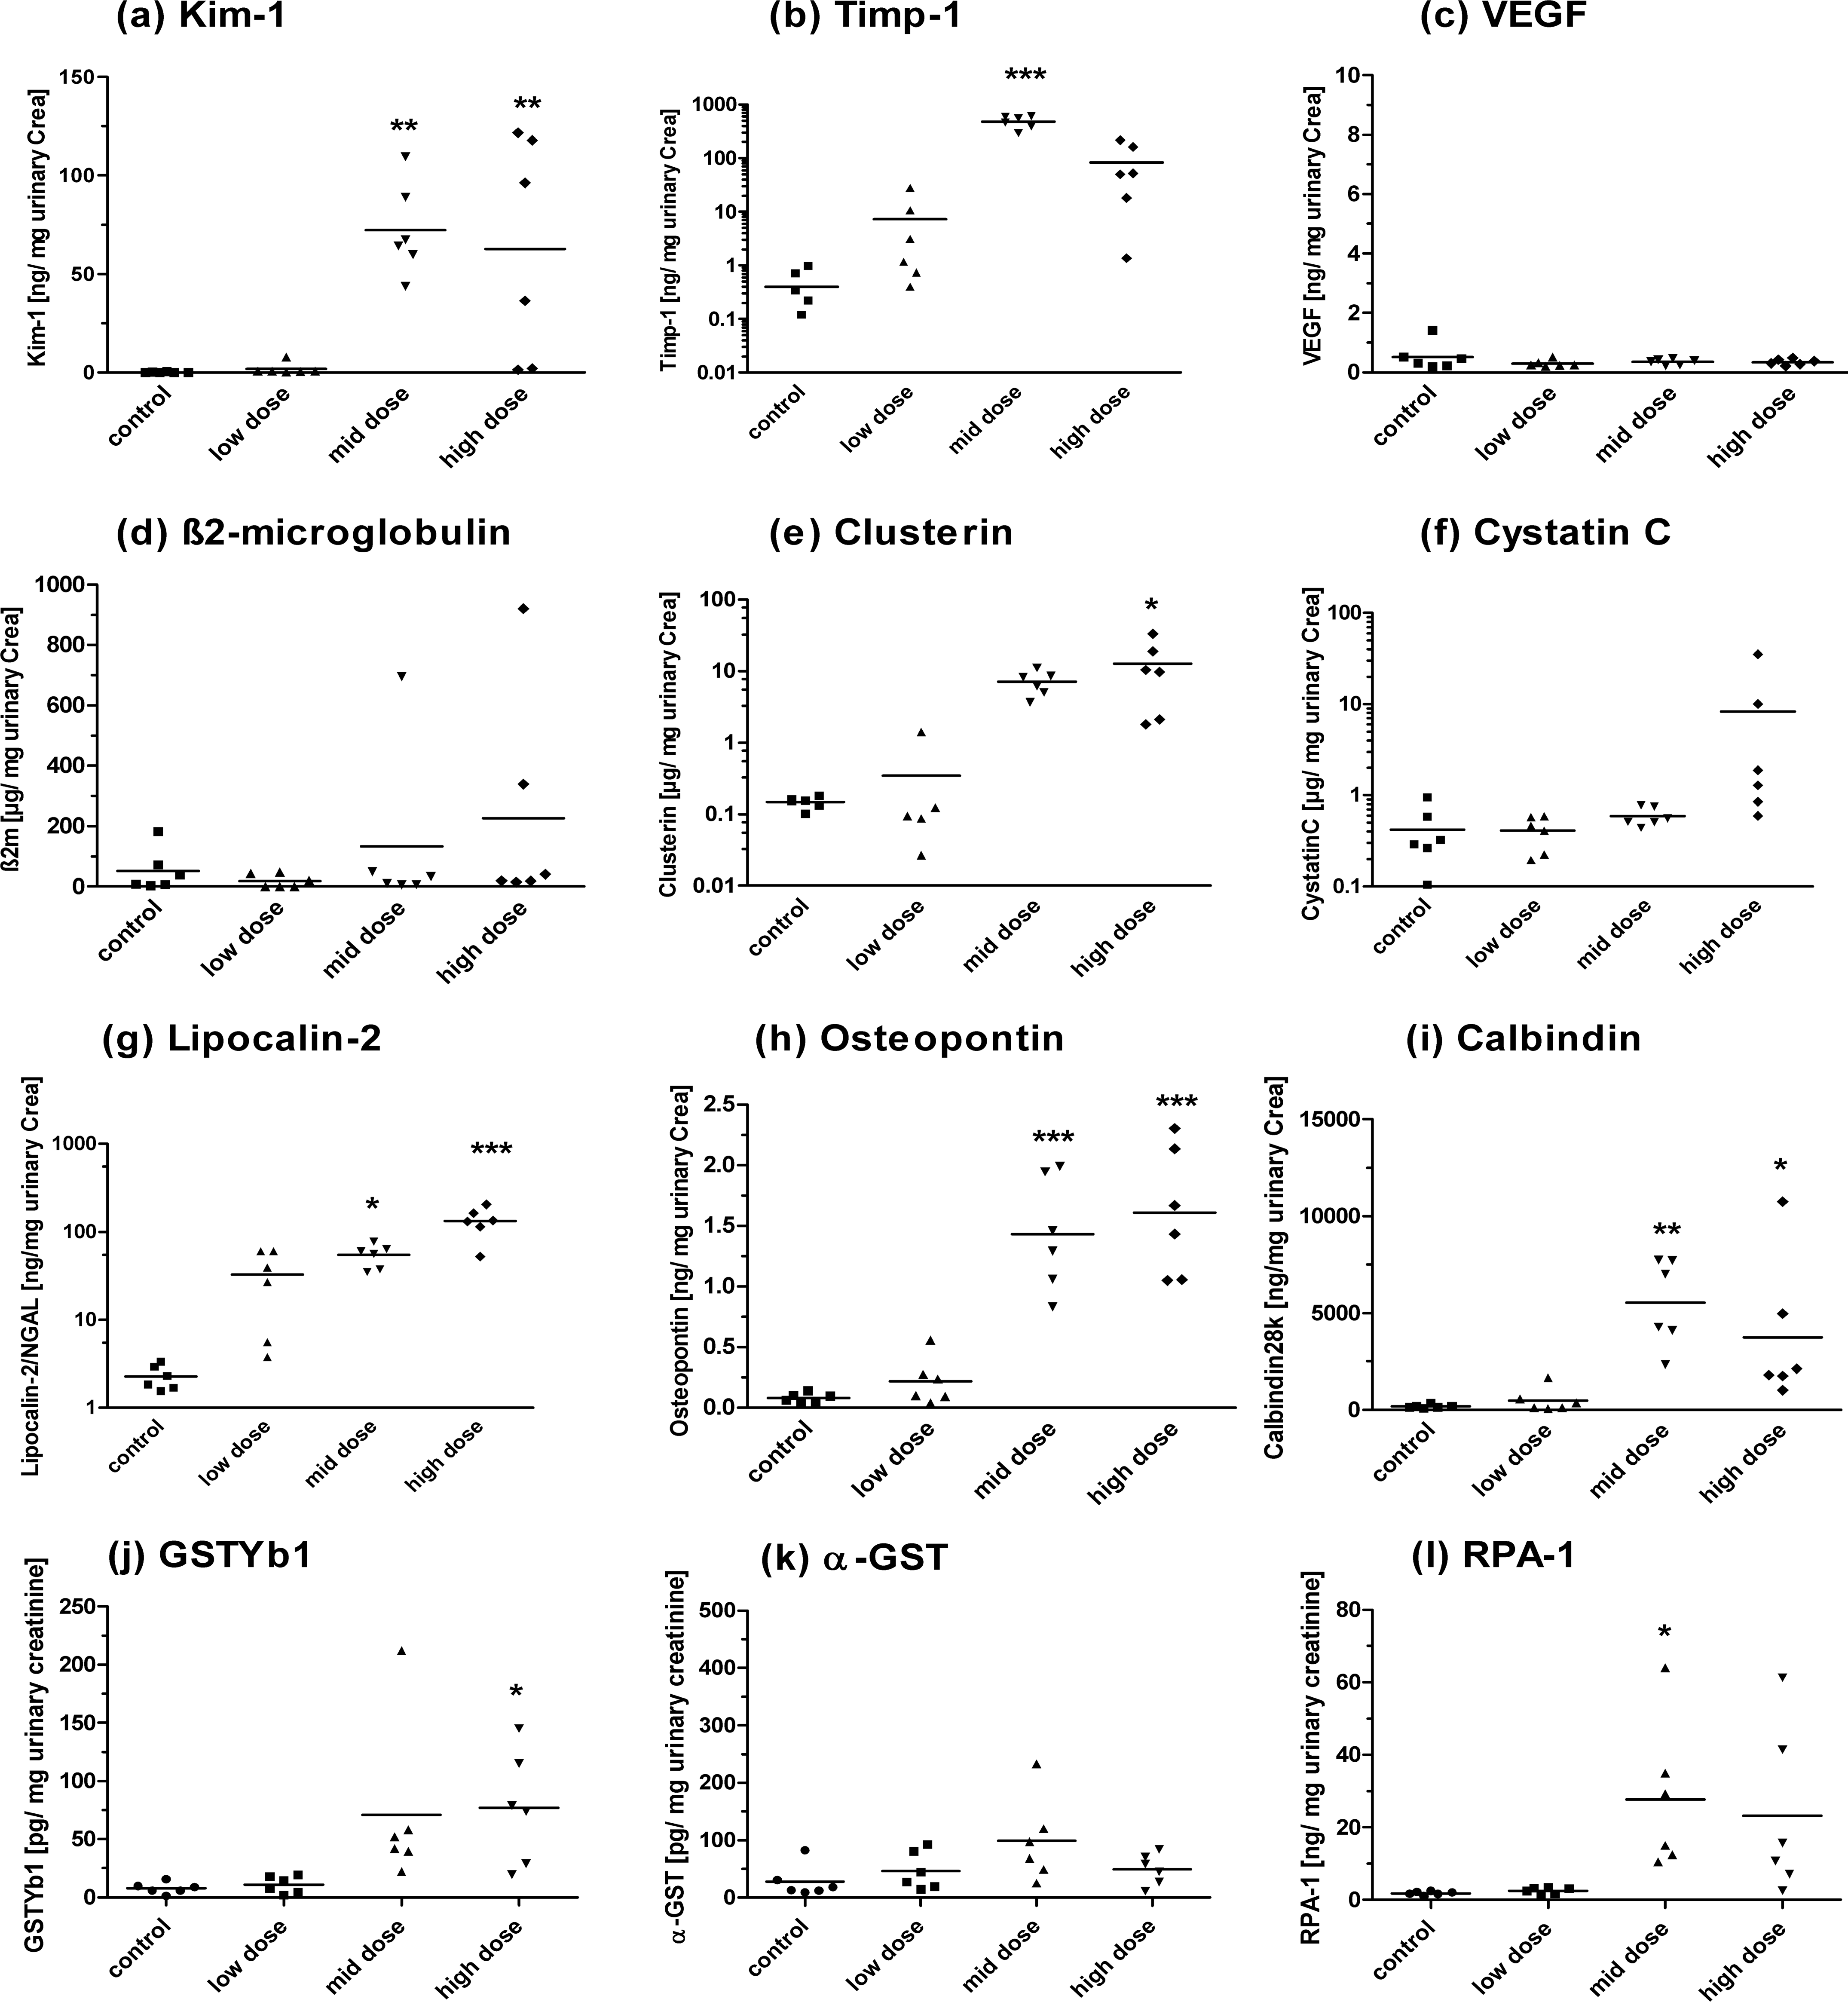
Excretion of (a) Kim-1, (b) Timp-1, (c) VEGF, (d) b 2m, (e) Clusterin, (f) Cystatin C, (g) Lipocalin-2, (h) Osteopontin, (i) Calbindin, (j) GSTYb1, (k) a-GST, and (l) RPA-1 in urine of rats treated with vancomycin for 28 days. Measurements (a) to (i) were performed by the Luminex-basedWideScreen assay. Measurements (j), (k), and (l) were performed by the MesoScale Discovery platform using the ArgutusMedical AKI-Kit. Data are presented as individual animals and as the mean (bar; n = 6). *p < .05, **p < .01, ***p < .001 (ANOVA, Tukey).
A significant alteration in Calbindin28 k levels was detected for the vancomycin MD and HD and the HD puromycin treatment groups. β2m, a tubular resorption marker, showed significant changes only after HD puromycin treatment. NGAL/lipocalin-2 appears to be an early marker, as it was the only protein that showed a significant increase in the urine of animals treated with an LD of cisplatin. In addition, puromycin and vancomycin also showed early effects on NGAL in MD-treated groups.
The AUROC showed high diagnostic performances over all compounds for Kim-1 (0.96; 0.91-1.01). In addition, osteopontin (0.93; 0.87-1.00), Timp-1 (0.90; 0.83-0.98), and clusterin (0.93; 0.85-1.01) were the only markers within the Luminex panels showing high AUROCs of at least 0.90. However, VEGF (0.52; 0.37-0.67) showed no potential to detect renal damage induced by the compounds tested within this study. In addition, the calculated AUROC for β2m showed also a limited capability for diagnosis with an AUROC of 0.67 (0.53-0.82). Concentrations of α-GST were below the limit of detection in controls and treated animals measured by the WideScreen assay.
Argutus AKI-Test Kit
GSTYb1 showed a significant increase in all HD-treated groups (Figures 3–5). A strong, but not significant, increase in MD vancomycin–treated rats also was observed. RPA-1 was significantly increased in rats treated with HD cisplatin and puromycin and with the MD of vancomycin. In addition, the 450/300-mg/kg (HD) vancomycin-treated animals showed a strong, but not significant, increase in RPA-1 excretion. α-GST showed significant changes in only puromycin HD–treated animals. The results of the AUROC analysis delivered similar results (Table 3). A poor diagnostic performance for α-GST (0.66; 0.51-0.81) was shown over all compounds, while the calculated value for GSTYb1 (0.85; 0.75-0.96) was much higher. RPA-1 (0.96; 0.92-1.01) showed a good diagnostic performance.
RENA-strip
An increase in urinary Kim-1, measured by the RENA-strip, was detectable only in animals treated with 150 mg/kg (MD) and 450/300 mg/kg (HD) vancomycin (Figure 6b). Cisplatin- and puromycin-treated animals showed no significant alteration in Kim-1 excretion (Figure 6a, c). The AUROC for the Kim-1 detection via this dipstick assay was 0.85 (0.75-0.96) and in this case below the value of Kim-1 determined using the Luminex-based WideScreen assay.
Urinary Kim-1: Comparison between the Luminex xMAP and the RENA-strip
The lack of significant alterations in Kim-1 levels determined by the RENA-strip resulted in an 11% lower AUROC over all compounds (xMAP: 0.96 [0.91-1.01]; RENA-strip: 0.85 [0.75-0.96]; Table 3). The comparison of both technologies by linear regression and Bland-Altman analysis delivered similar differences (Figure 7). The linear regression analysis over all animals gave a poor coefficient of determination (r 2) and correlation (r) of both data sets (r2 = .486; r = .697; Figure 7a). The coverage of the data points using only vancomycin-treated animals showed a better result (r 2 = .789), similar to the correlation (r = .888; Figure 7c).
In addition, the bias calculated by a Bland-Altman plot over all animals (bias: 103; Figure 7b), as well as only over animals treated with vancomycin (bias: 270; Figure 7d) indicated that a direct comparison, even when using calculated fold-changes, is not recommended. The increase in Kim-1 determined by the WideScreen assay was much higher than that determined by the RENA-strip assay (Figure 7b, d).
Discussion
In this study, the detection of acute nephrotoxicity biomarkers was investigated for the biomarkers’ ability to detect renal damage in subacute 28-day toxicity studies in rats. Two multiplexing technologies, the Luminex xMAP–based WideScreen Rat Kidney Toxicity Assay and the Argutus AKI-Test Kit based on the MULTI-SPOT technology from MesoScale Discovery, were employed. A direct comparison was difficult because of the lack of similar biomarkers being present on both technology panels. In this study, the main focus was on the ability of the different assays to detect subacute renal damage.
Our data demonstrated the high accuracy and predictivity of several of these new markers, even after subacute treatment with different, well-described nephrotoxins. For a numerical interpretation of the diagnostic performance of each biomarker, the AUROC was calculated.
For cisplatin, all significantly altered markers were predictive for proximal and distal tubular damage (Table 2; Figure 3). The fact that no changes in cystatin C, β2m, α-GST, Timp-1, or Calbindin28 k were detectable could be due to these markers’ being increased at very early time points (<14 days) before dropping back to basal levels—when measured in this study. These markers of cisplatin-induced nephrotoxicity were expected at earlier time points, as cisplatin was one of the most common model compounds used by multiple consortia, including that which originally identified and validated these novel urinary protein biomarkers, including the ILSI/HESI Nephrotoxicity Working Group (Amin et al. 2004; Kramer et al. 2004; Thompson et al. 2004) and the PSTC (http://www.c-path.org/pstc.cfm).
Another point to highlight is that no urine from male rats treated with 1 mg/kg (HD) was collected, which led to an underestimation of true-positive urine samples. This would have affected the outcome of the measurement and underestimated the potential of these markers.
NGAL/lipocalin-2, a general marker for tubular damage, was observed at the earliest time and at the highest levels across all compounds. The 10- to 50-fold increases observed, even in the 0.1 mg/kg (LD) treatment group of cisplatin, were not directly related to any histopathological findings. Because of cisplatin’s known involvement in inducing an immune/inflammatory response, not only in the kidney (Zhang et al. 2008), the specificity of this marker in the kidney cannot be guaranteed. In our study, no strong signs for a systemic inflammatory response to cisplatin treatment were observed. Because of the very good performance of this marker within the vancomycin and puromycin studies, it is clear that NGAL can serve as a very early and accurate biomarker for general tubular damage, even after 28 days. The diagnostic potential across all compounds was 0.88 (0.80-0.95), indicating good diagnostic utility of this biomarker (Table 3). However, it cannot be currently clarified if the increase of NGAL after LD and MD treatment of cisplatin can be counted as a real predictive outcome (i.e., false-positive).
Because vancomycin-treated animals also showed a significant increase in the classic markers BUN and serum creatinine (Table 5b), it is not possible to show a higher sensitivity and specificity of the urinary protein biomarkers. However, the strong increase of Kim-1 after vancomycin treatment reflected a severe insult on the renal proximal tubular cells and in this case delivered additional information compared with the traditional parameters alone. Markers such as Kim-1, Timp-1, clusterin, and osteopontin, which are involved in tissue remodeling and cellular adhesion, appear to have a longer half-life, presumably because of upregulated expression in response to renal damage. The slight, but significant, increase in urinary total protein in female rats confirmed the gender-specific effect of vancomycin on renal tissue (as previously reported by Ducharme et al. 1994; Anderson 2008).
The lack of a significant increase of VEGF and α-GST after vancomycin treatment (Figure 4c, d, f, k) strongly suggests that VEGF, described as being predictive for general tubular damage, and α-GST for proximal tubular damage (Table 1) were unsuitable for the detection of nephrotoxicity after longer term treatment (in this case, 28 days; Figure 3c, 3k, 4c, 4k, 5c, 5k). As previously described (Hoffmann et al. 2010), VEGF also showed low diagnostic potential to detect nephrotoxicity induced by gentamycin, BI-3, or ochratoxinA after 7, 14, or 90 days. The inability of α-GST to predict nephrotoxicity at later times could be explained by the fact that any increase of α-GST in urine is caused by its release from necrotic cells. If the major damage taking place is at an earlier time point, the majority of α-GST would be released at very early times after exposure. If so, it should be possible to detect α-GST at earlier time points. In addition, the rat strain used should be taken in account within a study and should be chosen carefully because of strong differences in the excretion of some of these markers being reported. For example, it has been shown that the basal excretion of α-GST in Wistar rats is 10 times less than that of Sprague-Dawley rats (Gautier et al. 2010).
Excretion of (a) Kim-1, (b) Timp-1, (c) VEGF, (d) b 2m, (e) Clusterin, (f) Cystatin C, (g) Lipocalin-2, (h) Osteopontin, (i) Calbindin, (j) GSTYb1, (k) a-GST, and (l) RPA-1 in urine of rats treated with puromycin for 28 days. Measurements (a) to (i) were performed by the Luminex-basedWideScreen assay. Measurements (j), (k), and (l) were performed by the MesoScale Discovery platform using the ArgutusMedical AKI-Kit. Data are presented as individual animals and as the mean (bar; n = 6). *p < .05, **p < .01, ***p < .001 (ANOVA, Tukey).
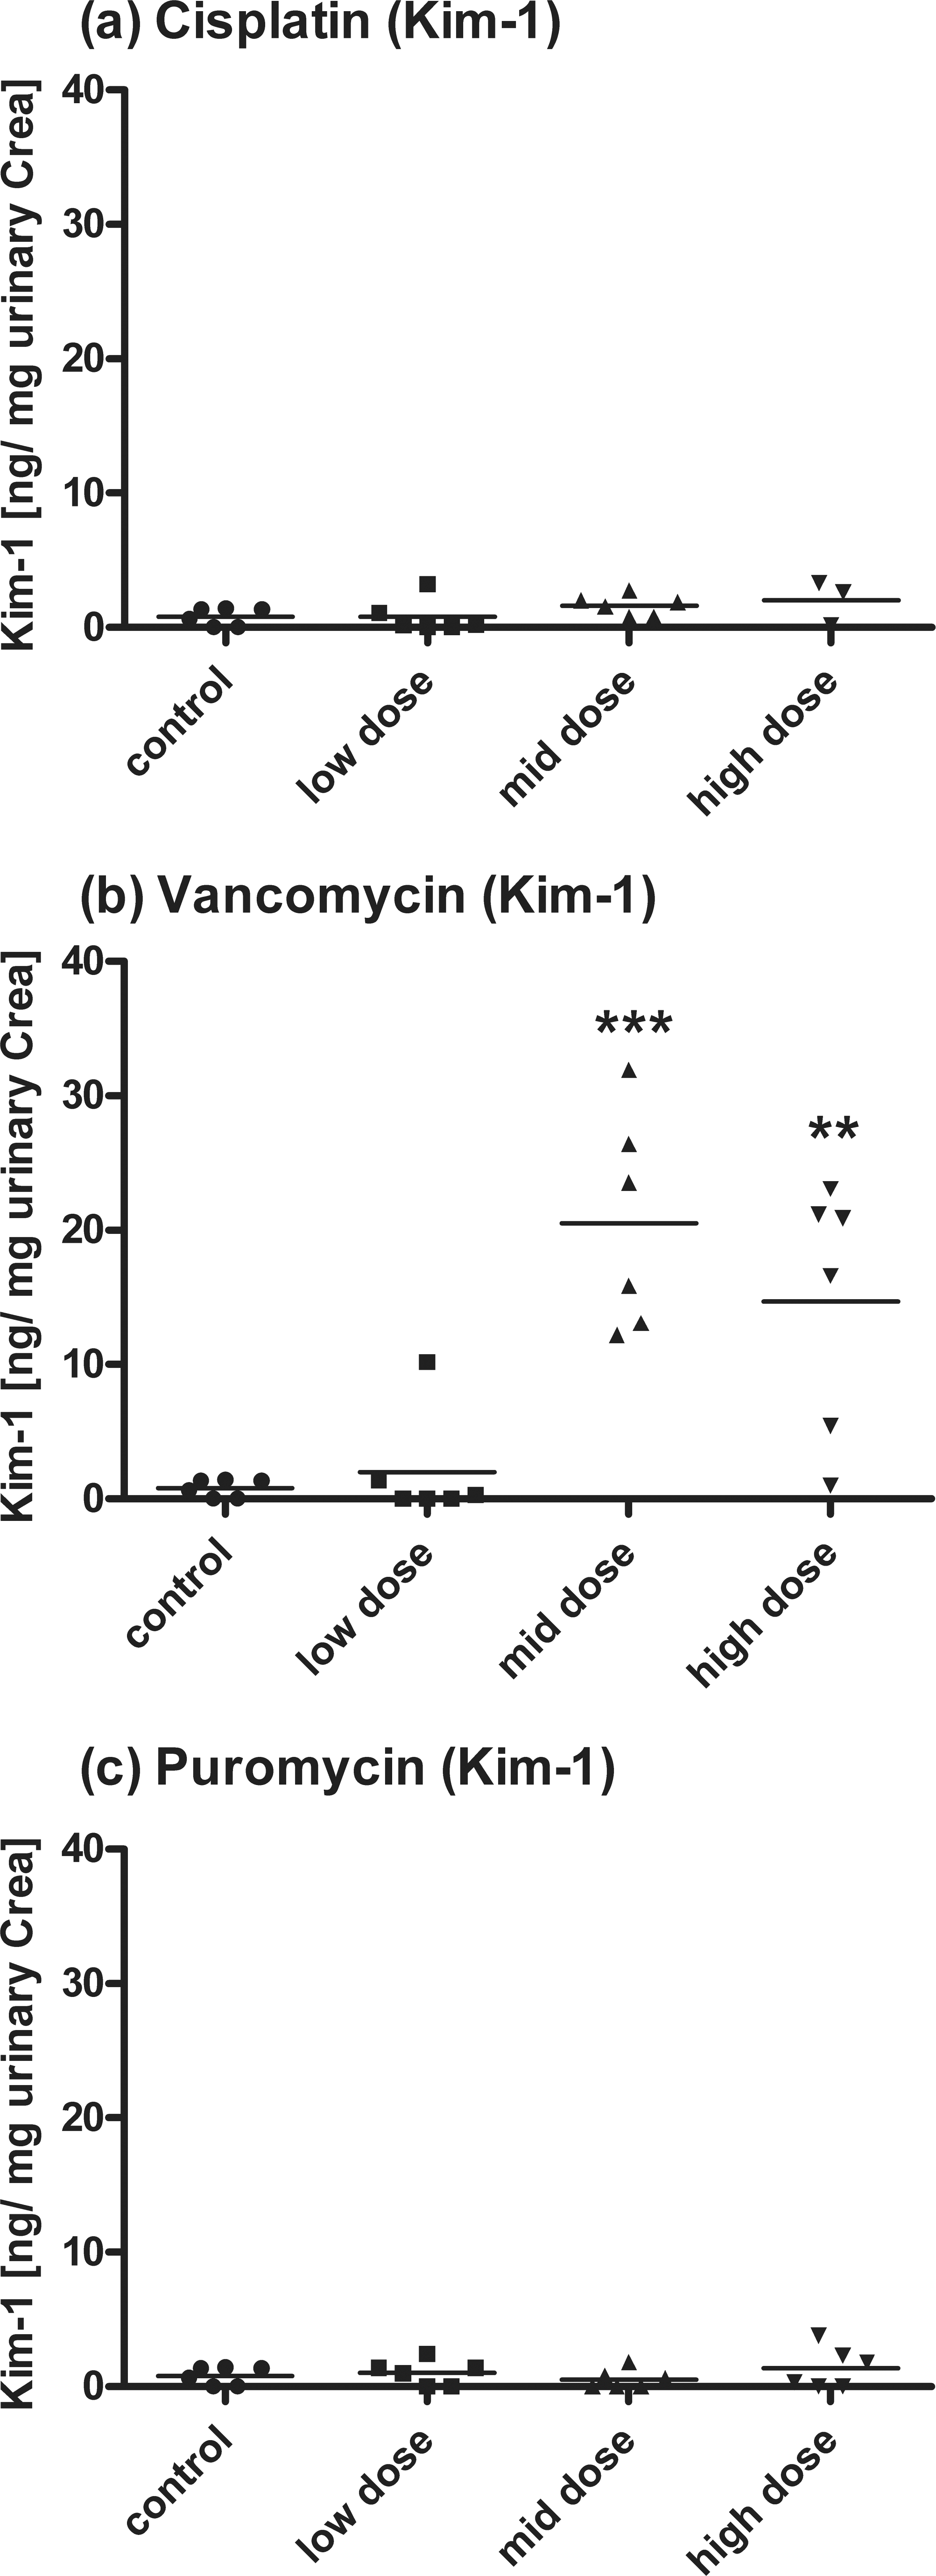
Detection of Kim-1 by RENA-strip dipstick assay after (a) cisplatin, (b) vancomycin, and (c) puromycin treatment. Data are presented as individual animals and as the mean (bar; n ¼. *p < .05, **p < .01, ***p < .001 (ANOVA, Tukey).
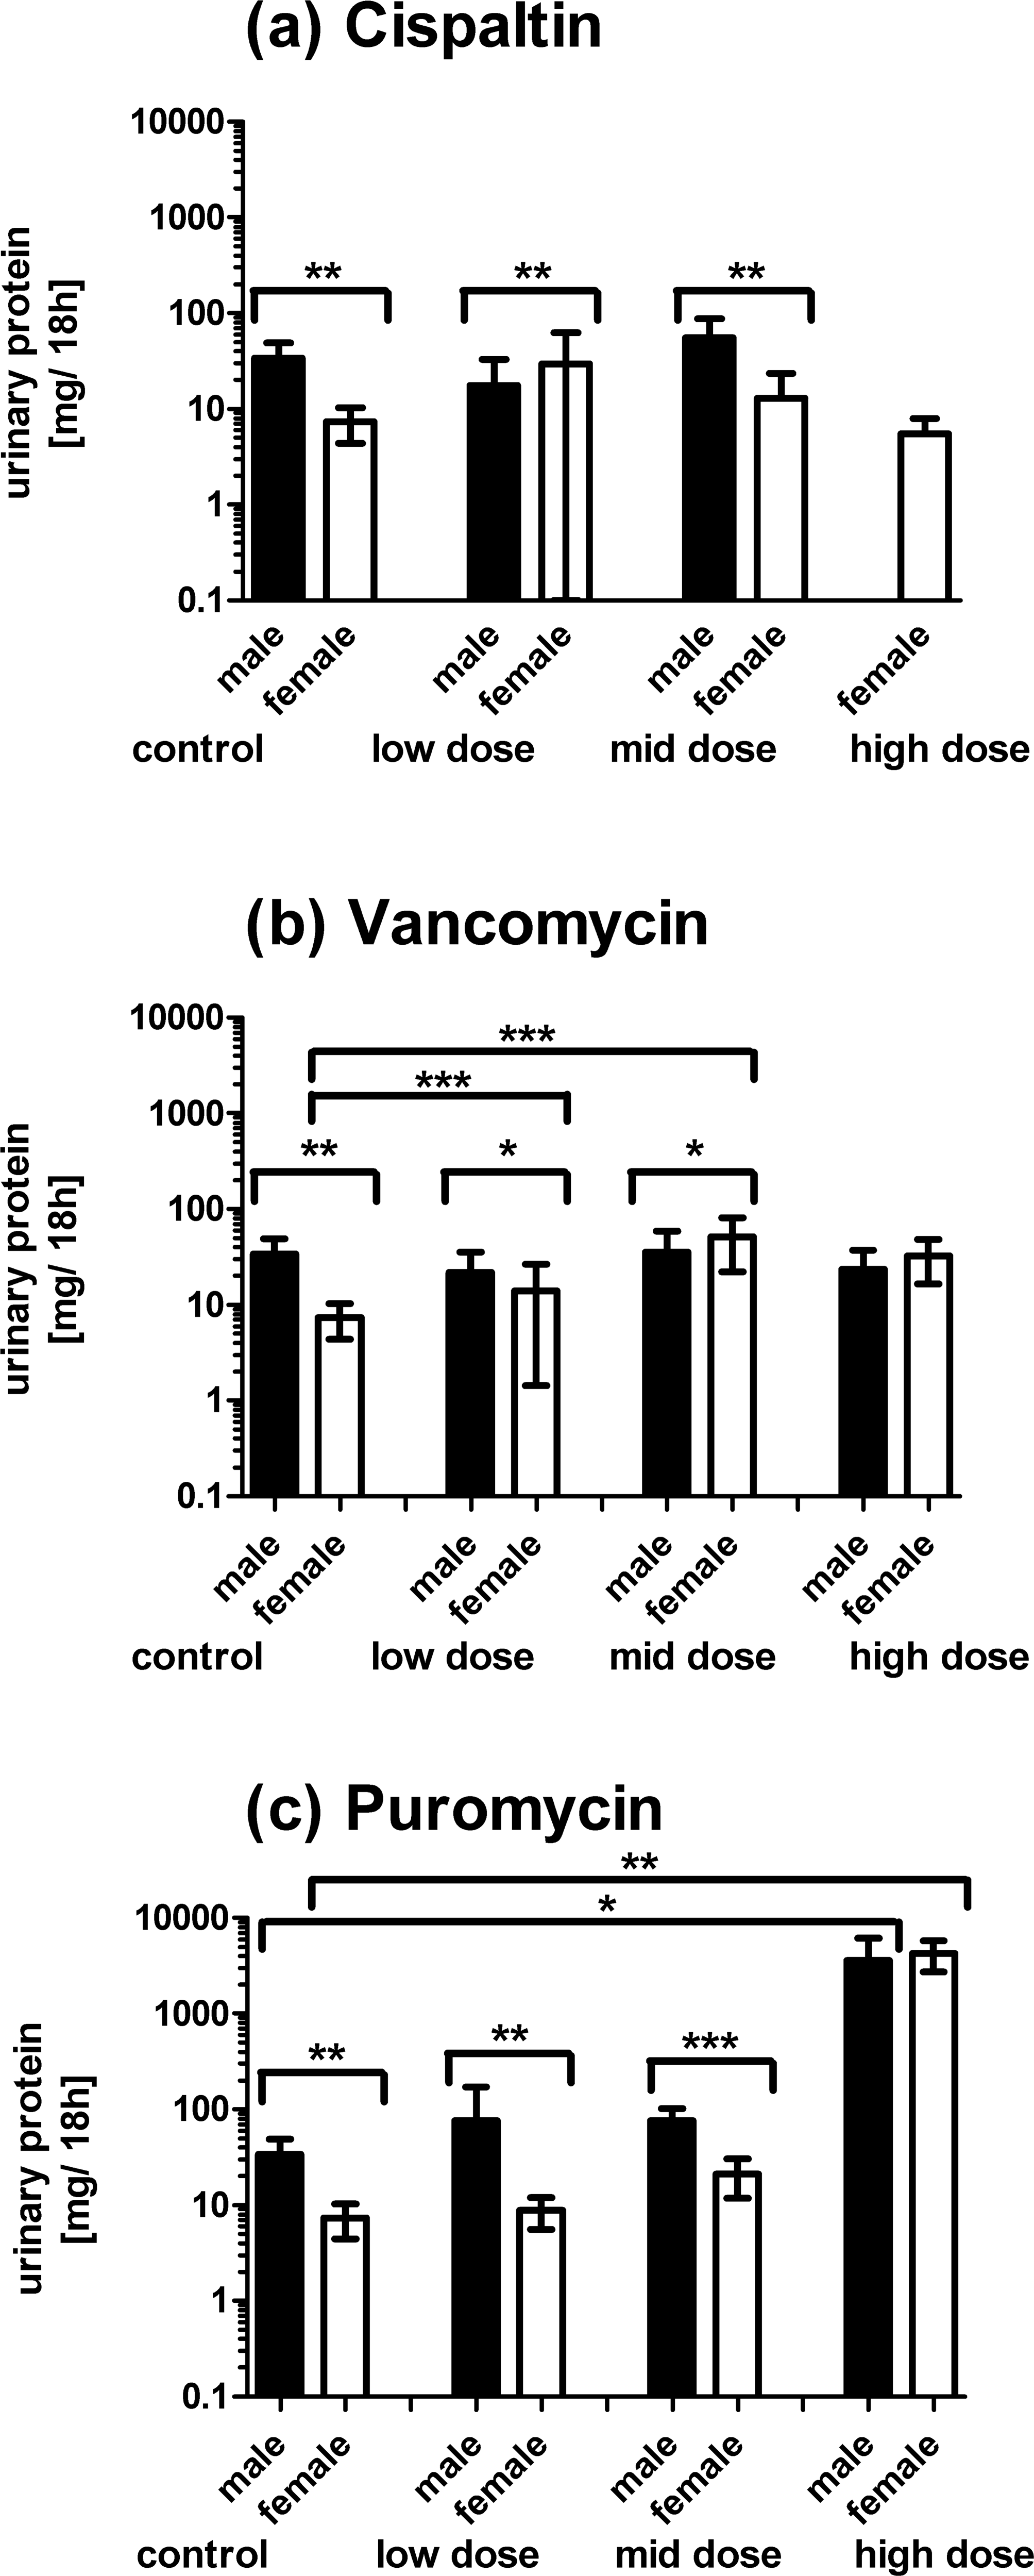
Detection of total protein in urine of rats treated with cisplatin (a), vancomycin (b), or puromycin (c) by Bradford assay. Each bar represents the mean ± SD of three animals (male or female). Measured data were normalized using urinary creatinine in the corresponding animal. *p < .05, **p < .01, ***p < .001 (Student's t test).
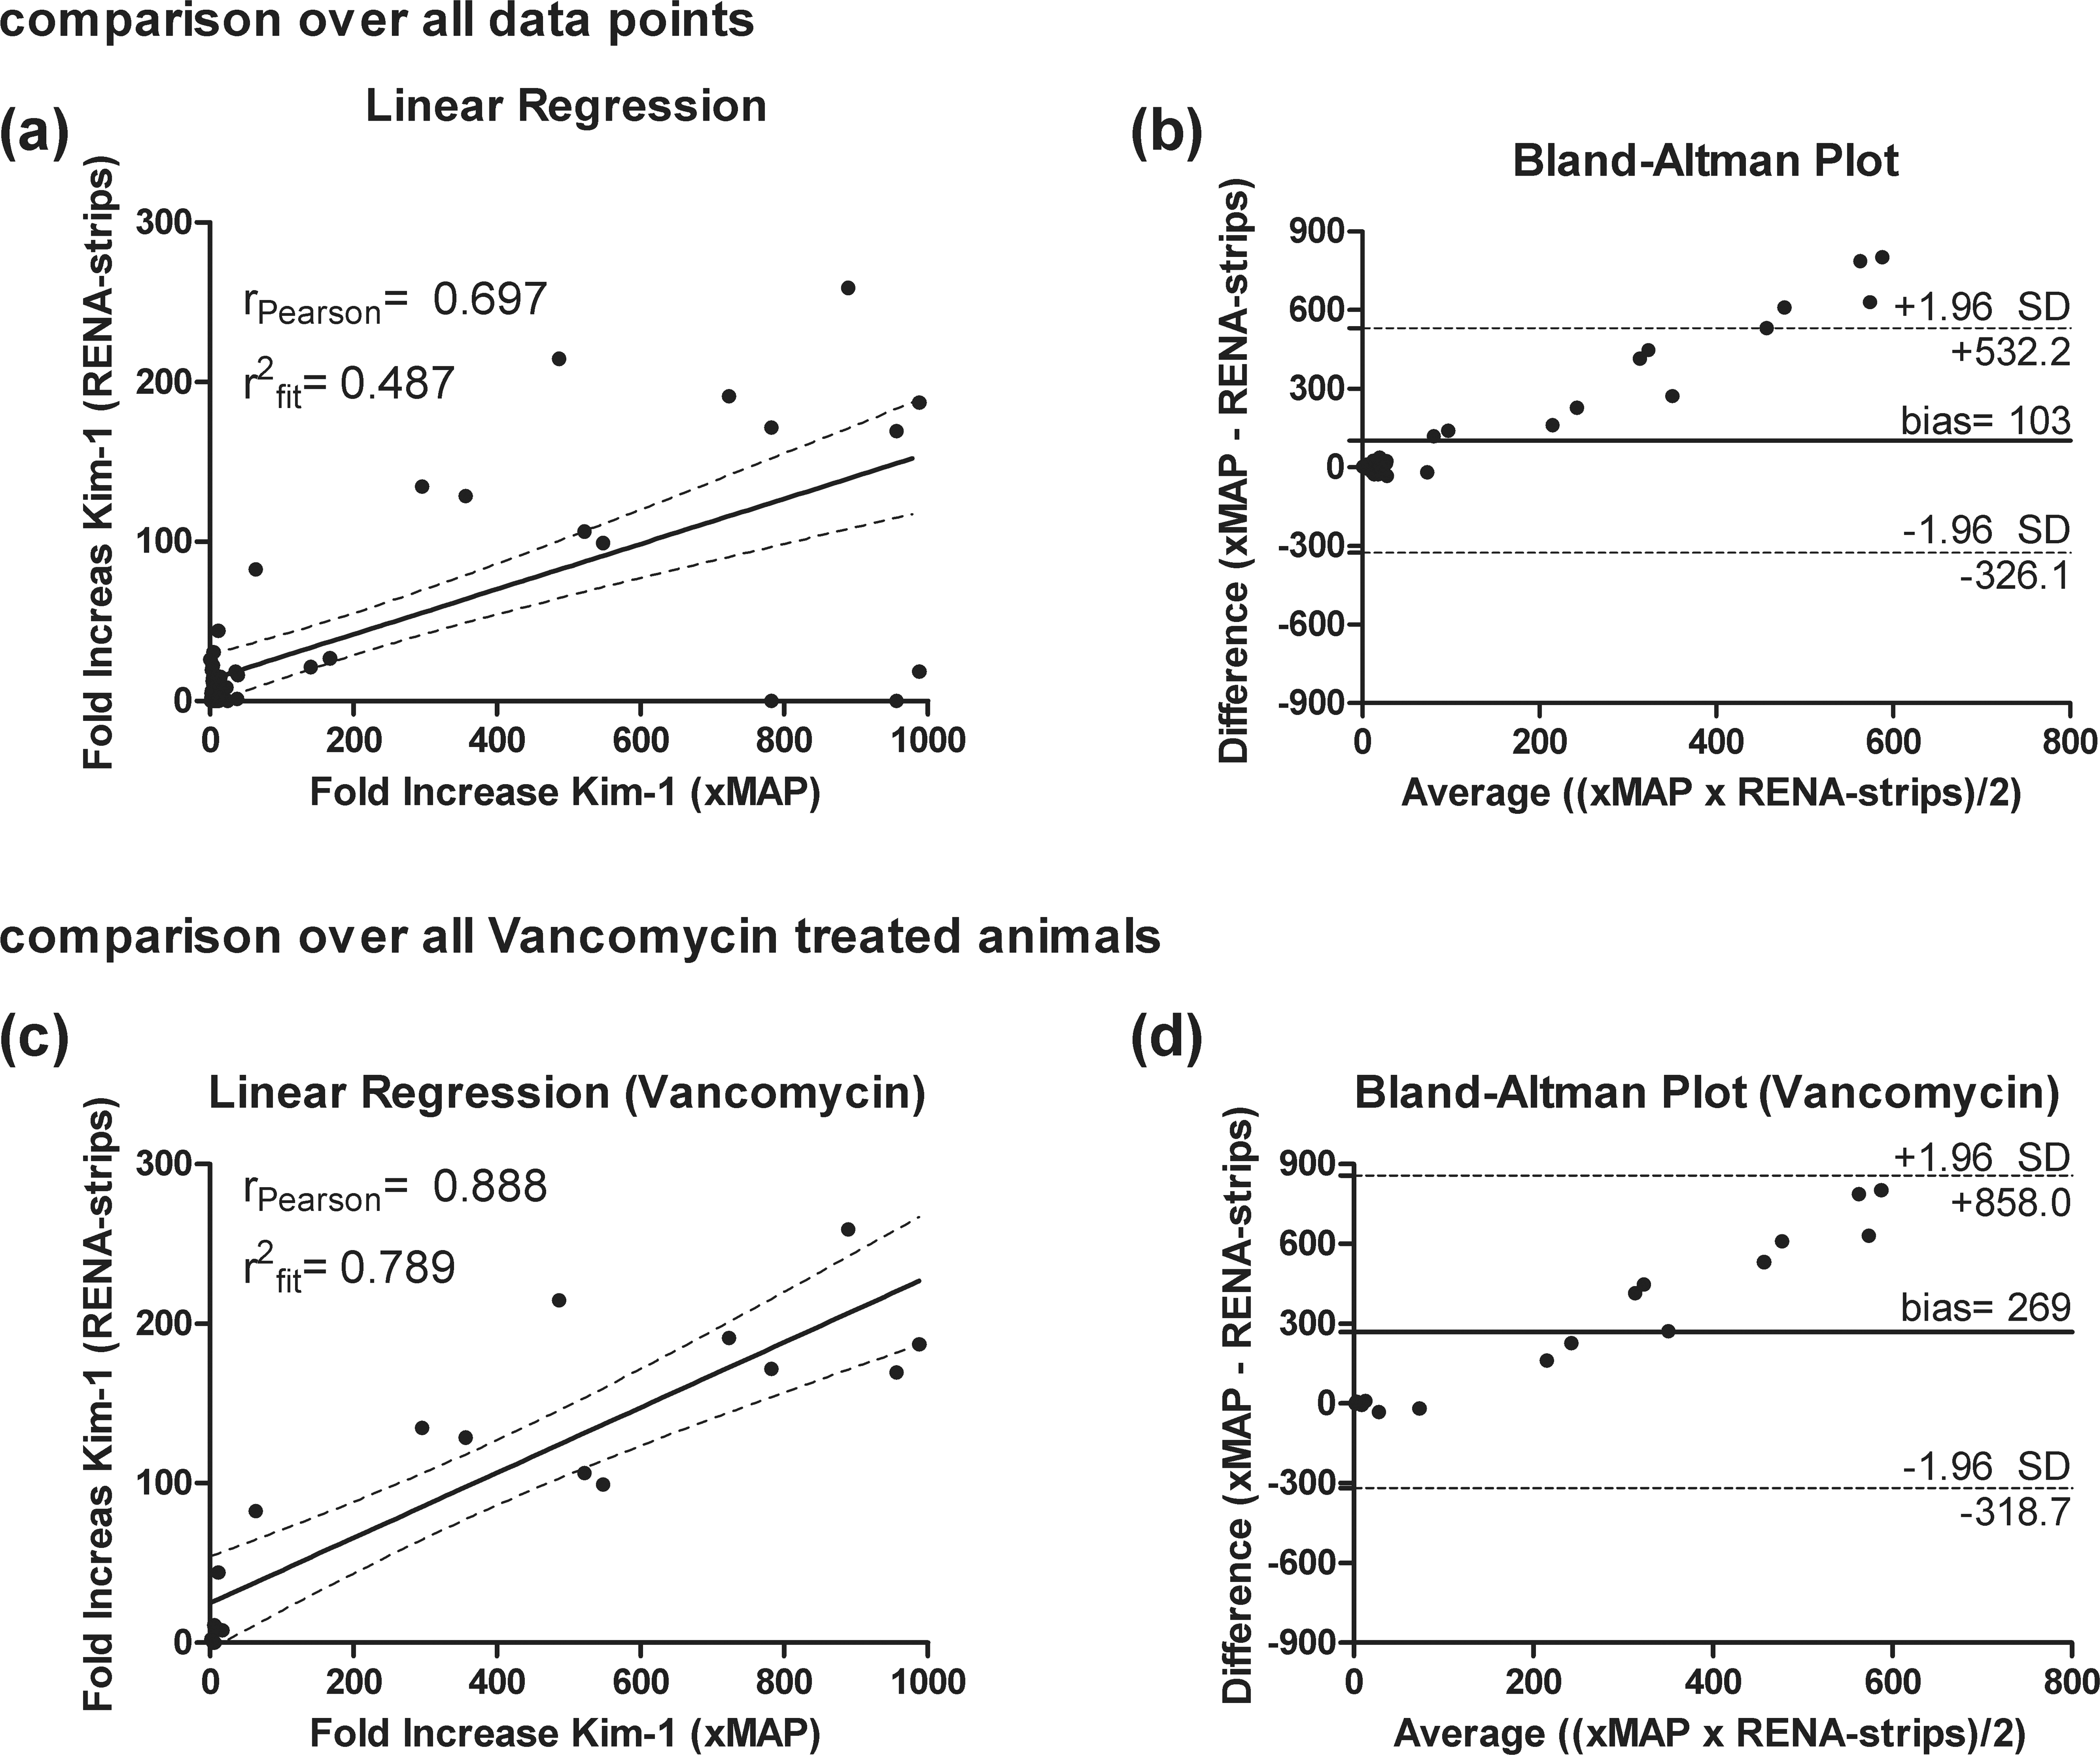
Linear regression and Bland-Altman analysis of Kim-1 determined by using the WideScreen Rat Kidney Toxicity Assays (xMAP) and the RENA-strip dipstick assay (RENA-strip). Both analyses are shown using fold-changes of all animals from all compounds (a+b) and using only animals treated with vancomycin (c+d). Linear regression is displayed by individual animals, and a solid line represents the regression line. The broken line represents the 95% confidence interval. In addition, the coefficient of determination (r 2 fit) and the Pearson correlation (r Person) is given. The Bland-Altman plot gives the average values on the x-axis and the differences of the two methods on the y-axis. The solid line indicates the mean difference or bias; broken lines indicate the 95% confidence limit of the bias.
For β2m and cystatin C, the greatest number of significant findings was observed in puromycin-treated rats. The mechanism related to β2m and cystatin C release, both functional biomarkers for tubular reabsorption, seems to be more affected by a glomerular protein overload then a reduced reabsorptive capability caused by proximal tubular cell breakdown. In contrast, the sensitivity of urinary total protein serves more as a marker for the detection of proximal tubular damage then glomerular alteration, at least when compared with β2m and cystatin C. Only the HD animals, treated with 20 mg/kg puromycin (HD), showed strong changes in the tubular system and in the glomeruli. As already stated, for all three markers, a large variation in the basal level between male and female rats was observed (e.g., total protein; Figure 2). It would be of great interest to identify potential differences between males and females, potentially increasing the sensitivity of these markers and generating more reliable data. In contrast to cisplatin and vancomycin, extensive liver damage was also detected in addition to the renal alterations. The clearly recognizable entangling lobules of the liver in puromycin HD–treated animals could be caused by peritonitis induced by the i.p. injection. Serum cholesterol and triglyceride, both promising markers for the detection of liver function (Danni et al. 1986; Farag and Hassib 1993, Amacher 2002), showed strong increases in HD animals. However, it is more likely that the massive increase in serum cholesterol, together with proteinuria, taken together with the lack of alterations in specific liver enzymes such as alanine transaminase, reflects a nephrotic syndrome. In addition, aspartate transaminase and alkaline phosphatase showed a strong and statistically significant decrease in animals treated with 20 mg/kg puromycin (HD; data not shown). In this case, it is important to note that puromycin was the only compound within this study that showed a significant increase in α-GST. Despite the low diagnostic performance of this marker, based on the calculated AUROC, it should be mentioned that serum α-GST is a potential biomarker for the detection of acute hepatotoxicity (Clarke et al. 1997; Lee et al. 2009). It is conspicuous that the significant increase of urinary α-GST was observed in animals that additionally showed strong morphological alterations in the liver. However, it cannot be finally elucidated whether the urinary α-GST observed in this study came from the massive breakdown of hepatocytes or renal tubular cells.
It is important to discriminate between the Luminex xMAP technology and the RENA-strip assay for the detection of Kim-1. The most promising result of the RENA-strip dipstick assay was seen within the vancomycin-treated groups (Figure 3b; Table 3). It has to be noted that the increase in urinary Kim-1 detected via the WideScreen assay was about five times higher than in the cisplatin- and 30 times higher than in the puromycin-treated groups. The right choice of technology is of prime importance because the diagnostic accuracy of biomarkers depends on the quality of the assay used. This is reflected by the different AUROC values for Kim-1 (Table 3). In addition, these differences were more obvious when comparing the fold-change of Kim-1 for both technologies via linear regression and Bland-Altman analysis (Figure 7), including also in the vancomycin-treated groups. A parallel use of both technologies and the unrestricted comparison of absolute values or fold-changes are not possible. It has to be recognized that a bias of 270 in urinary Kim-1 expression levels is a clear hint that the determination of a general and methodological independent threshold for this biomarker is not possible. The fact that the correlation becomes better only when using the vancomycin-treated animals, while the bias increased, is due to the RENA-strip’s assay not being able to detect low levels of urinary Kim-1 in the cisplatin- and puromycin-treated animals.
Conclusion
Taken together, the majority of the urinary protein biomarkers tested in this validation study were able to predict subacute (28-day) changes related to cisplatin-, vancomycin-, and puromycin-induced nephrotoxicity earlier than the classic detection markers serum creatinine or BUN. In addition, the diagnostic value of most of the markers, determined via ROC analysis, showed a very positive outcome for their ability to predict subacute renal changes and hence their suitability for implementation into routine regulatory toxicity testing. However, it is essential to test different assays independently of the underlying technologies for their ability to robustly monitor these analytes. In our study, the sensitivity, and thus the predictivity, of the markers varied strongly. To study any potential influence of the technology used, further studies, employing more overlapping biomarker panels on different platforms, have to be performed. The Luminex xMAP–based WideScreen assays have the great benefit of a high number of markers being included. In addition, the markers cover the different types of expected damage to the kidney. The MesoScale Discovery–based biomarkers, provided by Argutus Medical Ltd., also delivered promising results, but it has the great disadvantage that only three markers can be measured simultaneously. No specific marker for the detection of glomerular damage is included, and the specificity of α-GST is limited by the fact the liver damage also potentially leads to an increase in serum levels, which can subsequently influence the urinary concentrations in rats.
Many questions remain to be addressed with regard to the utility of these novel nephrotoxicity biomarkers. Especially for a nondaily treatment regimen (as used in our studies), it is of major interest to discover the optimum timeline of biomarker excretion, especially against the background of the high regeneration properties of renal tissue. It is also of interest to identify any potential recovery from renal injury based on excretion of the urinary biomarkers. In addition, besides age dependency in the biomarker excretion, which has recently been shown (Espandiari and Rosenzweig 2010), gender differences in urinary biomarker excretion may exist. This could influence the sensitivity and/or specificity of some of the markers. Therefore, before considering implementation of these assays into preclinical studies, further investigations are required to differentiate between general differences in the biomarker expression pattern and excretion and the ability to discriminate gender-specific toxic insults induced by xenobiotics.
Footnotes
The authors declared no potential conflicts of interest with respect to the research, authorship, and/or publication of this article.
The research was partly funded by the German Federal Ministry of Education and Research (BMBF) together with Merck Serono Research as a part of the Biomarker Center (BMC-08) of the BioRN Biotech Cluster (FKZ 01EX0904).