
Abstract
The Liver Toxicity Biomarker Study is a systems toxicology approach to discover biomarkers that are indicative of a drug’s potential to cause human idiosyncratic drug-induced liver injury. In phase I, the molecular effects in rat liver and blood plasma induced by tolcapone (a “toxic” drug) were compared with the molecular effects in the same tissues by dosing with entacapone (a “clean” drug, similar to tolcapone in chemical structure and primary pharmacological mechanism). Two durations of drug exposure, 3 and 28 days, were employed. Comprehensive molecular analysis of rat liver and plasma samples yielded marker analytes for various drug–vehicle or drug–drug comparisons. An important finding was that the marker analytes associated with tolcapone only partially overlapped with marker analytes associated with entacapone, despite the fact that both drugs have similar chemical structures and the same primary pharmacological mechanism of action. This result indicates that the molecular analyses employed in the study are detecting substantial “off-target” markers for the two drugs. An additional interesting finding was the modest overlap of the marker data sets for 3-day exposure and 28-day exposure, indicating that the molecular changes in liver and plasma caused by short- and long-term drug treatments do not share common characteristics.
Introduction
The Liver Toxicity Biomarker Study
The Liver Toxicity Biomarker Study (LTBS) is a preclinical systems biology approach for addressing the dilemma of unanticipated clinical drug-induced liver injury (DILI) and its negative impact on individuals, the health care system, and pharmaceutical companies. One aspect of DILI is presumed to be individual susceptibility. Efforts to discover markers that predict an individual’s predisposition to DILI have been pursued (Daly 2010). Predictive markers that reveal which drugs are most likely to combine with individual predispositions to yield idiosyncratic toxicity may also facilitate a better understanding of DILI. The overall goal of the LTBS is to test a fundamental hypothesis (see below) and, if that hypothesis is not refuted, to discover candidate biomarkers that could, following validation, be incorporated into the drug development process.
Fundamental Hypothesis: Despite the absence of conventional indicators of liver toxicity in preclinical studies, there exist biochemical signals (molecular biomarkers) in liver or body fluids that can be used to distinguish drug candidates that have the potential to cause DILI in susceptible patients from drugs that do not have this potential.
The rationale for undertaking the LTBS and the design of phase I have been presented in detail in a previous publication (McBurney et al. 2009). The essential feature of the LTBS phase I design is the comparison of the effects on comprehensive molecular profiles of rat liver, blood plasma, and urine of a “toxic” drug and a “clean” drug. The phase I “toxic” drug, tolcapone, has been associated with idiosyncratic liver toxicity in humans but did not demonstrate liver toxicity in preclinical animal studies, as measured by gross or microscopic liver pathology or by changes of the activity of transaminases in blood plasma or serum. The phase I “clean” drug, entacapone, is similar in chemical structure and primary pharmacological mechanism of action to tolcapone but has not been associated with liver toxicity either in humans or animals. Ultimately, following completion of phase II of the LTBS, in which four additional “toxic” versus “clean” drug pairs will be studied, it will be possible to compare, across all five pairs, the markers which distinguish the “toxic” drug from the “clean” drug in each pair in order to reveal preclinical biomarkers common to the drugs that are associated with idiosyncratic liver toxicity in humans.
One key question addressed in phase I was the extent to which the technological approach would be able to reveal the “off-target” molecular effects of two drugs that were designed to have identical primary pharmacological actions. If the molecular changes induced by dosing rats with either drug were found to be identical, there would be no chance for ultimately discovering molecular signatures predictive of clinical idiosyncratic liver toxicity using the overall LTBS design. However, if substantial differences were found between the molecular effects induced by dosing rats with tolcapone or entacapone, then it would be reasonable to advance to phase II of the LTBS with the expectation that substantial “off-target” molecular profiles would be found for all drug pairs. The availability of large data sets of molecular markers for the “off-target” effects of both “toxic” and “clean” drugs would enhance the prospects of achieving the overall goal of the LTBS.
Two durations of dosing, 3 days and 28 days, were used in phase I of the LTBS in order to provide information about the influence of dosing duration on the comprehensive molecular profiles in liver, plasma, and urine. Many toxicogenomics studies have employed short-term dosing studies with compounds known to be overtly hepatotoxic in rodents to search for molecular markers in liver of hepatotoxic mechanisms (see, e.g., Ganter et al. 2005; Martin et al. 2006; Dai et al. 2006; Foster et al. 2007; Blomme et al., 2009). We were interested in determining, for drugs that had similar chemical structures and pharmacological mechanisms and that were not overtly hepatotoxic in rats, whether 3 days of dosing would yield differential markers and whether the markers found following 3 days of dosing would be the same as those found following 28 days of dosing. The results would also determine the importance of including both short- and longer-term durations of dosing in phase II of the LTBS.
Our previous publication (McBurney et al. 2009) presented preliminary results on the liver and plasma markers discovered across multiple bioanalytical platforms for the 28-day dosing study in the space of gene transcripts, proteins, and metabolites/small molecules. In this article, we present the results for the liver and plasma markers discovered across the same set of bioanalytical platforms for the 3-day dosing study. We also examine the extent to which there is overlap between the molecular effects induced by tolcapone and entacapone. Additionally, we compare the overlap of the 3-day dosing and 28-day dosing marker sets in order to determine whether the molecular changes seen in the short-term dosing study reflect the molecular changes seen in the longer-term dosing study.
This article provides a quantitative view of the marker landscape and discusses the general implications of overlaps and differences between the various marker data sets generated by dosing rats with tolcapone or entacapone for either 3 or 28 days. The interpretation of these overlaps and differences in terms of biochemical mechanisms will be the subject of a subsequent article.
Materials and Methods
Drugs
Entacapone was provided by Orion (Espoo, Finland) as a single lot. Tolcapone was purchased from US Pharmacopeia (Rockville, MD) as a single lot.
Study Design, Sample Collection, and Analysis
The design and conduct of the animal study, the collection of the liver and plasma samples, and the comprehensive molecular analysis of these samples have been described in detail in a prior publication (McBurney et al. 2009). Rats were dosed daily by oral gavage as outlined in Table 1. There were twelve male and twelve female rats in each study cohort. Results presented here are based on samples harvested from the male rats only. All animal experimental procedures were reviewed and approved by the Institutional Animal Care and Use Committee at the National Center for Toxicological Research.
Dosing cohorts for liver toxicity biomarker study (LTBS) phase I.
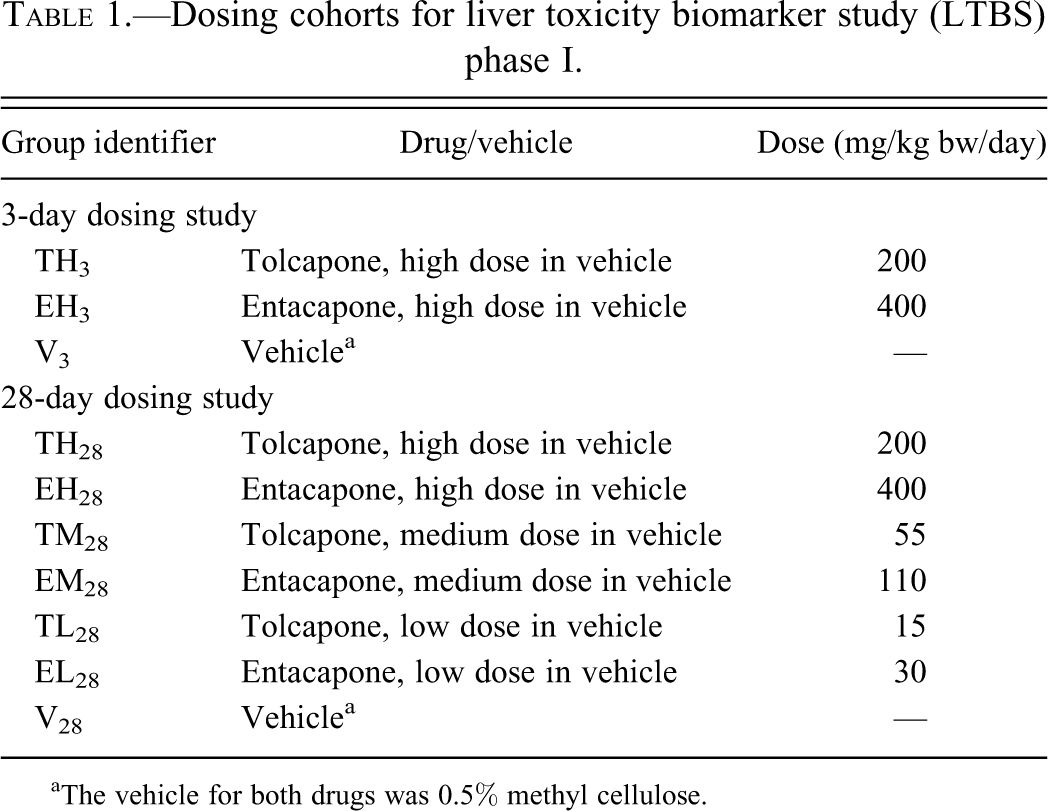
aThe vehicle for both drugs was 0.5% methyl cellulose.
Statistical Methods for Biomarker Discovery
The statistical methods used to discover marker analytes for the drug treatments have been described in detail in a prior publication (McBurney et al. 2009). We focused on the following cohort comparisons to derive markers for the effects of the drugs and for the differences between the effects of the drugs: TH3-V3, EH3-V3, TH3-EH3, TH28-V28, EH28-V28, TM28-V28, EM28-V28, TL28-V28, EL28-V28, TH28-EH28, TM28- EM28, and TL28-EL28. Markers were classified as shown in Table 2 (see McBurney et al. 2009 for a detailed explanation of the classification scheme).
Marker classes.
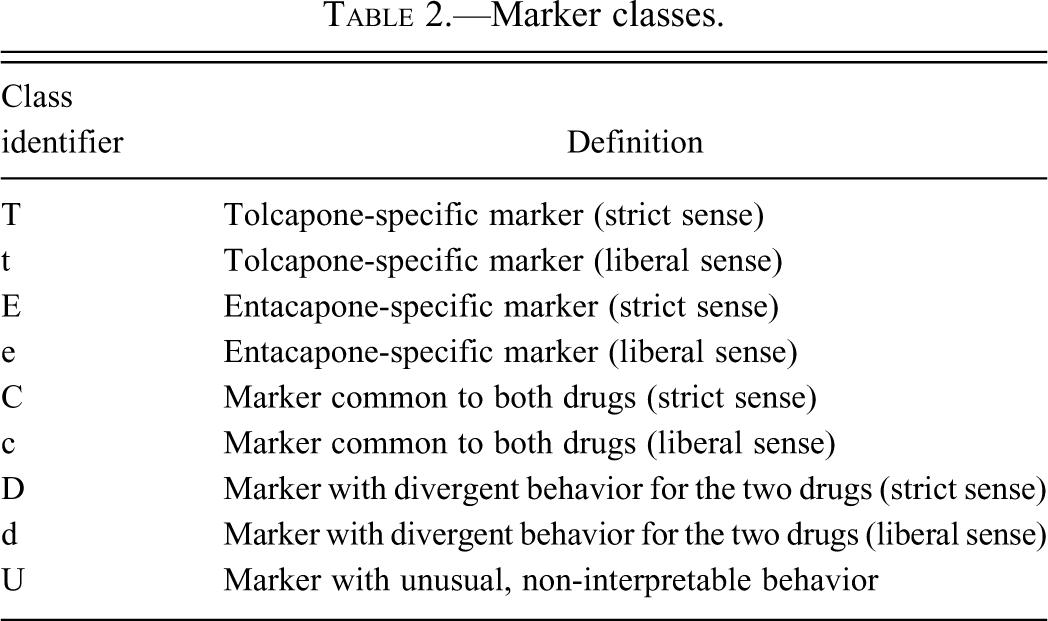
Marker categories were crafted to partition markers in accord with a three-way comparison between vehicle and each of tolcapone and entacapone. Strict sense markers fit to idealized criteria. For example, a strict sense tolcapone marker (T) is significant in TH-V, and in TH-EH, but not in EH-V comparison. This combination is most decisively representative of an effect specific to treatment with tolcapone. Liberal sense tolcapone markers (t) include analytes for which the TH-V comparison was significant, but not the TH-EH comparison. Common markers in the strict sense (C) are significant in both TH-V and EH-V but not in TH-EH comparison. Markers that are significant in all three comparisons (with the same duration of dosing) and change in the same directions in comparison with the vehicle are designated as liberal sense common markers (c). Strict sense markers with divergent behavior (D) indicate significance in all three comparisons with one drug producing an increase compared to vehicle and the other drug producing a decrease compared to vehicle.
A final marker liberal sense classification “d” was recorded here for analytes where only the TH-EH test was significant. In our previous publication (McBurney et al. 2009), such markers were categorized as “e” or “t” depending upon which drug treatment showed the greatest magnitude change from vehicle. The U class represents analytes that met the significance criteria in an unclassified manner, for example, significance in comparing a medium dose but not at the higher dose. Although such a behavior might be rationalized in some cases, it is argued here that the majority of these markers are artifacts of analysis and thought of as false discoveries.
Results and Discussion
General Observations
The gross and microscopic pathology findings, clinical chemistry results, performance of the bioanalytical platforms, and an initial overview discussion of marker findings have been presented in a prior publication (McBurney et al. 2009) and are summarized below.
Neither tolcapone nor entacapone cause any treatment-related effects upon body weights, liver weights, kidney weights, or liver-to-body weight ratios with either the 3-day or 28-day exposure. No conventional pathology or chemistry measures indicated liver toxicity in the study animals dosed with either drug for either 3 or 28 days. This represented a key result for the study and provided the basis for comparing the molecular changes induced by administration of tolcapone and entacapone.
To create appropriate reference material for relative quantification and to track the performance of the analytical workflows, approximately equivalent amounts of liver or plasma samples from each rat were combined and realiquoted. These plasma or tissue samples are referred to as quality control (QC) samples. A total of 32,895 analytes was measured in the liver QC samples by the five bioanalytical platforms, and a total of 678 analytes was measured in the plasma QC samples. The coefficients of variation (CVs) were less than 20% for the majority of analytes measured in the liver and plasma QC samples. The list of analytical platforms is presented in Table 3.
Number of markers by bioanalytical platform and classification in the 3-day dosing study.
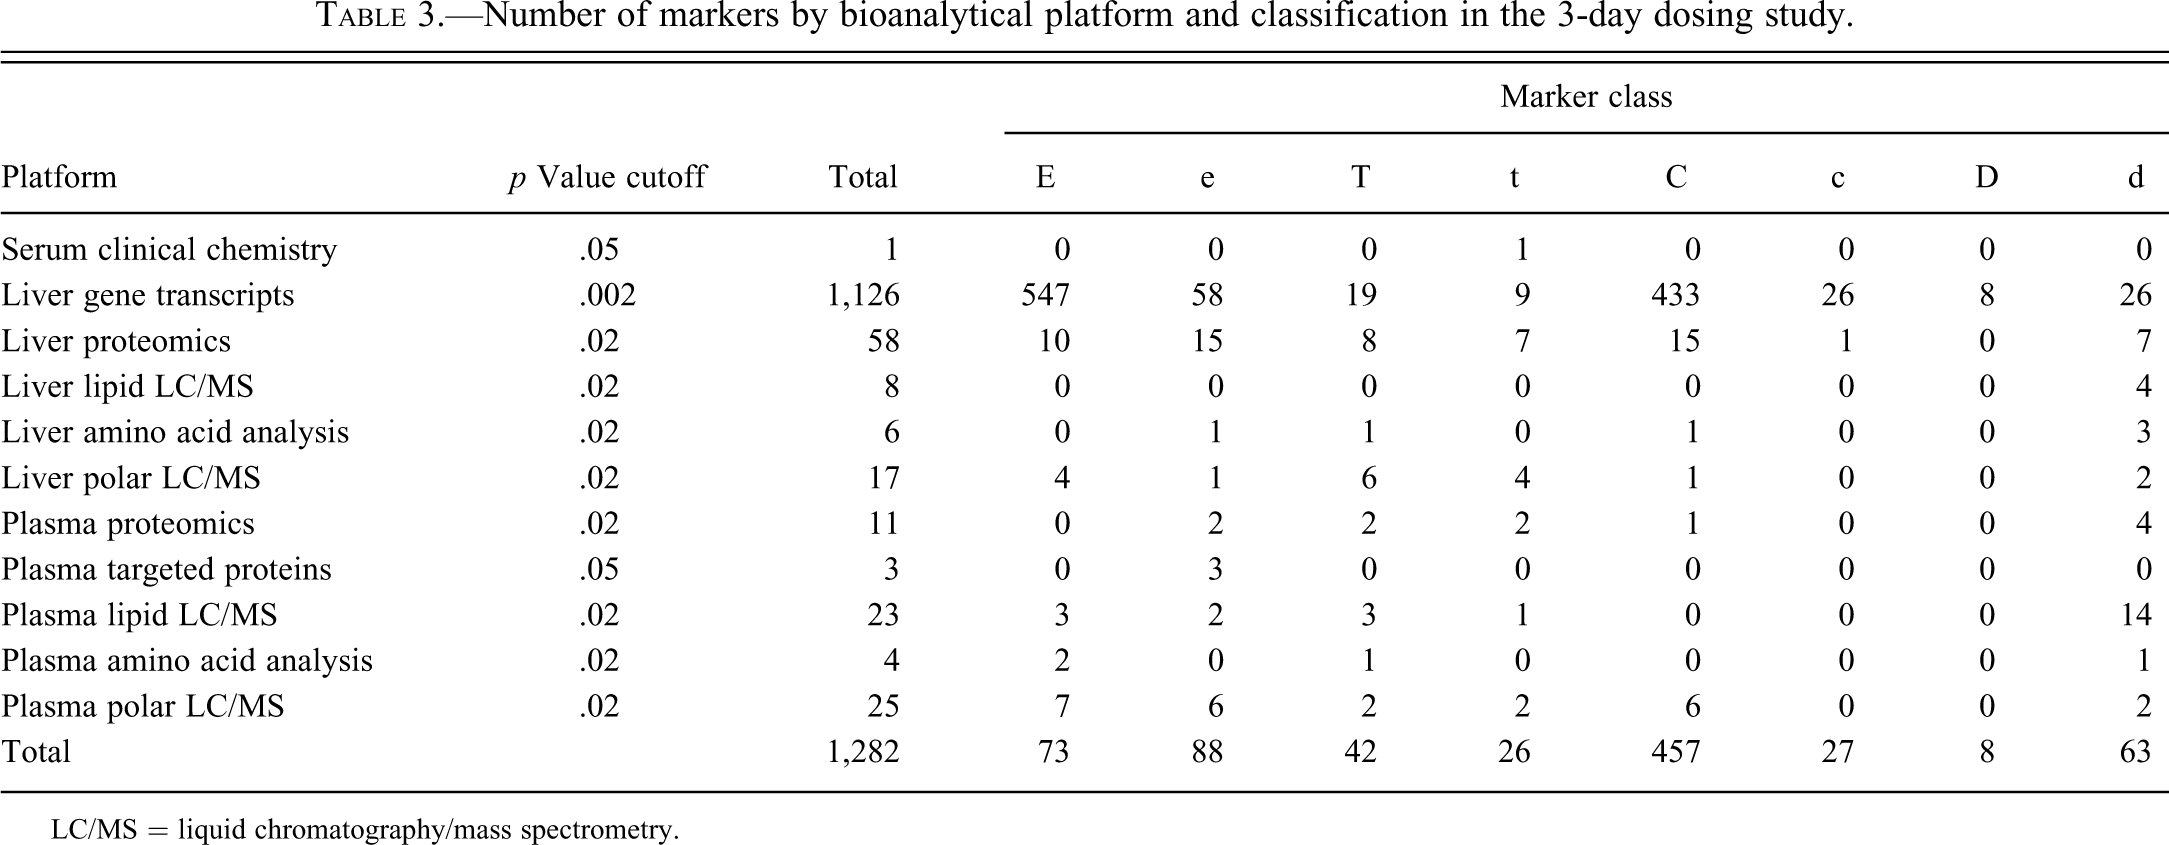
LC/MS = liquid chromatography/mass spectrometry.
Statistical Results for Tolcapone Effects and Entacapone Effects on Analytes in Liver and Plasma from the 3-Day Dosing Study
For both the 3-day and the 28-day dosing studies, on a platform-by-platform basis, each data set was subjected to analysis of variance in order to determine the statistical significance associated with the observed median-fold changes (MFC) in each pairwise comparison between the treatments listed in Table 1. Analytes meeting a certain criterion of statistical significance in specific cohort comparisons, as defined by a specific p value cutoff, were declared to be “markers.”
We have previously presented, for the 28-day dosing study, the number of markers derived from the analysis of liver samples or plasma samples using each applicable bioanalytical platform (see McBurney et al. 2009). Table 3 presents the overall results for numbers of marker analytes from the 3-day dosing study. The p value cutoffs, chosen per platform and shown in Table 3, were based on an ad hoc selection that sought a balance between false discovery and false negatives (omission of significant analytes due to excessively stringent criteria). False discovery is a greater concern for the gene transcript platform because of the large number of analytes measured. By assuming that markers of the “U”-type are predominantly false discoveries and that EH28-V28 markers are predominantly true discoveries, one can estimate the rate of false positive discoveries. Typical “U”-type markers are EL28-V28 “markers” that are not significant in the EH28-V28 comparison. The number of such “markers” relative to EH28-V28 markers is 9.4% for transcripts at a p value cutoff of .002, and a maximum of 14.1% for all other analytes at a p value cutoff of .02. With this estimate, it is fair to assume that the false discovery rate (FDR) is between 10% and 15% for the markers shown in Table 3.
Classification of the markers into the categories in Table 2 requires multiple testing for each analyte. A platform-specific p value cutoff—as indicated in Table 3—was applied as a threshold for “E,” “e,” “T,” “t,” and “d” types of markers. Once an analyte was found to pass the p value cutoff in one of the comparisons, a relaxed p value cutoff of .05 was used for establishing significance in the remaining comparisons in order to maximize the number of markers detected (e.g., for a transcript marker of the category E exhibiting a p value less than .002 in the E-V comparison, a p value of less than .05 was used in the E-T comparison and a p value of greater than .05 was used in the T-V comparison). For the “C,” “c,” and “D” type markers, a uniform p value cutoff of .05 was used for the first, second, and third comparisons.
The classifications of markers for the 28-day study were presented in McBurney et al. (2009). In that report, both initial and subsequent comparisons were conducted using the cutoff p values indicated in Table 3. In order to allow comparisons between the 3-day and 28-day studies, the data reported in McBurney et al. (2009) have been updated by taking into consideration the relaxed p value cutoff values noted above for subsequent comparisons and the modified classification categories. The results are presented in Table 4. From these tables, it is apparent that, irrespective of the duration of dosing, treatment with entacapone is associated with a larger number of marker analytes than treatment with tolcapone. As speculated in the earlier publication (McBurney et al. 2009), the explanation for this result could be that, on a molar basis, the amount of entacapone administered was approximately twice the amount of tolcapone. If this explanation is correct, the biochemical processes activated by the greater molar amount of entacapone are likely to be “off-target” processes, since the doses of tolcapone and entacapone were chosen to be equiefficacious, based on the behavioral effects in rats resulting from the primary mechanism of action of both compounds.
Number of markers by bioanalytical platform and classification in the 28-day dosing study.
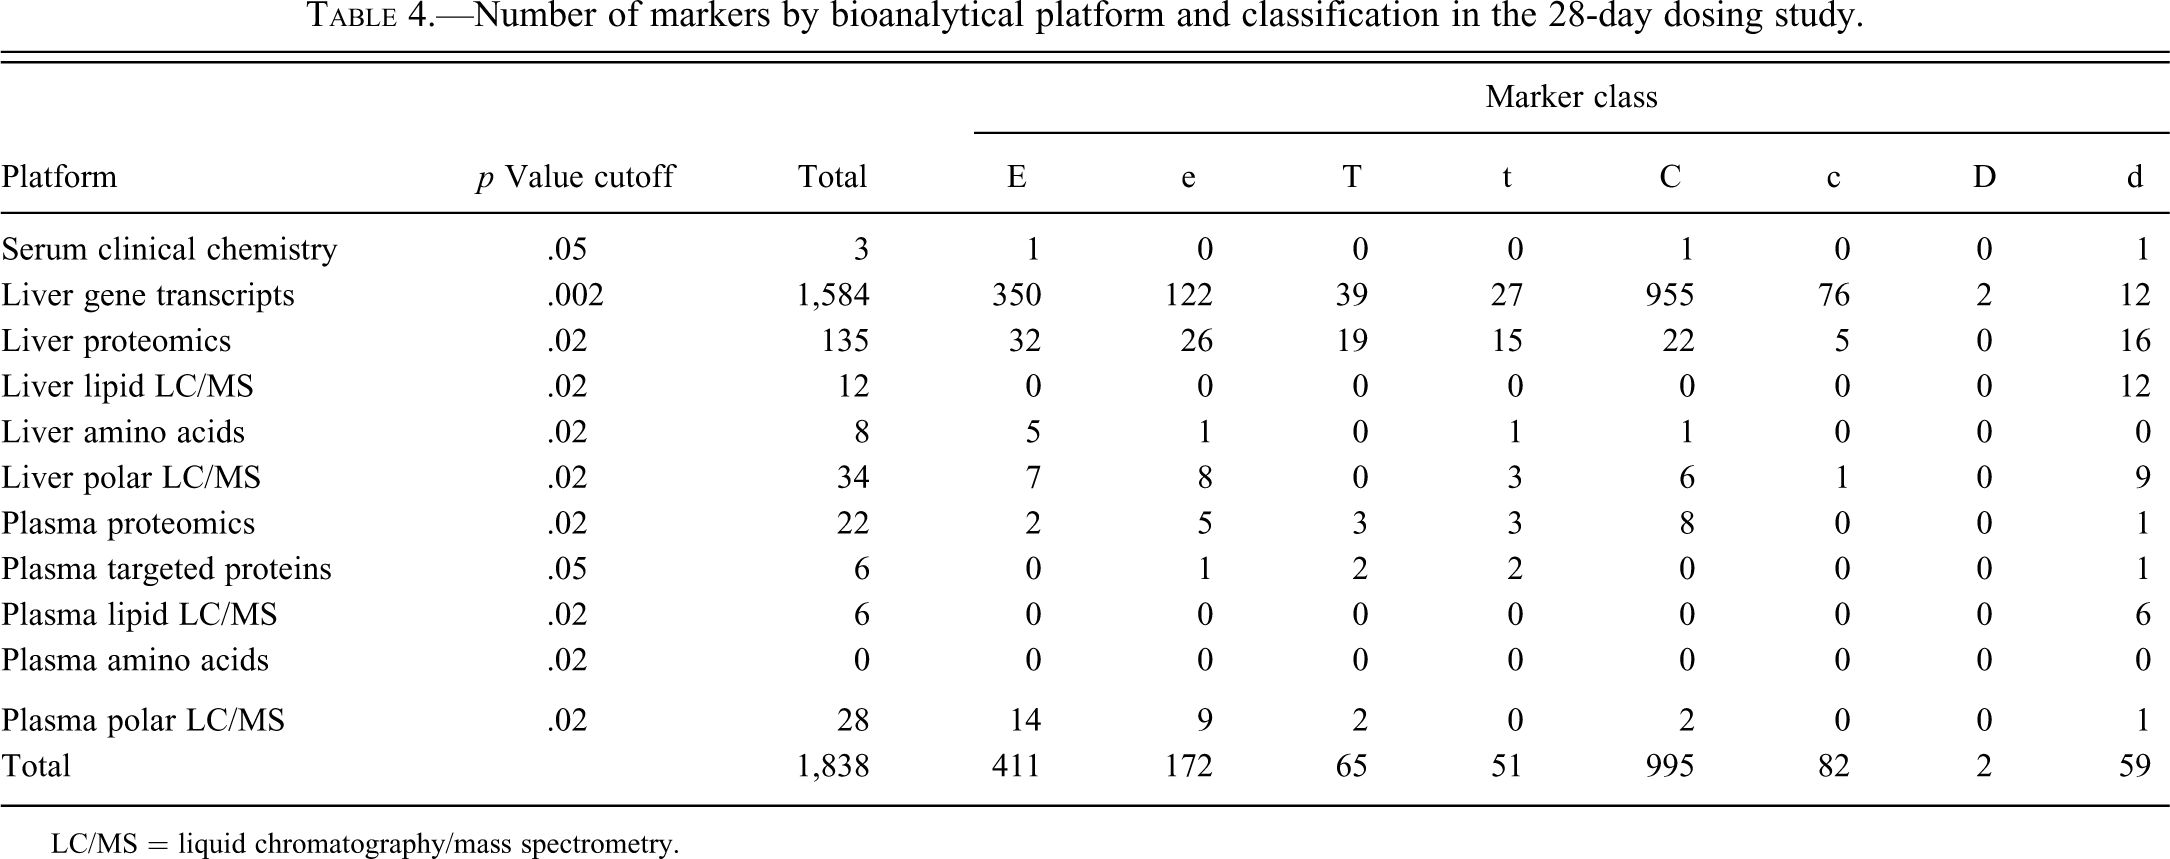
LC/MS = liquid chromatography/mass spectrometry.
One might expect the total number of markers to go up with increased drug exposure in the 28-day dosing. Aside from plasma lipids and amino acids, there is a clear increase, but perhaps more remarkable is the increase in the number of strict common markers (C), especially among gene transcripts. This strongly suggests an increasingly coherent mechanism of action of entacapone and tolcapone when given for an extended period of time.
Comparisons of Markers in Liver and Plasma from the 3-Day and the 28-Day Dosing Studies
Table 5 presents the MFCs and associated p values for the common marker analytes (C) from the 3-day dosing study for the TH3-V3 and EH3-V3 comparisons. All the markers having p values below .05 in both comparisons are listed in Supplemental Table 1. Since the appearance of such common markers effectively has a p value of .05 × .05 = .0025 or less, there was no concern that relaxing the stringency of p value cutoffs in single comparisons would generate a high level of false positive discoveries (the FDR is still expected below 0.15).
MFCs for marker analytes that had significant p values in both the TH3-V3 and EH3-V3 comparisons for the 3-day dosing study.
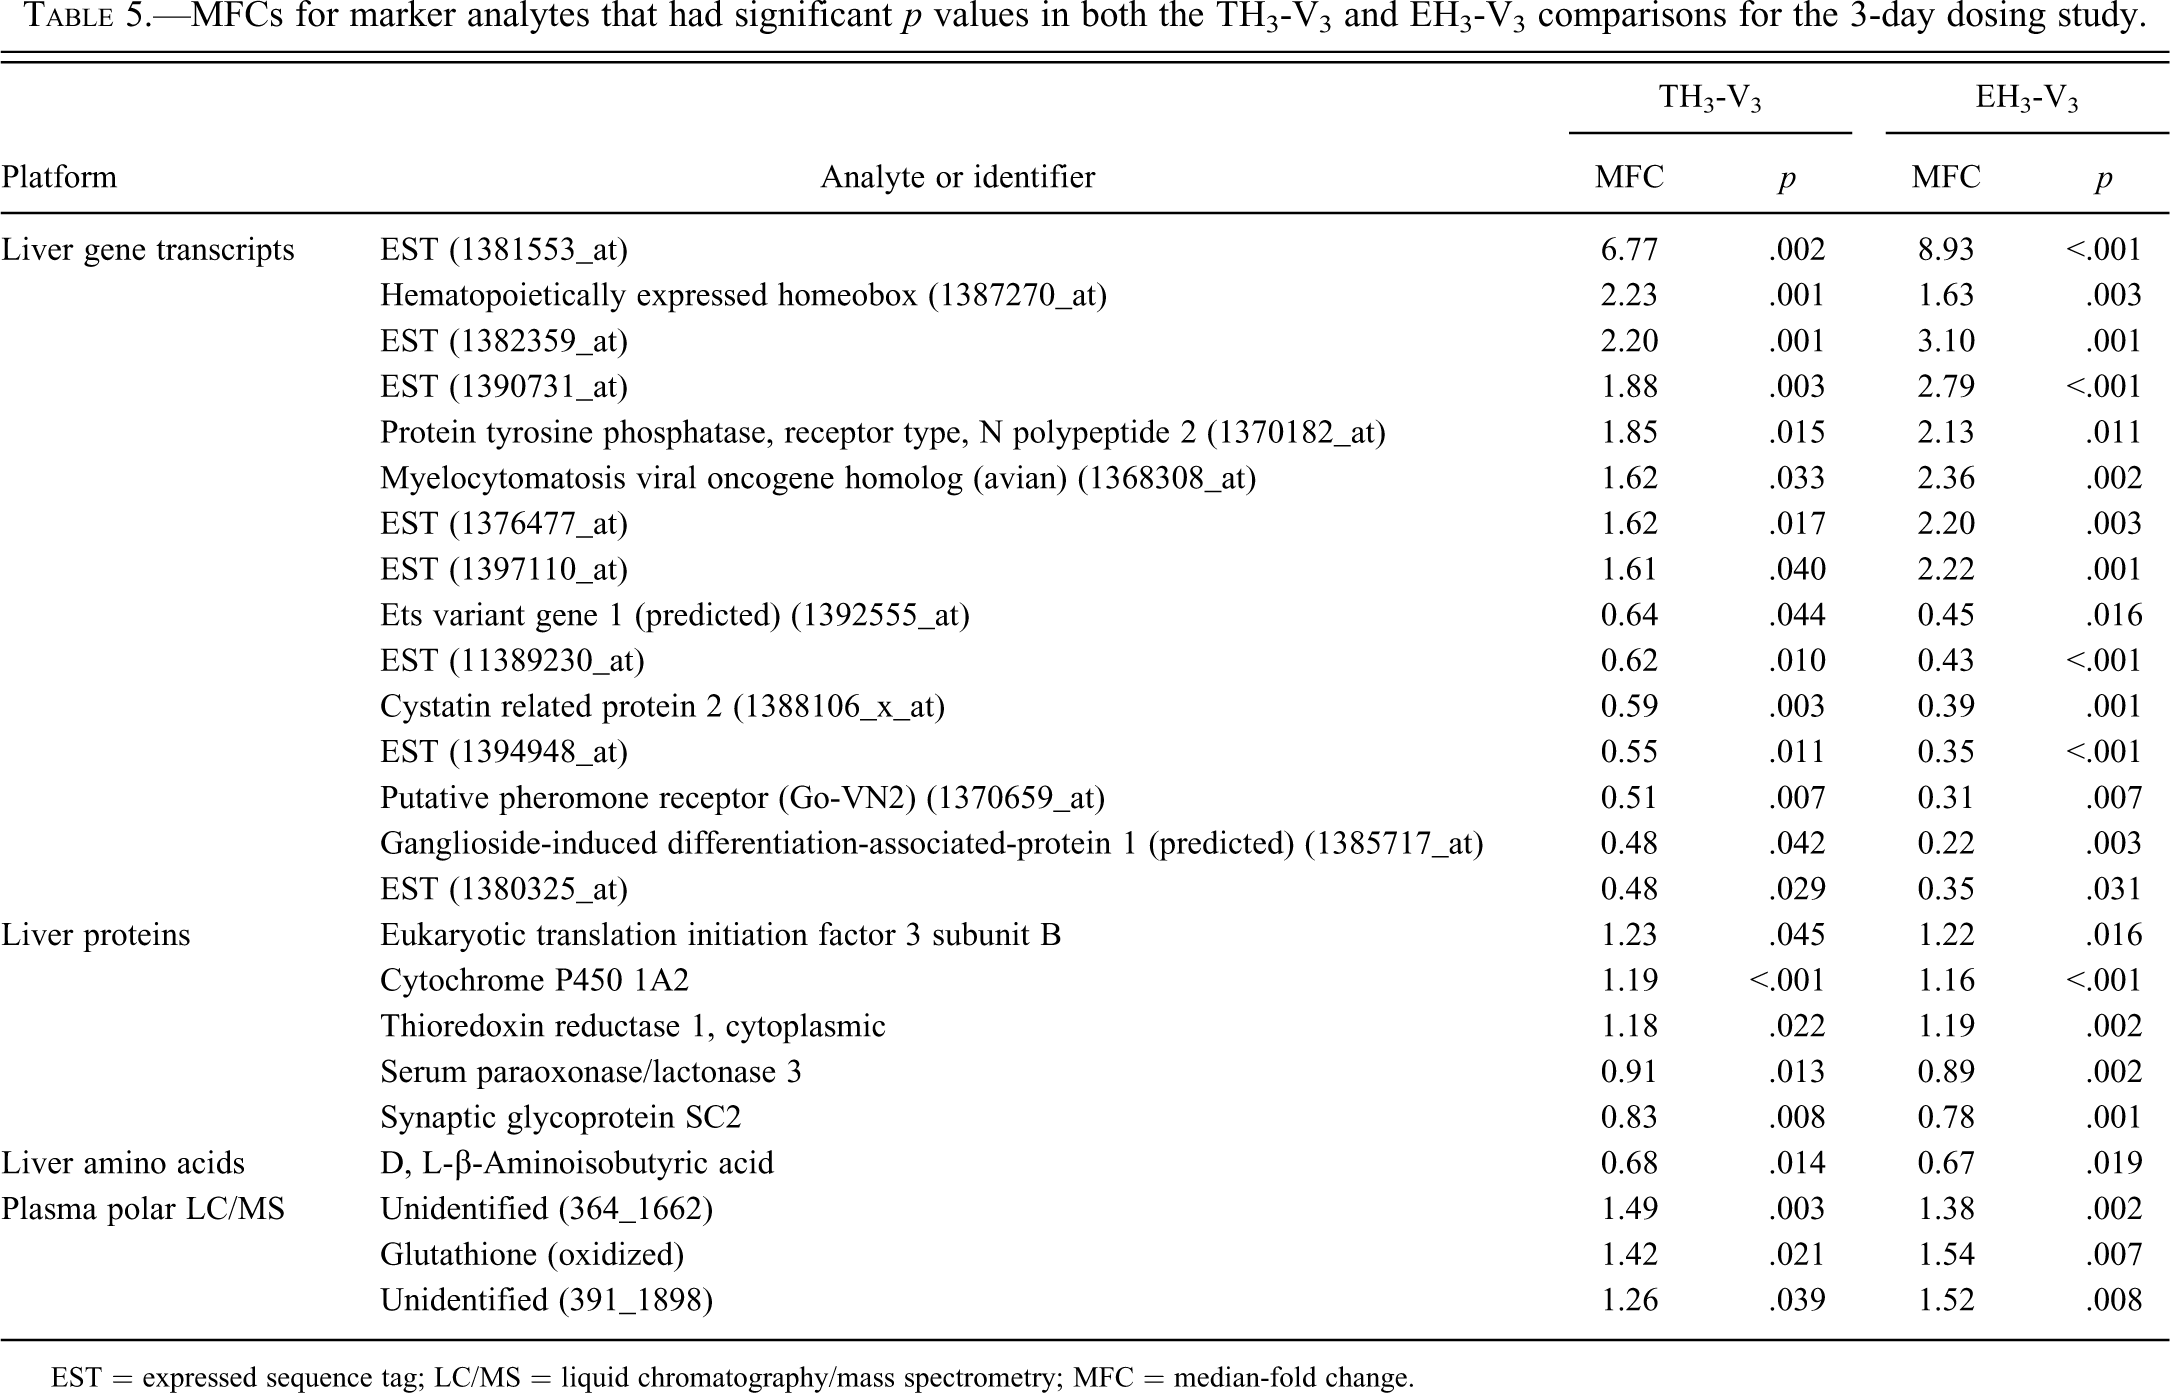
EST = expressed sequence tag; LC/MS = liquid chromatography/mass spectrometry; MFC = median-fold change.
MFCs and associated p values for the common marker analytes (C) for the 28-day dosing are presented in Table 6. The complete list of common markers is available in Supplemental Table 2.
Median-fold changes (MFCs) for marker analytes that had significant p values in both the TH28-V28 and EH28-V28 comparisons for the 28-day dosing study.
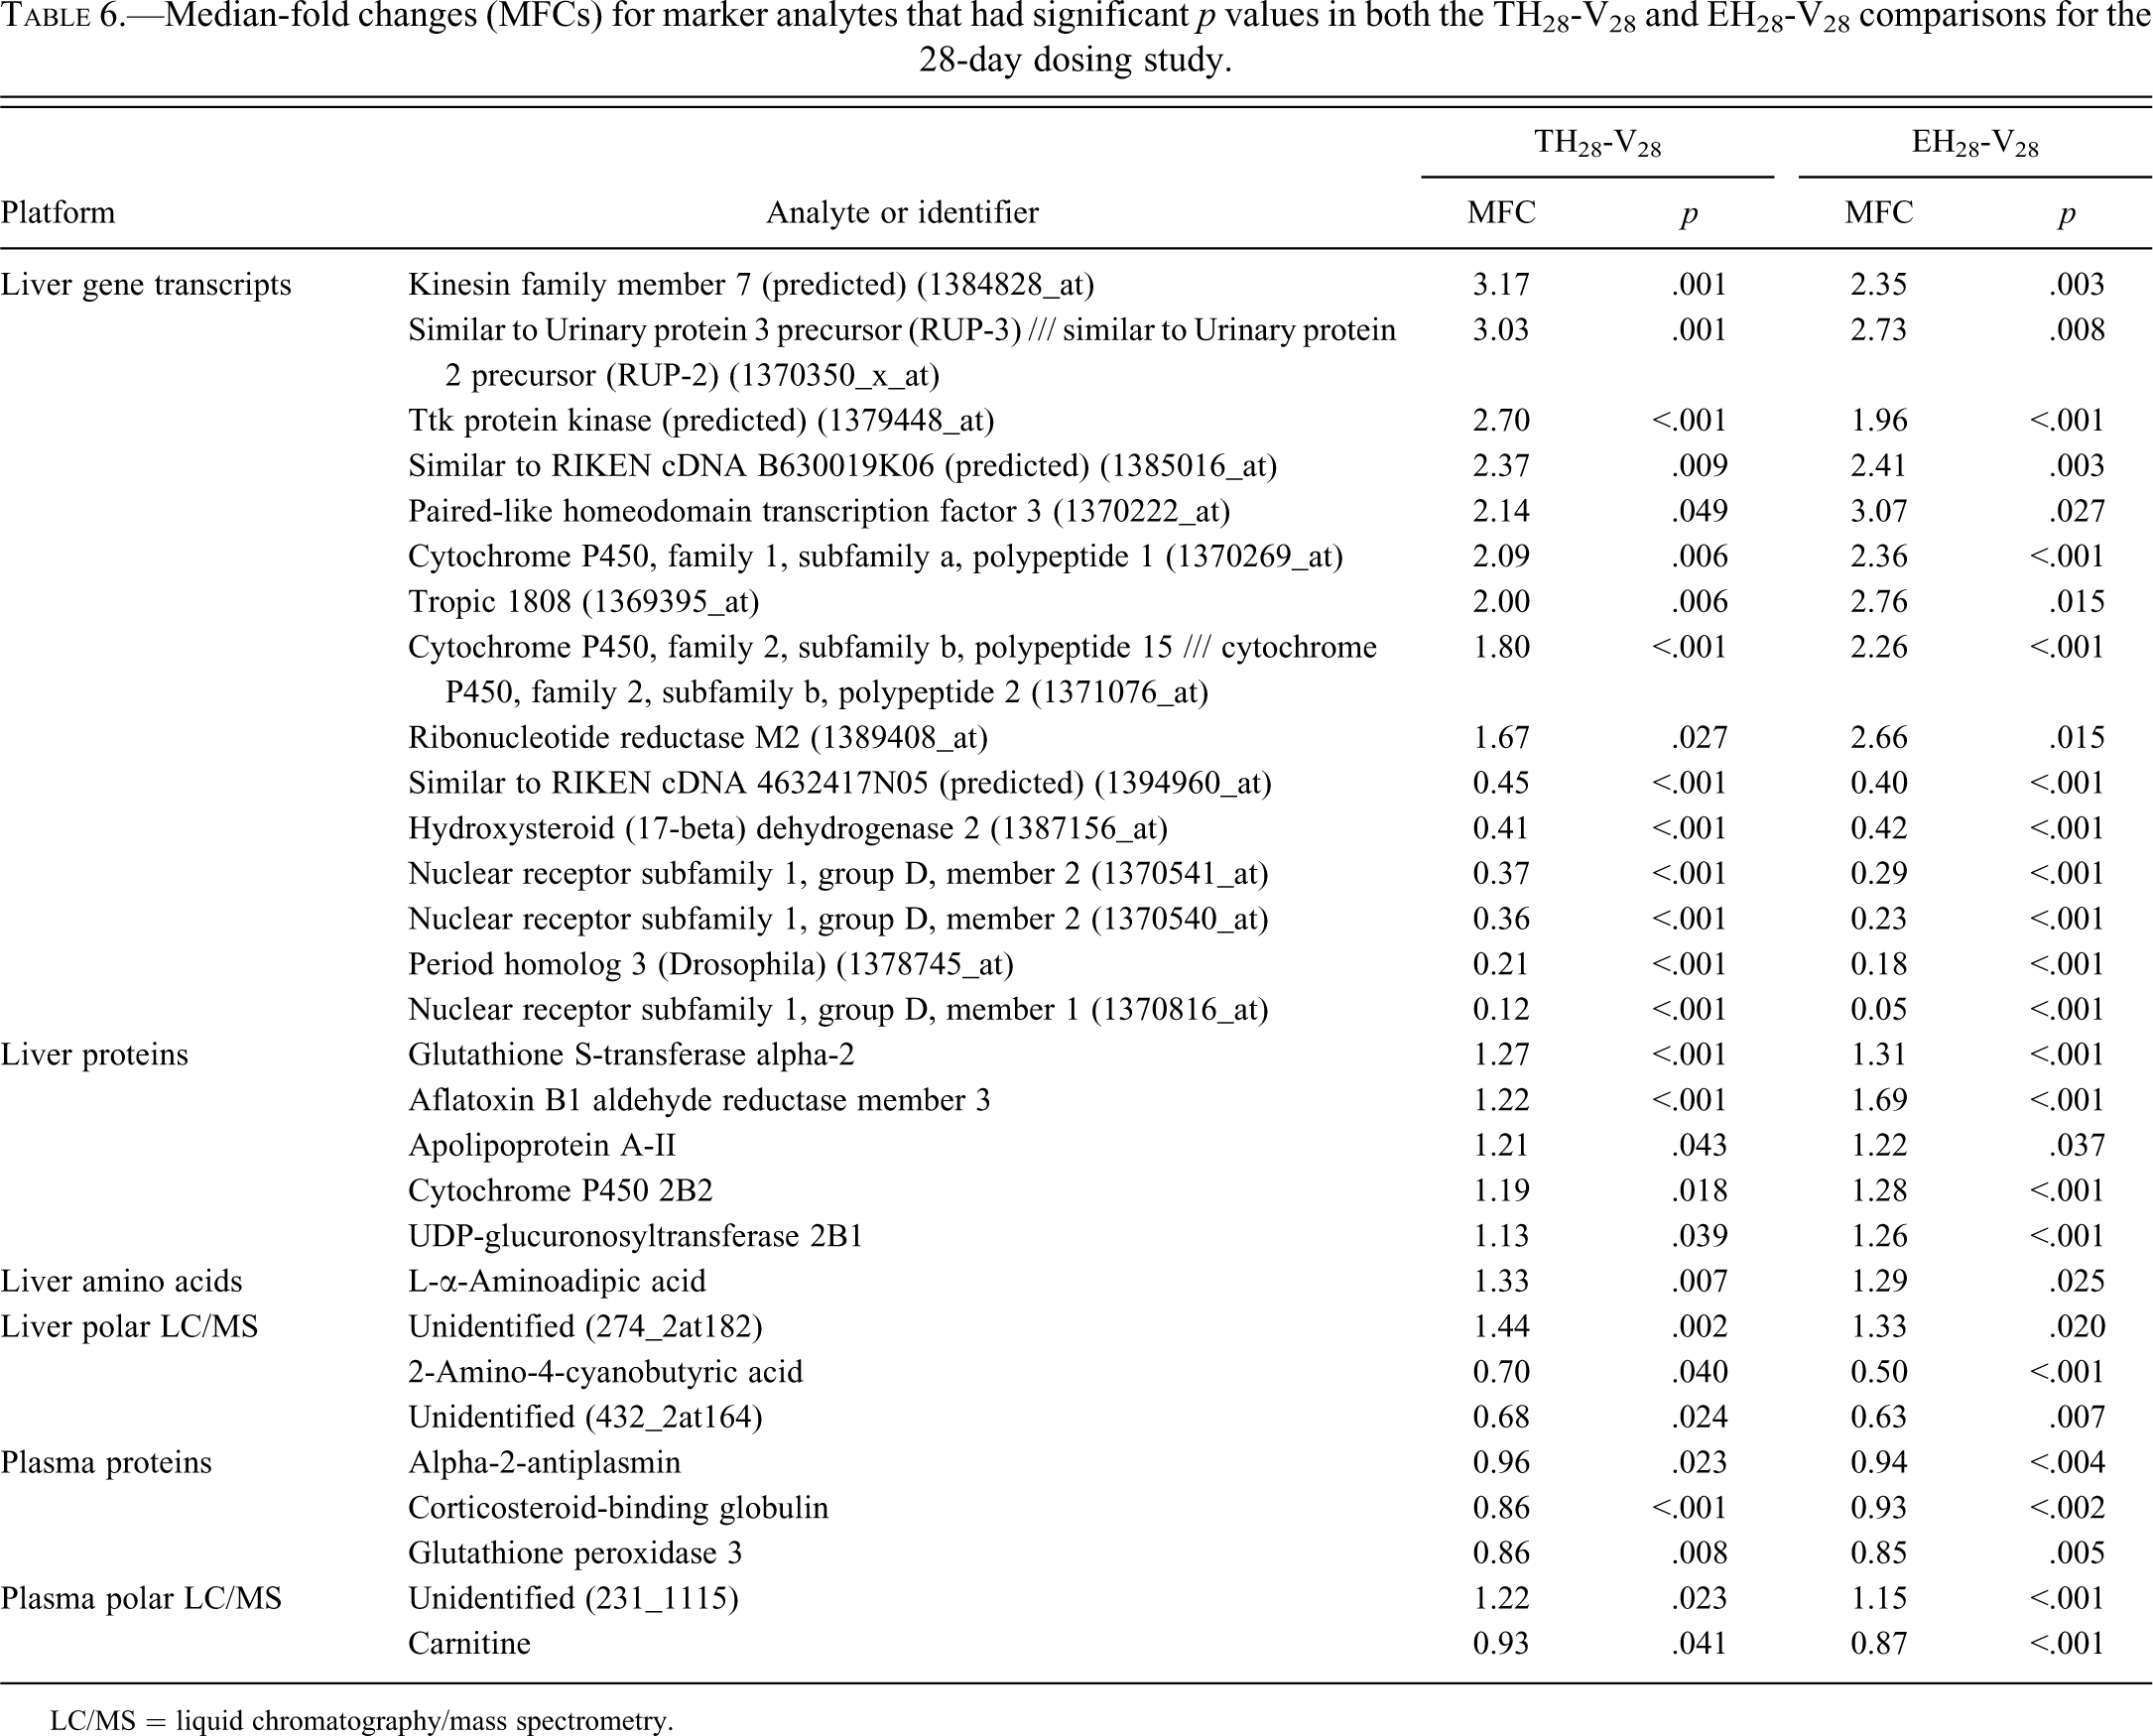
LC/MS = liquid chromatography/mass spectrometry.
Comparisons of Markers by Class Identification in Liver and Plasma from the 3-Day and the 28-Day Dosing Studies
Table 7 presents the count of markers with overlap between the 3-day and 28-day dosing studies, based on marker class identity (see Table 2). This table includes only statistical findings based on the high dose and vehicle cohorts to provide the most direct comparisons possible. As before, the p value cutoff for multiple markers (3-day and 28-day comparisons) was uniformly set to .05. It has to be pointed out that because of the different p value cutoffs used for marker counting in Tables 3, 4, and 7, a marker is not necessarily categorized into the same class in these tables (e.g., an E-class common 3-day and 28-day marker in Table 7 is not necessarily an E class 28-day marker in Table 4). This apparent conflict reflects the choice to keep FDRs consistent in the detection of single-day (i.e., 3-day or 28-day markers) versus 3-day and 28-day markers, as opposed to trying to keep p value cutoffs consistent, which would have resulted in a high rate of false negatives for 3-day and 28-day marker detection.
Number of markers within a particular marker class, as defined in Table 2, that had significant p values in both the 3-day and 28-day dosing study.
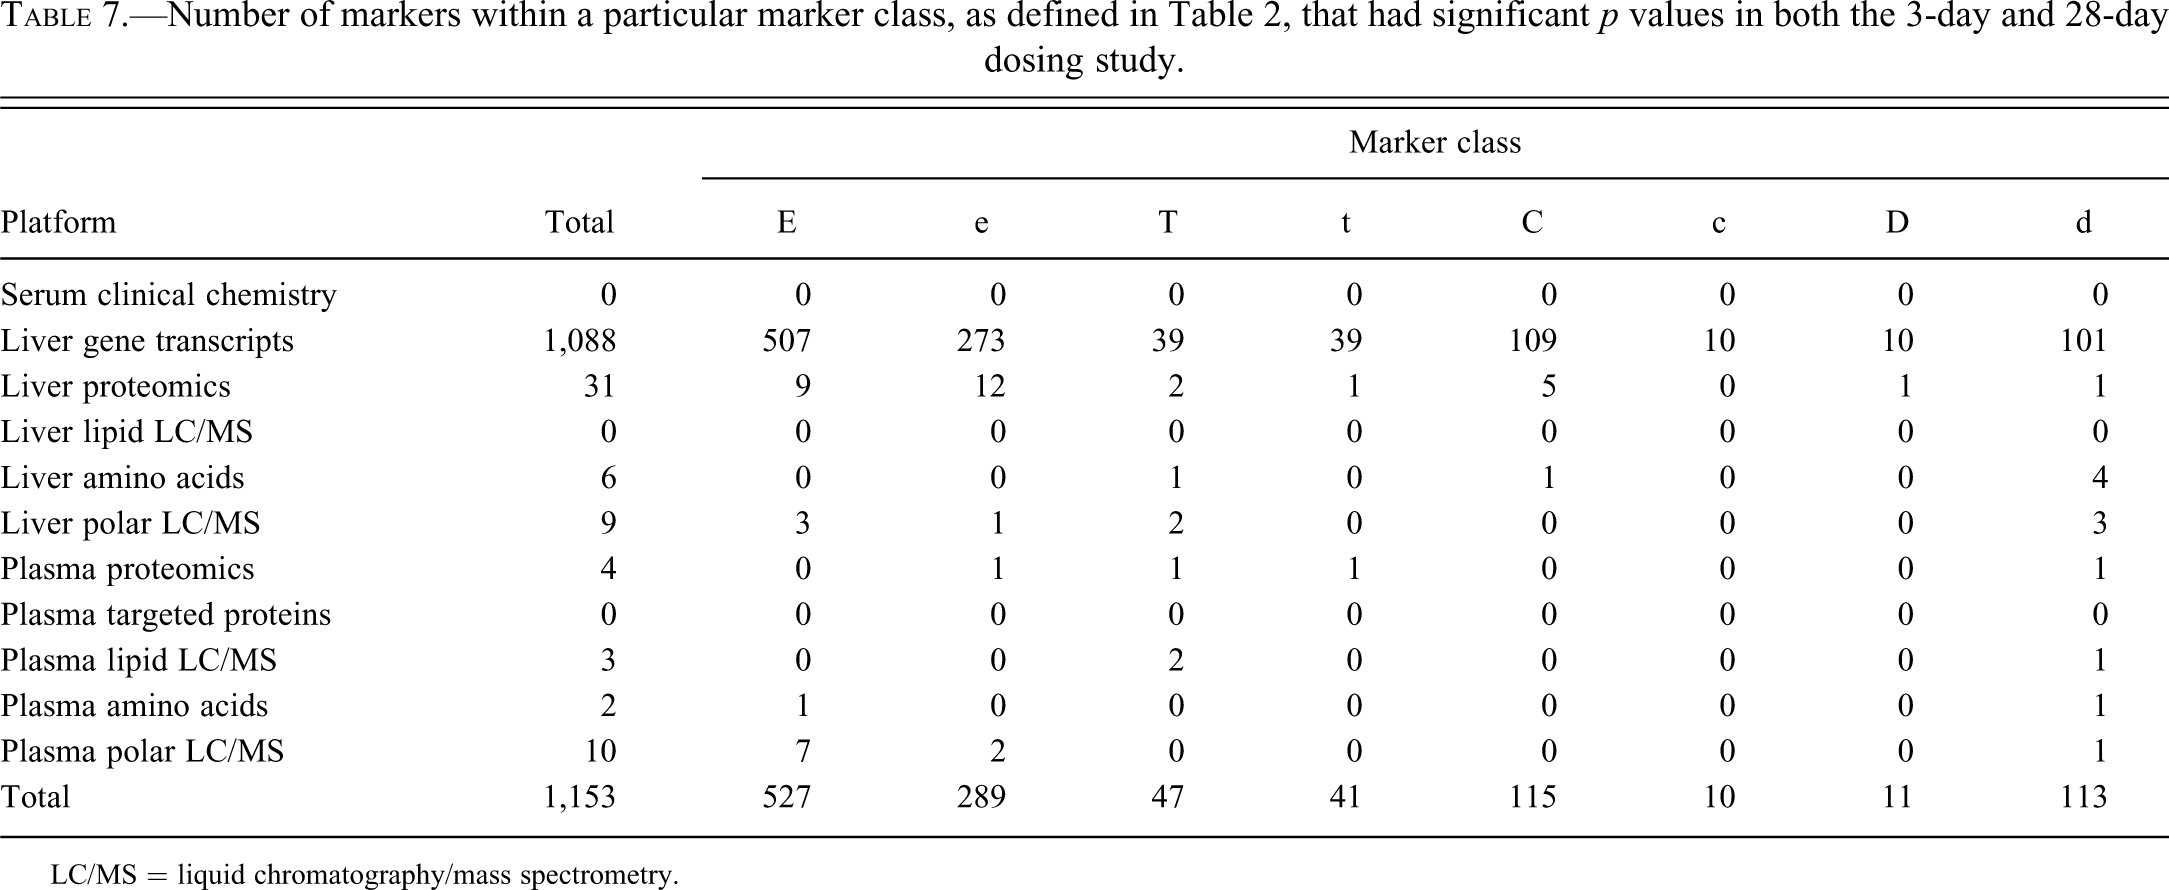
LC/MS = liquid chromatography/mass spectrometry.
A set of common 3-day and 28-day markers with the greatest MFCs are listed in Table 8. The complete list of markers common to 3-day and 28-day dosing is presented in Supplemental Table 3.
Marker analytes with the greatest median-fold changes (MFCs) at both 3 and 28 days of dosing.
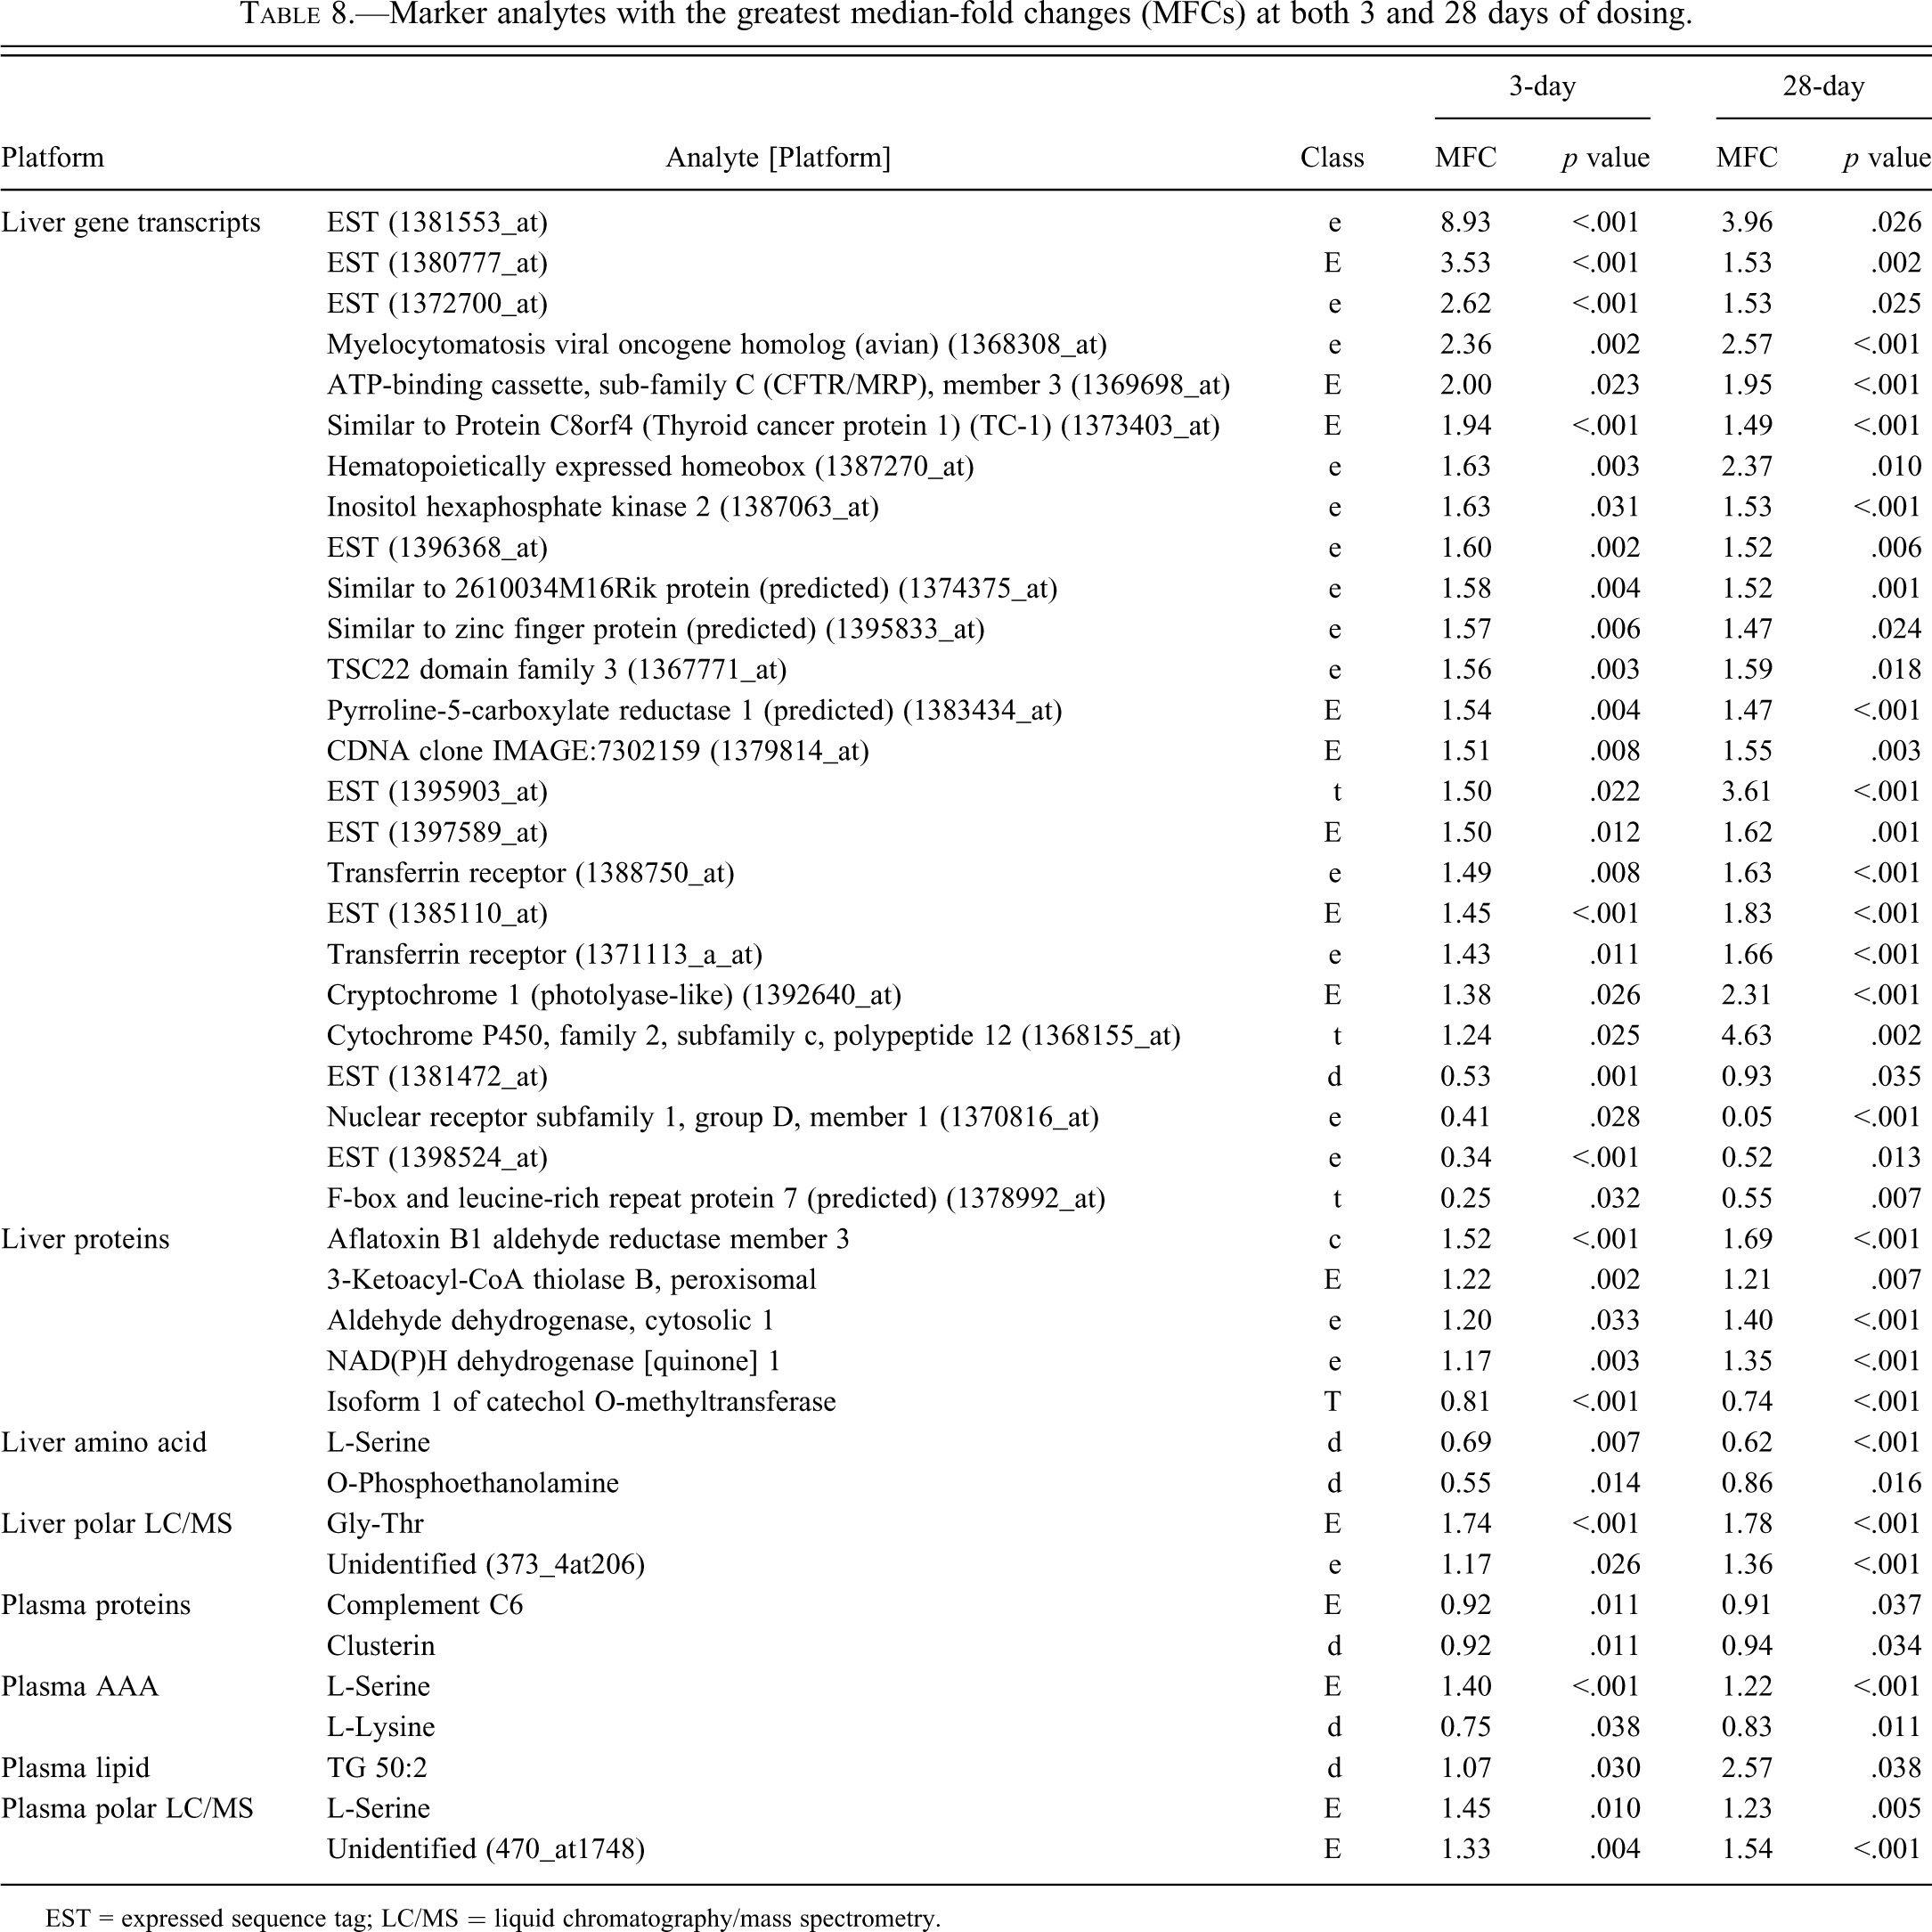
EST = expressed sequence tag; LC/MS = liquid chromatography/mass spectrometry.
To evaluate the conservation of marker behavior, the distribution of marker classes—in terms of the classes in Table 2—are plotted for the 3-day, 28-day, and common 3-day and 28-day marker sets in Figure 1. This chart shows the percentage of individual marker classes of a total of 1,282 3-day markers, 1,838 28-day markers, and 1,153 common 3-day and 28-day markers. Because only TH28-V28, EH28-V28, and EH28-TH28 comparisons were considered for this analysis, markers arising from low- and medium-dose comparisons (U class markers) are not accounted for. Strong significance of the marker discoveries is indicated by the fact that from an observed 3.8% marker frequency at 3-day dosing (1,282 markers from ∼32,900 analytes) and an observed 5.5% marker frequency at 28-day dosing (1,838 markers from ∼32,900 analytes); one would expect 0.2% frequency for common 3-day and 28-day markers if these occurred purely at random. Here, we found a 3.4% frequency (1,153 markers from ∼32,900 analytes) of common 3-day and 28-day markers, suggesting a FDR below 10%. In general, the directionality of the changes is also well preserved; for instance, ∼80% of “E” class markers exhibit the same direction of changes at 28 days of dosing as they did at 3 days of dosing.
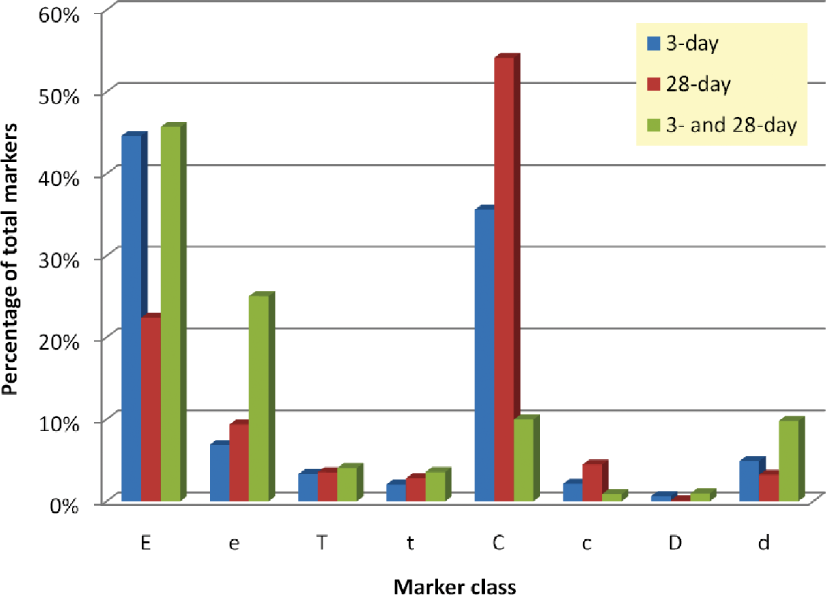
Distribution of different marker classes (see Table 1) across 3-day and 28-day dosing arms. In the 28-day data only high-dose comparisons are considered; therefore, class “U” markers are not shown.
It is interesting to observe how the percentage of individual marker classes shift from 3 days of dosing to 28 days of dosing (Figure 1). While at 3 days of dosing, a majority of markers (52%) is significant in the E3-V3 comparisons only (E or e types), at longer dosing, there is a substantial increase in the proportion of “C” type markers (from 38% at 3 days to 58% at 28 days), changes common to tolcapone and entacapone exposure. A majority of markers significant in the TH28-V28 comparison is also significant in the EH28-V28 comparison. One possible conclusion is that for the biological effects of catechol O-methyl transferase (COMT) inhibition by entacapone or tolcapone to develop completely, dosing longer than 3 days is necessary. It is interesting to speculate if a response triggered by longer-term dosing may be more relevant to idiosyncratic liver toxicity, given the observation that idiosyncratic DILI often does not present early in the course of drug therapy. By this reasoning, the most important “off-target” markers would be those that are specific to longer dosing duration; however, it is premature to commit to simple models ahead of a broader effort to collect more results. These differences between short duration and longer duration dosing may reflect acute versus adaptive responses to the drugs.
The distribution of common 3-day and 28-day markers is dominated by the “E” or “e” type markers, which account for 71% of the total markers (Table 7 and Figure 1). Also noteworthy is the dramatic drop in the proportion of “C” or “c” type markers implying that the consistent 3-day and 28-day response to tolcapone and entacapone treatment is quite different. Neither set of markers appears to be mostly a subset of the other indicating a good deal of differences in the underlying biological processes.
Of particular interest within the set of markers listed in Table 8 is COMT (a T marker), which is the target of both entacapone and tolcapone. A decrease in COMT protein expression in the liver after tolcapone treatment has not been reported previously. The root cause of the observed decrease in levels is not known at this time. Neither entacapone nor tolcapone is known to bind covalently to COMT. It is of further interest that the magnitude of fold change for many of the markers conserved between the two dosing duration arms of this study is seldom greater than 30%.
Changes in the Abundances of Analytes Caused by 3-Day or 28-Day Dosing with Tolcapone or Entacapone
As an alternative to limiting the definition of “markers” to analytes that pass stringent p value tests of significance, and in order to gain further insight into the molecular changes in rats caused by tolcapone and entacapone treatment in both the 3-day and the 28-day dosing studies, we also examined the analytes showing the largest MFC upon treatment. Tables 9 through 12 show the forty analytes with the largest MFCs, using a less stringent p value cutoff of .05, for each of the TH3-V3, EH3-V3, TH28-V28, and EH28-V28 comparisons, sorted according to the magnitude of the change. Because the gene transcript platform measured the greatest number of analytes, representing the vast majority of analytes measured in the entire study, it is the transcript data that contributed the majority of analytes with the largest MFC. Therefore, to highlight top markers from other platforms, a few of the most significant markers (based on p values) are also included at the end of Tables 9 through 12.
The forty analytes with the largest median-fold changes (MFCs) for the TH3-V3 comparison. a
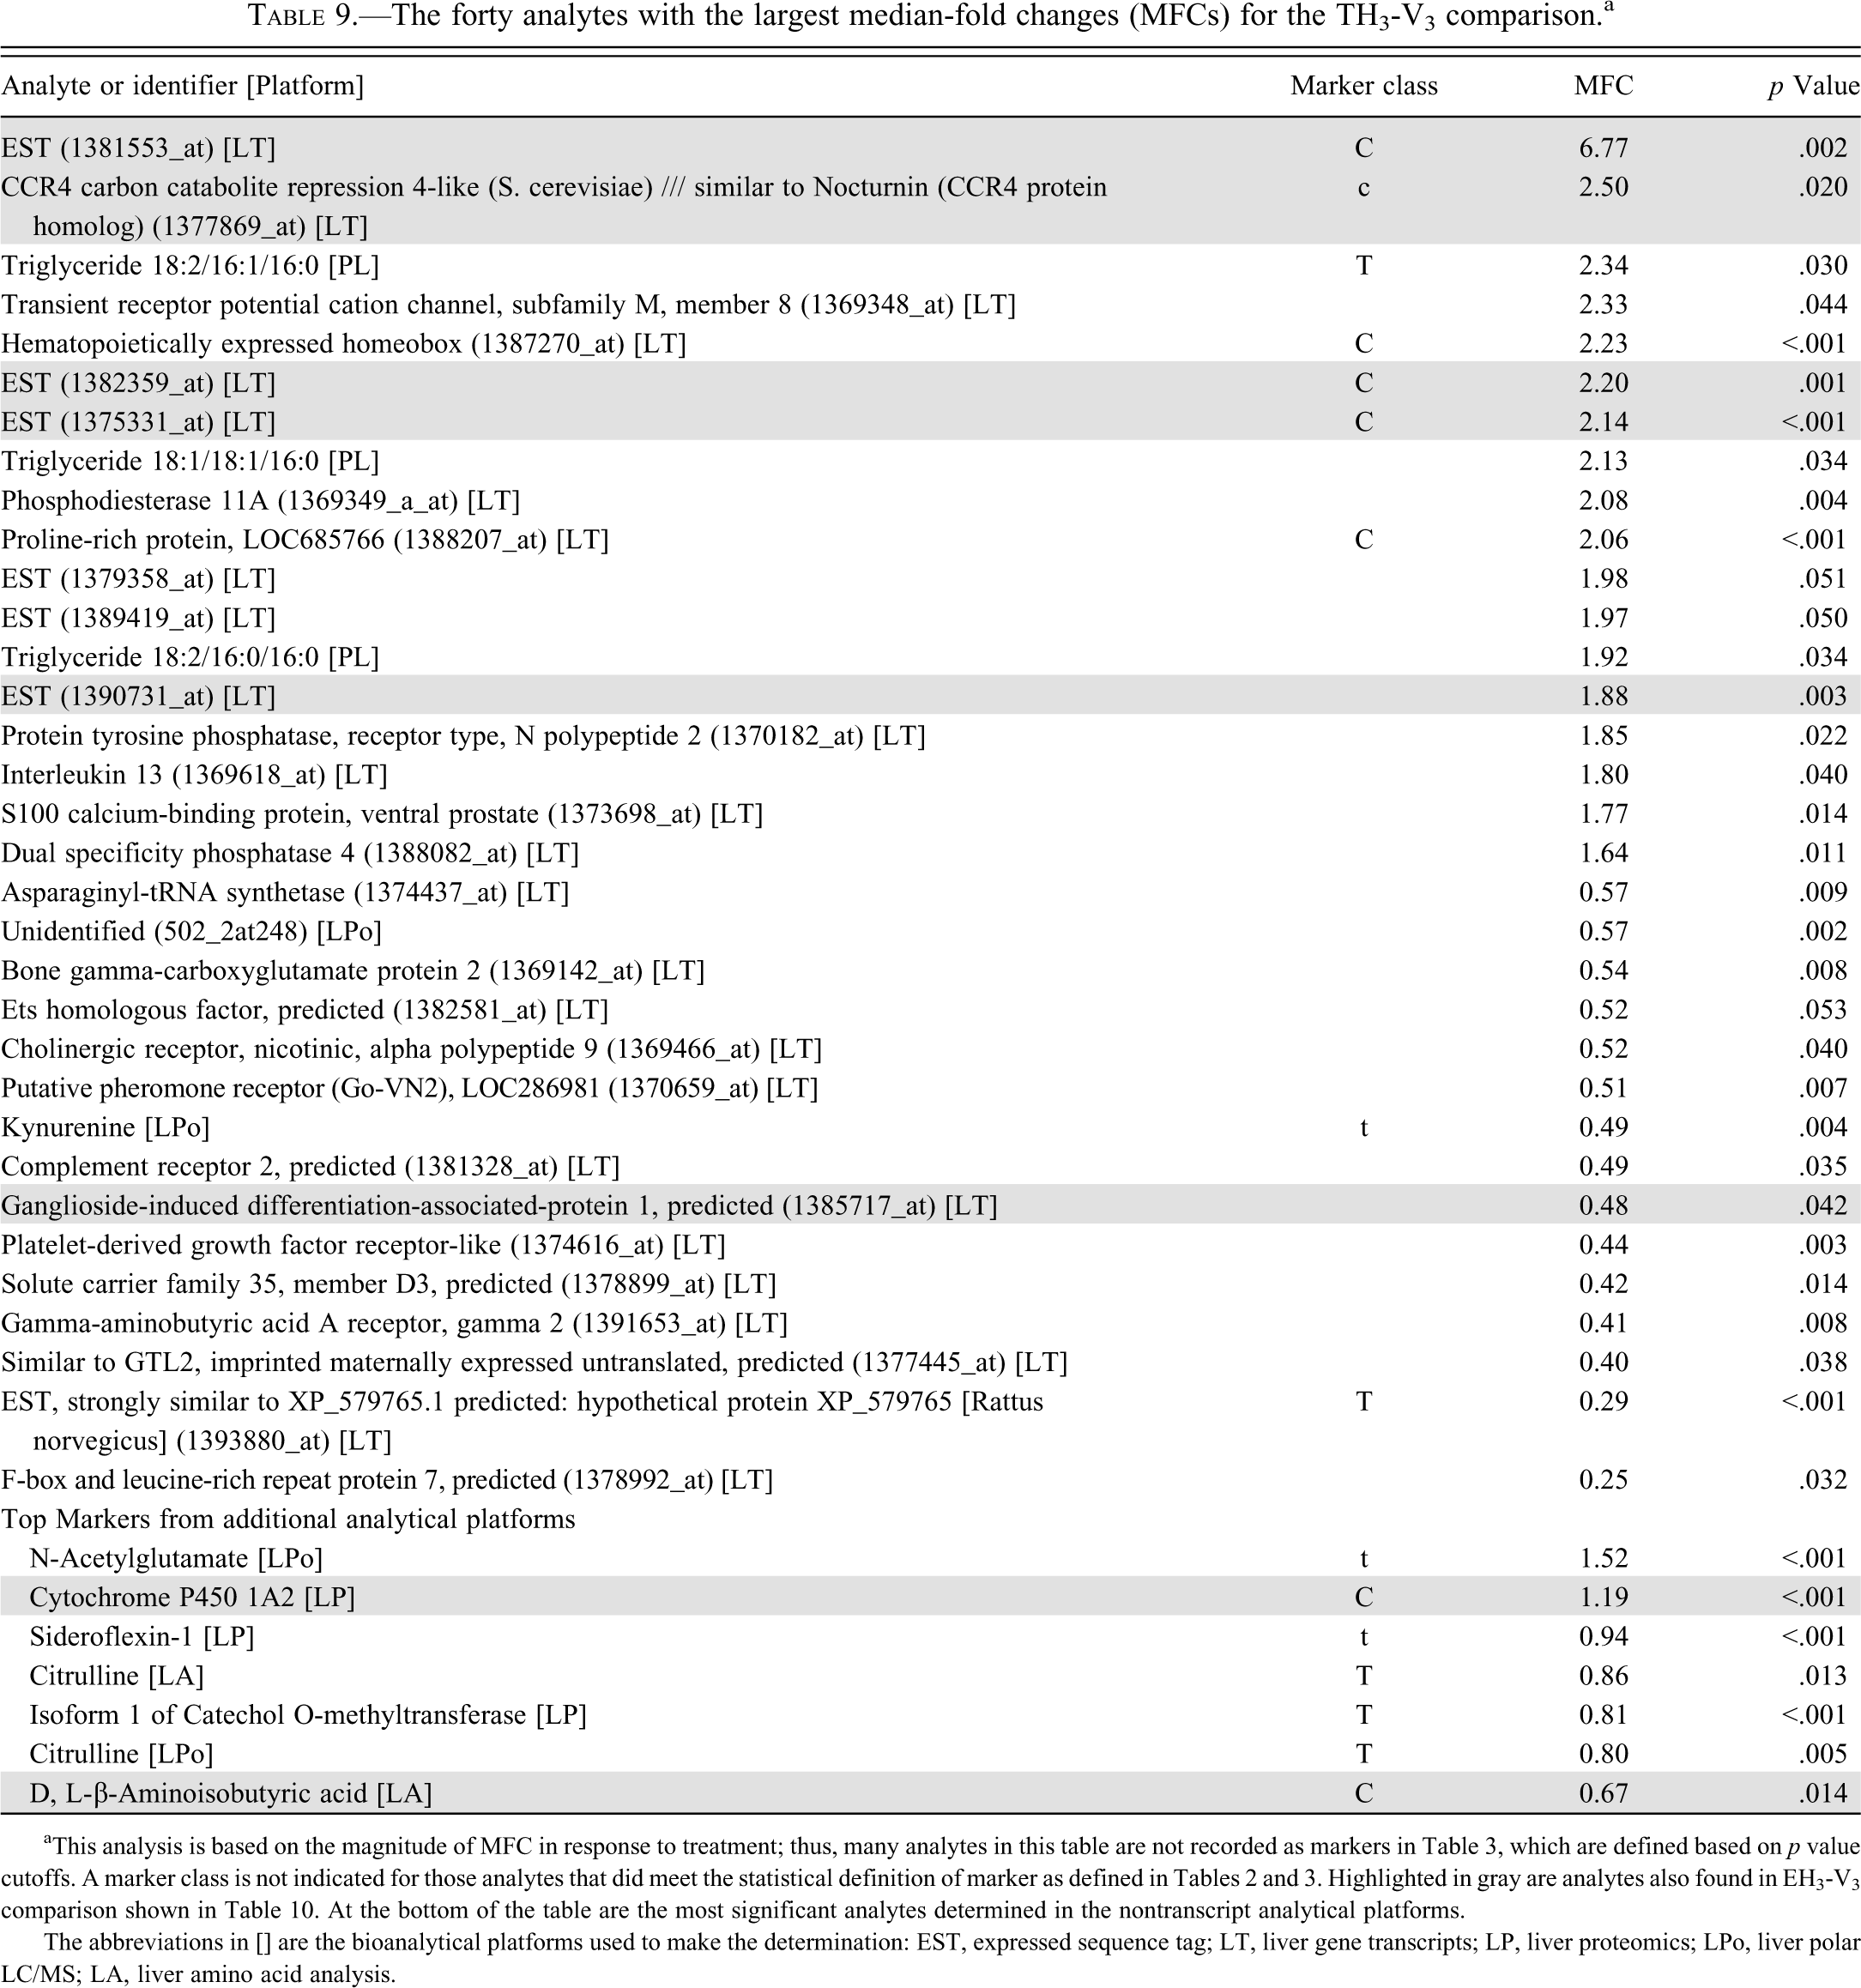
aThis analysis is based on the magnitude of MFC in response to treatment; thus, many analytes in this table are not recorded as markers in Table 3, which are defined based on p value cutoffs. A marker class is not indicated for those analytes that did meet the statistical definition of marker as defined in Tables 2 and 3. Highlighted in gray are analytes also found in EH3-V3 comparison shown in Table 10. At the bottom of the table are the most significant analytes determined in the nontranscript analytical platforms.
The abbreviations in [] are the bioanalytical platforms used to make the determination: EST, expressed sequence tag; LT, liver gene transcripts; LP, liver proteomics; LPo, liver polar LC/MS; LA, liver amino acid analysis.
The forty analytes with the largest median-fold changes (MFCs) for the EH3-V3 comparison. a
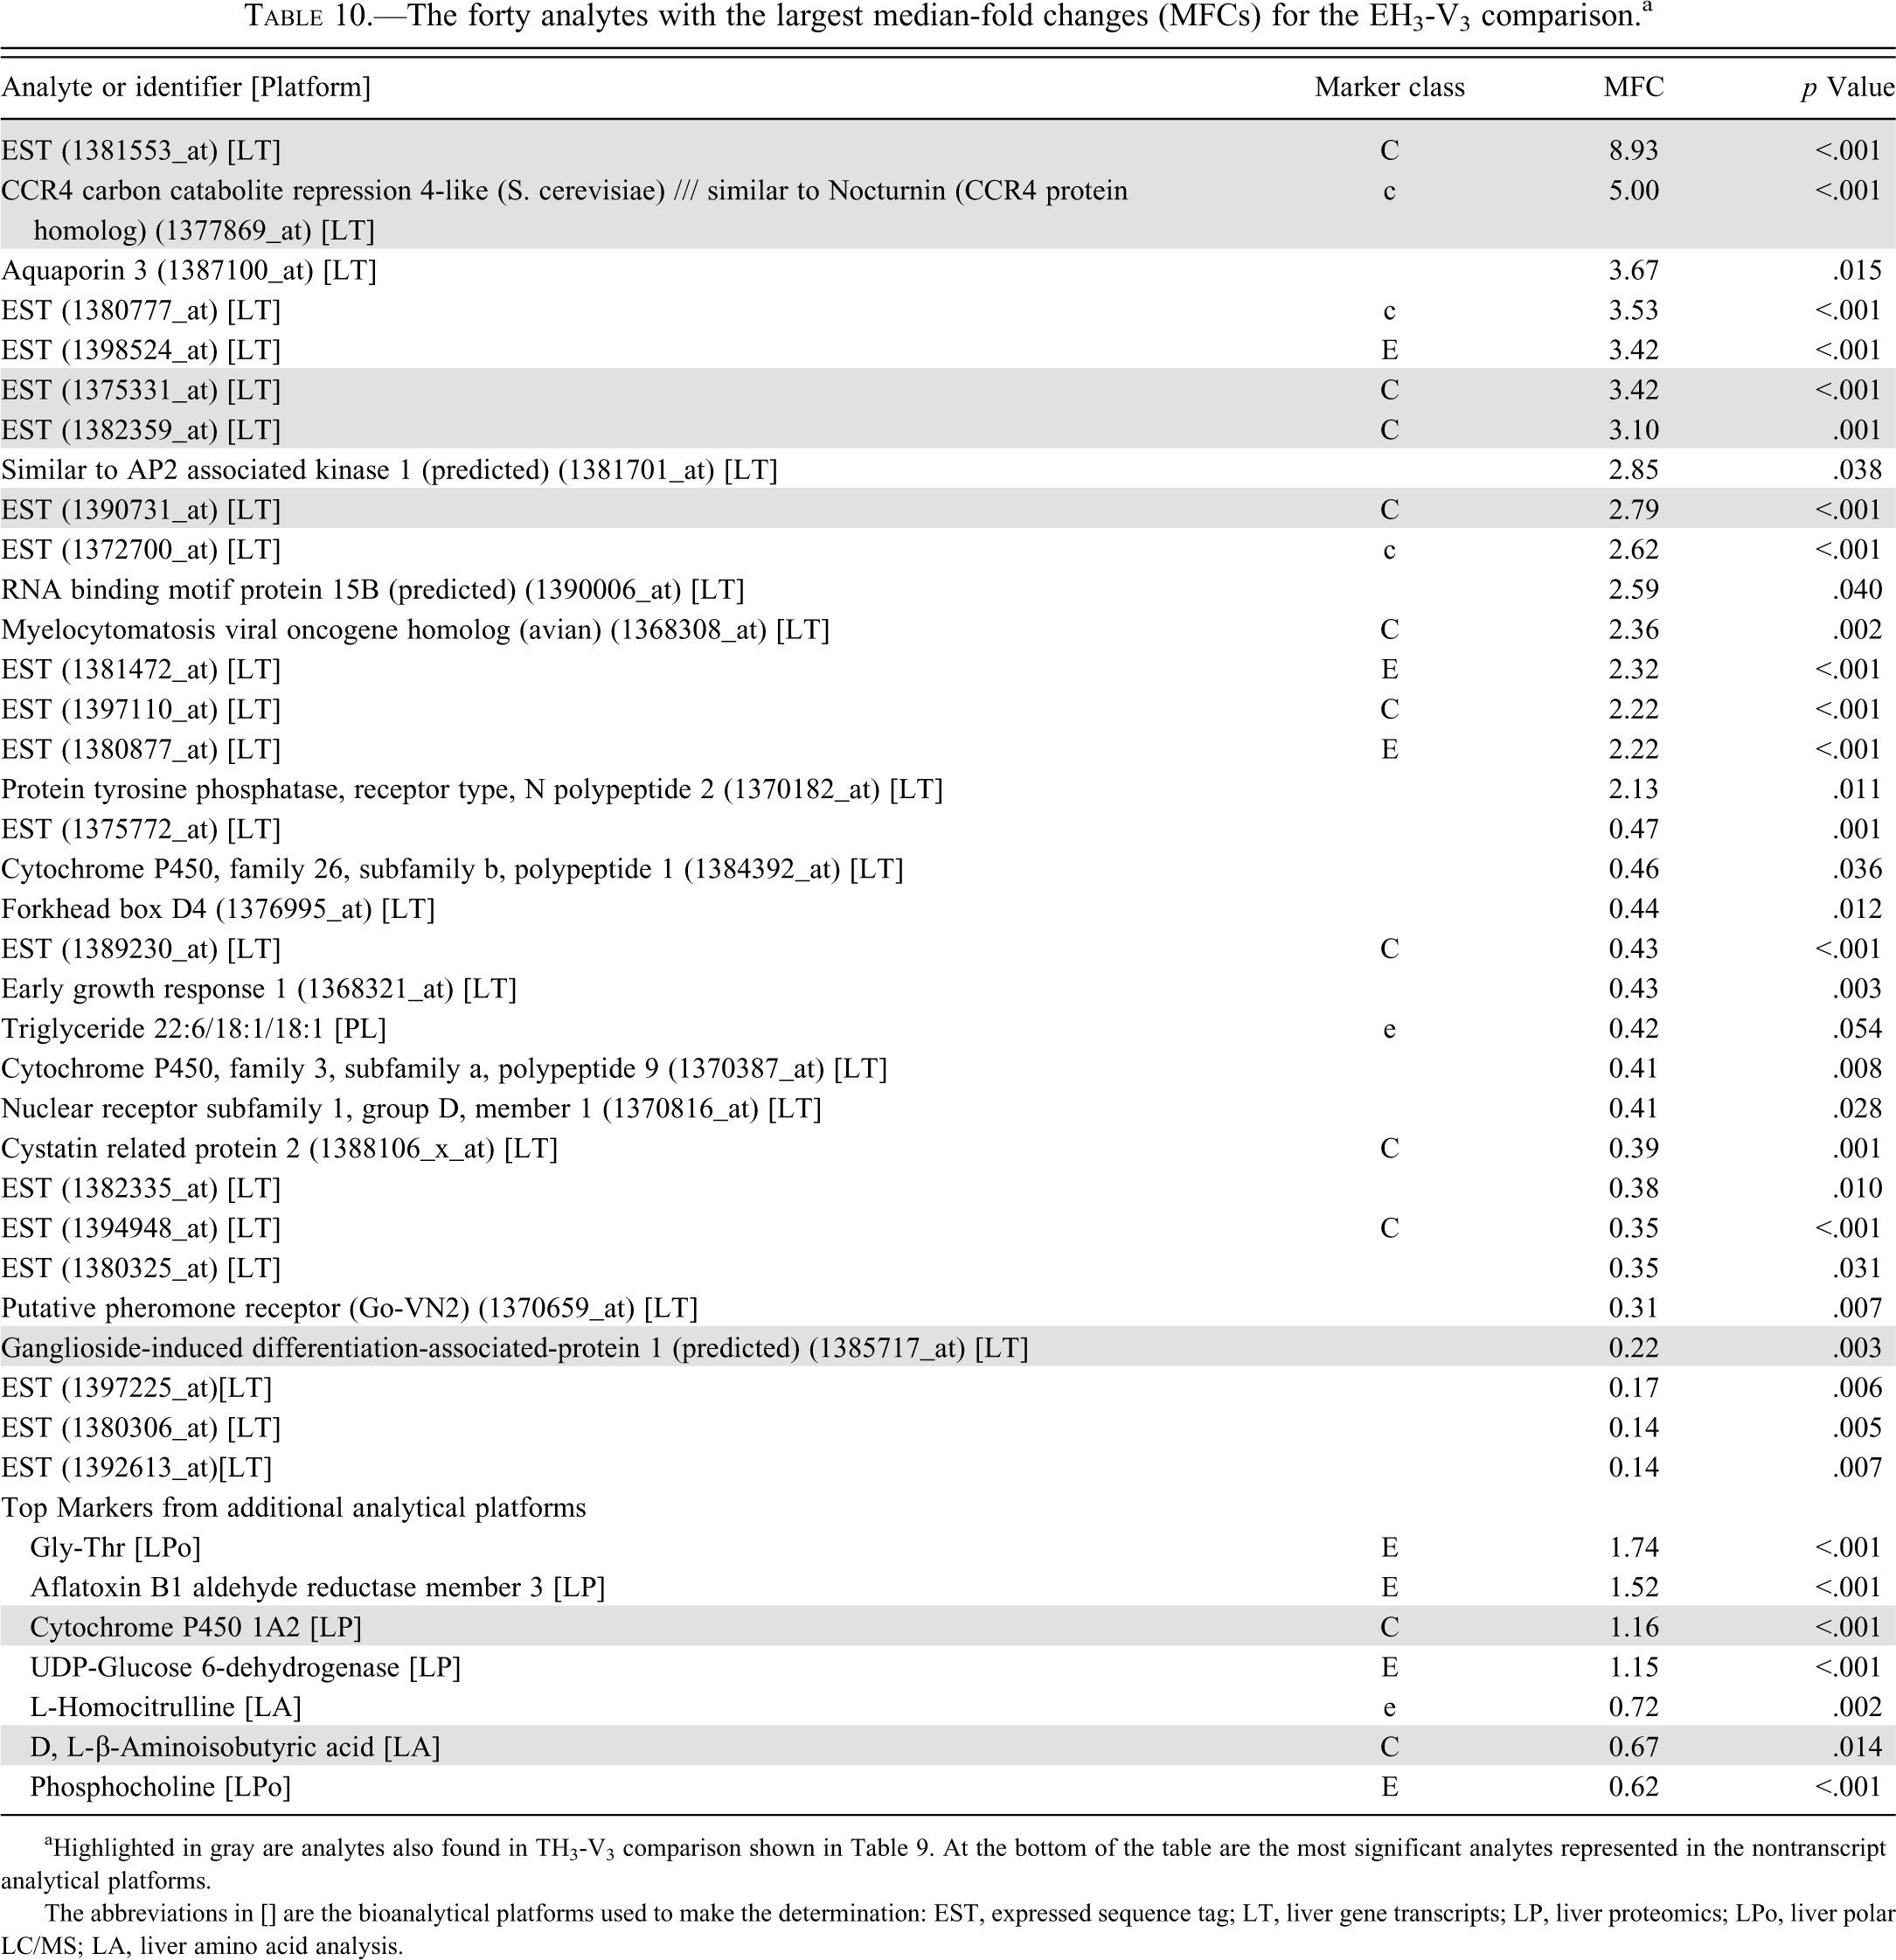
aHighlighted in gray are analytes also found in TH3-V3 comparison shown in Table 9. At the bottom of the table are the most significant analytes represented in the nontranscript analytical platforms.
The abbreviations in [] are the bioanalytical platforms used to make the determination: EST, expressed sequence tag; LT, liver gene transcripts; LP, liver proteomics; LPo, liver polar LC/MS; LA, liver amino acid analysis.
The forty analytes with the largest median-fold changes (MFCs) for the TH28-V28 comparison. a
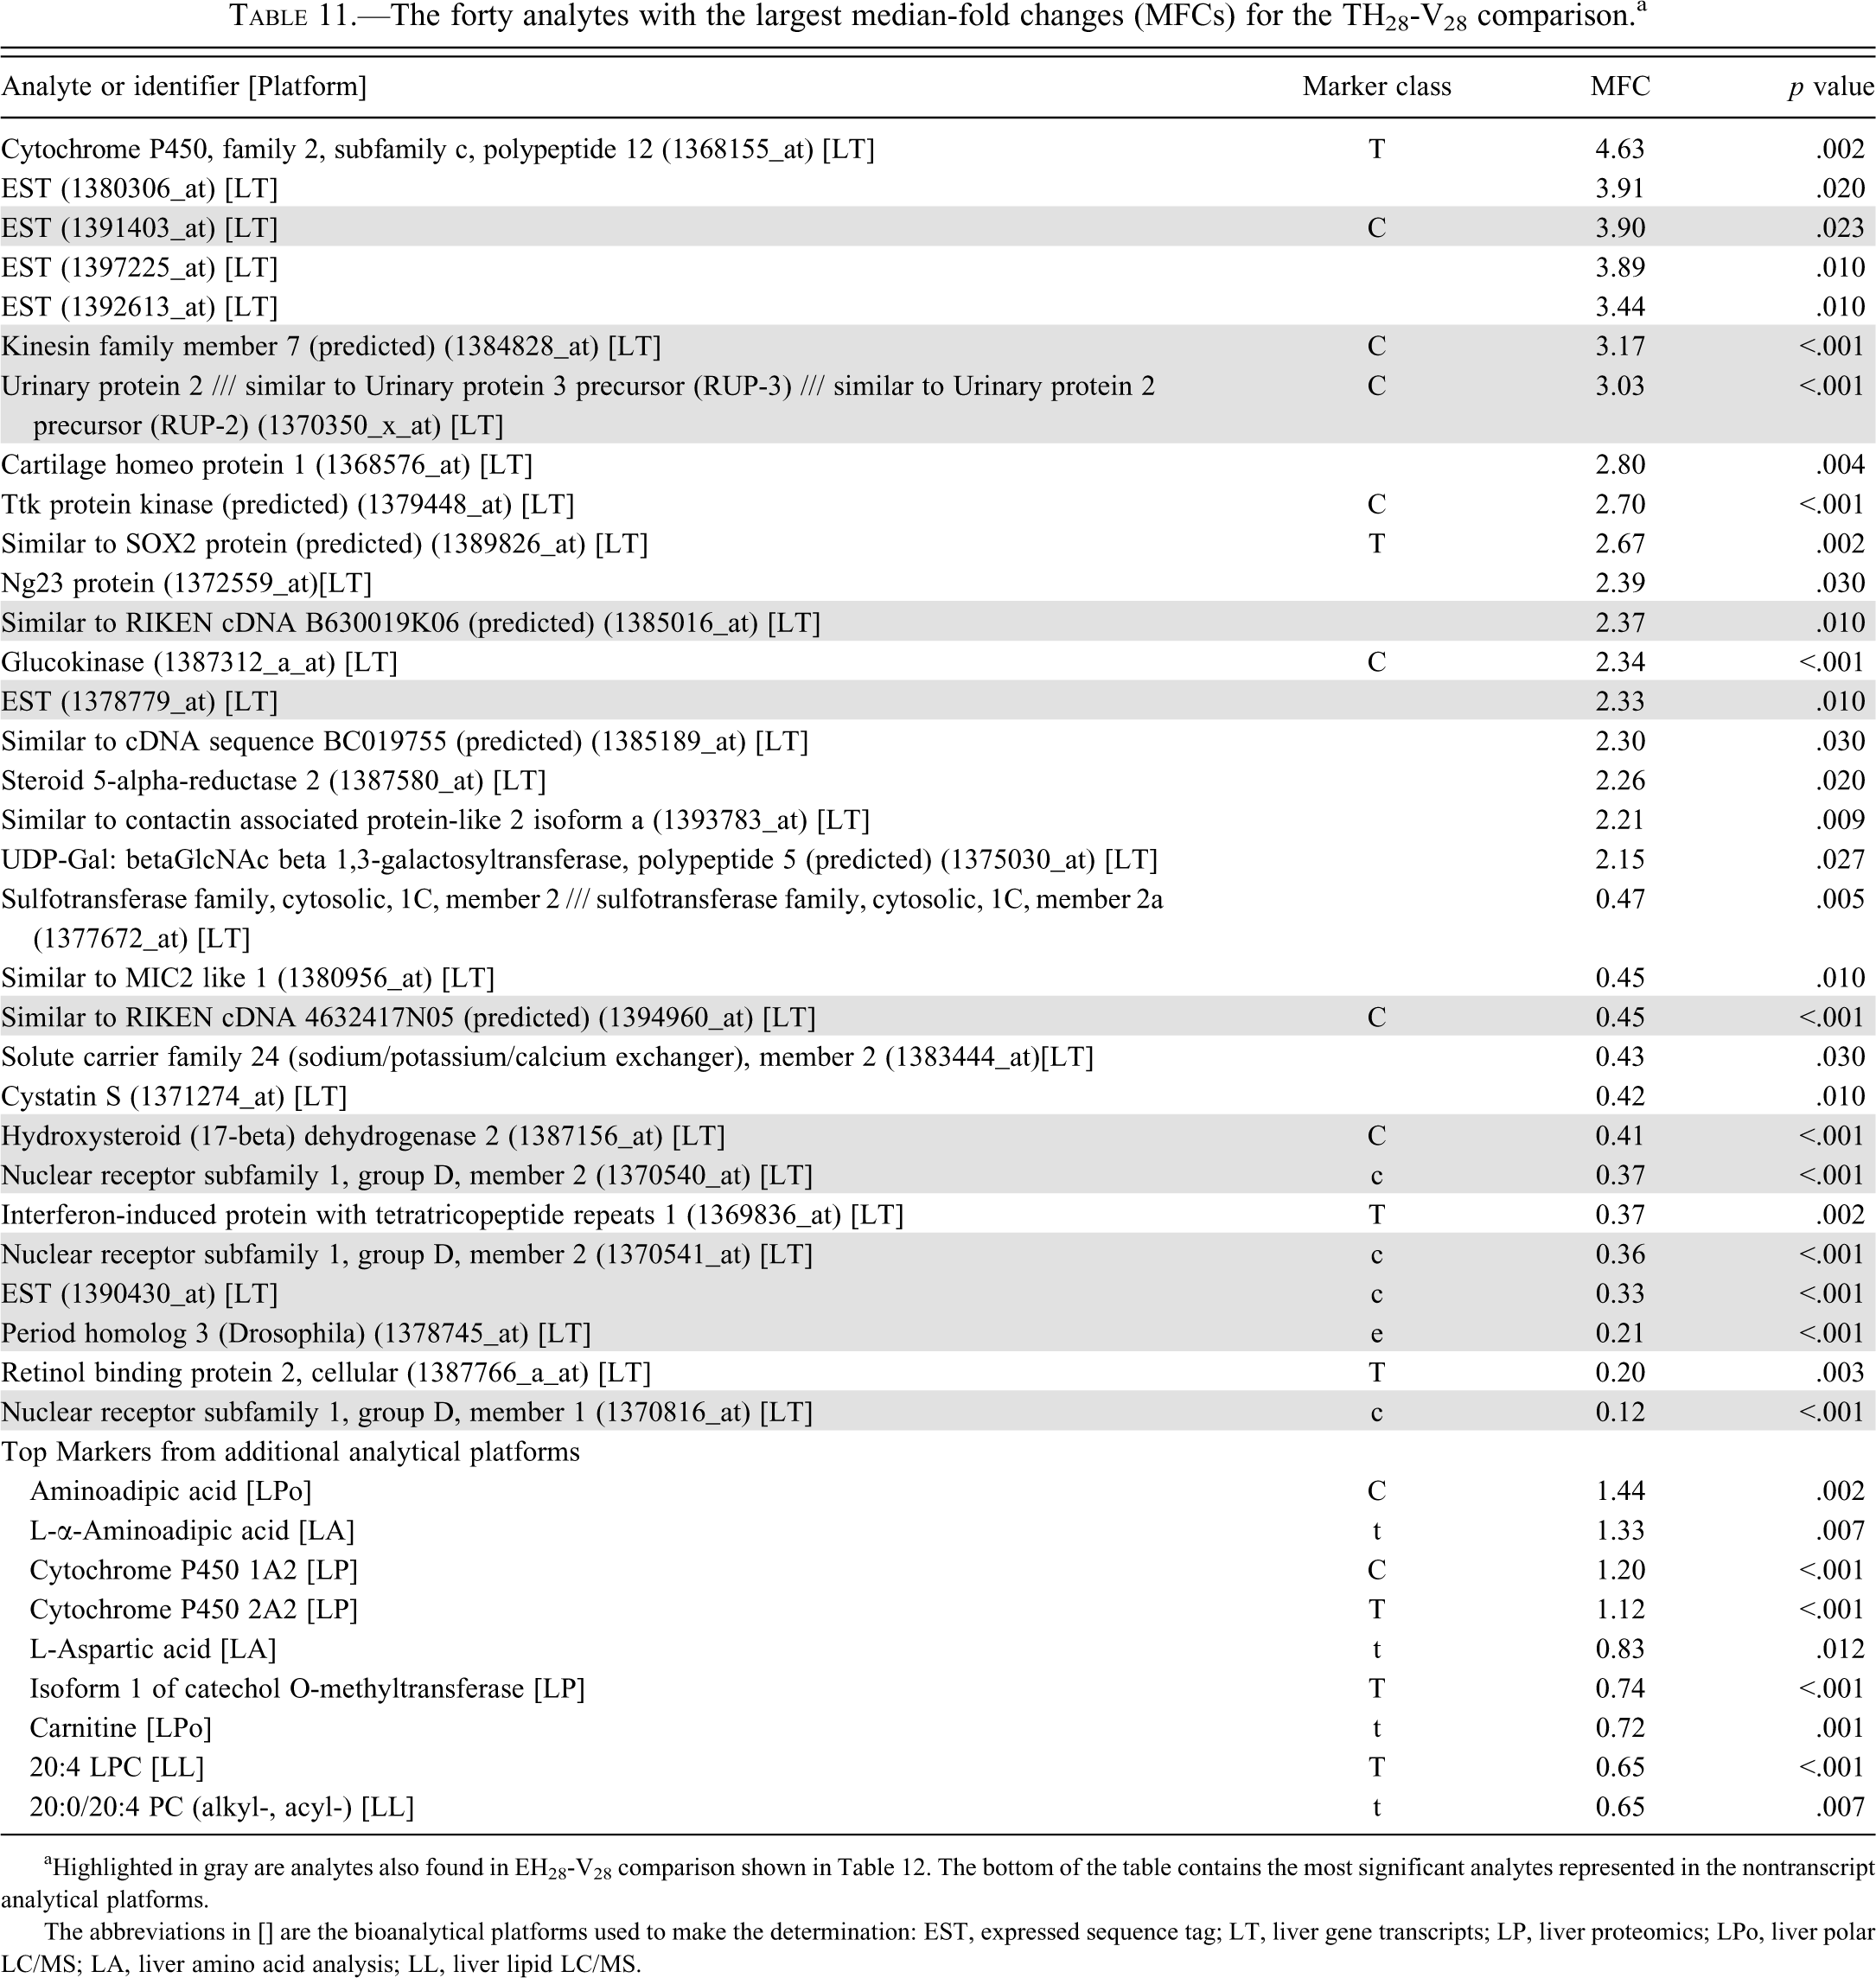
aHighlighted in gray are analytes also found in EH28-V28 comparison shown in Table 12. The bottom of the table contains the most significant analytes represented in the nontranscript analytical platforms.
The abbreviations in [] are the bioanalytical platforms used to make the determination: EST, expressed sequence tag; LT, liver gene transcripts; LP, liver proteomics; LPo, liver polar LC/MS; LA, liver amino acid analysis; LL, liver lipid LC/MS.
The forty analytes with the largest median-fold changes (MFCs) for the EH28-V28 comparison. a
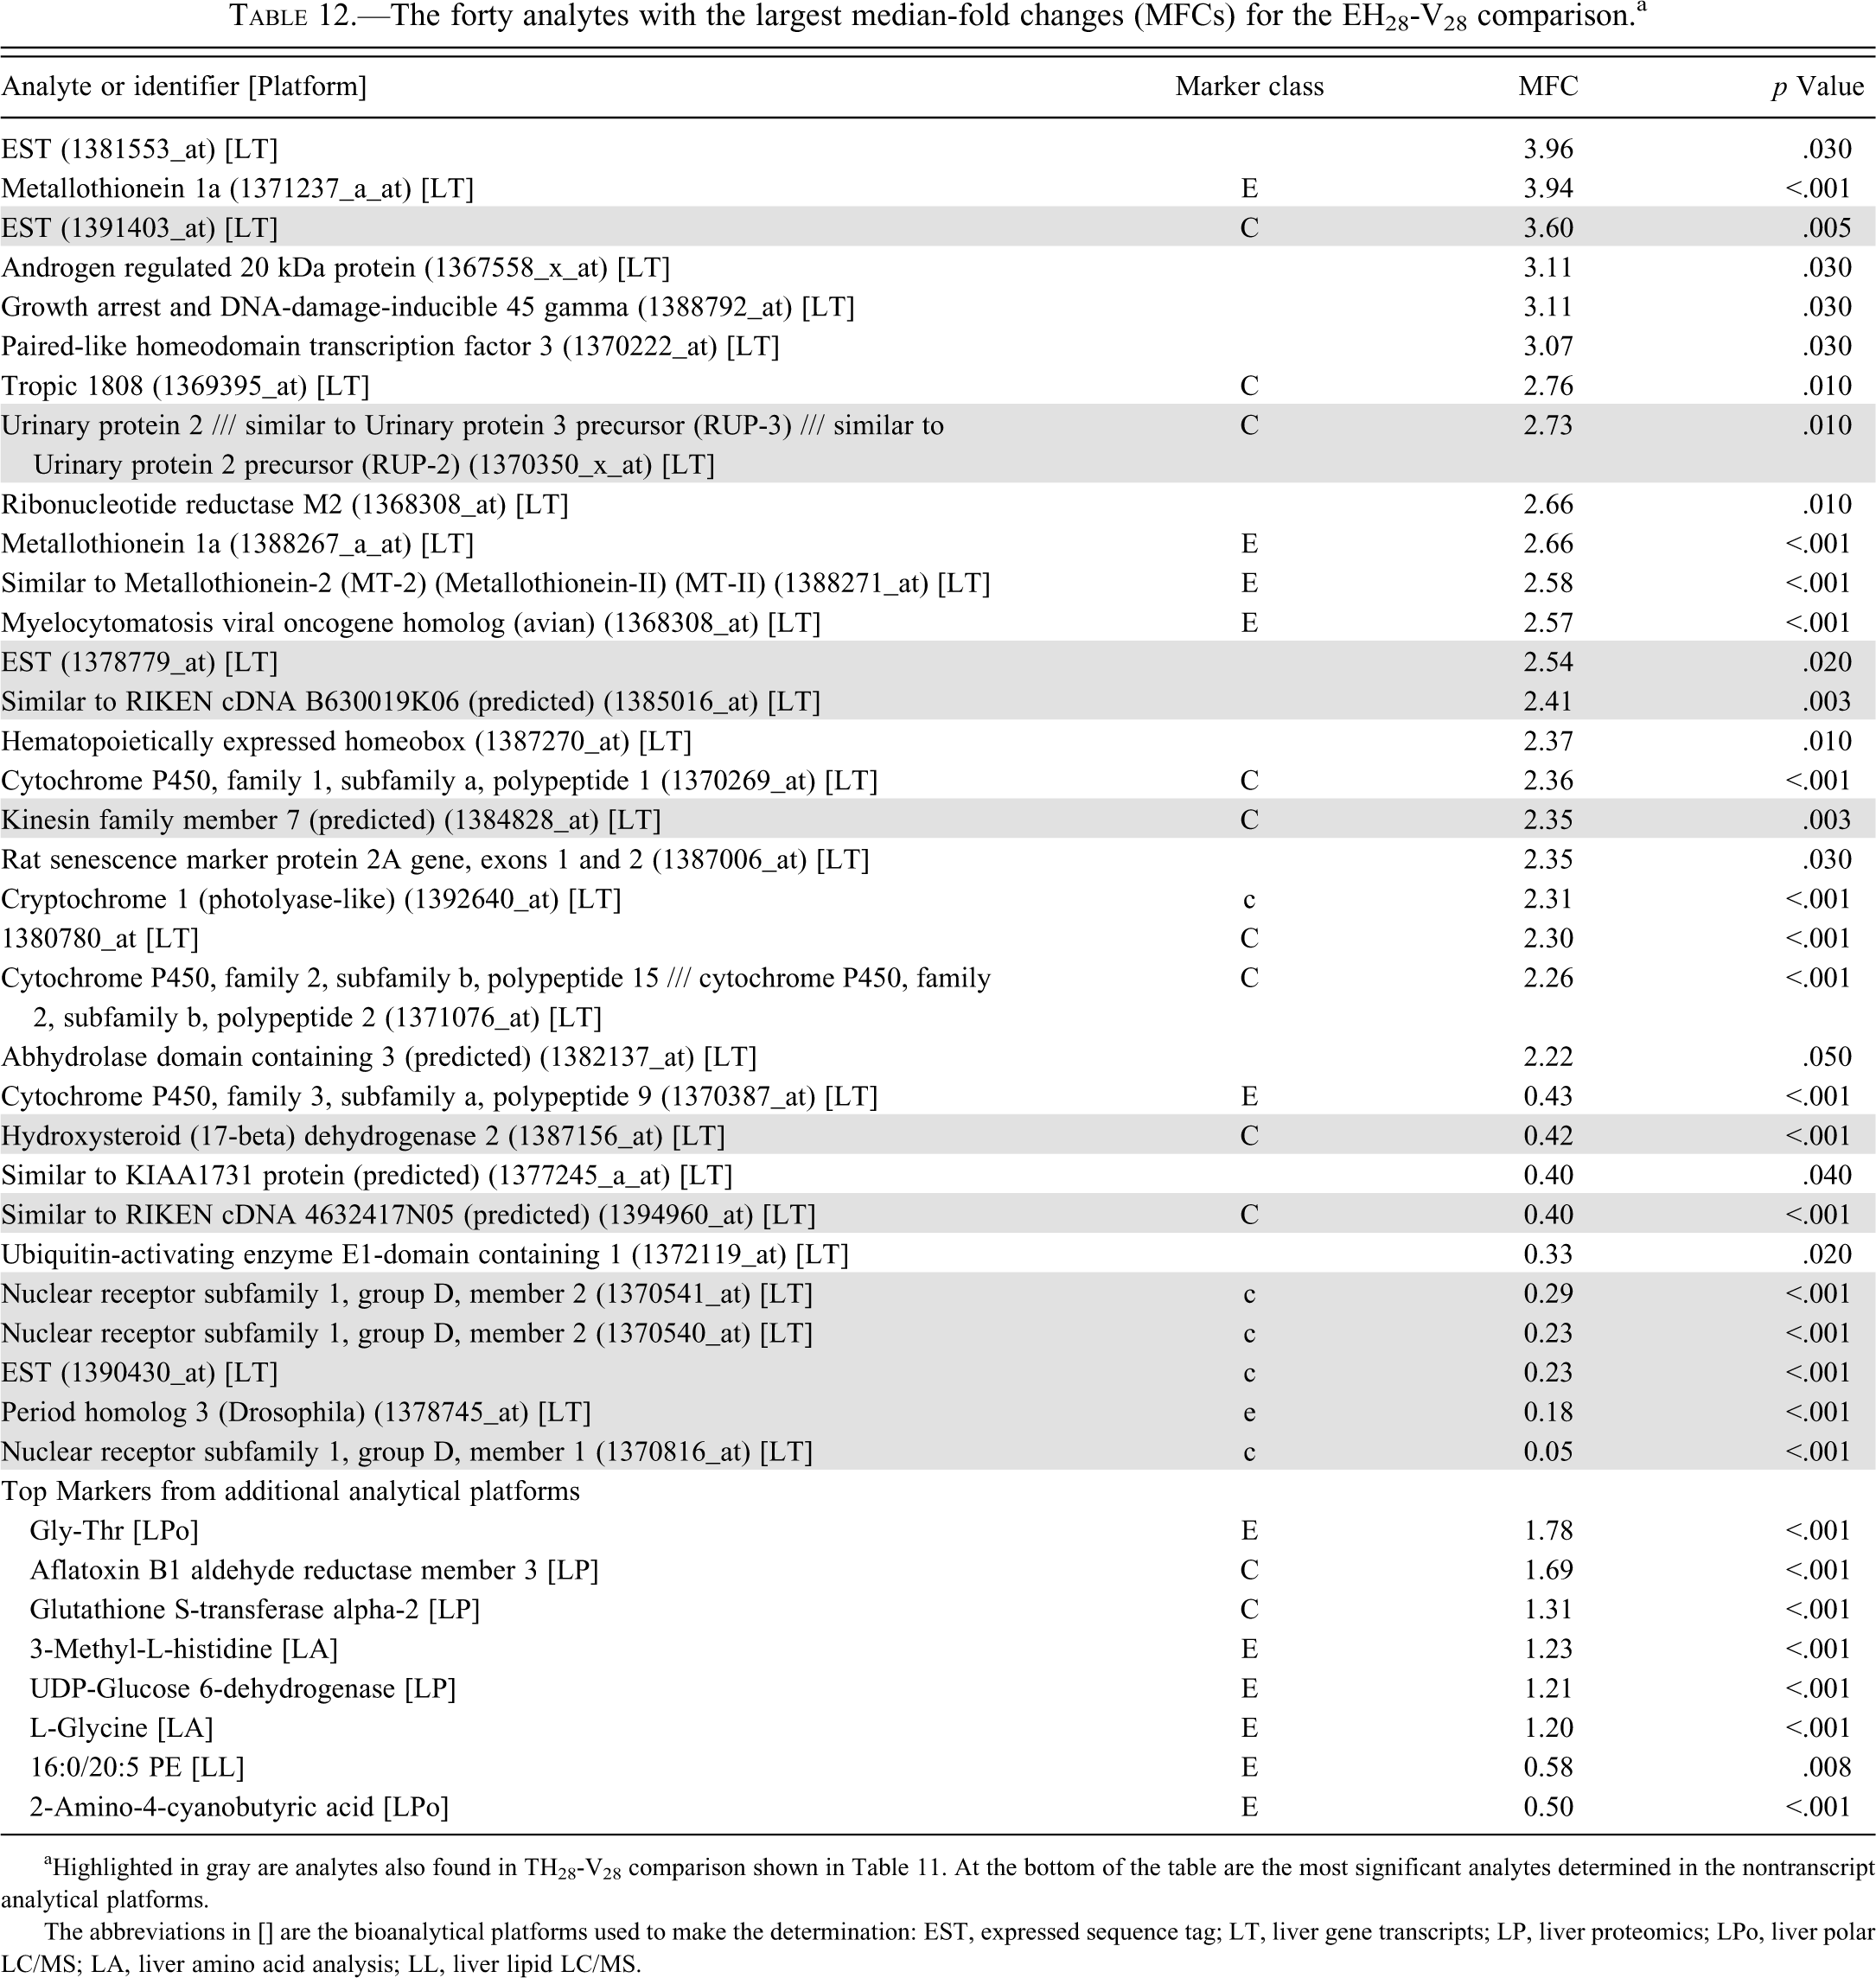
aHighlighted in gray are analytes also found in TH28-V28 comparison shown in Table 11. At the bottom of the table are the most significant analytes determined in the nontranscript analytical platforms.
The abbreviations in [] are the bioanalytical platforms used to make the determination: EST, expressed sequence tag; LT, liver gene transcripts; LP, liver proteomics; LPo, liver polar LC/MS; LA, liver amino acid analysis; LL, liver lipid LC/MS.
To ensure that transcripts with poor annotation and low signal were not overrepresented in these tables, transcripts for expressed sequence tags (ESTs) and unannotated entries whose intensity signals fell below the 25th percentile of all signal intensities and did not represent common E-V, T-V markers were filtered. Also note that the metabolomics platforms had some overlap with regard to the analyte set they measured. The same analytes may appear more than once if the same analyte was reported on more than one platform as a significant marker. For example, citrulline (Table 9) and aminoadipic acid (Table 12) are markers reported by multiple platforms, which is a good indicator of robust data quality.
From Tables 9 through 12, it is clear that, in terms of the largest changes in analyte abundances caused by drug dosing, there are few observed similarities between the effects of tolcapone and entacapone. As seen in Tables 9 and 10, for the 3-day dosing study, only eight (gray shaded background) of the top forty analytes (as ranked by MFCs) for each of tolcapone or entacapone overlap in identity and direction of change in abundance. Four of these analytes were liver gene transcripts without clear associations with identified proteins. As indicated in Tables 11 and 12, for the 28-day dosing study, twelve (gray shaded background) of the top forty analytes (as ranked by MFCs) for each of tolcapone or entacapone overlap in identity and direction of change in abundance. All of the overlapping analytes were liver gene transcripts. Seven of the analytes were transcripts associated with six identified proteins and five of the transcripts were without clear associations with identified proteins. In the case of nuclear receptor subfamily 1, group D, member 2 (Nr1d2), two different probes were mapped to the same gene. The probe for the related gene Nr1d1 was found to exhibit the largest magnitude MFCs (0.12 and 0.05, respectively) in both Tables 11 and 12.
The lack of substantial overlap among the analytes exhibiting the largest changes in abundance (based on MFC, with reduced p value criteria) in response to treatment with tolcapone and entacapone seems to be independent of dose level (not shown) or duration of dosing. Although focused on just a small number of markers for each drug and duration of dosing, this particular finding is at variance with a higher percentage of common markers across all markers and an almost doubling of the percentage of common markers with duration of dosing (see Tables 3 and 4). Overall, in the 3-day dosing study approximately 38% (484/1,282) of the statistically significant molecular changes induced by tolcapone or entacapone were found to satisfy either the strict (C) or liberal (c) classifications of common markers (see Table 3). The 38% figure can be compared to 59% (1,077/1,838) for the common markers (C or c) in the 28-day dosing study (see Table 4). At present, we have no explanation for these divergent results.
A key overall finding is that these two drugs, which were designed to have identical “on-target” pharmacological effects, have substantial “off-target” effects in rats that are considerably different in molecular terms. These “off-target” effects could be due to specific interactions of each drug with different receptors, enzymes, or other biochemical processes, including the consequences of different pathways of drug metabolism. The 40 to 60% of the statistically significant markers, which are likely “off-target” effects of the drugs, represent the marker data sets for either tolcapone or entacapone that will be incorporated into the search for preclinical biomarkers predictive of clinical idiosyncratic liver toxicity.
The most straightforward interpretation of the common markers is that they reflect the molecular changes induced by an identical “on-target,” primary pharmacological, mechanism of effect of the two drugs or common pathways for metabolism of xenobiotics (Sun et al. 2009). The data sets of these common markers can be used to explore the breadth of biochemical processes driven either from the primary pharmacological mechanism of the two drugs, the inhibition of COMT, or from the liver metabolism of the two drugs.
Overall, these results are encouraging for the overall goal of the LTBS. The observed common pharmacological effects provide an internal validation, but it is the differences in effect between the two drugs that are required for the ultimate goal of discovering pathways significant to human idiosyncratic liver toxicity. However, the relatively minimal overlap of the analytes with the largest changes in abundances remains somewhat surprising for the effects of two such similar compounds.
Conclusions
Phase I of the LTBS has demonstrated that this unique, highly collaborative approach to the discovery of preclinical biomarkers of clinical idiosyncratic liver toxicity is feasible from the points of view of technology, logistics, and nature of the results. The phase I data sets have provided results both to support advancement of the program to phase II and to enable the design of the phase II study.
The following are some of the key findings of phase I of the LTBS. There are hundreds of measurable statistically significant molecular changes across liver tissue and blood plasma that are induced by dosing rats for 3 or 28 days with either tolcapone or entacapone. Many of these molecular changes likely represent “off-target” effects of the drugs. If this general result proves to be the case with the four additional compound pairs to be studied in phase II, the resulting combined data sets from phases I and II should provide an excellent opportunity for the ultimate discovery at the end of phase II of preclinical molecular biomarkers predictive of clinical idiosyncratic liver toxicity.
In accord with literature reports (Anderson and Seilhamer 1997; Gygi et al. 1999), there was not a strong correlation between specific gene transcripts and the levels of proteins resulting from these transcripts. This finding reinforces the need to include both types of measurements in biomarker discovery studies.
An additional and surprising finding was the modest overlap of the molecular marker data sets from the 3-day and the 28-day dosing studies. The profile of molecular effects of dosing with either tolcapone or entacapone changed substantially over time. It appears that dosing for the longer period of time does not simply increase the magnitude of molecular changes already induced by dosing for the shorter period of time. If that were the case, more overlap would be expected between the 28-day dosing and 3-day dosing marker data sets. Although a preliminary result for dosing with just two drugs, this finding should be pursued further not only within the context of the LTBS but, generally, in the fields of toxicogenomics and systems toxicology. For this reason, both 3-day and 28-day dosing will be continued in phase II of the LTBS.
Phase I of the LTBS is just the first step on the path to test the study’s overall hypothesis and to discover predictive preclinical biomarkers for clinical idiosyncratic DILI. Phase II will involve the study of four additional compound pairs to provide a total of five differential marker sets to determine whether there are analytes in common among these marker sets that represent hypothetical liver toxicity predictive biomarkers.
The data sets of molecular changes from phase I of the LTBS represent a starting point for efforts to understand the biochemical mechanisms underlying the “on-target” and “off-target” effects of dosing rats with either tolcapone or entacapone for 3 or 28 days. In a separate analysis (Chang et al. 2011), we examined two animals noted in our previous publication (McBurney et al. 2009) that had outlying alanine transaminase (animal 173), aspartate transaminase (animal 173), and total bilirubin (animal 74) values. Increased expression of one gene, Vars2 (valyl-tRNA synthetase 2), was common to both animals. This gene has been associated with acetaminophen-induced liver toxicity. The results of our efforts to interpret these molecular changes in terms of biochemical processes will be presented in a subsequent article.
Footnotes
Acknowledgments
The authors thank Ralph Patton, Toxicologic Pathology Associates, NCTR, for conducting the clinical chemistry measurements and William M. Witt, Toxicologic Pathology Associates, NCTR, for performing the histopathological analyses. The authors also thank Dr. Paul Watkins for chairing the Scientific Advisory Committee and for his comments on the manuscript and Drs. Neil Kaplowitz and John Senior for their advice and counsel. The work described in this article was conducted under a CRADA between the U.S. Food and Drug Administration and BG Medicine Inc. Funds to conduct the work were provided to BG Medicine by Mitsubishi Chemical Holdings Corporation, Eisai Co. Ltd., Daiichi Sankyo Co. Ltd., UCB Pharma, Orion Pharma, Johnson and Johnson Inc., and Pfizer Inc. In addition, the authors thank the following companies for technology support: Applied Biosystems Inc., Affymetrix Inc., and TIBCO Software Inc. The views expressed in this article do not necessarily represent those of the U.S. Food and Drug Administration.
Supplemental Table 1. List of common entacapone, tolcapone markers after 3-day dosing. The listed analytes have significant changes (p values below .05) in both EH3-V3 and TH3-V3 comparisons. The table—arbitrarily—is sorted according to increasing p -values in the EH3-V3 comparison. The analyte_id column lists the Affymetrix probe references for transcripts; for the remaining platforms these are internally used identifiers. Accession numbers indicate the International Protein Index (IPI) references for proteins and CAS identifiers for metabolites.
Supplemental Table 2. List of common entacapone, tolcapone markers after 28-day dosing. The listed analytes have significant changes (p values below .05) in both EH28-V28 and TH28-V28 comparisons. The table—arbitrarily—is sorted according to increasing p values in the EH28-V28 comparison. The analyte_id column lists the Affymetrix probe references for transcripts; for the remaining platforms these are internally used identifiers. Accession numbers indicate the International Protein Index (IPI) references for proteins and CAS identifiers for metabolites.
Supplemental Table 3. List of markers common to 3-day and 28-day dosing. The listed analytes have significant changes (p values below .05) in both 3-day and 28-day dosing in either EH-V, TH-V, or EH-TH comparisons. The table—arbitrarily—is sorted according to increasing p -values in the EH3-V3 comparison. The analyte_id column lists the Affymetrix probe references for transcripts; for the remaining platforms these are internally used identifiers. Accession numbers indicate the International Protein Index (IPI) references for proteins and CAS identifiers for metabolites.
The authors declared no potential conflicts of interest with respect to the research, authorship, and/or publication of this article.
The authors received no financial support for the research, authorship, and/or publication of this article.