
Abstract
An increased incidence of renal tubular adenomas and carcinomas was identified in the 2-year CD-1 mouse carcinogenicity study with empagliflozin (sodium-glucose transporter 2 inhibitor) in high dose (1,000 mg/kg/day) male mice. A 13-week mouse renal investigative pathogenesis study was conducted with empagliflozin to evaluate dose dependency and temporal onset of nonneoplastic degenerative/regenerative renal tubular and molecular (genes, pathways) changes which precede neoplasia. Male and female CD-1 mice were given daily oral doses of 0, 100, 300, or 1,000 mg/kg/day (corresponding carcinogenicity study dose levels) for 1, 2, 4, 8, or 13 weeks. The maximum expected pharmacology with secondary osmotic diuresis was observed by week 1 at ≥100 mg/kg/day in both genders. Histopathologic kidney changes were first detected after 4 weeks of dosing in the male 1,000 mg/kg/day dose group, with progressive increases in the incidence and/or number of findings in this dose group so that they were more readily detected during weeks 8 and 13. Changes detected starting on week 4 consisted of minimal single-cell necrosis and minimal increases in mitotic figures. These changes persisted at an increased incidence at weeks 8 and 13 and were accompanied by minimal to mild tubular epithelial karyomegaly, minimal proximal convoluted tubular epithelial cell hyperplasia, and a corresponding increase in Ki-67-positive nuclei in epithelial cells of the proximal convoluted tubules. There were no corresponding changes in serum chemistry or urinalysis parameters indicative of any physiologically meaningful effect on renal function and thus these findings were not considered to be adverse. Similar changes were not identified in lower-dose groups in males nor were they present in females of any dose group. RNA-sequencing analysis revealed male mouse-specific changes in kidney over 13 weeks of dosing at 1,000 mg/kg/day. Treatment-related changes included genes and pathways related to p53-regulated cell cycle and proliferation, transforming growth factor β, oxidative stress, and renal injury and the number of genes with significant expression change dramatically increased at week 13. These treatment-related changes in genes and pathways were predominant in high-dose males and complemented the observed temporal renal tubular changes. Overall, these mouse investigative study results support the role of early empagliflozin-related degenerative/regenerative changes only observed in high-dose male CD-1 mice as a key contributing feature to a nongenotoxic mode of renal tumor pathogenesis.
Keywords
The sodium-glucose transporter (SGLT) family is composed of seven members (SGLT1, SGLT2, SGLT3, SGLT4, SGLT5, SGLT6, and SMIT1). Quantitative reverse transcription polymerase chain reaction, northern blot analysis, and in situ hybridization studies demonstrated that SGLT1 is expressed in the small intestine and kidney of both rats and humans, while SGLT2 is expressed almost exclusively in the kidneys of mice, rats, and humans (Zhao and Keating 2007; Wright, Loo and Hirayama 2011; Sabolic et al. 2012). SGLT2 is responsible for the majority of glucose reabsorption filtered through the glomerulus and returned to the plasma.
Empagliflozin is an SGLT2 inhibitor that was approved for the oral treatment of type 2 diabetes in adults to improve glycemic control by inhibiting glucose transport from the urine filtrating into circulation via SGLT2 inhibition in proximal convoluted tubules. In a CD-1 mouse two-year carcinogenicity study with empagliflozin (dose levels of 100, 300, and 1,000 mg/kg/day), an increased incidence of renal tubular adenomas and carcinomas was identified only in the male high-dose group (Bogdanffy et al. 2014). Renal tumors were preceded by a number of renal degenerative/regenerative findings that were detected in the shorter-term toxicology studies, also limited to male mice, given 1,000 mg/kg/day. An investigative mouse renal pathogenesis study was conducted to evaluate dose dependency and temporal onset of nonneoplastic degenerative/regenerative tubular changes which precede neoplasia. We also utilized RNA sequencing (RNA-seq) to evaluate renal gene expression and pathway changes to evaluate molecular changes associated with renal pathology.
Method and Material
Animals and Experimental Methods
Male and female CD-1 mice (∼7 weeks at study start) were obtained from Charles River Laboratories, Inc., Raleigh, NC. Animals were single housed in polycarbonate caging with Sani-Chips® bedding (P. J. Murphy Forest Products Corp., Montville, NJ) equipped with an automatic watering valve. The animal room environment was controlled (68°F–79°F, humidity 50% ± 20%, 12 hr light/dark) and under husbandry conditions consistent with the Guide for the Care and Use of Laboratory Animals (Institute of Laboratory Animal Resources 1996). Animals received ad libitum access to diet-certified commercial pelleted laboratory diet. During urine collection, animals were given diet gel cups. Animals were not fasted.
Empagliflozin was suspended in 0.5% (w/v) hydroxyethylcellulose in reverse osmosis water. Animals (50/sex/group) received daily oral gavage doses of 0, 100, 300, or 1,000 mg/kg/day for 1, 2, 4, 8, or 13 weeks. The first ten surviving animals/sex/dose level were euthanized at each necropsy interval on study days 8, 15, 29, 56, and 92. Terminal body weights were collected, the brains and kidneys were weighed, and the kidneys were collected at each scheduled necropsy.
Necropsy and Clinical Chemistry
Both kidneys from the first five animals/sex/dose level were fixed in neutral-buffered formalin for approximately 24 hr, followed by routine processing and sectioning for evaluation of hematoxylin and eosin (H&E)-stained sections by light microscopy. One approximate 2-mm thick transverse section of the right and left kidney from the remaining five animals/sex/dose level was preserved in 10% neutral-buffered formalin for approximately 24 hr, followed by similar, routine processing and sectioning for H&E-stained slides for evaluation by light microscopy. The remaining half of each kidney was sectioned transversely at necropsy in approximate 2-mm sections and embedded flat in a separate OCT filled mold and flash frozen in liquid nitrogen for Ki67 immunohistochemistry evaluation by light microscopy. Light microscopy examination was performed by a pathologist and results were peer reviewed.
Frozen tissue sections were fixed with cold acetone for 10 min at −20°C and allowed to air dry at room temperature. The air-dried slides were rinsed in TBS Tween-20 wash buffer for 5 min. An endogenous peroxidase block and a protein block to reduce nonspecific binding were performed. Abcam rabbit anti-Ki67 monoclonal antibody (Abcam, Cambridge, MA, cat# ab16667) was applied to one slide from each animal, and negative control rabbit isotype (Vector Labs, Cambridge, MA, cat# P1-1,000) was applied to a second slide from each animal. Dako Envision + Systems Peroxidase–labeled polymer-HRP anti-rabbit (Dako, Carpinteria, CA, cat# K4003) was applied followed by 3,3-diaminobenzidine substrate-chromogen (Vector Labs, Cambridge, MA, ImmPACT, cat# SK-4105). Slides were counterstained with hematoxylin (Vector Labs, Cambridge, MA, cat# H-3404).
Blood samples for clinical chemistry analysis (Roche COBAS c501 or H917) and parathyroid hormone (PTH; ALPCO Diagnostics, Salem, NH, cat# 31-PTHMS-E01) assessment were collected from all animals at the scheduled necropsy and, when possible, from animals euthanized early. Urine samples were collected via metabolism cages for approximately 24 hr prior to the scheduled necropsy for urinalysis (Roche COBAS c501 or H917). When possible urine samples were collected via cystocentesis from animals euthanized early, multivariate analysis was performed on the PTH data to evaluate gender, dose, and sampling time relationships on the levels of PTH and empagliflozin in the plasma. A regression utilizing least squares to fit generalized linear model (GLM) was performed to identify the impact of sampling time, gender, and empagliflozin dose on the results of plasma PTH and separately on the plasma levels of empagliflozin. Plasma concentrations of PTH and empagliflozin were used from day 85 samples taken at 3 different sampling times over a 24-hr period (2, 4, and 24 hr after dosing). The PTH and plasma levels of empagliflozin were collected among 4 different exposure groups of animals: no exposure (vehicle control) and animal groups dosed with 100, 300, and 1,000 mg/kg/day of empagliflozin. In addition, the gender of each animal was recorded.
The GLM included evaluation of the three main factors, including gender, sampling time after dosing, and empagliflozin dose, and all possible two-way interaction terms between these. The main three factors were always included; however, only statistically significant (p value ≤ .05) interaction terms were included in the final models selected. Both the PTH and plasma levels of empagliflozin were log transformed for this evaluation and the final model estimated mean and the 95% confidence interval values were backtransformed to the original units of measurement. A separate correlation between levels of PTH and empagliflozin was performed to evaluate impact of the three sampling times during a 24-hr time period. The GLM and Corr procedures in PC SAS version 9.2 were used for the analysis.
The determination of the plasma concentration of empagliflozin at which the suppression of PTH levels is maximal was accomplished in two ways. Firstly, a visual inspection of the spline-based smoothing of the data graphs, or fitting a curve to the data, was performed in order to evaluate the critical threshold of empagliflozin plasma concentration above which the curve “flattens out” or the slope of the fitted curve is near 0. Secondly, a nonlinear regression and the resulting model plots of PTH versus empagliflozin plasma levels was examined to visually determine the plasma concentration of empagliflozin at which the suppression of PTH levels is maximal (i.e., the fitted line flattens out or the slope of the curve is near 0).
The SAS procedure TRANSREG (transformation regression) was fit as follows: the outcome variable PTH was either in its original unit of measurement (untransformed) or log transformed and analyzed separately, while the predictor plasma empagliflozin concentration was transformed with polynomial splines. The control mice were excluded from this analysis, as all of their plasma levels of empagliflozin were 100; thus, only treated animals (n = 53) were considered for this analysis. Plasma concentration values of 100 actually reflect <100 nM which is below the limit of quantification.
Renal Biomarkers
Urine samples were assayed according to the manufacturer’s instructions using commercially available kits: KIM1, NGAL (R&D Systems, Minneapolis, MN), Microalbumin (Kamiya, Seattle, WA), Cystatin C (Biovendor, Asheville, NC), and Clusterin (Mesoscale Diagnostics, Rockville, MD). Biomarker values were corrected to urinary creatinine values.
RNA Isolation and Expression Profiling
Kidney samples were collected from the second five animals/sex/group at each necropsy for RNA isolation and whole transcriptome analysis using RNA-seq. Enriched renal cortex tissue was collected from five male and five female CD-1 mice at 1, 2, 4, 8, and 13 weeks after dosing with empagliflozin at 1,000 mg/kg/day. Total RNA isolation was performed using TRIzol® reagent (Thermo Fisher Scientific)-based method and was tested for quantity and integrity on an Agilent 2200 Tape Station. Twenty million reads were generated from 50 bp paired-end sequencing using Illumina HiSeq 2000 in the Covance Genomic Laboratory. RNA-Seq reads were mapped to the mouse genome (version mm10) using the Spliced Transcripts Alignment to a Reference Aligner (version 2.3.0; Dobin et al. 2013). Transcripts from each sample were quantitated from mapped reads using Cufflinks (version 2.0.2.2; Trapnell et al. 2010) which assembles transcripts and estimates their abundances, providing metrics for each transcript by gene symbol in fragments per kilobase million reads mapped. Genes that were differentially expressed for the different comparisons (by dose, animal sex, or time point) were determined by use of CuffDiff (version 2.0.2.2; Trapnell et al. 2013). Fold changes were calculated between empagliflozin-treated animals to vehicle-treated animals at each time point during the 13-week dosing period. The transcripts with fold changes above 1.5 and false discovery rate (Benjamini and Hochberg 1995) corrected p value less than .05 were considered statistically significant between two comparisons. Clustering analysis was performed on standard score on a gene across gender and species using Ward’s method. Gene functions were annotated using the Panther database (version 8.1; Mi et al. 2005) and ingenuity pathway analysis.
Results
Clinical Observations and Body Weights
Death in three male and two female animals was attributed to empagliflozin administration at 1,000 mg/kg/day. Four of these animals died during the first ten days of dosing. At necropsy, observations of gaseous abnormal contents within the cecum with varying red discoloration of the cecum were noted in these animals which correlated to in life findings of soft feces, watery feces, and urogenital hair coat staining. The necropsy observations in these animals were considered consistent with malabsorption of glucose related to off-target inhibition of SGLT-1 by empagliflozin (Grempler et al. 2012). The severity of these changes was consistent with moribundity and/or death. Only one male animal, which was euthanized on study day 71, demonstrated minimal karyomegaly and minimal single-cell necrosis; however, these changes were not considered to be related to the moribund state. Similar clinical observations were limited to remaining 1,000 mg/kg/day animals and were more prevalent in the male animals. Body weight changes (2.9% decreased body weight gain in males; slight increase in body weight gain in females) were limited to 1,000 mg/kg/day animals at week 1 which seemed to adjust over the remaining course of compound administration (data not shown).
Toxicokinetics
Toxicokinetic parameters showed that plasma exposure to empagliflozin was generally similar on study days 1 and 85, although exposure in the females administered 1,000 mg/kg/day appeared to increase with repeated dosing. C max and AUC0–24 were consistently greater in female mice (Table 1).
BI 10773 toxicokinetic parameters.
Clinical Pathology
Electrolyte (sodium, potassium, chloride, calcium, and phosphorus) excretion values, when adjusted as a function of 24-hr excretion volume, were significantly increased in all dose groups and multiple time points for both males and females ranging from 19.92% to 163.86% above controls (Online Supplemental Tables S1–5). Increases in glucose excretion and sodium excretion were observed in both genders at various time points and dose levels (≥100 mg/kg/day) over the course of the 13-week treatment period (Figure 1). Urine osmolality was significantly increased at >100 mg/kg/day in both genders starting on week 1, ranging from 23% to 48% above control in males and from 10% to 61% above control in females (Figure 2). No significant treatment-related changes in urine pH or ketones were observed (data not shown).
Comparison of glucose excretion and sodium excretion between males and females as a function of time.
Urine osmolality.
Plasma PTH levels measured on day 85 of the toxicokinetic portion of this toxicology study were significantly decreased most notably at the 2-hr sampling time point at doses ≥100 mg/kg/day in both genders which correlated with empagliflozin plasma concentrations (Online Supplemental Figure S1).
Serum cystatin C was slightly increased (25% above control) only in 300 mg/kg/day females on week 2 and was not considered to be related to empagliflozin treatment (Online Supplemental Figure 2). Significant but variable increases in creatinine-normalized urinary clusterin (Online Supplemental Figure 4), mNGAL (Online Supplemental Figure 5), KIM-1 (Online Supplemental Figure 6), and microalbumin (Online Supplemental Figure 7) as well as urinary cystatin C (Online Supplemental Figure 3) excretion were observed. The magnitudes of change were most notable in both genders for mNGAL, clusterin, and microalbumin, ranging from 1.89- to 6.07-fold controls at various doses and treatment times (Online Supplemental Figures S3 and S4).
Macroscopic and Microscopic Observations
No empagliflozin-related kidney weight changes were detected in males at any necropsy interval. Slight and statistically significant increased kidney weight changes were detected in females (≥100 mg/kg/day; data not shown). However, the changes detected did not correlate to any macroscopic observations or microscopic findings. There were no microscopic correlates to the macroscopic observations consisting of gaseous distention seen at necropsy in males and females, given 1,000 mg/kg/day.
Empagliflozin-related microscopic kidney findings were limited to the outer cortex of males, given 1,000 mg/kg/day (Table 2). Changes were first detected after the week 4 necropsy, with progressive increases in the incidence and/or number of findings so that they were more readily detected at the 8- and 13-week time points. Changes detected after the week 4 necropsy consisted of minimal single-cell necrosis (Figure 3A) and minimal increases in mitotic figures (Figure 3B). These changes were present at an increased incidence at the 8- and 13-week time points. These changes represent the earliest evidence of insult to the proximal convoluted tubule. Increased Ki-67 immunostaining of frozen sections corroborates the increased mitotic figure diagnosis at the 8- and 13-week time points in 1,000 mg/kg/day male mice (Table 3). Tubular epithelial karyomegaly, defined as an increased number of cells having larger than normal nuclei, becomes evident at the 8-week time point (Figure 3C). Simple epithelial cell hyperplasia, characterized by crowding of epithelial cells lining proximal convoluted tubules (Figure 3D), was first detected at the 8-week time point and was most evident at the 13-week time point. There was no evidence of atypical hyperplasia at all time points up to and including the 13-week (end of study) time point.
Incidence Summary of Kidney Histopathologic Changes.
a N ranges from 3 to 5 individual animals.
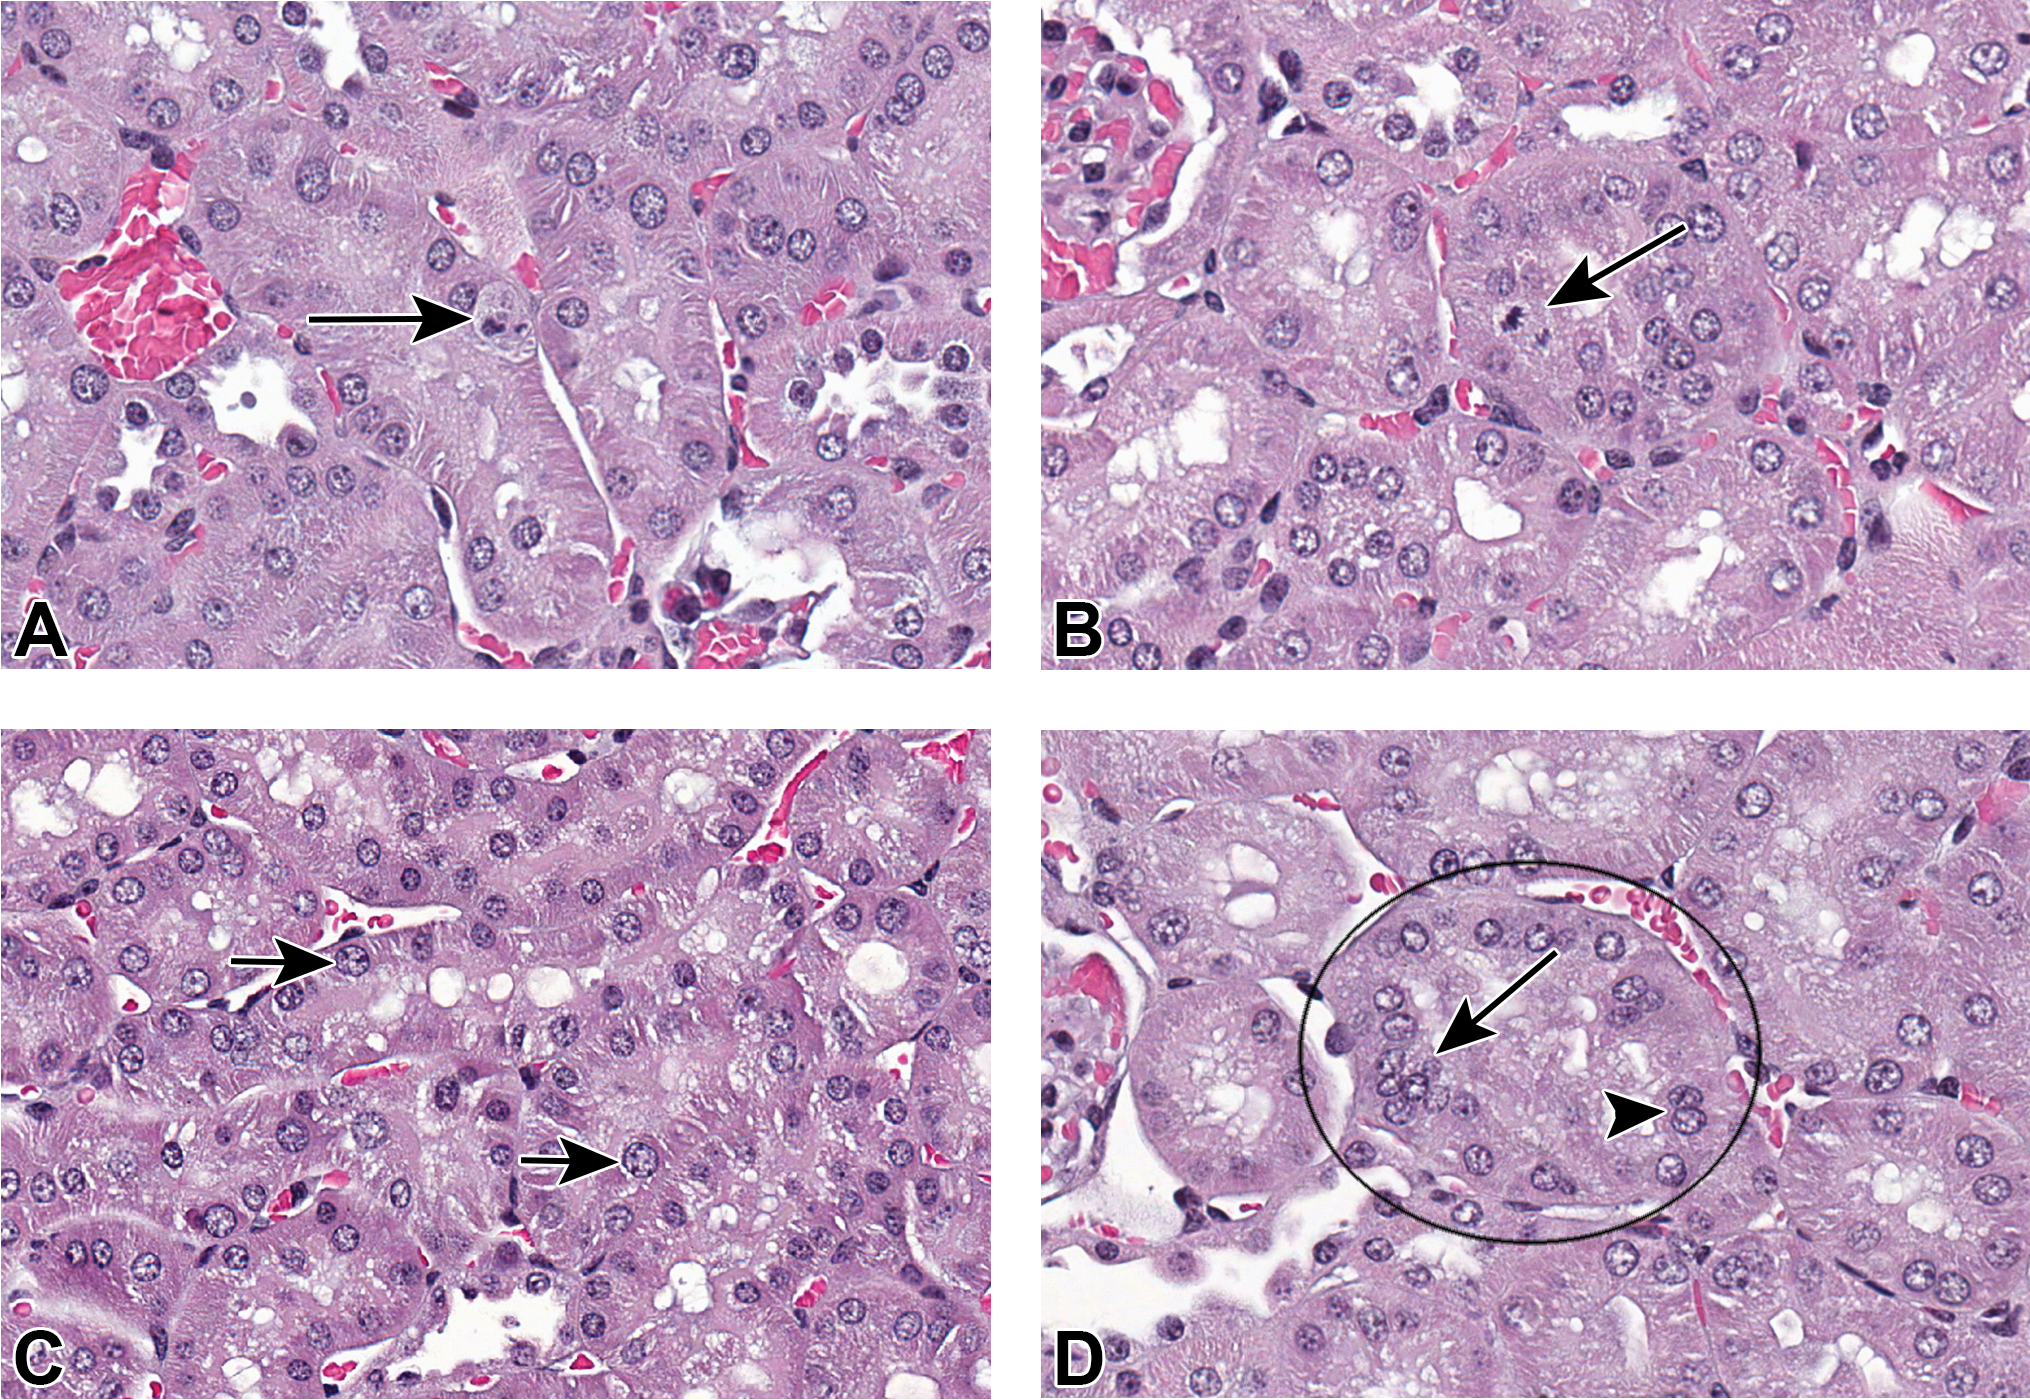
Kidneys of male CD-1 mice, given empagliflozin at 1,000 mg/kg/day. Single-cell necrosis (arrow) was evident in proximal convoluted tubules (A). Increased mitotic figures (arrow) were present in proximal convoluted tubules (B). Tubular epithelial karyomegaly (arrows) was also present in proximal convoluted tubules (C). Simple epithelial hyperplasia in proximal convoluted tubules with a binucleate cell (arrow head) and piling up of cells (arrow) were also observed (D).
Range of Ki-67 Positively Stained Proximal Convoluted Tubular Nuclei per 10 High-power Fields in Kidneys of Mice, Given Empagliflozin for up to 13 Weeks.
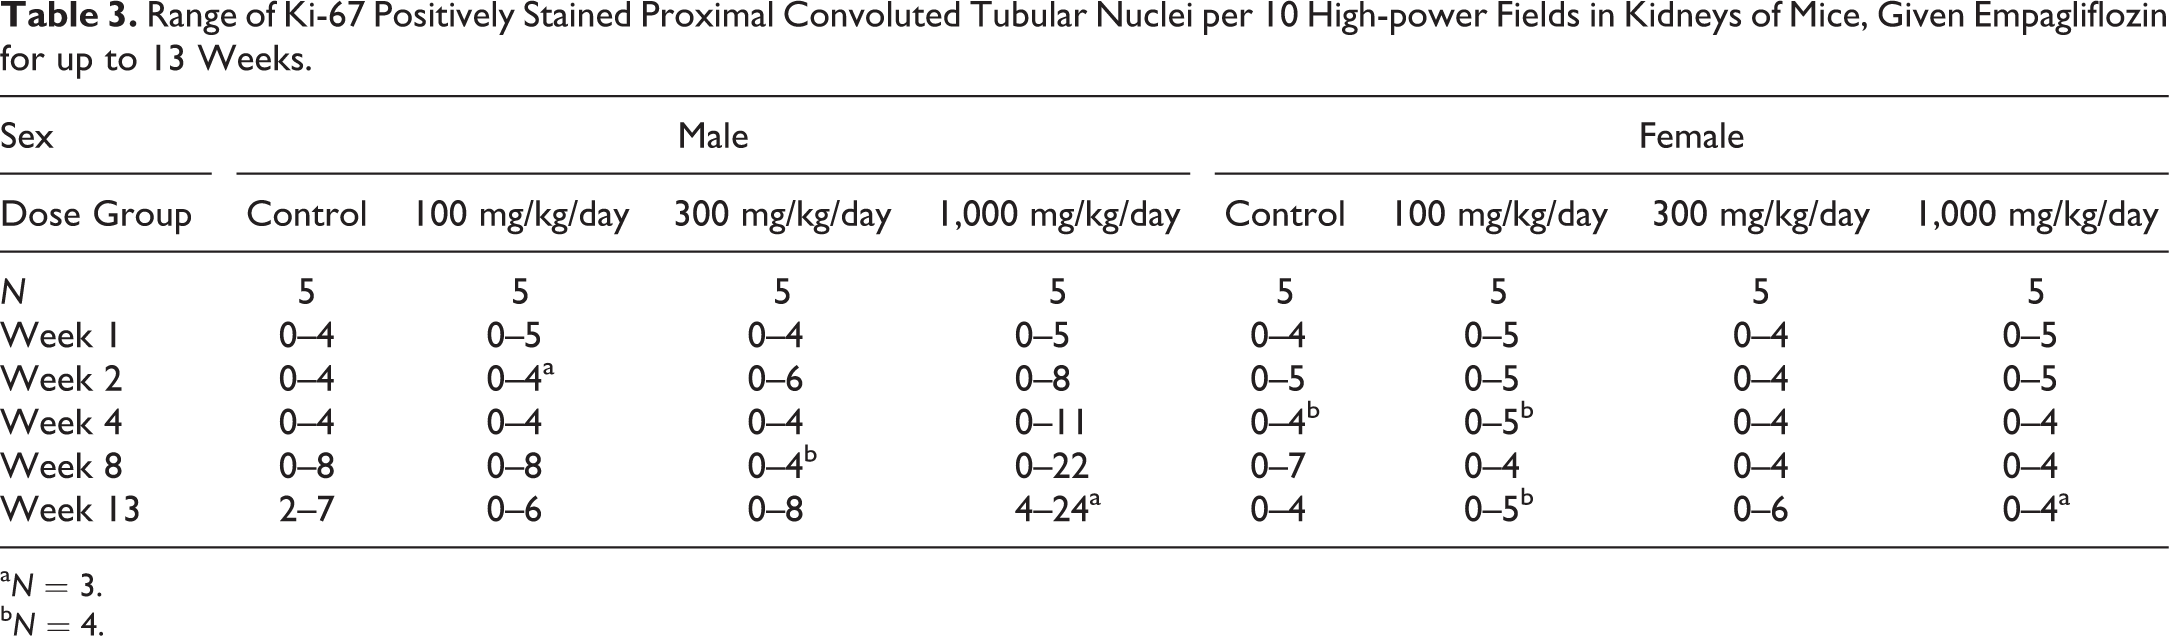
a N = 3.
b N = 4.
Renal Gene Expression Changes
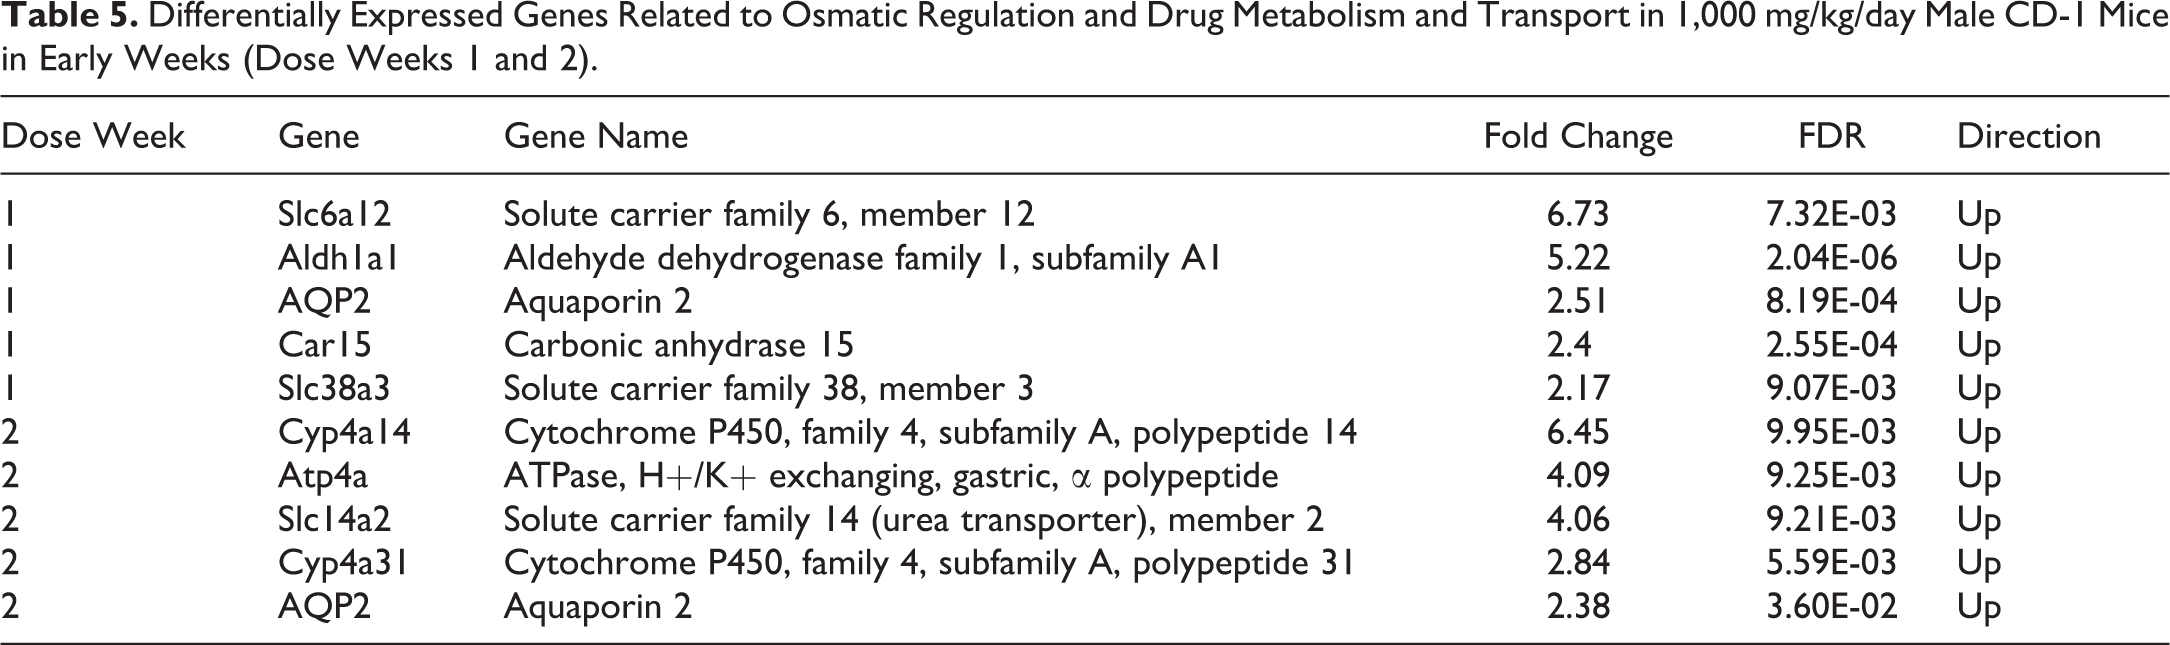
Gender differential renal gene expression was notable in both untreated CD-1 mice and mice dosed with empagliflozin (Figure 4). Major expression changes related to empagliflozin increased with the duration of treatment mainly in 1,000 mg/kg/day male mice (Online Supplemental Tables 7 and 8). In contrast to 1,000 mg/kg/day females, the number of genes with changed expression increased from 17 genes (10 upregulated genes and 7 downregulated genes) in week 1 to 186 genes (72 upregulated genes and 114 downregulated genes) in week 13 in 1,000 mg/kg/day males (Table 4). Early upregulated genes (Table 5) in male 1,000 mg/kg/day mice (weeks 1 and 2) included solute carrier family Slc6a12 (6.73 fold, p = 7.32E-03), Slc38a3 (2.17 fold, p = 9.07E-03), and aquaporin 2 (AQP2; 2.51 fold, p = 8.19E-04), all of which are involved in osmolarity regulation and drug metabolism and transport. Aldehyde dehydrogenase Adh1a1 was also upregulated in 1,000 mg/kg/day males at week 1 (5.22 fold, p = 2.04E-06). At week 2, two cytochrome p450 genes, Cyp4a14 and Cyp4a31, started to show increased expression in 1,000 mg/kg/day male mice. Both Cyp4a14 and Cyp4a31 are PPAR α responsive genes, possibly involved in lipid homeostasis and oxidative stress response (Bumpus and Johnson 2011). Genes involved in osmolarity regulation, such as AQP2 and Slc6a12, continued to show higher expression in 1,000 mg/kg/day male mice. Another upregulated transporter at week 2 was Slc14A2 which is known as urea transporter in kidney.
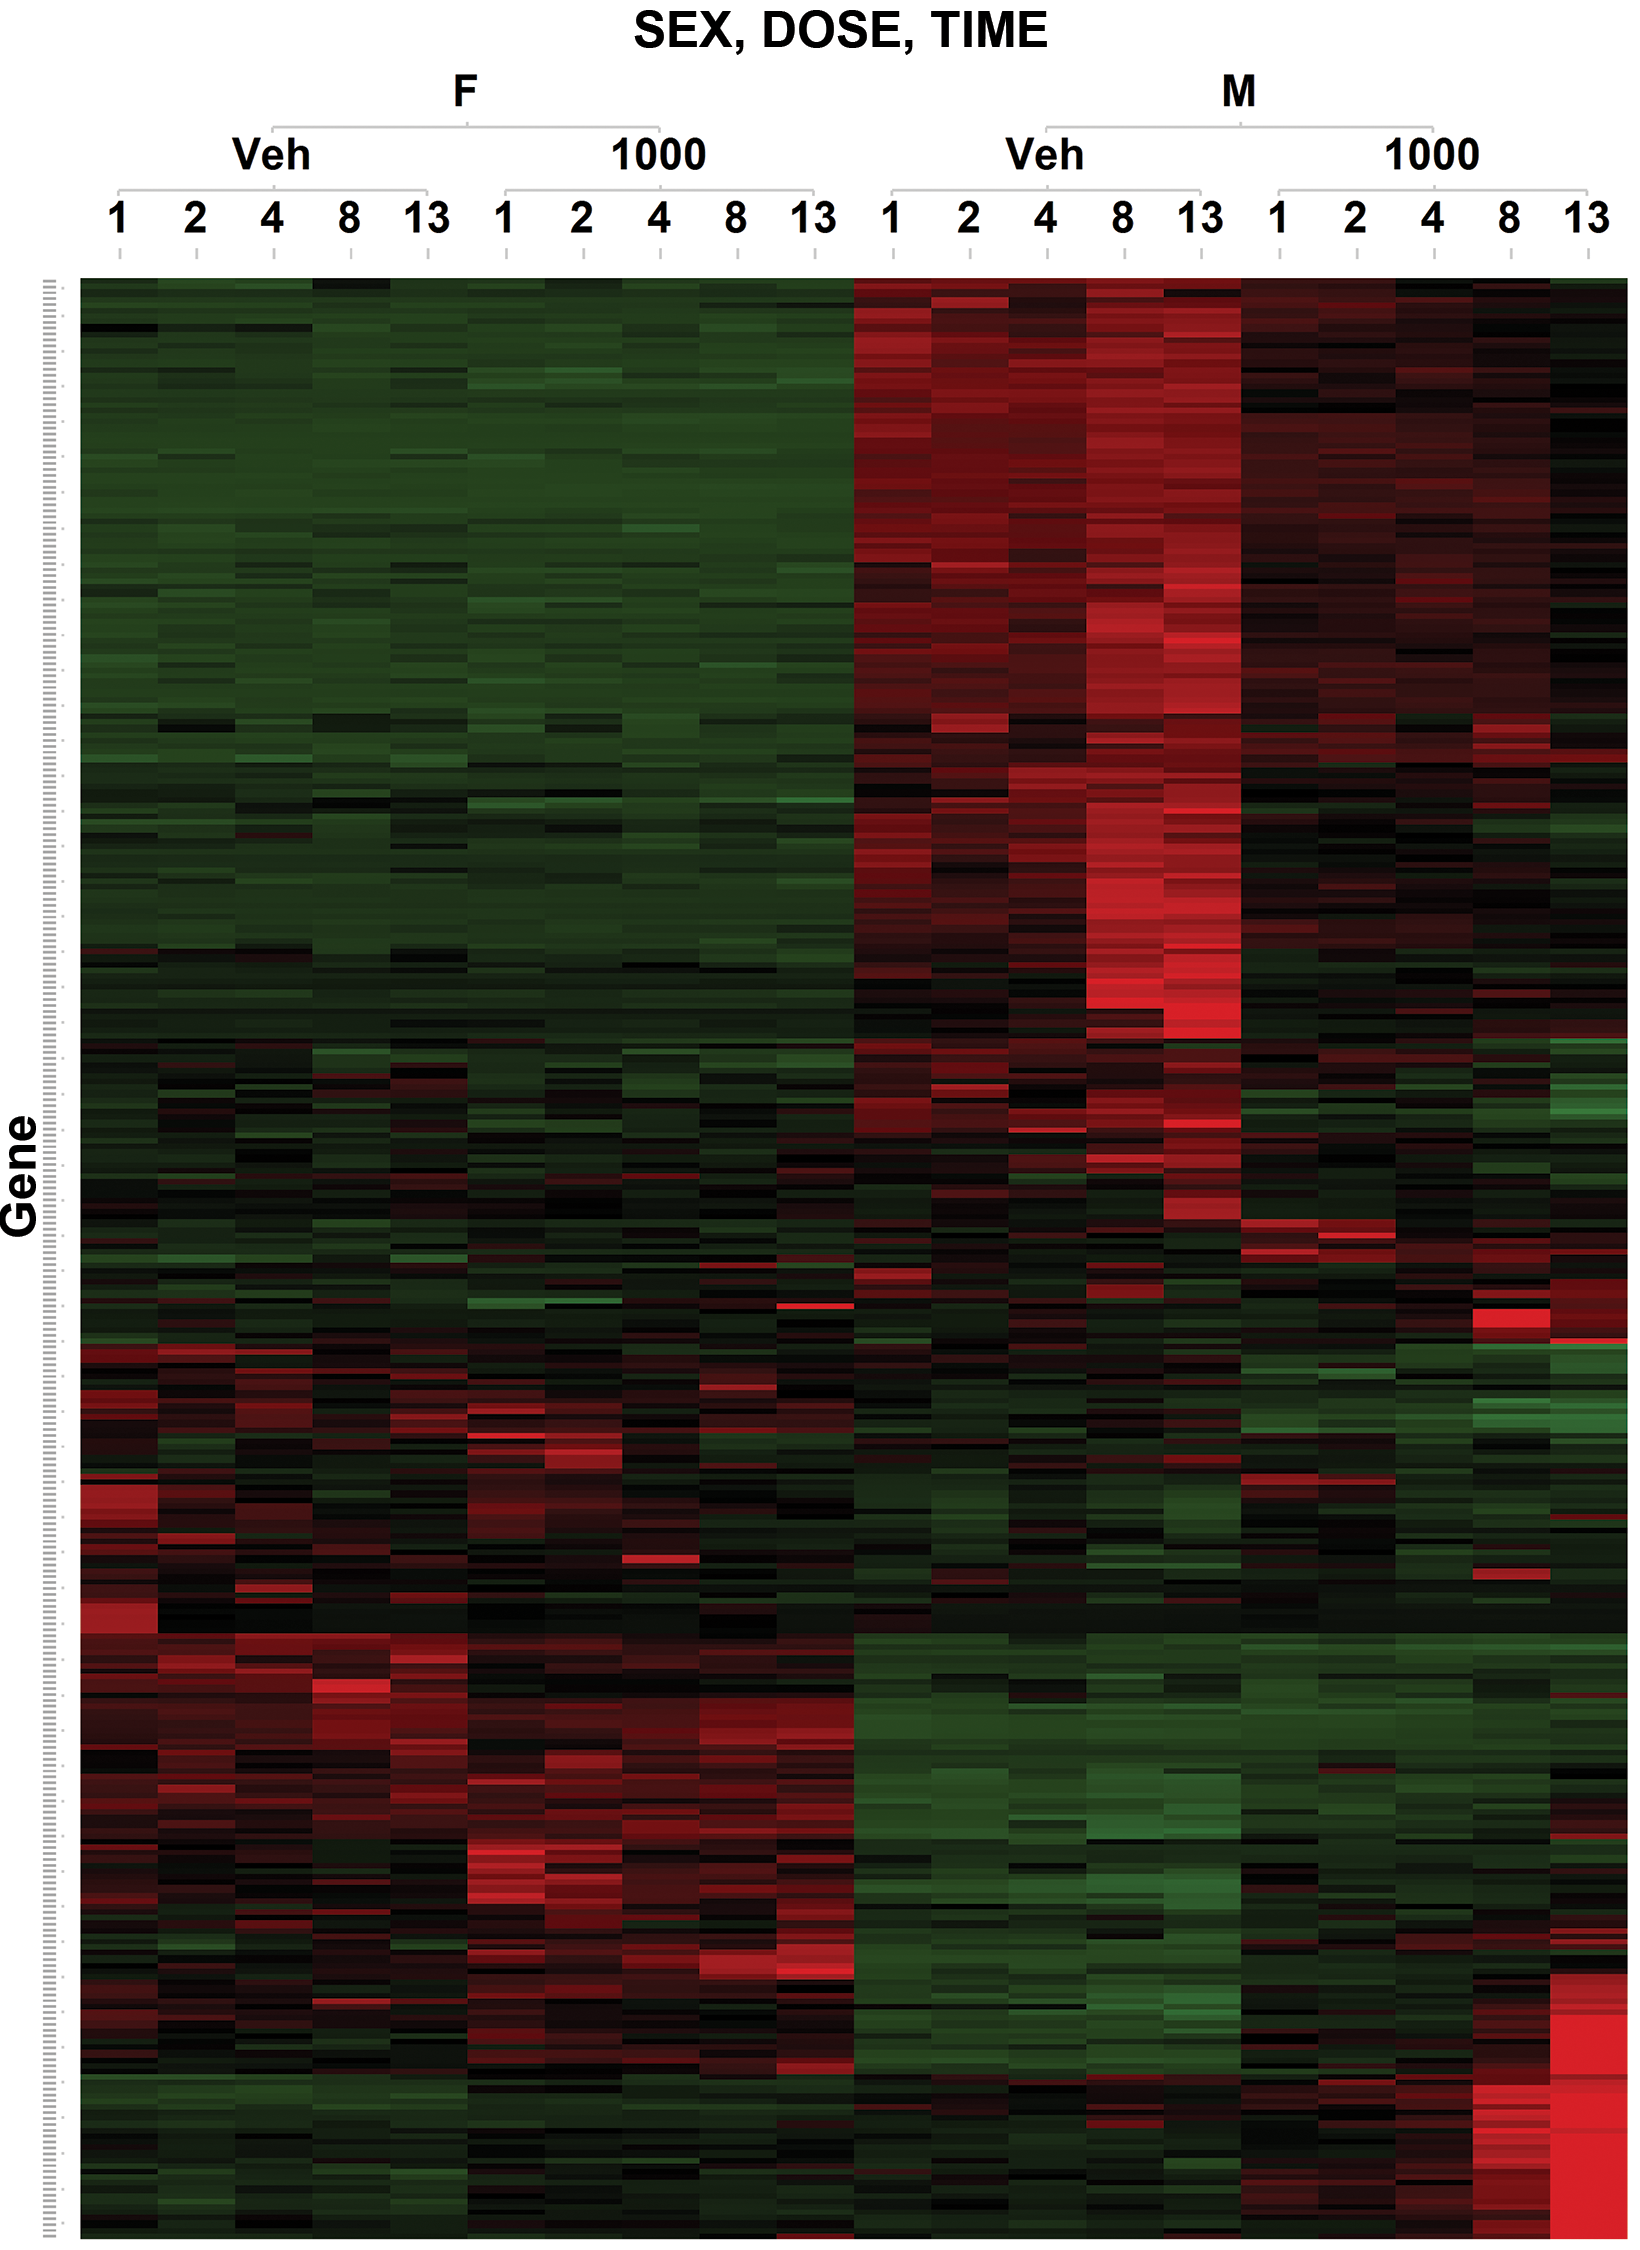
Clustering analysis shows gender predominant differential and major expression changes with empagliflozin treatment in 1,000 mg/kg/day male CD-1 mice.
The Number of Genes with Differential Expression in 1,000 mg/kg/day Male CD-1 Mice over the 13-week Empagliflozin Treatment Period.
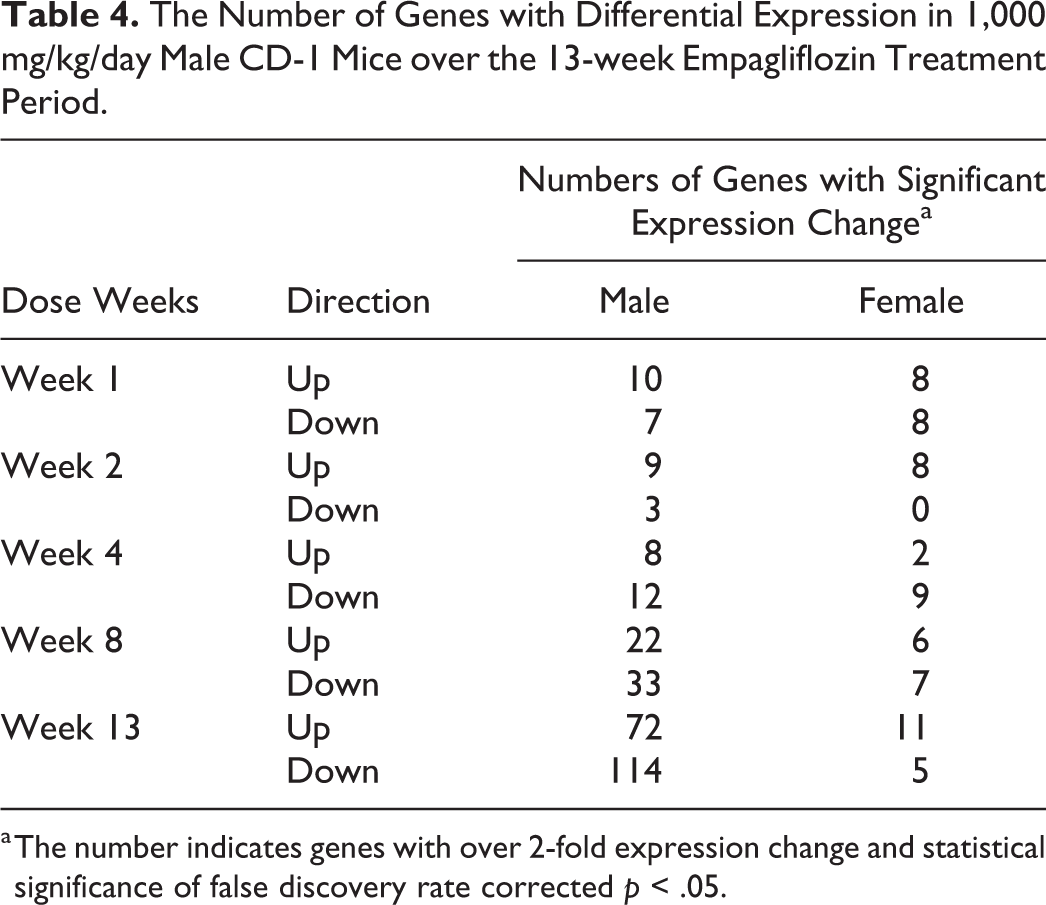
a The number indicates genes with over 2-fold expression change and statistical significance of false discovery rate corrected p < .05.
Differentially Expressed Genes Related to Osmatic Regulation and Drug Metabolism and Transport in 1,000 mg/kg/day Male CD-1 Mice in Early Weeks (Dose Weeks 1 and 2).
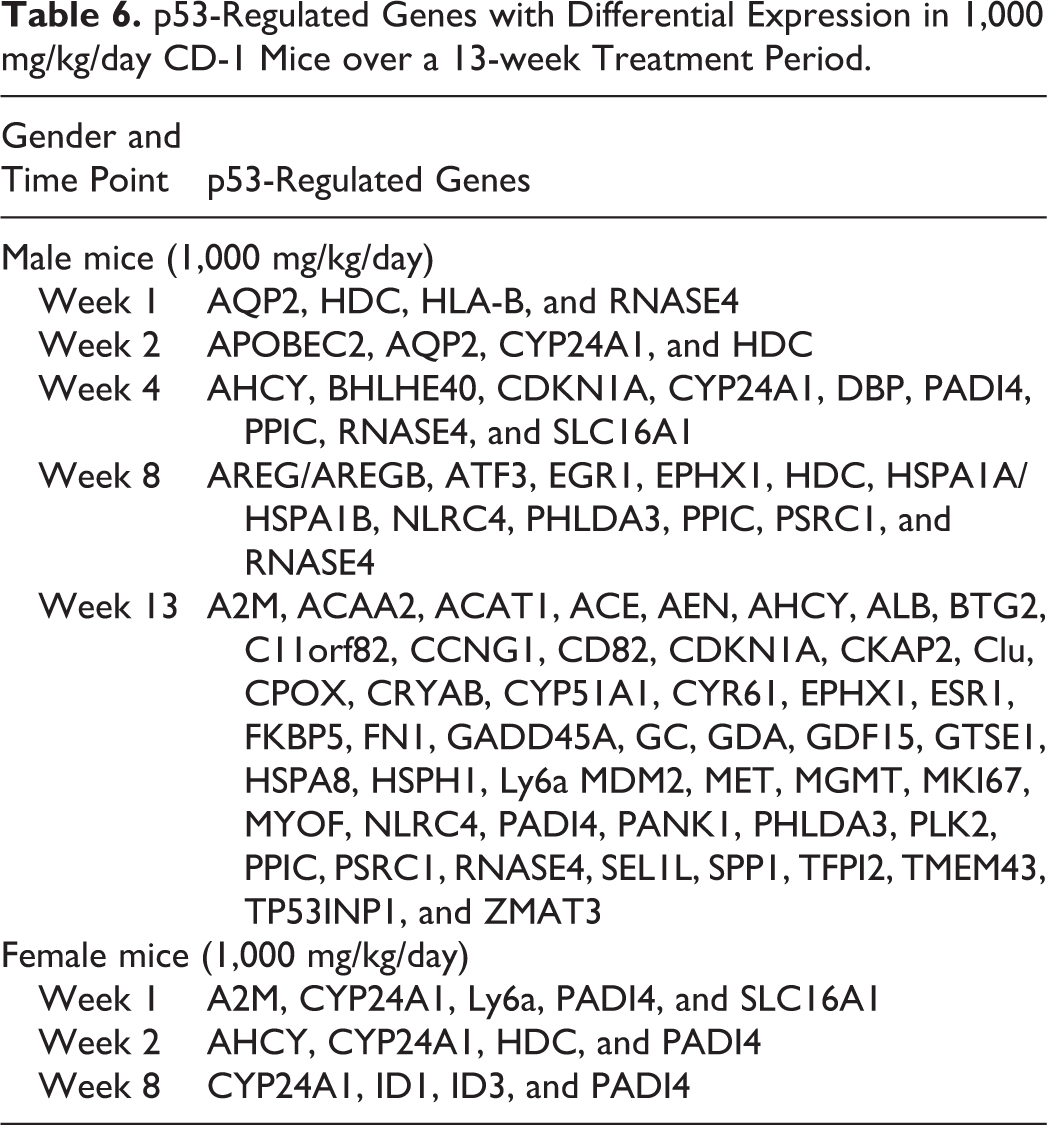
Starting at week 8, the number of genes with significant treatment-related expression changes increased dramatically to week 13 (Table 4; Online Supplemental Table 6). These treatment-related gene expression increases in male mice were not observed in 1,000 mg/kg/day female mice (Online Supplemental Table 6). Consistent with pathologic observations of increased mitoses, the tumor protein 53–regulated cell cycle gene and cyclin-dependent kinase inhibitor1 (CDKN1A) were upregulated in 1,000 mg/kg/day males as early as week 4. The number of p53-regulated genes showing treatment-related changes in 1,000 mg/kg/day male mice was further increased at weeks 8 and 13 (Table 6). These included upregulation of amphiregulin, activating transcription factor 3, microsomal epoxide hydrolase 1 (EPHX1), heat shock protein (HSPA1A and HSPA1B), pleckstrin homology-like domain A3 (PHLDA3), and proline/serine-rich coiled-coil 1 (PSRC1) at week 8 and cell cycle (CDKN1A, GDF15, Trp53inp1, and BTG2) and cell proliferation (MDM2, EPHX1, MKI67, and Nek6) genes at week 13.
p53-Regulated Genes with Differential Expression in 1,000 mg/kg/day CD-1 Mice over a 13-week Treatment Period.
Genes involved in cytoskeleton structure and cell adhesion showed expression changes in 1,000 mg/kg/day males at week 13, reflected by increased expression of Tubb2a, Ckap2, Nef1, GDF15, and Mybpc2 and decreased expression of Kif20b, Gas2, and Vill (Online Supplemental Table 6). Genes related to fibrosis and cystogenesis (C3, Sulf2, Ltbp2, Col19a1, Sulf2, and Ltbp2 are transforming growth factor-β1 [TGF-β1] signaling-related genes) showed changed expression in 1,000 mg/kg/day males at week 13. TGF-β1 signaling has been implicated in the onset and progression of renal fibrosis and diabetic nephropathy (Reeves and Andreoli 2000). Other upregulated genes in 1,000 mg/kg/day male mice at week 13 included LCN2 which is related to oxidative stress, renal injury marker Havcr1 (Kim1) and Ltbp2, and the cell proliferation marker Mki67. These expression changes were not observed in 1,000 mg/kg/day female mice. There was no evidence of treatment-related changes in DNA damage/repair pathway genes including BER pathway genes (XRCC1, ADPRT, APEX1, OGG1, LIG3, and MUTYH) from renal transcriptome analysis (data not shown).
Discussion
A 13-week CD-1 mouse renal investigative pathogenesis and gene expression study (100, 300, and 1,000 mg/kg/day) was conducted with empagliflozin to extend previous data by further defining the time course of development of relevant renal tubular lesions which precede renal tumors observed in the mouse 2-year carcinogenicity study (Bogdanffy et al. 2014). The temporal relationship between renal microscopic findings and gene expression changes is summarized in Table 7.
Summary of the Temporal Relationship between Renal Microscopic Findings and Gene Expression Changes.
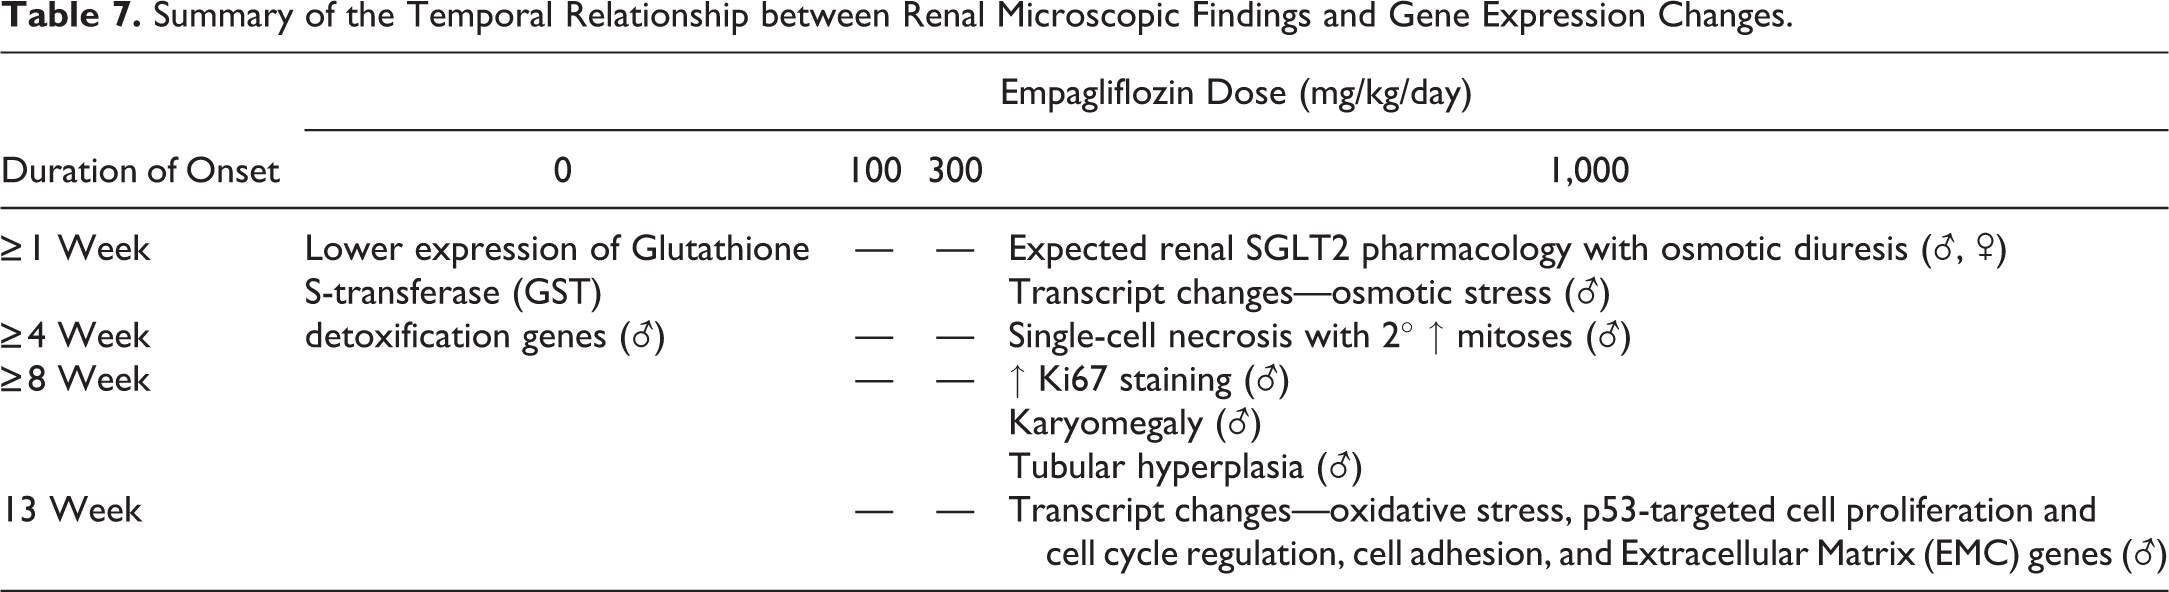
The maximum expected pharmacology with secondary osmotic diuresis was observed by week 1 at ≥100 mg/kg/day in both genders, supporting the suprapharmacologic nature of the toxicology dose range studied. This consisted of increased (200- to 2,900-fold control) glucose excretion, increased (<3-fold control) urine volume, increased (<60% above control) urine osmolality, and increased (<164% above control) electrolytes excretion including calcium. Gene expression changes associated with cellular responses to osmotic stress were differentially regulated within the first few weeks of empagliflozin treatment in male mice. This was reflected by increased expression in genes related to osmolarity and urine transport in the 1,000 mg/kg/day male animals. Slc6a12 and betaine-gamma-aminobutyric acid (GABA) transporter showed increased expression compared to the vehicle control group at weeks 1 and 2. Betaine-GABA transporter is considered as a protector against osmolarity changes in kidney (Kempson and Montrose 2004; Handler and Kwon 1996). Water channel protein AQP2 was also upregulated at weeks 1 and 2. AQP2 is critical for a rapid activation of regulatory volume decrease mechanisms (Ford et al. 2005). Another upregulated transporter at week 2 was Slc14A2 which is a known urea transporter in kidney. Although the direct roles of these transporters in renal function related to SGLT2 inhibition are unclear, upregulation of these genes suggests an increased urine osmotic regulation in the male CD-1 mouse in response to the osmotic stress caused by SGLT2 inhibition.
Results of transcript analysis of the CD-1 mouse kidney also showed gender-biased baseline (0 mg/kg/day animals) renal expression of metabolism enzymes and transporters as well as lower expression of glutathione-mediated detoxification genes in the male mouse (unpublished data). The administration of empagliflozin further altered transcription of genes involved in glutathione metabolism and oxidative responses. Aldh1a1 upregulation was noted in 1,000 mg/kg/day male mice as early as week 1. The upregulation of Aldh1a1 was also observed in female CD-1 mice but to a lesser extent compared with male CD-1 mice. At week 2, two cytochrome p450 genes, Cyp4a14 and Cyp4a31, showed increased expression in 1,000 mg/kg/day male mice. Both Cyp4a14 and Cyp4a31 are PPAR α responsive genes, possibly involved in lipid homeostasis and oxidative stress response (Bumpus and Johnson 2011).
There were no corresponding changes in serum chemistry or urinalysis parameters indicative of any physiologically meaningful effect on renal function and thus these findings were not considered to be adverse. Variable increases in blood urea nitrogen and several urine renal biomarkers (cystatin C, Neutrophil gelatinase-associated lipocalin [NGAL], clusterin, albumin, and Kidney Injury Molecule-1 [KIM-1]) in either one or both genders were also noted primarily at doses ≥300 mg/kg/day (in mice) starting at week 1. Several urinary proteins, predominantly originating from glomerular filtrate, have previously been shown to increase with diuresis and are attributed to increased urinary output (Lina et al. 1996; Kutina, Zakharov and Natochin 2008). The osmotic diuresis and associated increase in urinary albumin seen in the present study are consistent with the previously described urinary protein increases. Urinary increases in tubular proteins (KIM-1, NGAL, and clusterin) were considered to be secondary to osmotic diuresis (pronounced glucosuria is often associated with proteinuria; Abrass 1984) as well as due to adaptive cycles of degeneration/regeneration. Decreased plasma PTH (44% to 81% below control at week 13) was noted in the 13-week mouse study at doses ≥100 mg/kg/day in both genders, paralleling empagliflozin exposure. This PTH response, along with increases in urinary calcium excretion at doses ≥100 mg/kg/day, provides evidence of some disruption in calcium homeostasis associated with empagliflozin treatment, but this response is not gender specific. Together, the combined stress of osmotic diuresis and subsequent adaptive response is thought to contribute to the nongenotoxic mechanism of carcinogenicity.
Macroscopic observations consisting of gaseous distention of the cecum were seen at necropsy in males and females, given 1,000 mg/kg/day. Although empagliflozin has a higher selectivity for SGLT2, high doses of SGLT2 inhibitors may overcome the selectivity and inhibit intestinal SGLT1, which results in carbohydrate malabsorption (Grempler et al. 2012). Therefore, observations of gaseous distention of the cecum were considered related to empagliflozin administration due to anticipated off-target inhibition of SGLT1 in the intestines at these dose levels (Grempler et al. 2012). SGLT1 is the major glucose transporter responsible for the absorption of glucose in the small intestine. Decreased small intestinal glucose absorption yields increased intraluminal glucose concentration, which promotes bacterial fermentation and gas production (Tirmenstein et al. 2013) leading to distention of the intestinal tract.
Microscopic kidney changes in this 13-week mouse pathogenesis study demonstrated consistent changes earlier than 13 weeks and only in high dose (1,000 mg/kg/day) males and corroborated findings from a previous 13-week mouse study (Bogdanffy et al. 2014). Single-cell necrosis and increased mitoses were evident by week 4 of treatment. Tubular epithelial karyomegaly, increased tubular hyperplasia, and increased Ki67 staining were evident by week 8 of treatment. The results of the Ki-67 immunostaining evaluation, in conjunction with the upregulation of cell cycle genes (CDKN1A, GDF15, Trp53inp1, and BTG2) and cell proliferation genes (MDM2, EPHX1, MKI67, and Nek6) at week 13 in 1,000 mg/kg/day males, provided additional evidence for dose-dependent regenerative responses. Up to 13 weeks, these renal changes remain largely minimal to mild, reflecting the subtle and focal to multifocal nature of lesions observed up to the 13-week time point.
Tubular epithelial karyomegaly, characterized by nuclear enlargement, has been demonstrated for nongenotoxic nephrotoxicants, including those that induce tumors through a sustained cytotoxicity/cell regeneration mode of action (Lock and Hard 2004). Enlarged nuclei in foci are an indicator of cells actively progressing through the cell cycle and signifying the presence of sustained renal tubule cytotoxicity and compensatory regeneration (Hard, Boorman and Wolf 2000). Tubular epithelial karyomegaly is presumed to represent repeated nucleic acid replication without nuclear divisions or cytokinesis (Frazier et al. 2012). For nongenotoxic nephrotoxicants, tubular epithelial karyomegaly appears to be a marker of long-standing cell injury and is generally not considered a preneoplastic lesion and its relationship to carcinogenicity is uncertain (Frazier and Seely 2013).
Transcript analysis further supported that the administration of empagliflozin for 13 weeks changed transcript levels of genes related to renal development and function, cell cycle regulation, cell proliferation, cell to cell signaling, cell adhesion, and cytoskeleton in 1,000 mg/kg/day male mice specifically when compared to vehicle controls. The treatment-related renal expression changes after 4 weeks dosing were consistent with the previously published nephrotoxicants (Kharasch et al. 2006; Dieterich et al. 2009), where the complement and inflammatory pathways were activated followed by induction of kidney injury markers in 8 and 13 weeks after dosing. In contrast to males, treatment-related renal expression changes were less apparent in female mice. In addition, our study showed that at earlier time points, weeks 1 and 2 postdosing, increased expression of osmolarity regulating genes such as solute carrier family transporters, aquaporins, and cytochrome P450 genes were observed. These expression changes were hypothesized to have occurred due to activation of feedback mechanism to suppress increased oxidative stress induced by the SGLT2 inhibition in the proximal convoluted tubules. Male mouse treatment-related changes in genes and pathways related to p53-regulated cell cycle and proliferation, TGF β signaling, oxidative stress, and renal injury were observed at weeks 8 and 13. The number of genes with significant expression change dramatically increased at week 13, consistent with the increased appearance of degenerative/regenerative renal tubular changes only in 1,000 mg/kg/day male mice. These transcriptional responses are believed to reflect oxidative stress, attributable to a predominant oxidative pathway of empagliflozin and additional oxidative burden contributed by the M466/2-derived 4-hydroxycrotonaldehyde (4-OH CTA) pathway only in the male mouse (Taub et al. 2015). Consistent with a nongenotoxic tumorigenic mode of action, no empagliflozin-associated renal expression changes in DNA damage/repair pathways were identified. In vitro studies showed that M466/2-derived 4-OH CTA is cytotoxic to mouse primary renal tubular epithelial cells but is not genotoxic (Smith et al. 2017), suggesting that a species-, gender-, and kidney-specific generation of a toxic metabolite (CTA) from empagliflozin may be the primary contributor to the selectivity of empagliflozin-mediated renal toxicity and supports that the renal tumors resulted from a nongenotoxic mechanism.
Additional species and gender-related differences in renal drug metabolism and resistance to oxidative injury may also contribute to the limitation of empagliflozin-mediated nephrotoxicity to male mice. Testosterone-mediated regulation of renal CYP expression (resulting in higher expression and activity in males compared to females) has been demonstrated for many species but is most prominent in rodents, especially mice; furthermore, baseline renal cyp expression is highest in male mice when compared to other common laboratory species including rats (Henderson et al. 1990; Henderson and Wolf 1991; Lohr, Willsky and Acara 1998). This may explain why CTA is only produced by microsomes from male mice. Consistent with the gender- and treatment-related changes in gene expression seen in this study, male animals have been shown to be inherently more susceptible to renal injury secondary to oxidative stress due to testosterone-mediated enhancement of pro-oxidative enzymes and inflammatory cytokines with concurrent inhibition of renal antioxidative pathways, both basal levels and those induced in response to oxidant exposure (Park et al. 2004; Kim et al. 2006; Lohr, Willsky and Acara 1998; Yanes, Sartori-Valinotti and Reckelhoff 2008). Consistent with a nongenotoxic tumorigenic mode of action, no empagliflozin-associated renal expression changes in DNA damage/repair pathways were identified. Repeated dosing with empagliflozin, at suprapharmacologic levels over 13 weeks, demonstrated increased histopathologic evidence of proximal tubule injury (i.e., single-cell necrosis) that is consistent with the proposed cytotoxic effects of M466/2-derived 4-OH CTA exposure. The abundance of M466/2 and degradation to 4-OH CTA is consistent with proximal tubular injury as demonstrated by the single-cell necrosis. Subsequent tubular epithelial karyomegaly, increased tubular hyperplasia, and increased Ki67 staining are consistent with a regenerative response. The histopathology and genomic data, together, suggest that a key event in renal tumorigenesis involves the loss of control of an accelerated pro-proliferative state in 1,000 mg/kg/day male mice under conditions where low renal antioxidant capacity has been exhausted.
In conclusion, administration of empagliflozin (100, 300, and 1,000 mg/kg/day) to CD-1 mice for 13 weeks showed the expected pharmacology with secondary effects of osmotic diuresis in male and female mice at doses ≥100 mg/kg/day. Evidence of gender nonspecific chronic renal pharmacology and disruptions in electrolyte homeostasis at doses ≥100 mg/kg/day in the investigative studies suggest that these pharmacology-related changes may be necessary but not sufficient to lead to the development of renal tumors only in high-dose males. Transcript changes related to renal development and function, cell cycle regulation, cell proliferation, cell to cell signaling, cell adhesion, and cytoskeleton were evident in male 1,000 mg/kg/day mice and most notably at week 13. Microscopic kidney findings, consisting of single-cell necrosis and increased mitoses (starting at week 4) and tubular epithelial karyomegaly, increased tubular hyperplasia, and increased Ki67 staining (starting at week 8), were only seen in 1,000 mg/kg/day males and were consistent with findings observed in longer-term studies with empagliflozin (Bogdanffy et al. 2014). Overall, these mouse investigative study results support the role of early empagliflozin-related degenerative/regenerative changes only observed in high-dose male CD-1 mice as a key contributing feature to a nongenotoxic mode of renal tumor pathogenesis.
Supplemental Material
Supplemental Material, FS1_TPX_10.1177_0192623318784514 - Pathogenesis of Renal Injury and Gene Expression Changes in the Male CD-1 Mouse Associated with Exposure to Empagliflozin
Supplemental Material, FS1_TPX_10.1177_0192623318784514 for Pathogenesis of Renal Injury and Gene Expression Changes in the Male CD-1 Mouse Associated with Exposure to Empagliflozin by Brian Knight, Jing Yuan, Sally Koegler, Parimal Pande, Jennifer Hall, Jon D. Hill, Susan Emeigh Hart, Jonathan A. Phillips, and Warren W. Ku in Toxicologic Pathology
Supplemental Material
Supplemental Material, FS2_TPX_10.1177_0192623318784514 - Pathogenesis of Renal Injury and Gene Expression Changes in the Male CD-1 Mouse Associated with Exposure to Empagliflozin
Supplemental Material, FS2_TPX_10.1177_0192623318784514 for Pathogenesis of Renal Injury and Gene Expression Changes in the Male CD-1 Mouse Associated with Exposure to Empagliflozin by Brian Knight, Jing Yuan, Sally Koegler, Parimal Pande, Jennifer Hall, Jon D. Hill, Susan Emeigh Hart, Jonathan A. Phillips, and Warren W. Ku in Toxicologic Pathology
Supplemental Material
Supplemental Material, FS3_TPX_10.1177_0192623318784514 - Pathogenesis of Renal Injury and Gene Expression Changes in the Male CD-1 Mouse Associated with Exposure to Empagliflozin
Supplemental Material, FS3_TPX_10.1177_0192623318784514 for Pathogenesis of Renal Injury and Gene Expression Changes in the Male CD-1 Mouse Associated with Exposure to Empagliflozin by Brian Knight, Jing Yuan, Sally Koegler, Parimal Pande, Jennifer Hall, Jon D. Hill, Susan Emeigh Hart, Jonathan A. Phillips, and Warren W. Ku in Toxicologic Pathology
Supplemental Material
Supplemental Material, FS4_TPX_10.1177_0192623318784514 - Pathogenesis of Renal Injury and Gene Expression Changes in the Male CD-1 Mouse Associated with Exposure to Empagliflozin
Supplemental Material, FS4_TPX_10.1177_0192623318784514 for Pathogenesis of Renal Injury and Gene Expression Changes in the Male CD-1 Mouse Associated with Exposure to Empagliflozin by Brian Knight, Jing Yuan, Sally Koegler, Parimal Pande, Jennifer Hall, Jon D. Hill, Susan Emeigh Hart, Jonathan A. Phillips, and Warren W. Ku in Toxicologic Pathology
Supplemental Material
Supplemental Material, FS5_TPX_10.1177_0192623318784514 - Pathogenesis of Renal Injury and Gene Expression Changes in the Male CD-1 Mouse Associated with Exposure to Empagliflozin
Supplemental Material, FS5_TPX_10.1177_0192623318784514 for Pathogenesis of Renal Injury and Gene Expression Changes in the Male CD-1 Mouse Associated with Exposure to Empagliflozin by Brian Knight, Jing Yuan, Sally Koegler, Parimal Pande, Jennifer Hall, Jon D. Hill, Susan Emeigh Hart, Jonathan A. Phillips, and Warren W. Ku in Toxicologic Pathology
Supplemental Material
Supplemental Material, FS6_TPX_10.1177_0192623318784514 - Pathogenesis of Renal Injury and Gene Expression Changes in the Male CD-1 Mouse Associated with Exposure to Empagliflozin
Supplemental Material, FS6_TPX_10.1177_0192623318784514 for Pathogenesis of Renal Injury and Gene Expression Changes in the Male CD-1 Mouse Associated with Exposure to Empagliflozin by Brian Knight, Jing Yuan, Sally Koegler, Parimal Pande, Jennifer Hall, Jon D. Hill, Susan Emeigh Hart, Jonathan A. Phillips, and Warren W. Ku in Toxicologic Pathology
Supplemental Material
Supplemental Material, FS7_TPX_10.1177_0192623318784514 - Pathogenesis of Renal Injury and Gene Expression Changes in the Male CD-1 Mouse Associated with Exposure to Empagliflozin
Supplemental Material, FS7_TPX_10.1177_0192623318784514 for Pathogenesis of Renal Injury and Gene Expression Changes in the Male CD-1 Mouse Associated with Exposure to Empagliflozin by Brian Knight, Jing Yuan, Sally Koegler, Parimal Pande, Jennifer Hall, Jon D. Hill, Susan Emeigh Hart, Jonathan A. Phillips, and Warren W. Ku in Toxicologic Pathology
Supplemental Material
Supplemental Material, TS1_TPX_10.1177_0192623318784514 - Pathogenesis of Renal Injury and Gene Expression Changes in the Male CD-1 Mouse Associated with Exposure to Empagliflozin
Supplemental Material, TS1_TPX_10.1177_0192623318784514 for Pathogenesis of Renal Injury and Gene Expression Changes in the Male CD-1 Mouse Associated with Exposure to Empagliflozin by Brian Knight, Jing Yuan, Sally Koegler, Parimal Pande, Jennifer Hall, Jon D. Hill, Susan Emeigh Hart, Jonathan A. Phillips, and Warren W. Ku in Toxicologic Pathology
Supplemental Material
Supplemental Material, TS2_TPX_10.1177_0192623318784514 - Pathogenesis of Renal Injury and Gene Expression Changes in the Male CD-1 Mouse Associated with Exposure to Empagliflozin
Supplemental Material, TS2_TPX_10.1177_0192623318784514 for Pathogenesis of Renal Injury and Gene Expression Changes in the Male CD-1 Mouse Associated with Exposure to Empagliflozin by Brian Knight, Jing Yuan, Sally Koegler, Parimal Pande, Jennifer Hall, Jon D. Hill, Susan Emeigh Hart, Jonathan A. Phillips, and Warren W. Ku in Toxicologic Pathology
Supplemental Material
Supplemental Material, TS3_TPX_10.1177_0192623318784514 - Pathogenesis of Renal Injury and Gene Expression Changes in the Male CD-1 Mouse Associated with Exposure to Empagliflozin
Supplemental Material, TS3_TPX_10.1177_0192623318784514 for Pathogenesis of Renal Injury and Gene Expression Changes in the Male CD-1 Mouse Associated with Exposure to Empagliflozin by Brian Knight, Jing Yuan, Sally Koegler, Parimal Pande, Jennifer Hall, Jon D. Hill, Susan Emeigh Hart, Jonathan A. Phillips, and Warren W. Ku in Toxicologic Pathology
Supplemental Material
Supplemental Material, TS4_TPX_10.1177_0192623318784514 - Pathogenesis of Renal Injury and Gene Expression Changes in the Male CD-1 Mouse Associated with Exposure to Empagliflozin
Supplemental Material, TS4_TPX_10.1177_0192623318784514 for Pathogenesis of Renal Injury and Gene Expression Changes in the Male CD-1 Mouse Associated with Exposure to Empagliflozin by Brian Knight, Jing Yuan, Sally Koegler, Parimal Pande, Jennifer Hall, Jon D. Hill, Susan Emeigh Hart, Jonathan A. Phillips, and Warren W. Ku in Toxicologic Pathology
Supplemental Material
Supplemental Material, TS5_TPX_10.1177_0192623318784514 - Pathogenesis of Renal Injury and Gene Expression Changes in the Male CD-1 Mouse Associated with Exposure to Empagliflozin
Supplemental Material, TS5_TPX_10.1177_0192623318784514 for Pathogenesis of Renal Injury and Gene Expression Changes in the Male CD-1 Mouse Associated with Exposure to Empagliflozin by Brian Knight, Jing Yuan, Sally Koegler, Parimal Pande, Jennifer Hall, Jon D. Hill, Susan Emeigh Hart, Jonathan A. Phillips, and Warren W. Ku in Toxicologic Pathology
Supplemental Material
Supplemental Material, TS6_TPX_10.1177_0192623318784514 - Pathogenesis of Renal Injury and Gene Expression Changes in the Male CD-1 Mouse Associated with Exposure to Empagliflozin
Supplemental Material, TS6_TPX_10.1177_0192623318784514 for Pathogenesis of Renal Injury and Gene Expression Changes in the Male CD-1 Mouse Associated with Exposure to Empagliflozin by Brian Knight, Jing Yuan, Sally Koegler, Parimal Pande, Jennifer Hall, Jon D. Hill, Susan Emeigh Hart, Jonathan A. Phillips, and Warren W. Ku in Toxicologic Pathology
Footnotes
Author Contributions
Authors contributed to conception or design (BK, JY, PP, JH, JDH, SE, JP, WK); data acquisition, analysis, or interpretation (BK, JY, SK, PP, JH, JDH, SE, JP, WK); drafting the manuscript (BK, JY, SK, PP, JH, JDH, WK); and critically revising the manuscript (BK, JY, SE, JP, WK). All authors gave final approval and agreed to be accountable for all aspects of work in ensuring that questions relating to the accuracy or integrity of any part of the work are appropriately investigated and resolved.
Declaration of Conflicting Interests
The author(s) declared no potential conflicts of interest with respect to the research, authorship, and/or publication of this article.
Funding
The author(s) received no financial support for the research, authorship, and/or publication of this article.
Supplemental Material
Supplemental material for this article is available online.
References
Supplementary Material
Please find the following supplemental material available below.
For Open Access articles published under a Creative Commons License, all supplemental material carries the same license as the article it is associated with.
For non-Open Access articles published, all supplemental material carries a non-exclusive license, and permission requests for re-use of supplemental material or any part of supplemental material shall be sent directly to the copyright owner as specified in the copyright notice associated with the article.